
1
www.adas.co.uk
Integrated pesticide management at the
catchment scale Andreé Carter, Rebecca Humphrey,
Chris Proctor, Paul FoggADAS UK Ltd
F1D1
D3
G1
F2F3
G4
KEY
F: Flume and monitoring point
D: Drain/ditch monitoring point
G: Grab sampling point
2
Whittle Dene Project Background
2001 - Pesticide (IPU) detected in Whittle Burn by Northumbrian Water 2002-2004 - Catchment characterisation (Phase 1) contaminants/ aquatic macro-invertebrates2005- 2007 - Implementation of integrated catchment management plan (Phase 2)
The Whittle Dene project is managed by ADAS with delivery support from University of NewcastleFunded primarily by DefraAdditional support is provided by:EA, Northumbrian Water, NFU, PSD, CPA & UKWIR
Project Partners

3
Drainage in poor repairSilted ditchesSoil compactionSoil erosion
Water quality problemsPesticidesNutrientsPathogensSediment
Septic tank dischargesYard waste
Whittle Dene Project Activities
Catchment characterisation
Baseline Monitoring
Catchment Management options identified
Implementation of management options
Monitoring of effects

4
Underdrainage: Backfill type used in Northumberland and Whittle Dene
Northumberland WD ParishesPERMEABLE FILL TYPE CODES Number % Number %No entry on application form 0 0 0 0 0None used 1 2026 88.6 397 82.0Washed gravel, crushed stone 2 93 4.1 20 4.1Reject gravel 3 3 0.1 2 0.4Clinker 4 0 0.0 0 0Straw 5 0 0.0 0 0Slag 6 0 0.0 0 0Peat or turf 7 163 7.1 64 13.2Hard synthetics e.g. Lytag, Leca 8 0 0.0 0 0Soft synthetics e.g. polystyrene 9 0 0.0 0 0Others 10 2 0.1 1 0.2TOTAL 2287 484
long term average 2003
% of average 2004
% of average 2005
% of average
Jan 61 25 41 94 155 47.8 78Feb 49 22 46 33 67 53.2 109Mar 41 22 53 31 75 53.2 130Apr 44 20 46 76 173 80.4 183May 51 52 101 23 45 29.2 57Jun 48 88 183 82 172 67.6 141Jul 60 11 19 73 122 51.4 86Aug 78 15 19 153 196 31 40Sep 59 40 68 22 38 53.4 91Oct 54 49 91 103 190 95.6 177Nov 70 25 35 27 38 70 100Dec 55 37 68 37 68TOTAL 670 406 61 754 113 632.8 94
Rainfall (mm) Jan 2003 to Nov 2005
5
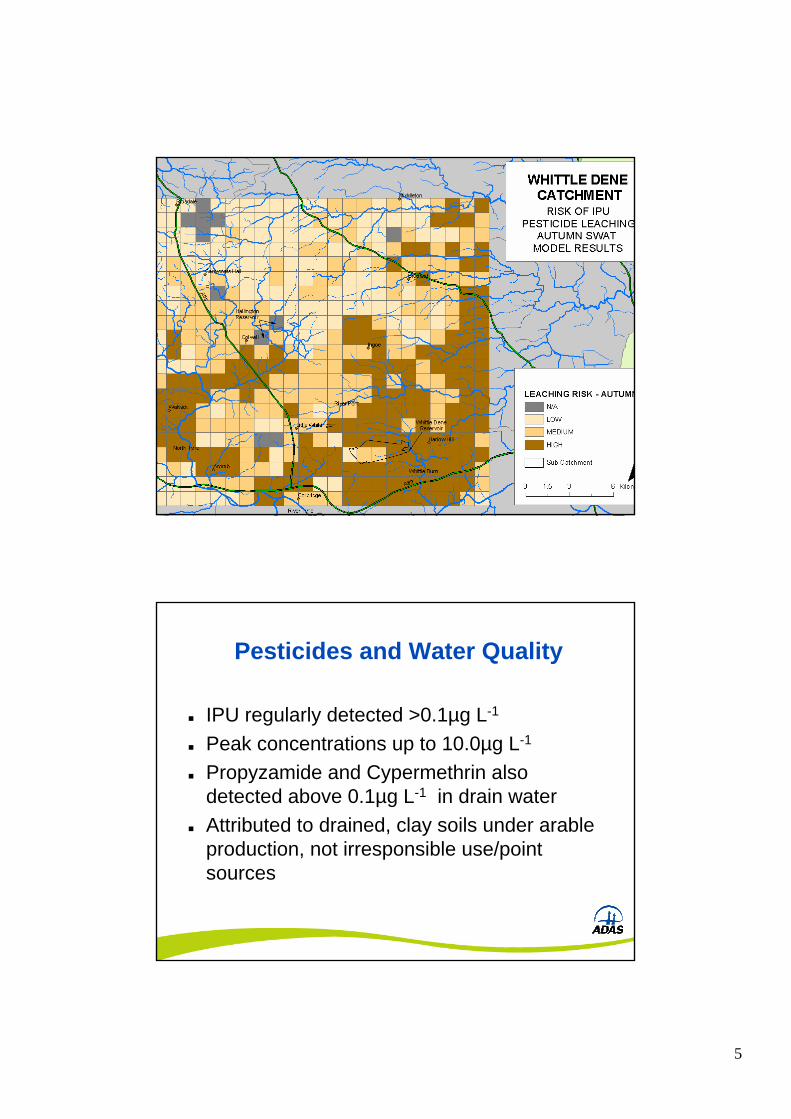
Pesticides and Water Quality
IPU regularly detected >0.1µg L-1
Peak concentrations up to 10.0µg L-1
Propyzamide and Cypermethrin also detected above 0.1µg L-1 in drain waterAttributed to drained, clay soils under arable production, not irresponsible use/point sources

6
Concentrations of IPU (µg L -1)
0.00
1.00
2.00
3.00
4.00
5.00
6.00
7.00
8.00
9/1/02 12/3/02 3/6/03 6/7/03 9/8/03 12/10/03 3/12/04 6/13/04 9/14/04 12/16/04 3/19/05 6/20/05 9/21/05
IPU
(µg/
l)
F1
F2
F3
G1
G2
G3
G4
G5
G6
G7
D1
D2
D3
0.1 ug/lLimit
10.0 ug/L (F1 and D1)
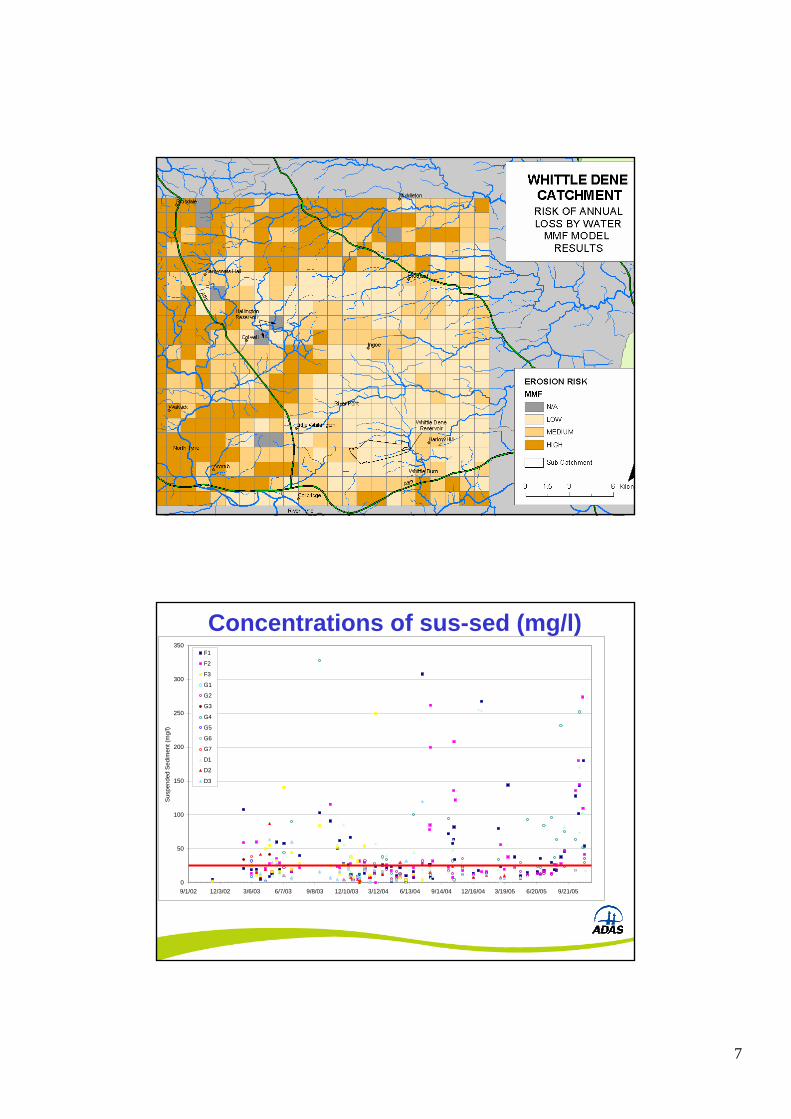
Sediment and Water Quality
Burns (streams) and drains have allegedly silted up quickly in recent yearsSummer storms identified as key to sediment mobilisationLivestock tracks are a key sediment sourceLinks to phosphorus and pesticide transferSmall forestry operation within catchment
7
Concentrations of sus-sed (mg/l)
0
50
100
150
200
250
300
350
9/1/02 12/3/02 3/6/03 6/7/03 9/8/03 12/10/03 3/12/04 6/13/04 9/14/04 12/16/04 3/19/05 6/20/05 9/21/05
Sus
pend
ed S
edim
ent (
mg/
l)
F1
F2
F3
G1
G2
G3
G4
G5
G6
G7
D1
D2
D3
8
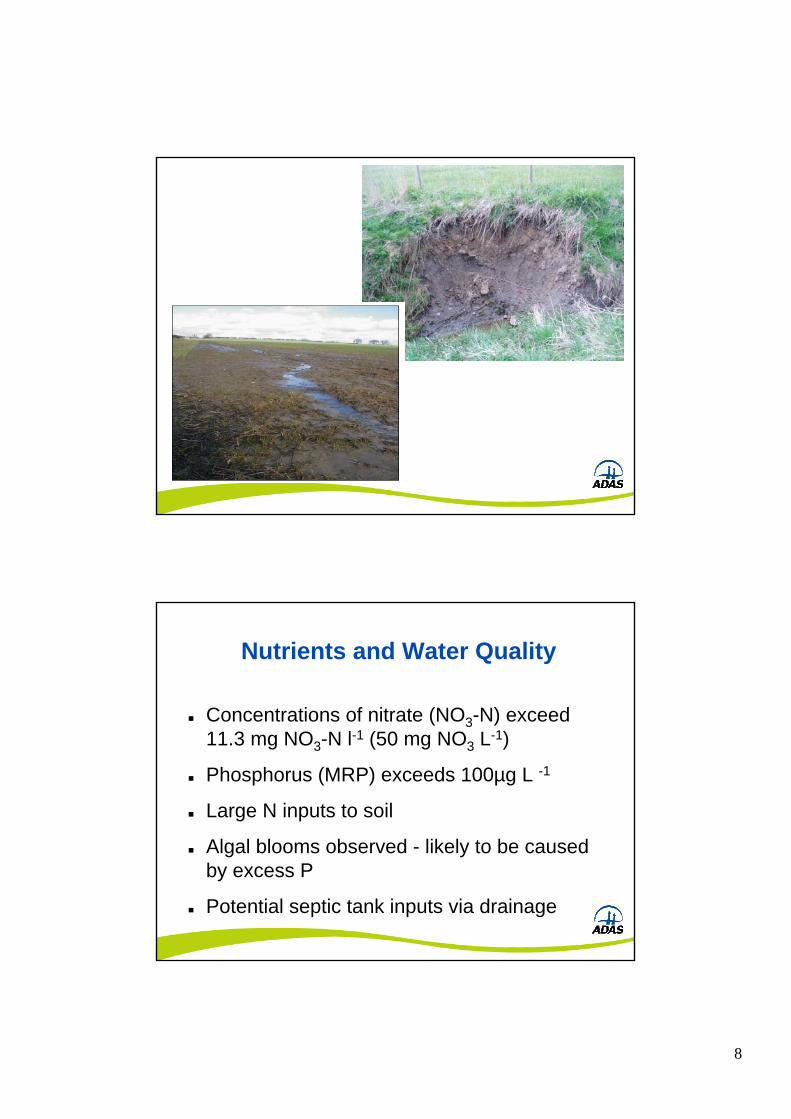
Nutrients and Water Quality
Concentrations of nitrate (NO3-N) exceed 11.3 mg NO3-N l-1 (50 mg NO3 L-1)
Phosphorus (MRP) exceeds 100µg L -1
Large N inputs to soil
Algal blooms observed - likely to be caused by excess P
Potential septic tank inputs via drainage
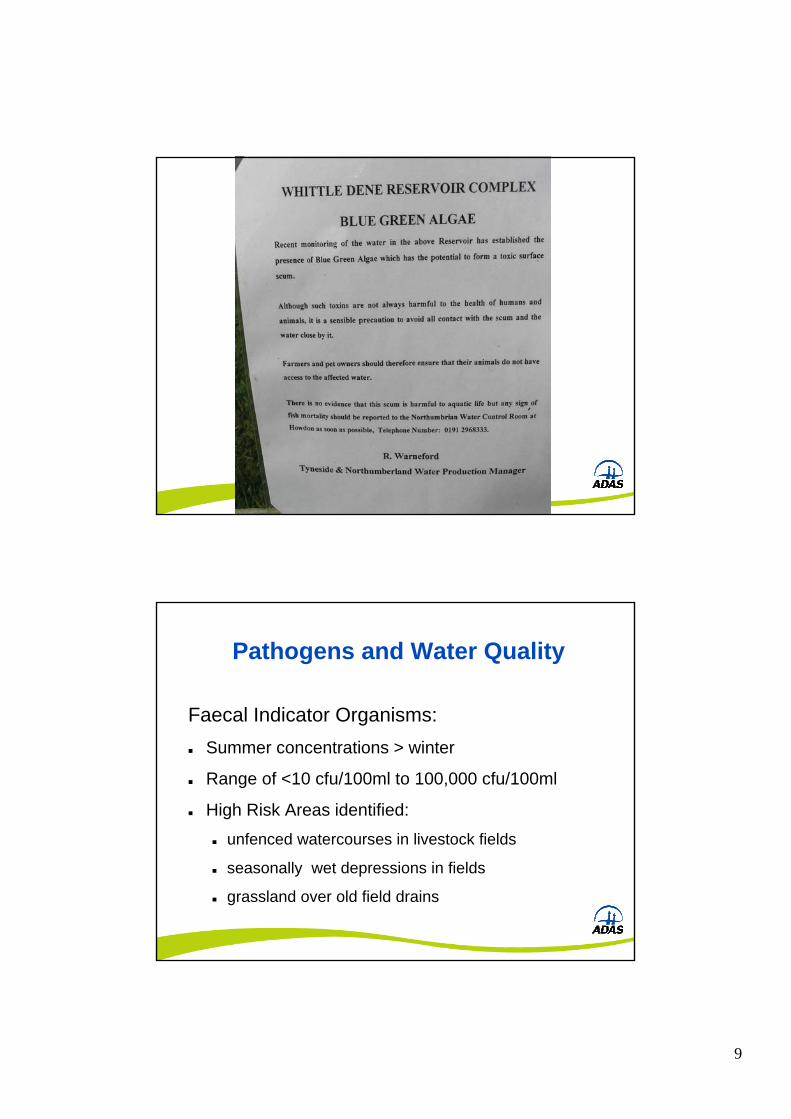
9
Pathogens and Water Quality
Faecal Indicator Organisms:Summer concentrations > winter
Range of <10 cfu/100ml to 100,000 cfu/100ml
High Risk Areas identified:
unfenced watercourses in livestock fields
seasonally wet depressions in fields
grassland over old field drains

10
Concentrations of faecal coliforms(cfu/100ml)
Log
scal
e
1
10
100
1000
10000
100000
1000000
9/1/02 12/3/02 3/6/03 6/7/03 9/8/03 12/10/03 3/12/04 6/13/04 9/14/04 12/16/04 3/19/05 6/20/05 9/21/05
FC (
CFU
/100
ml)
F1
F2
F3
G2
G4
D1
D2
D3
11
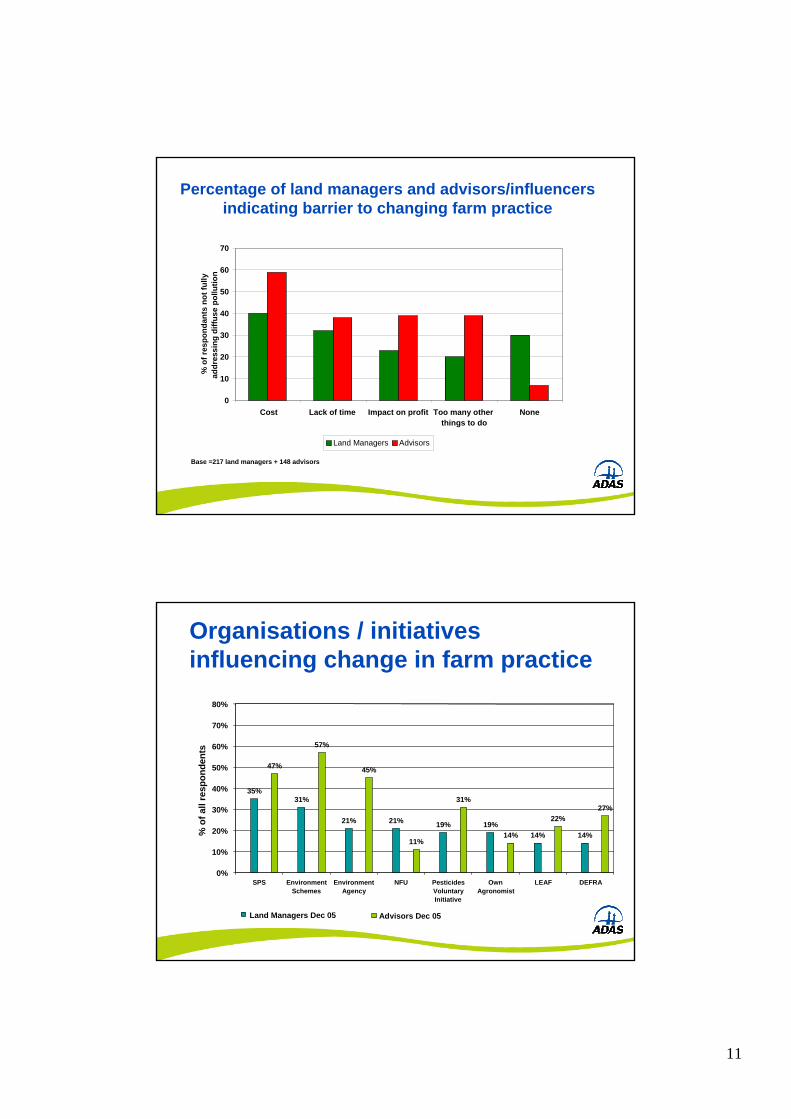
Percentage of land managers and advisors/influencersindicating barrier to changing farm practice
Base =217 land managers + 148 advisors
0
10
20
30
40
50
60
70
Cost Lack of time Impact on profit Too many otherthings to do
None
% o
fres
pond
ants
not f
ully
ad
dres
sing
diff
use
pollu
tion
Land Managers Advisors
35%31%
21% 21% 19% 19%14% 14%
47%
57%
45%
11%
31%
14%
22%27%
0%
10%
20%
30%
40%
50%
60%
70%
80%
SPS EnvironmentSchemes
EnvironmentAgency
NFU PesticidesVoluntaryInitiative
OwnAgronomist
LEAF DEFRA
% o
f all
resp
onde
nts
Land Managers Dec 05 Advisors Dec 05
Organisations / initiatives influencing change in farm practice
12
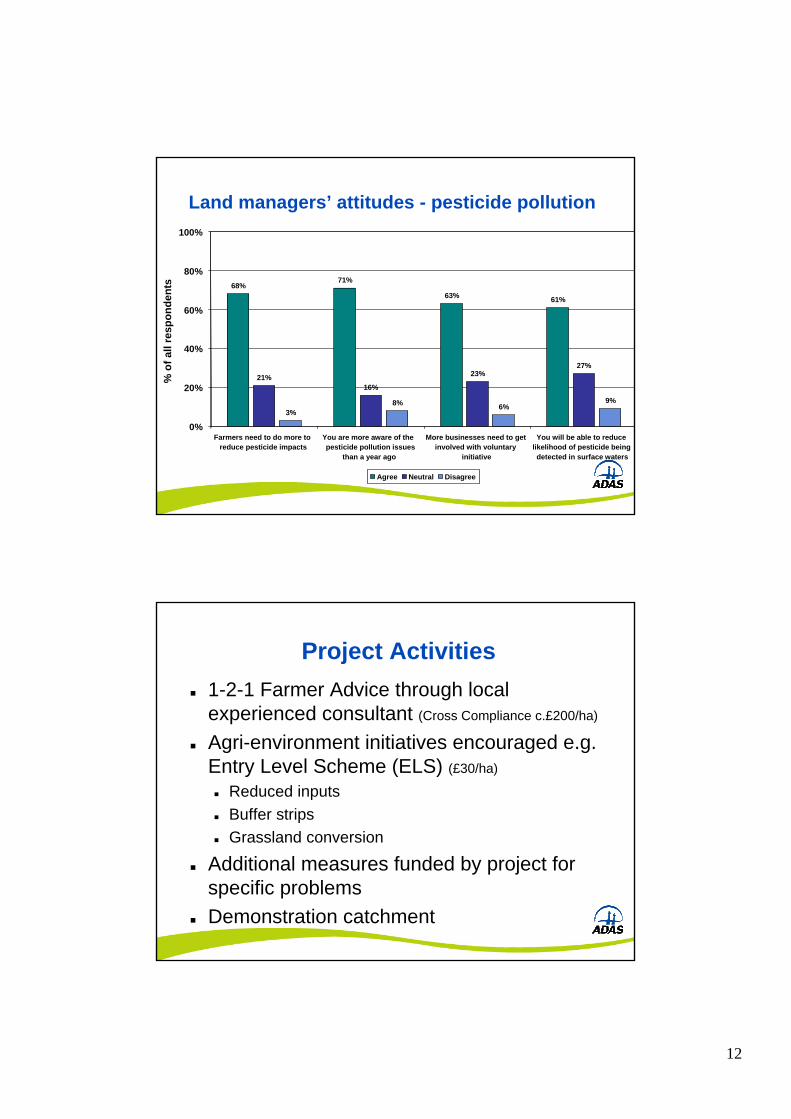
Land managers’ attitudes - pesticide pollution
68%71%
63% 61%
21%16%
23%27%
3%8% 6%
9%
0%
20%
40%
60%
80%
100%
Farmers need to do more toreduce pesticide impacts
You are more aware of thepesticide pollution issues
than a year ago
More businesses need to getinvolved with voluntary
initiative
You will be able to reducelikelihood of pesticide beingdetected in surface waters
% o
f all
resp
onde
nts
Agree Neutral Disagree
Project Activities1-2-1 Farmer Advice through local experienced consultant (Cross Compliance c.£200/ha)
Agri-environment initiatives encouraged e.g. Entry Level Scheme (ELS) (£30/ha)
Reduced inputsBuffer stripsGrassland conversion
Additional measures funded by project for specific problemsDemonstration catchment

13
Additional Management Options
Biobed for pesticide washdown areaPond to intercept drainage water and sediment - farm diversificationLivestock stream fencing - mains fed water troughsFree soil, nutrient & crop protection management plansDrainage remediation and ditch clearance
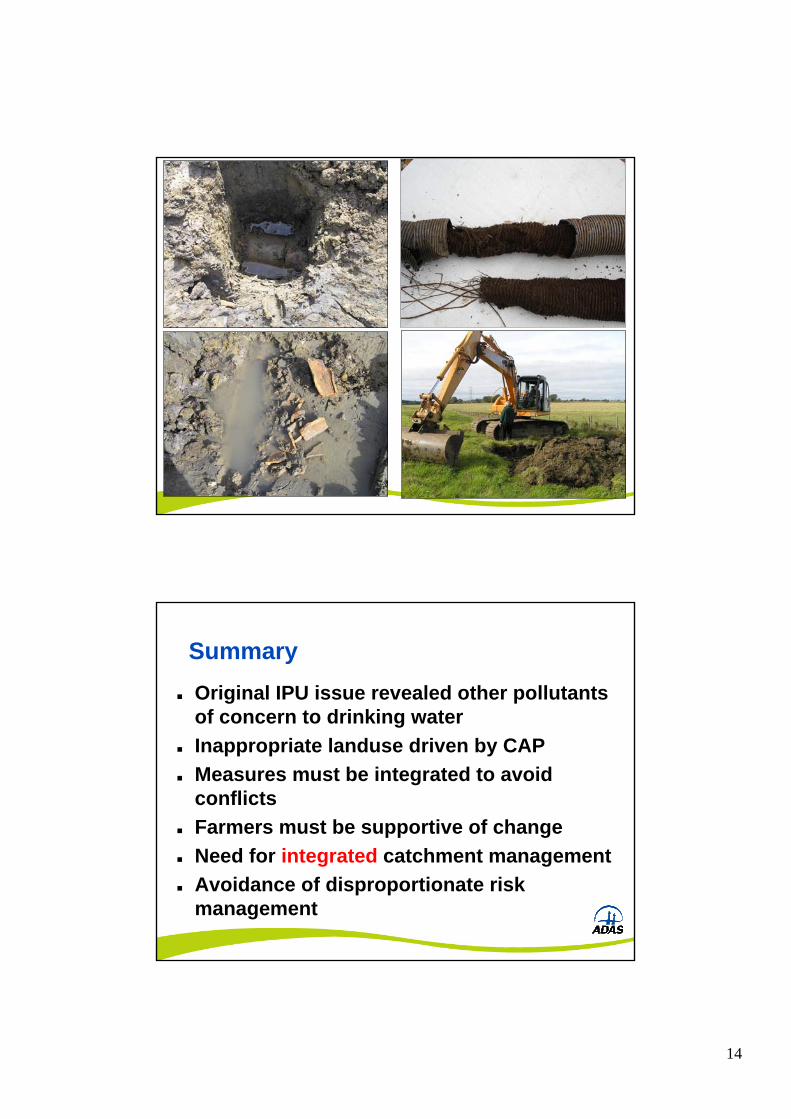
14
SummaryOriginal IPU issue revealed other pollutants of concern to drinking waterInappropriate landuse driven by CAPMeasures must be integrated to avoid conflictsFarmers must be supportive of changeNeed for integrated catchment managementAvoidance of disproportionate risk management


