Interaction of Agriculture and Energyin Global Greenhouse Gas Mitigation Scenarios
Forestry and Agriculture Greenhouse Gas Modeling ForumShepherdstown, West Virginia
September 26-29, 2011
Ron Sands*Economic Research Service, USDA
*The views expressed are the author’s and should not be attributed to the Economic Research Service or USDA
Contributors to FARM Project• ERS Staff
– Ron Sands– Jayson Beckman– Carol Jones
• Cooperative Agreements– GAMS Development Corporation– Brent Sohngen (Ohio State University)
• Ph.D. Students– Sam Evans (Colorado State University)– Shellye Clark (Purdue University)– Xioahui Tian (Ohio State University)
• International Collaborators– Katja Schumacher (Institute for Applied Ecology, Berlin)– Hannah Förster (Institute for Applied Ecology, Berlin)
Overview
• Global Scenarios for Policy Analysis– Representative Concentration Pathways (RCPs)– Current Energy Modeling Forum (EMF) study
• Brief History of Future Agricultural Resources Model (FARM)• Model structure and data
– CGE Framework– GTAP 7 Data and Aggregation
• Sample results (Global electricity generation)• Carbon Dioxide Capture and Storage (CCS)• CCS with bio-electricity• Sample results (US electricity generation)
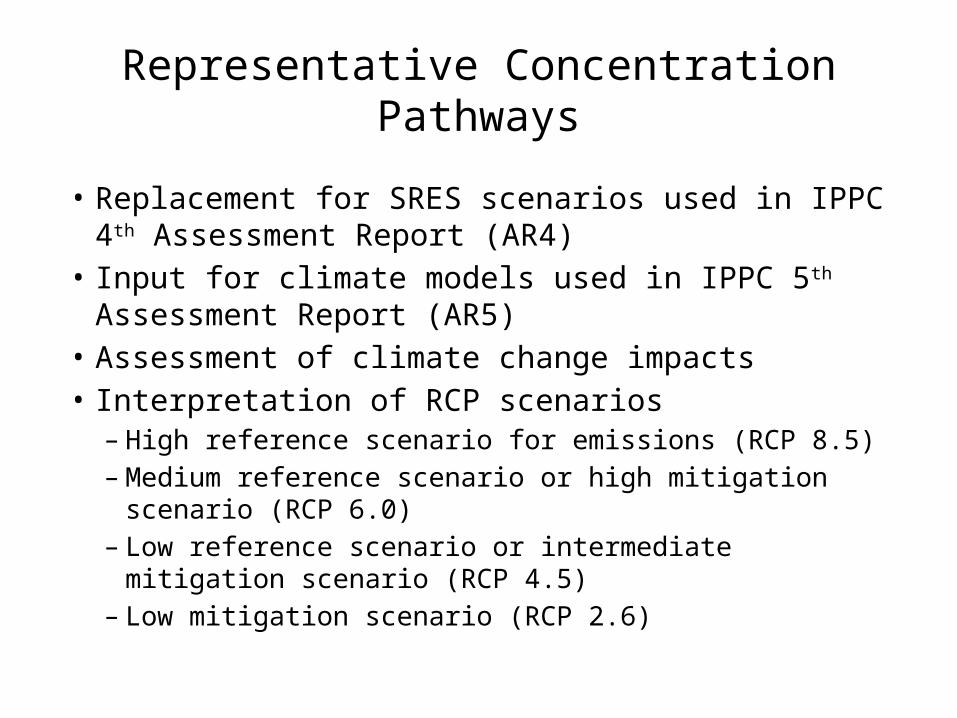
• Replacement for SRES scenarios used in IPPC 4th Assessment Report (AR4)
• Input for climate models used in IPPC 5th Assessment Report (AR5)
• Assessment of climate change impacts• Interpretation of RCP scenarios
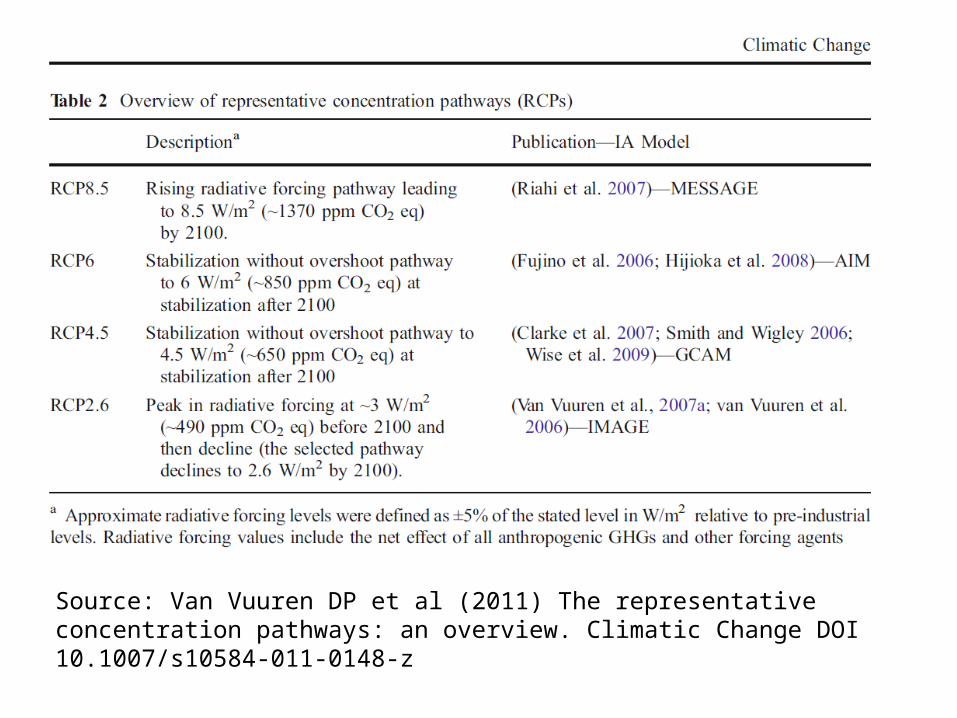
– High reference scenario for emissions (RCP 8.5)– Medium reference scenario or high mitigation scenario (RCP 6.0)– Low reference scenario or intermediate mitigation scenario (RCP
4.5)– Low mitigation scenario (RCP 2.6)
Representative Concentration Pathways
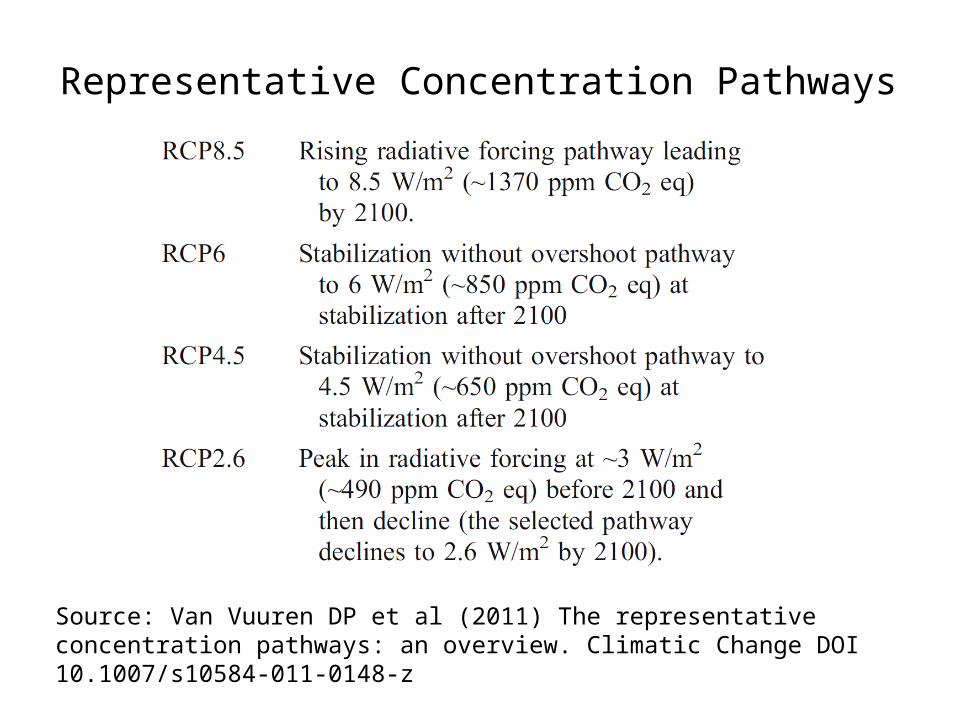
Representative Concentration Pathways
Source: Van Vuuren DP et al (2011) The representative concentration pathways: an overview. Climatic Change DOI 10.1007/s10584-011-0148-z
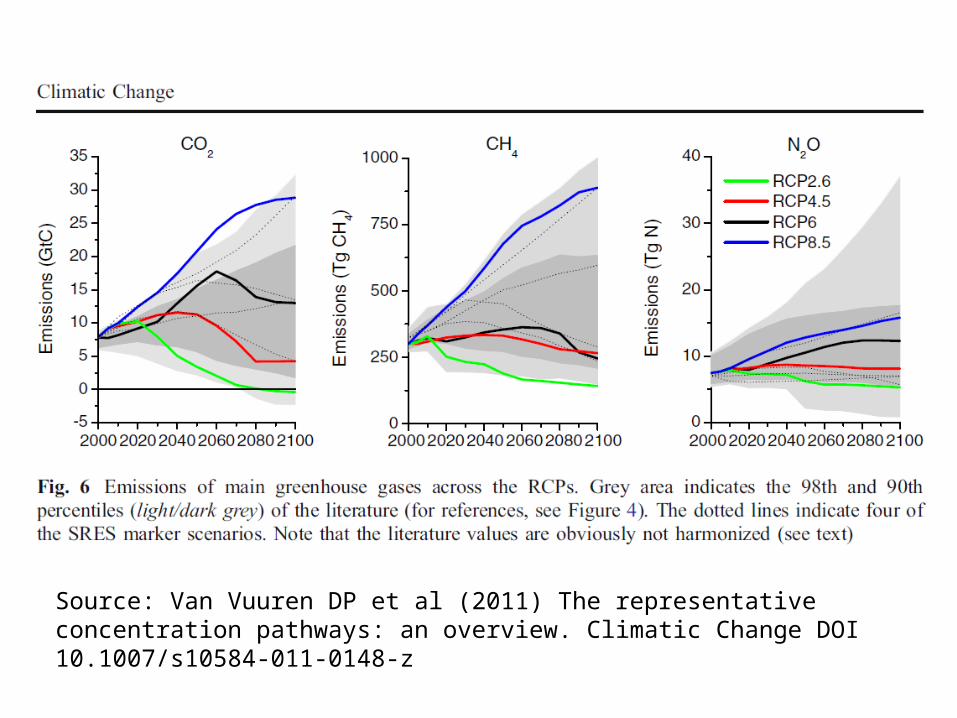
Source: Van Vuuren DP et al (2011) The representative concentration pathways: an overview. Climatic Change DOI 10.1007/s10584-011-0148-z
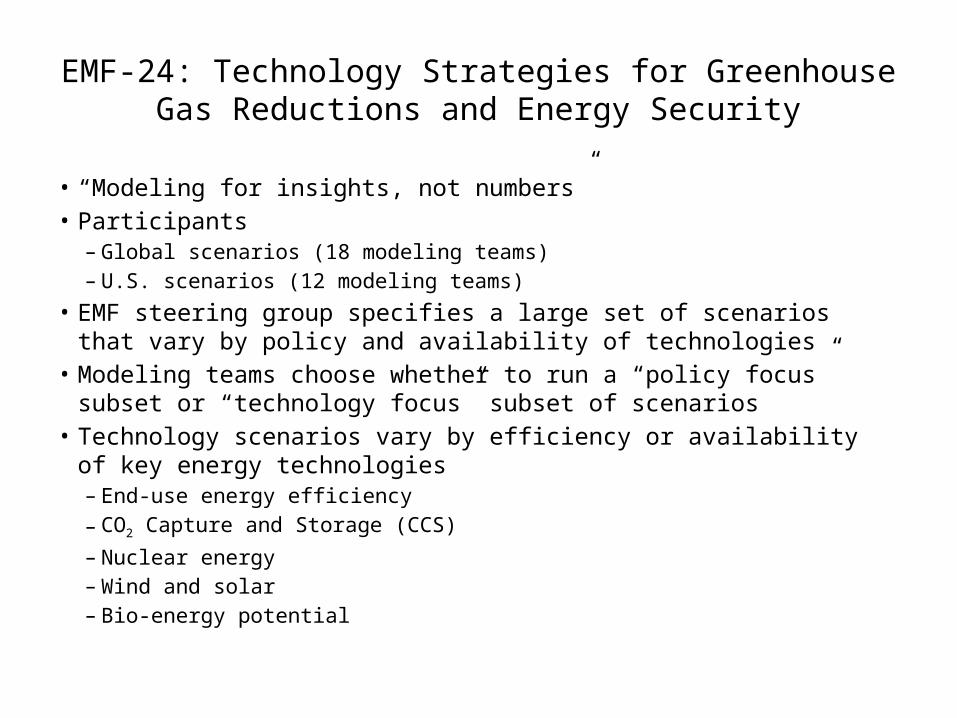
EMF-24: Technology Strategies for Greenhouse Gas Reductions and Energy Security
• “Modeling for insights, not numbers”• Participants
– Global scenarios (18 modeling teams)– U.S. scenarios (12 modeling teams)
• EMF steering group specifies a large set of scenarios that vary by policy and availability of technologies
• Modeling teams choose whether to run a “policy focus” subset or “technology focus” subset of scenarios
• Technology scenarios vary by efficiency or availability of key energy technologies– End-use energy efficiency– CO2 Capture and Storage (CCS)– Nuclear energy– Wind and solar– Bio-energy potential
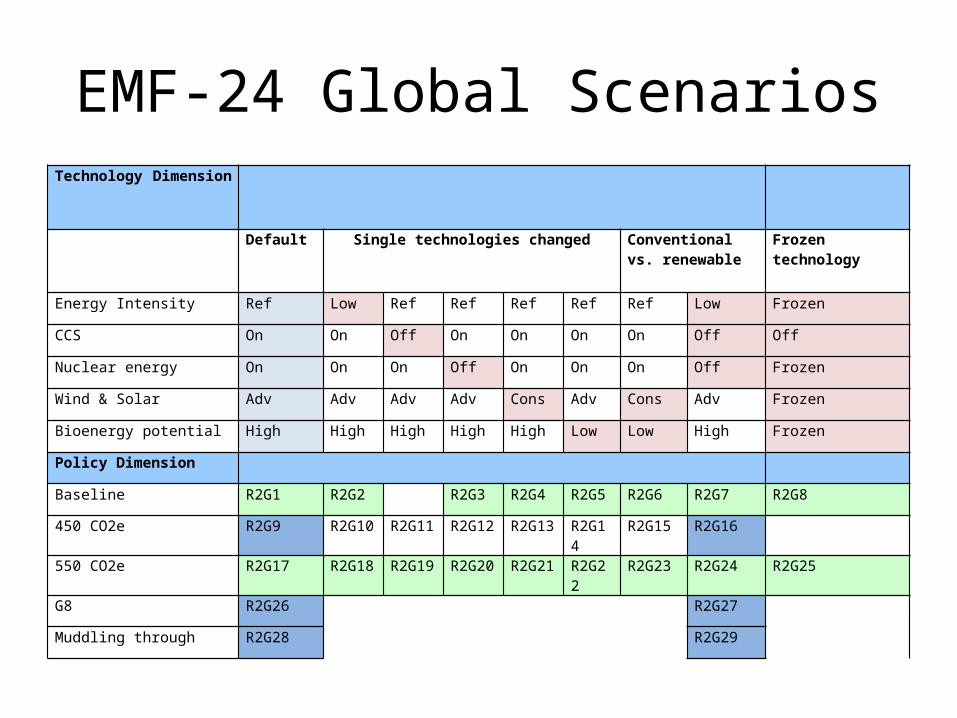
EMF-24 Global ScenariosTechnology Dimension
Default Single technologies changed Conventional vs. renewable
Frozen technology
Energy Intensity Ref Low Ref Ref Ref Ref Ref Low Frozen
CCS On On Off On On On On Off Off
Nuclear energy On On On Off On On On Off Frozen
Wind & Solar Adv Adv Adv Adv Cons Adv Cons Adv Frozen
Bioenergy potential High High High High High Low Low High Frozen
Policy Dimension
Baseline R2G1 R2G2 R2G3 R2G4 R2G5 R2G6 R2G7 R2G8
450 CO2e R2G9 R2G10 R2G11 R2G12 R2G13 R2G14 R2G15 R2G16
550 CO2e R2G17 R2G18 R2G19 R2G20 R2G21 R2G22 R2G23 R2G24 R2G25
G8 R2G26 R2G27
Muddling through R2G28 R2G29
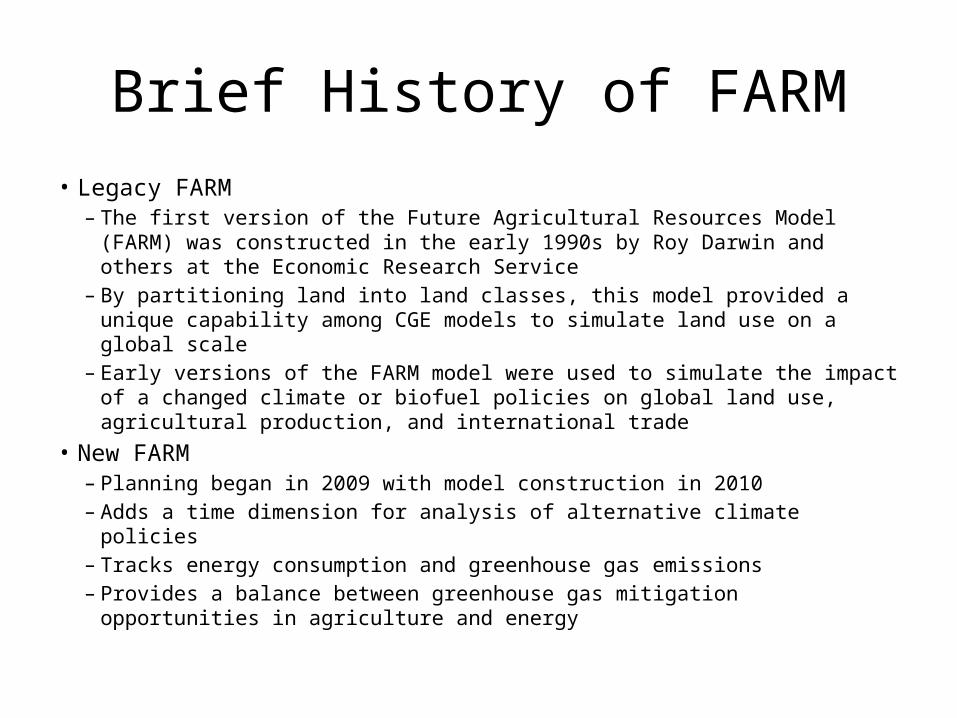
Brief History of FARM• Legacy FARM
– The first version of the Future Agricultural Resources Model (FARM) was constructed in the early 1990s by Roy Darwin and others at the Economic Research Service
– By partitioning land into land classes, this model provided a unique capability among CGE models to simulate land use on a global scale
– Early versions of the FARM model were used to simulate the impact of a changed climate or biofuel policies on global land use, agricultural production, and international trade
• New FARM– Planning began in 2009 with model construction in 2010– Adds a time dimension for analysis of alternative climate policies– Tracks energy consumption and greenhouse gas emissions– Provides a balance between greenhouse gas mitigation opportunities in
agriculture and energy
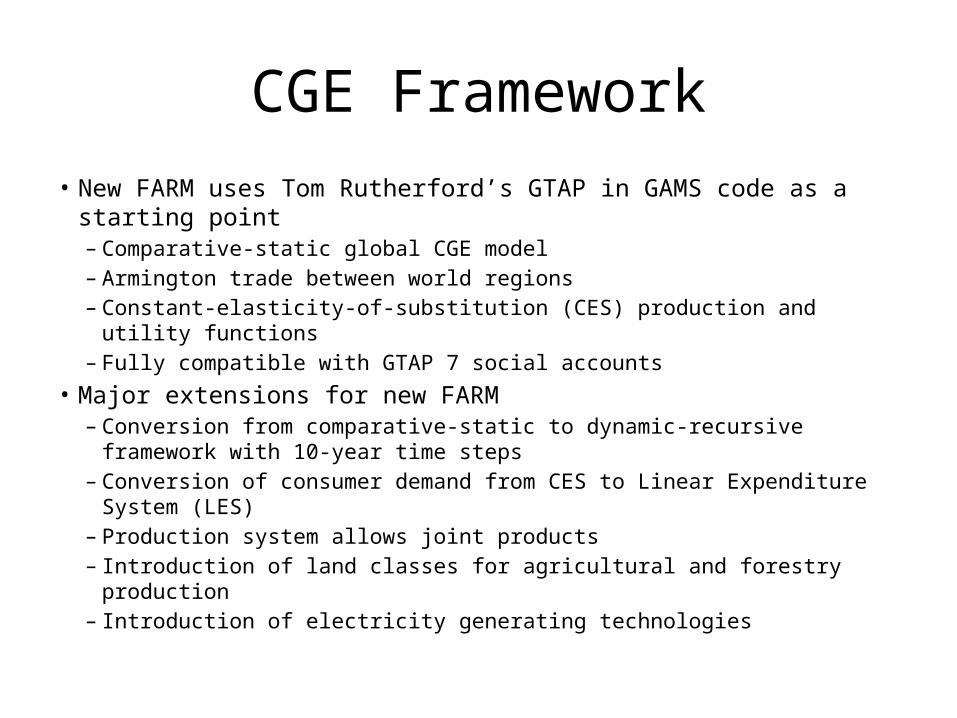
CGE Framework• New FARM uses Tom Rutherford’s GTAP in GAMS code as a starting
point– Comparative-static global CGE model– Armington trade between world regions– Constant-elasticity-of-substitution (CES) production and utility functions– Fully compatible with GTAP 7 social accounts
• Major extensions for new FARM– Conversion from comparative-static to dynamic-recursive framework with
10-year time steps– Conversion of consumer demand from CES to Linear Expenditure System
(LES)– Production system allows joint products– Introduction of land classes for agricultural and forestry production– Introduction of electricity generating technologies
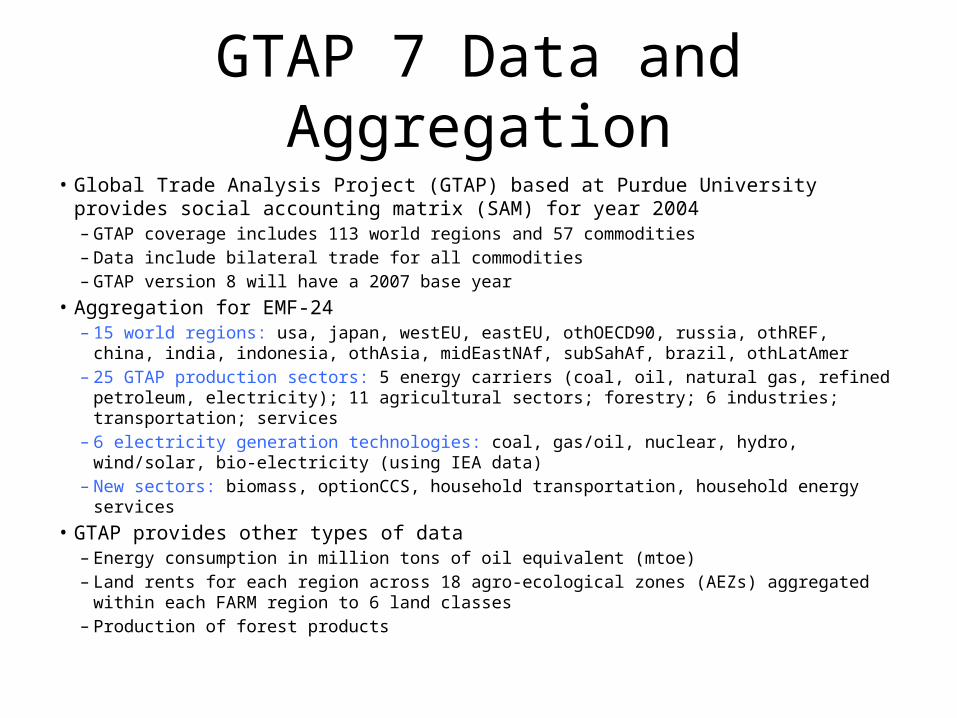
GTAP 7 Data and Aggregation• Global Trade Analysis Project (GTAP) based at Purdue University provides social
accounting matrix (SAM) for year 2004– GTAP coverage includes 113 world regions and 57 commodities– Data include bilateral trade for all commodities– GTAP version 8 will have a 2007 base year
• Aggregation for EMF-24– 15 world regions: usa, japan, westEU, eastEU, othOECD90, russia, othREF, china, india, indonesia,
othAsia, midEastNAf, subSahAf, brazil, othLatAmer– 25 GTAP production sectors: 5 energy carriers (coal, oil, natural gas, refined petroleum,
electricity); 11 agricultural sectors; forestry; 6 industries; transportation; services– 6 electricity generation technologies: coal, gas/oil, nuclear, hydro, wind/solar, bio-electricity (using
IEA data)– New sectors: biomass, optionCCS, household transportation, household energy services
• GTAP provides other types of data– Energy consumption in million tons of oil equivalent (mtoe)– Land rents for each region across 18 agro-ecological zones (AEZs) aggregated within each FARM
region to 6 land classes– Production of forest products
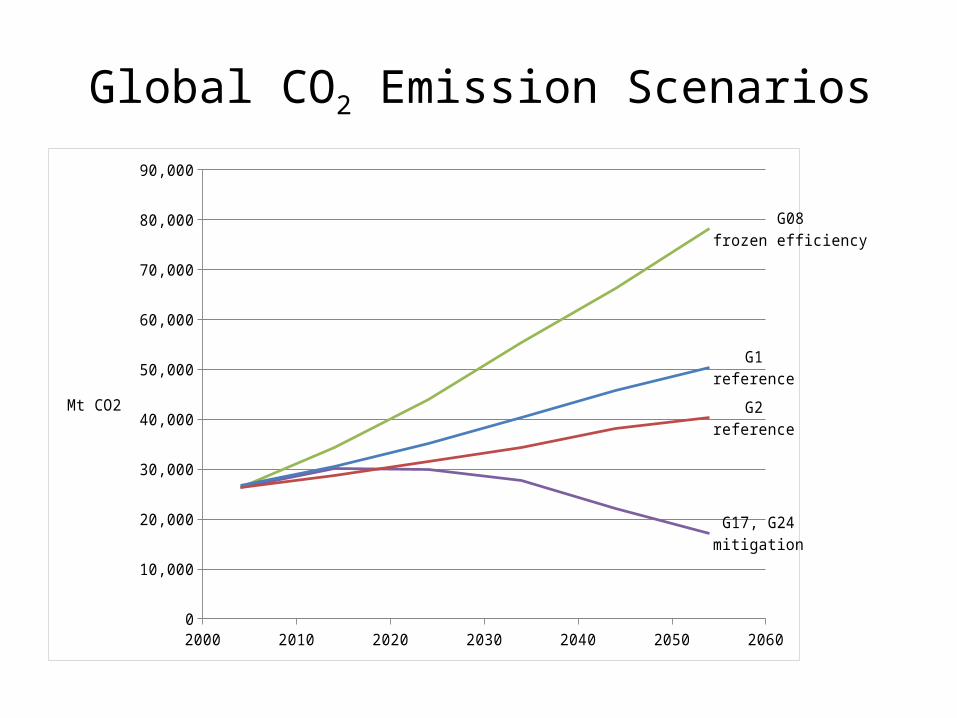
Global CO2 Emission Scenarios
2000 2010 2020 2030 2040 2050 20600
10,000
20,000
30,000
40,000
50,000
60,000
70,000
80,000
90,000
G17, G24mitigation
G08frozen efficiency
G2reference
G1reference
Mt CO2
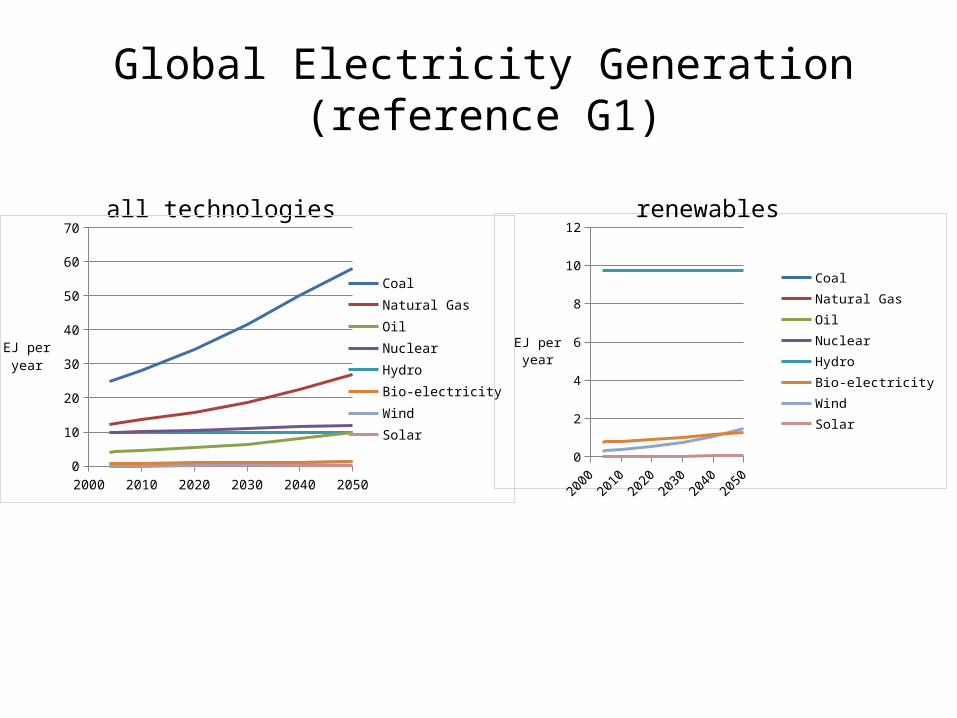
Global Electricity Generation (reference G1)
2000 2010 2020 2030 2040 20500
2
4
6
8
10
12
CoalNatural GasOilNuclearHydroBio-electricityWindSolar
EJ peryear
all technologies renewables
2000 2010 2020 2030 2040 20500
10
20
30
40
50
60
70
CoalNatural GasOilNuclearHydroBio-electricityWindSolar
EJ peryear
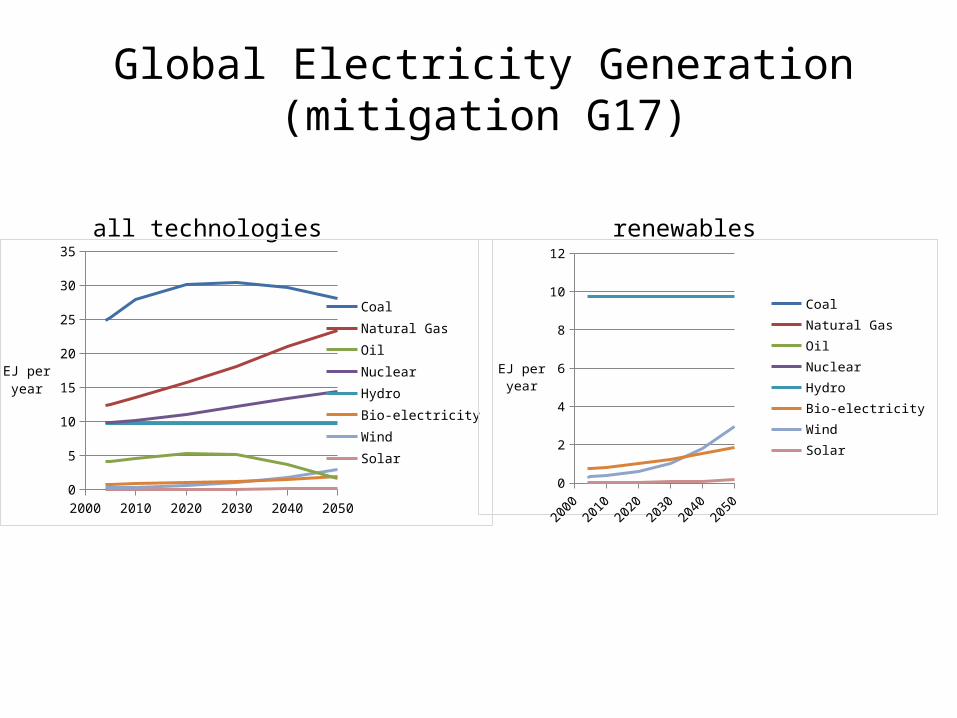
Global Electricity Generation (mitigation G17)
all technologies renewables
2000 2010 2020 2030 2040 20500
5
10
15
20
25
30
35
CoalNatural GasOilNuclearHydroBio-electricityWindSolar
EJ peryear
2000 2010 2020 2030 2040 20500
2
4
6
8
10
12
CoalNatural GasOilNuclearHydroBio-electricityWindSolar
EJ peryear
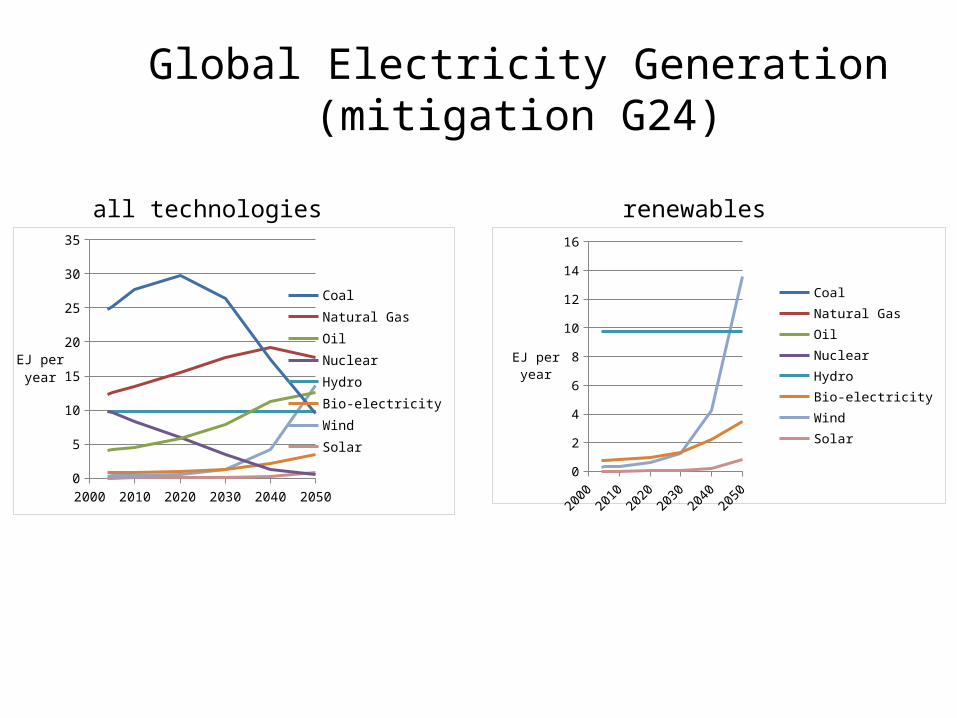
Global Electricity Generation (mitigation G24)
all technologies renewables
2000 2010 2020 2030 2040 20500
5
10
15
20
25
30
35
CoalNatural GasOilNuclearHydroBio-electricityWindSolar
EJ peryear
2000 2010 2020 2030 2040 20500
2
4
6
8
10
12
14
16
CoalNatural GasOilNuclearHydroBio-electricityWindSolar
EJ peryear
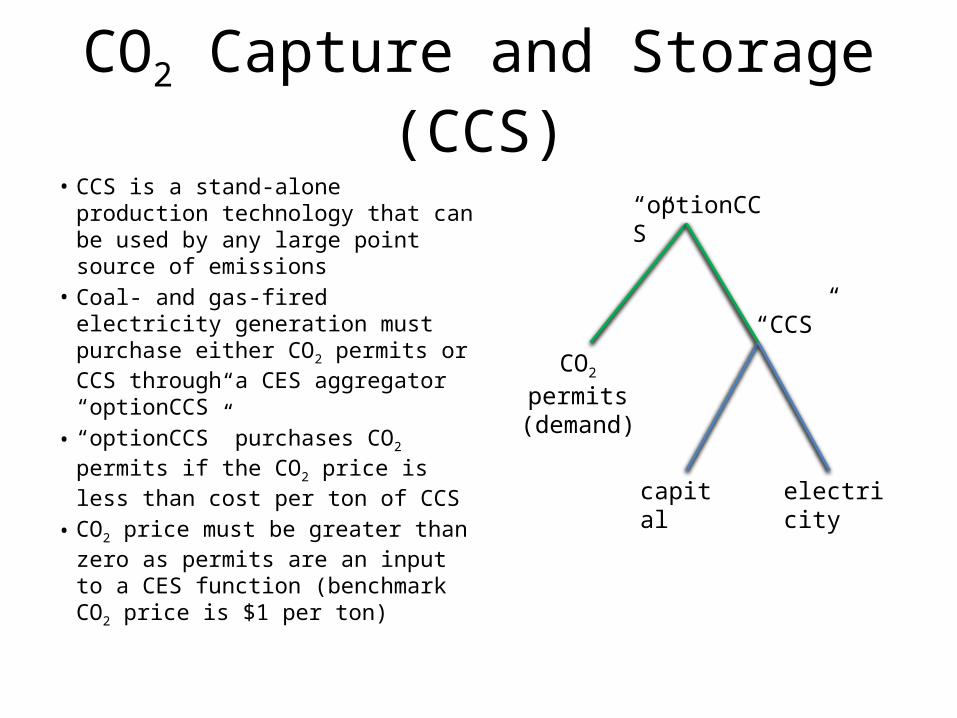
CO2 Capture and Storage (CCS)
• CCS is a stand-alone production technology that can be used by any large point source of emissions
• Coal- and gas-fired electricity generation must purchase either CO2 permits or CCS through a CES aggregator “optionCCS”
• “optionCCS” purchases CO2 permits if the CO2 price is less than cost per ton of CCS
• CO2 price must be greater than zero as permits are an input to a CES function (benchmark CO2 price is $1 per ton)
“optionCCS”
capital
CO2 permits(demand)
electricity
“CCS”
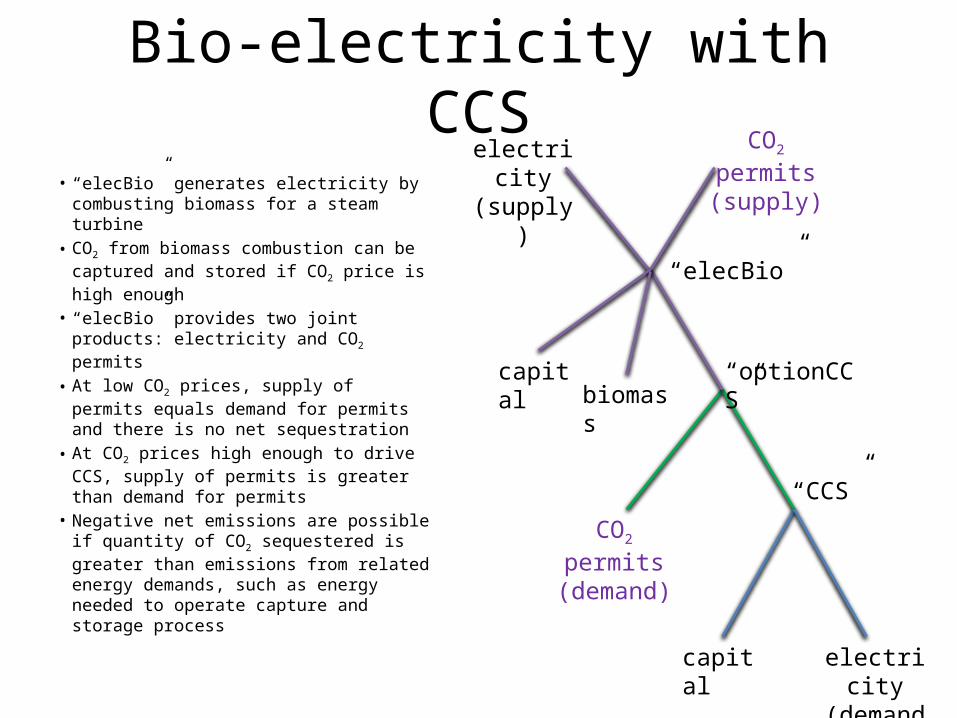
Bio-electricity with CCS
• “elecBio” generates electricity by combusting biomass for a steam turbine
• CO2 from biomass combustion can be captured and stored if CO2 price is high enough
• “elecBio” provides two joint products: electricity and CO2 permits
• At low CO2 prices, supply of permits equals demand for permits and there is no net sequestration
• At CO2 prices high enough to drive CCS, supply of permits is greater than demand for permits
• Negative net emissions are possible if quantity of CO2 sequestered is greater than emissions from related energy demands, such as energy needed to operate capture and storage process
“optionCCS”
capital
CO2 permits(demand)
electricity(demand)
“CCS”
“elecBio”
capital
CO2 permits(supply)
biomass
electricity(supply)
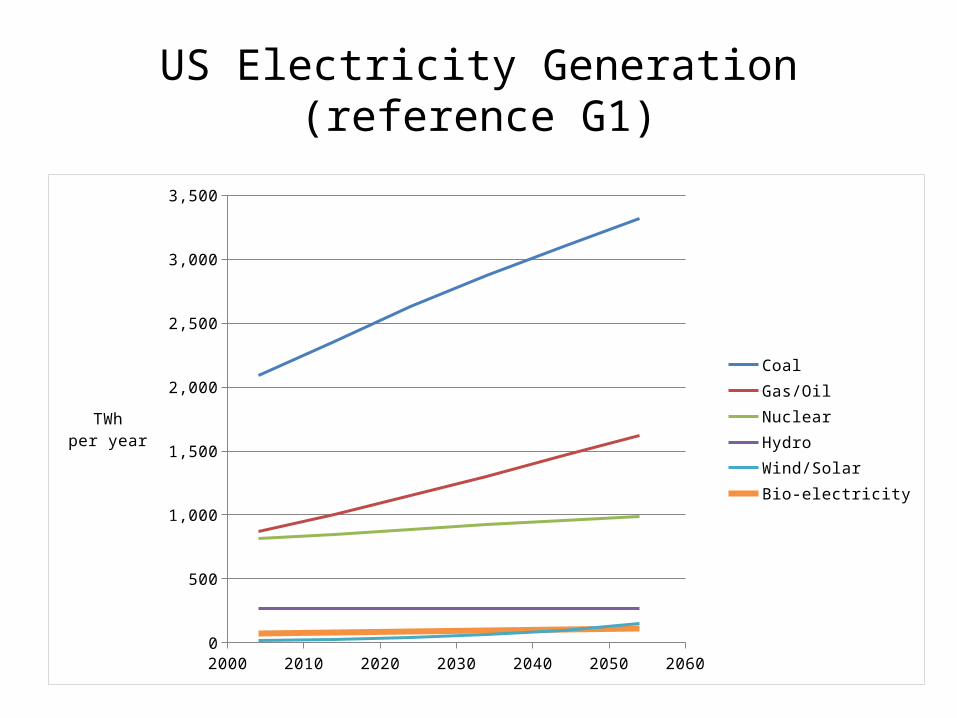
US Electricity Generation (reference G1)
2000 2010 2020 2030 2040 2050 20600
500
1,000
1,500
2,000
2,500
3,000
3,500
CoalGas/OilNuclearHydroWind/SolarBio-electricity
TWhper year
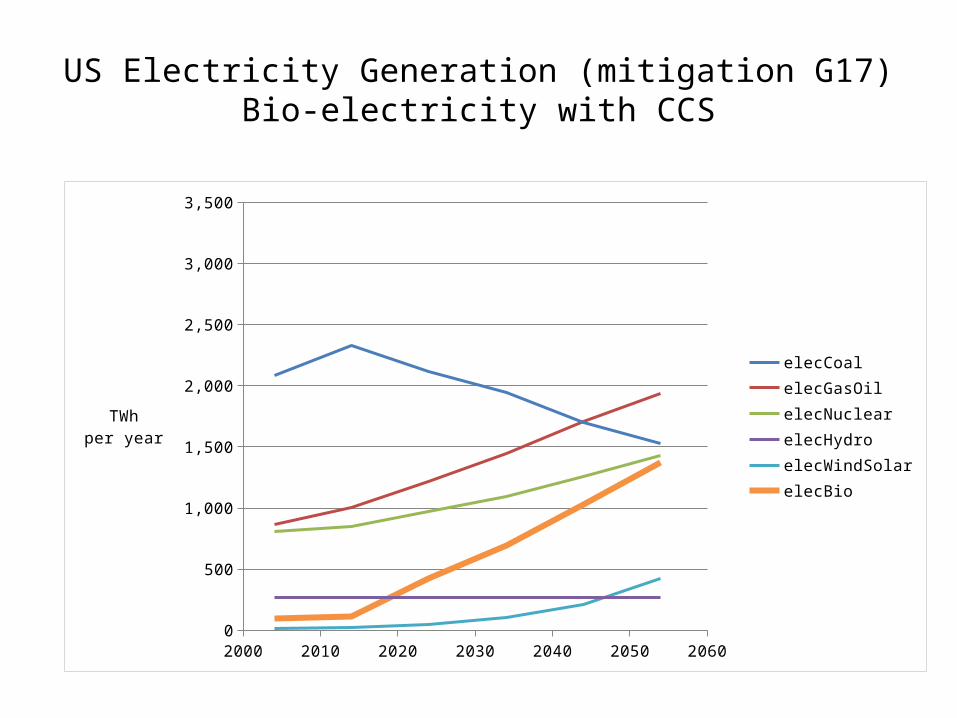
US Electricity Generation (mitigation G17)Bio-electricity with CCS
2000 2010 2020 2030 2040 2050 20600
500
1,000
1,500
2,000
2,500
3,000
3,500
elecCoalelecGasOilelecNuclearelecHydroelecWindSolarelecBio
TWhper year
To Do List
• Non-CO2 greenhouse gases– CH4 from rice production
– N2O from fertilizer
– CH4 and N2O from livestock
• Other biofuel pathways– Corn-ethanol– Sugar-ethanol– Liquid fuels from cellulosic biomass
• Land competition– Forest dynamics– Carbon emissions from land use change

EXTRA SLIDESNew FARM
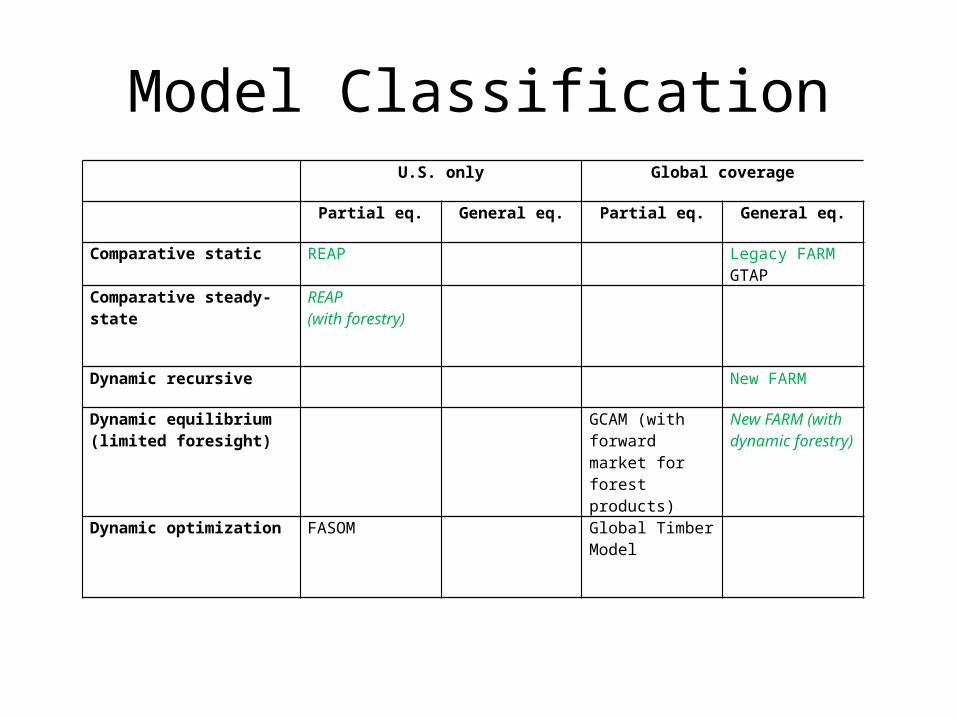
Model ClassificationU.S. only Global coverage
Partial eq. General eq. Partial eq. General eq.
Comparative static REAP Legacy FARM GTAP
Comparative steady-state REAP(with forestry)
Dynamic recursive New FARM
Dynamic equilibrium (limited foresight)
GCAM (with forward market for forest products)
New FARM (with dynamic forestry)
Dynamic optimization FASOM Global Timber Model
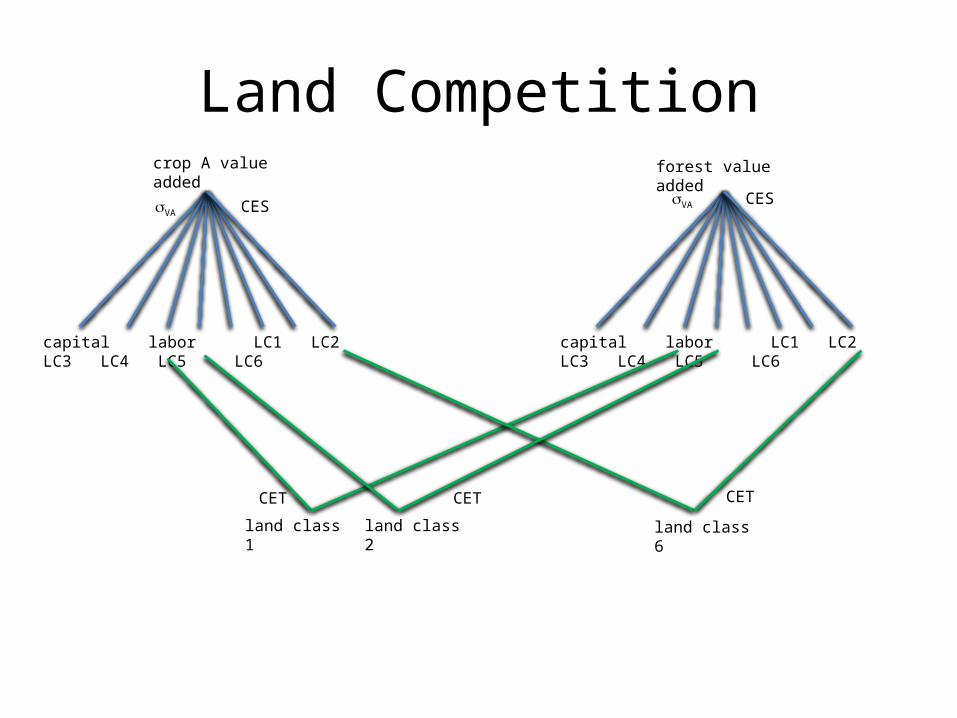
Land Competition
capital labor LC1 LC2 LC3 LC4 LC5 LC6 capital labor LC1 LC2 LC3 LC4 LC5 LC6
sVAsVA
crop A value added forest value added
land class 1 land class 2 land class 6
CET CET CET
CES CES
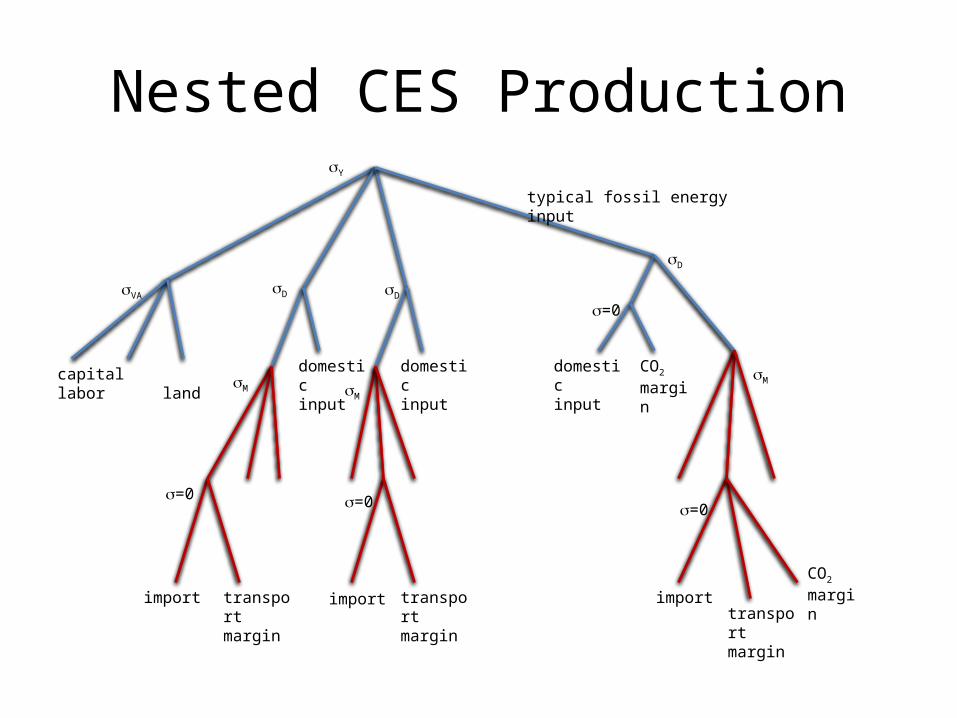
Nested CES Production
capital labor land domesticinput
import transportmargin
domesticinput
import transportmargin
domesticinput
CO2
margin
typical fossil energy input
CO2
margintransportmargin
import
sM
sY
sVA sDsD
sD
sM sM
s=0
s=0
s=0 s=0
Source: Van Vuuren DP et al (2011) The representative concentration pathways: an overview. Climatic Change DOI 10.1007/s10584-011-0148-z


