
This Consolidated Half Year Financial Report has been translated into English solely for the convenience of the international reader. In case of discrepancies, the Italian language document is the sole authoritative and universally valid version.
INTERCOS GROUP
Global Cosmetic Manufacturer
INTERIM REPORT
AT SEPTEMBER 30, 2016
PREPARED IN ACCORDANCE WITH IFRS ENDORSED BY THE EUROPEAN UNION
Intercos S.p.A. Headquarters in Milan Piazza Generale Armando Diaz 1

This Consolidated Half Year Financial Report has been translated into English solely for the convenience of the international reader. In case of discrepancies, the Italian language document is the sole authoritative and universally valid version. 2
Corporate Information
BOARD OF DIRECTORS
Name Position Dario Gianandrea Ferrari Chairman and Chief Executive Officer
Ludovica Arabella Ferrari Director
Gianandrea Ferrari Director
Paolo Valsecchi Director
Renato Semerari Director
Thukral Nikhil Kumar Director
Chu James Michael Director
BOARD OF STATUTORY AUDITORS
Name Position Nicola Pietro Lorenzo Broggi Chairman
Matteo Tamburini Standing Auditor
Maria Maddalena Gnudi Standing Auditor
Francesco Molinari Alternative Auditor
Simone Alessandro Marchiò Alternative Auditor
INDEPENDENT AUDITORS Reconta Ernst & Young S.p.A.
This Consolidated Half Year Financial Report has been translated into English solely for the convenience of the international reader. In case of discrepancies, the Italian language document is the sole authoritative and universally valid version. 3
INTERIM REPORT ON OPERATIONS AT SEPTEMBER 30, 2016
Introduction
The Interim Report at September 30, 2016 of the Intercos Group is prepared in accordance with the
provisions of art. 154 ter, paragraph 5 of Legislative Decree 58/98 – T.U.F., and subsequent modifications and
additions, and drawn up in accordance with IAS 34 – “Interim Financial Reporting”, issued by the
International Accounting Standards Board (IASB).
The format of the income statement, as permitted by IAS 1, presents a format by function showing revenues
and cost of sales which is considered to be a better representation of the economic and financial performance
of the Group. Since the first year of application of this format was the year ended December 31, 2015, the
income statement for the nine months ended September 30, 2015 has been duly reclassified for purposes of
comparison.
The notes to the interim consolidated financial statements at September 30, 2016, in accordance with IAS 34,
are presented in a condensed form and do not include all the information that would be required for annual
financial statements, in that they refer solely to those components which, by amount, composition or variation,
are necessary for an understanding of the results of operations, the cash flows and the financial position of the
Group. Therefore, the Interim Report should be read in conjunction with the Intercos S.p.A. 2015
consolidated financial statements.
The accounting policies and basis of preparation of the Interim Report have been applied on basis consistent
with those of the annual consolidated financial statements at December 31, 2015.
All amounts are expressed in thousands or millions of Euro, unless otherwise indicated.
The preparation of the Interim Report required the use of estimates by management.
With the intention of providing information that reflects the analysis and control parameters used by
management of the Group, the interim consolidated statement of financial position at September 30, 2016
and the interim consolidated income statement for the nine months ended September 30, 2016, as well as the
comparative statements at September 30, 2015 and December 31, 2015 have been reclassified and
supplemented with non-GAAP alternative performance measures.
The reclassifications had no effect on the net profit or the equity reported in the consolidated financial
statements.

This Consolidated Half Year Financial Report has been translated into English solely for the convenience of the international reader. In case of discrepancies, the Italian language document is the sole authoritative and universally valid version. 4
The non-GAAP alternative performance measures expressed in the Interim Reclassified Consolidated
Income Statement and the Interim Reclassified Consolidated Statement of Financial Position are used by
management to provide information for a better assessment of the results of operations and the financial
position of the Group. Such performance measures should not be considered as a substitute for the
performance measures established by IFRS.
The alternative performance measures and the items reclassified or regrouped that are not arrived directly
from the financial statements are defined as follows:
EBITDA: is calculated as profit before taxes, before financial income (expenses) without any
adjustment and before depreciation, amortization and impairment reversals (losses). EBITDA also
excludes income (expenses) from the management of unconsolidated companies and securities, in
addition to gains or losses on any disposal of consolidated investments, classified under “Financial
income (expenses)” or, for the results from only investments accounted for using the equity method
(non-operating) under “Result from investments accounted for using the equity method”.
Adjusted EBITDA: is calculated by the deducting the following, if applicable, from EBITDA, as
defined above:
impairment of goodwill, if any;
amortization of the portion of the purchase price allocated to intangible assets in a business
combination, as established in IFRS 3;
restructuring costs, under specific and significant restructuring plans;
nonrecurring other income (expenses) referring to particularly significant events unrelated to
ordinary business operations.
Operating Working Capital includes inventories and trade receivables and payables;
Net Working Capital: is given by operating working capital net of other current assets and
liabilities;
Net invested capital: is the sum of non-current assets, non-current liabilities and Net Working
Capital;
Net debt (cash) or net financial position: is given by the sum of current and non-current financial
liabilities net of short- and long-term financial receivables, including cash and cash equivalents;
Headcount: is given by the number of employees registered in the payroll book on the last day of
the period under consideration.

This Consolidated Half Year Financial Report has been translated into English solely for the convenience of the international reader. In case of discrepancies, the Italian language document is the sole authoritative and universally valid version. 5
Key Data of the Group
(in € thousands) 9 months ended
9/30/2016
9 months ended
9/30/2015 reclassified
Change
Revenues 315,327 288,422 26,905
EBITDA 40,018 41,494 (1,476)
Adjusted EBITDA 38,909 41,762 (2,853)
% of revenues 12.3% 14.5% -2.1%
Operating profit (EBIT) 24,471 25,358 (887)
% of revenues 7.8% 8.8% -1.0%
EBT 16,632 14,895 1,736
Profit for the period 8,697 7,559 1,138
(in € thousands) 9/30/2016 12/31/2015 Change
Net working capital 76,112 66,141 9,971
Working capital turnover
4,14 6,07 -1,93
Net invested capital 277,698 266,986 10,712
Non-current assets 220,652 221,245 (593)
Net financial position 160,191 148,596 11,595
9/30/2016 9/30/2015 Change
Headcount (number) 2,653 2,392 261
Earnings per share (basic and diluted) - in Euro 0.10 0.08 0.02

This Consolidated Half Year Financial Report has been translated into English solely for the convenience of the international reader. In case of discrepancies, the Italian language document is the sole authoritative and universally valid version. 6
Interim Reclassified Consolidated Statement of Financial Position
(in € thousands) 9/30/2016 12/31/2015
Fixed assets 194,181 197,006
Inventories 85,779 69,884
Trade receivables 79,492 73,626
Trade payables (70,946) (69,456)
Operating working capital 94,325 74,054
Other current assets and liabilities, net (*) (18,213) (7,327)
Net working capital 76,112 66,727
Other non-current assets and liabilities, net (**) 2,385 1,847
Investments accounted for using the equity method 5,020 1,408
Net invested capital 277,698 266,986
Assets and liabilities held for sale 5,633 -
Equity 123,140 118,390
Cash and cash equivalents (38,190) (50,683)
Financial payables 198,381 199,279
Net financial position 160,191 148,596
Total sources 283,331 266,986
Notes on the reconciliation between the Interim reclassified consolidated statement of financial position and the Interim
consolidated statement of financial position:
(*) Includes the items: "Other current assets" and "Other current liabilities "
(**) Includes the items: "Deferred tax assets ", "Other non-current receivables ", "Provisions – non-current”, "Deferred tax
liabilities ", "Other non-current liabilities” and "Employee benefit obligations"
Consolidated Net Financial Position (in € thousands)
Net financial position 9/30/2016 12/31/2015
Current net financial position (2,624) (20,362)
Non-current net financial position 162,815 168,959
Total Net financial position 160,191 148,596
This Consolidated Half Year Financial Report has been translated into English solely for the convenience of the international reader. In case of discrepancies, the Italian language document is the sole authoritative and universally valid version. 7
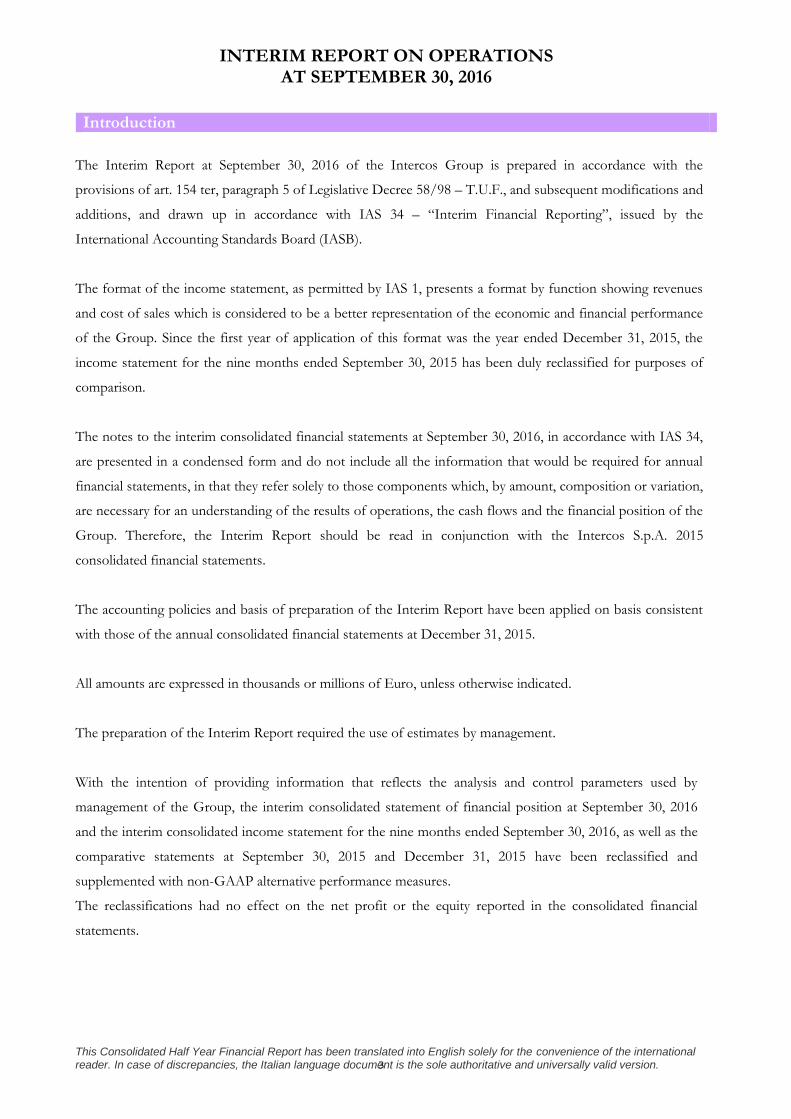
Interim Reclassified Consolidated Income Statement
(in € thousands)
9 months ended
9/30/2016
9 months ended
9/30/2015 reclassified
Revenues 315,327
288,422
Cost of sales (243,104)
(215,251)
Gross industrial margin 72,223
73,171
% of revenues
22.9%
25.4%
Research & Development and innovation costs (19,531)
(19,125)
Selling expenses (14,543)
(15,650)
General and administrative expenses (17,312)
(15,270)
Other operating income (expenses), net 3,098
2,500
Result from investments accounted for using the equity method (operating) (574)
-
Nonrecurring income (expenses) 1,110
(268)
Operating profit (EBIT) 24,471
25,358
% of revenues 7.8%
8.8%
Depreciation, amortization and impairment reversals (losses) (15,548)
(16,136)
EBITDA (*) 40,018
41,494
Nonrecurring income (expenses) 1,110
(268)
Adjusted EBITDA (**) 38,909
41,762
Financial income (expenses), net (7,868)
(10,579)
Result from investments accounted for using the equity method 29
116
Profit before taxes (EBT) (***) 16,632
14,895
Income taxes (7,934)
(7,335)
Profit for the period 8,697
7,559
Notes on the reconciliation between the Interim reclassified consolidated income statement and interim consolidated income
statement:
(*) EBITDA is calculated as profit before taxes, before financial income (expenses) without any adjustment and before
depreciation, amortization and impairment reversals (losses). EBITDA excludes also the results from only investments accounted
for using the equity method (non-operating companies), under “Result from investments accounted for using the equity method”.
(**) Adjusted EBITDA is calculated by deducting from EBITDA, as defined previously, nonrecurring expenses.
(***) EBT is calculated as the sum of financial income and expenses without any adjustment.
This Consolidated Half Year Financial Report has been translated into English solely for the convenience of the international reader. In case of discrepancies, the Italian language document is the sole authoritative and universally valid version. 8
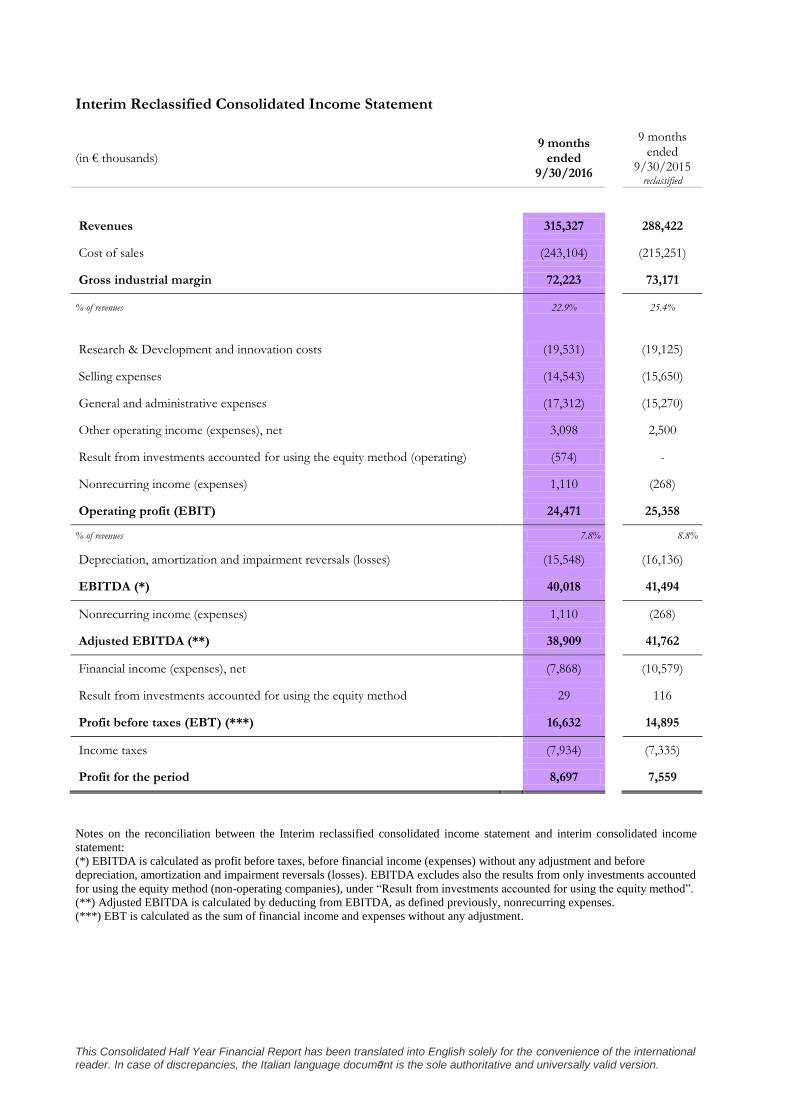
Headcount of the Group by category at September 30, 2016
Group Headcount 9/30/2016 9/30/2015
Executives and mid-level managers 242 219
White-collars 917 837
Blue-collars 1,494 1,336
Total 2,653 2,392
Temporary 1,618 1593
Total headcount 4,271 3,985
This Consolidated Half Year Financial Report has been translated into English solely for the convenience of the international reader. In case of discrepancies, the Italian language document is the sole authoritative and universally valid version. 9
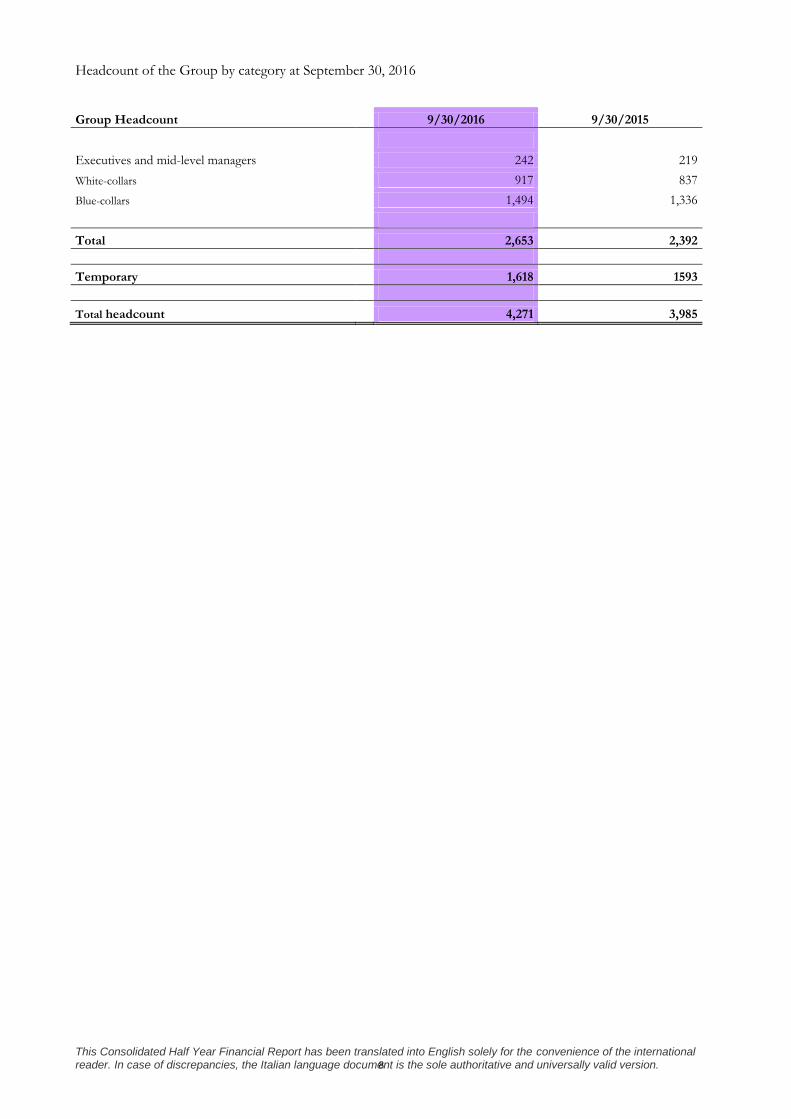
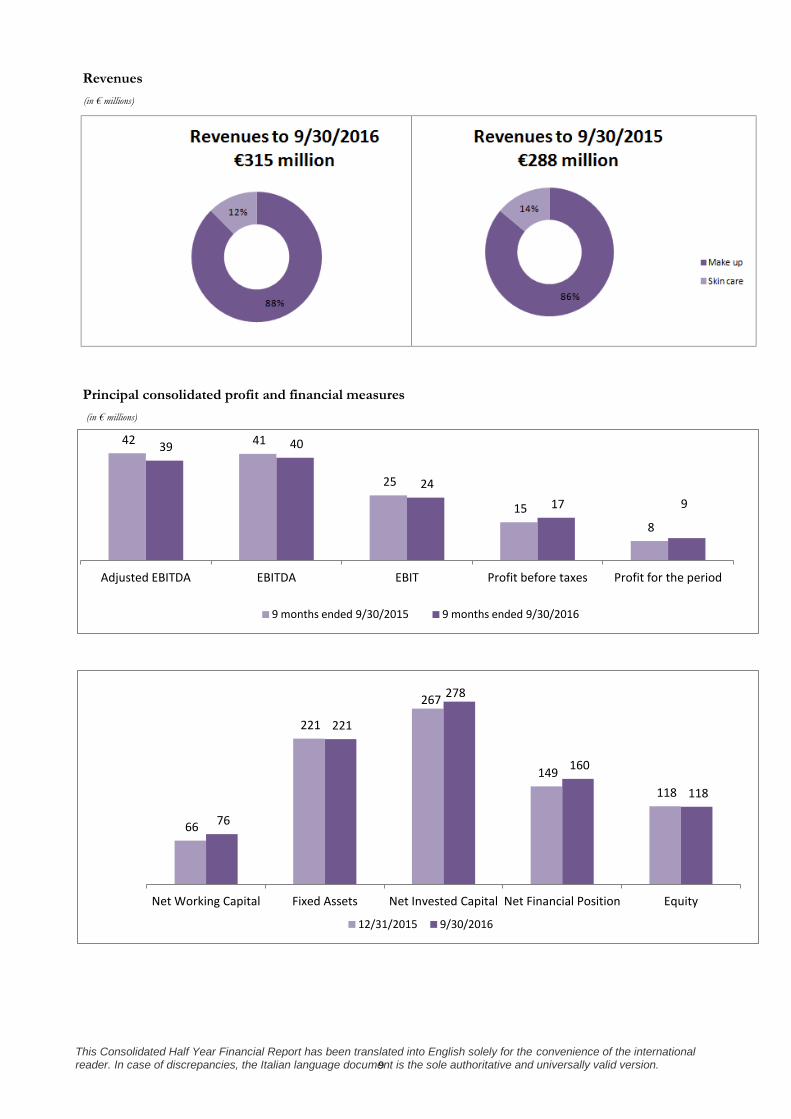
Revenues
(in € millions)
Principal consolidated profit and financial measures
(in € millions)
42 41
25
15
8
39 40
24
17 9
Adjusted EBITDA EBITDA EBIT Profit before taxes Profit for the period
9 months ended 9/30/2015 9 months ended 9/30/2016
66
221
267
149
118
76
221
278
160
118
Net Working Capital Fixed Assets Net Invested Capital Net Financial Position Equity
12/31/2015 9/30/2016

This Consolidated Half Year Financial Report has been translated into English solely for the convenience of the international reader. In case of discrepancies, the Italian language document is the sole authoritative and universally valid version. 10
Profit and Financial Review In the first nine months of 2016 the Group reported revenues from sales of €315,327 thousand compared to
€288,422 thousand in the first nine months of 2015, with an increase of €26,905 thousand, or 9%.
Adjusted EBITDA in the first nine months of 2016 is a positive €38,910 thousand (€41,762 thousand for the
first nine months of 2015).
Operating profit (EBIT) in the nine months to September 30, 2016 is €24,471 thousand, or a margin of 7.8%
(€25,358 thousand in the corresponding period of the prior year).
Capital expenditures in property, plant and equipment and intangible assets during the first nine months of
2016 total €14,763 thousand and €5,562 thousand, respectively.
The consolidated net financial position is a debt position of €160,191 thousand compared to the debt
position of €148,596 thousand at December 31, 2015, increasing by €11,595 thousand.
Total equity is €123,139 thousand compared to €118,390 thousand at December 31, 2015, with a decrease of
€4,749 thousand.
Structure of the Group
Group organization. Intercos S.p.A. is a corporation organized under the laws of the Republic of Italy, with
its registered office in Milan, Piazza Generale Armando Diaz 1.
The Group’s business was reorganized at the end of 2013 and is now aggregated into two areas identified on
the basis of the following operating segments:
Make-Up B.U.: specialized in the creation, development, manufacture and marketing of powders,
emulsions, lipsticks, nail polishes and types of cosmetics using delivery systems in the form of
pens/pencils for the face, eyes and lips;
Skin Care B.U.: specialized in the manufacture and marketing of cosmetic and skin care creams.
The Group’s main manufacturing facilities are at the plant sites in Italy, America, Switzerland, China and
Brazil.
This Consolidated Half Year Financial Report has been translated into English solely for the convenience of the international reader. In case of discrepancies, the Italian language document is the sole authoritative and universally valid version. 11
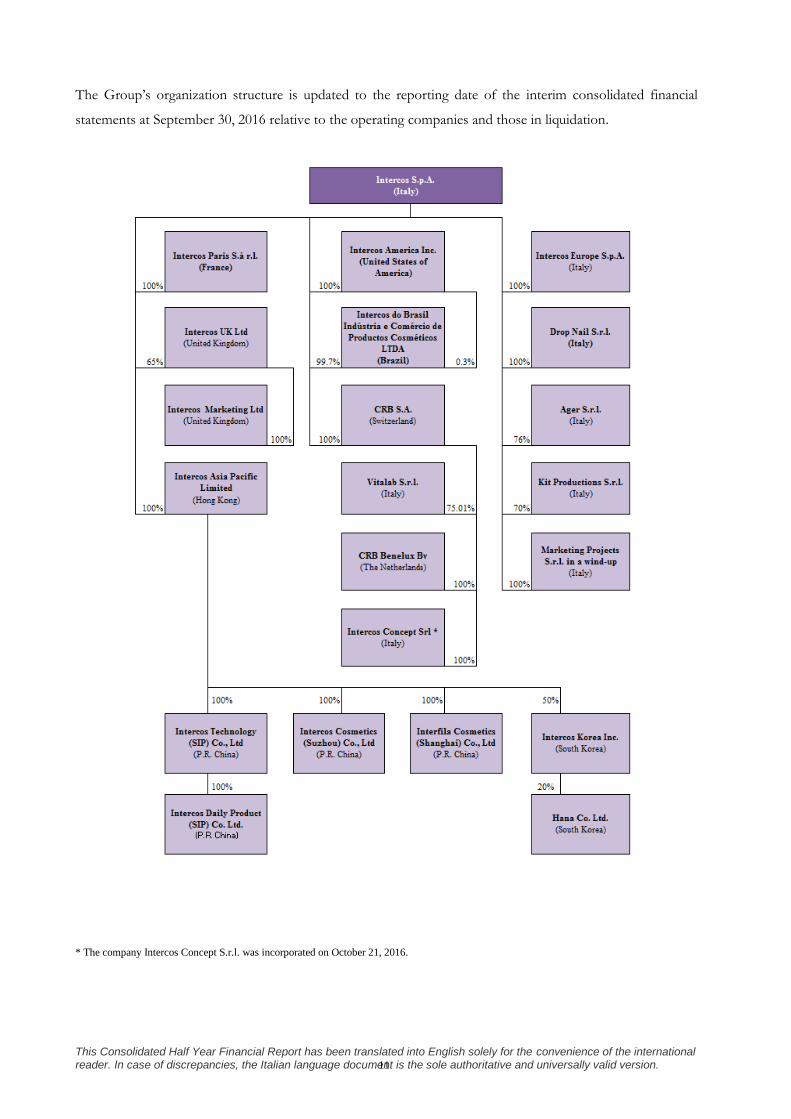
The Group’s organization structure is updated to the reporting date of the interim consolidated financial
statements at September 30, 2016 relative to the operating companies and those in liquidation.
* The company Intercos Concept S.r.l. was incorporated on October 21, 2016.
This Consolidated Half Year Financial Report has been translated into English solely for the convenience of the international reader. In case of discrepancies, the Italian language document is the sole authoritative and universally valid version. 12
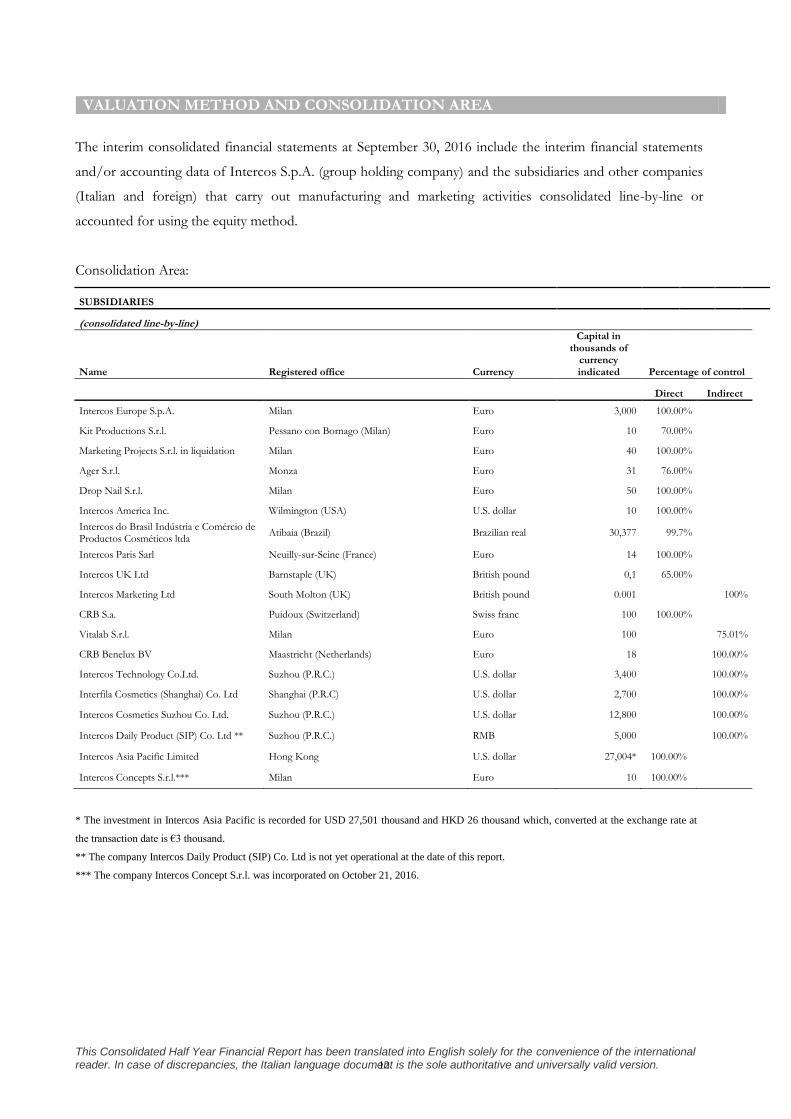
VALUATION METHOD AND CONSOLIDATION AREA
The interim consolidated financial statements at September 30, 2016 include the interim financial statements
and/or accounting data of Intercos S.p.A. (group holding company) and the subsidiaries and other companies
(Italian and foreign) that carry out manufacturing and marketing activities consolidated line-by-line or
accounted for using the equity method.
Consolidation Area:
SUBSIDIARIES
(consolidated line-by-line)
Name Registered office Currency
Capital in thousands of
currency indicated Percentage of control
Direct Indirect
Intercos Europe S.p.A. Milan Euro 3,000 100.00%
Kit Productions S.r.l. Pessano con Bornago (Milan) Euro 10 70.00%
Marketing Projects S.r.l. in liquidation Milan Euro 40 100.00%
Ager S.r.l. Monza Euro 31 76.00%
Drop Nail S.r.l. Milan Euro 50 100.00%
Intercos America Inc. Wilmington (USA) U.S. dollar 10 100.00%
Intercos do Brasil Indústria e Comércio de Productos Cosméticos ltda
Atibaia (Brazil) Brazilian real 30,377 99.7%
Intercos Paris Sarl Neuilly-sur-Seine (France) Euro 14 100.00%
Intercos UK Ltd Barnstaple (UK) British pound 0,1 65.00%
Intercos Marketing Ltd South Molton (UK) British pound 0.001 100%
CRB S.a. Puidoux (Switzerland) Swiss franc 100 100.00%
Vitalab S.r.l. Milan Euro 100 75.01%
CRB Benelux BV Maastricht (Netherlands) Euro 18 100.00%
Intercos Technology Co.Ltd. Suzhou (P.R.C.) U.S. dollar 3,400
100.00%
Interfila Cosmetics (Shanghai) Co. Ltd Shanghai (P.R.C) U.S. dollar 2,700
100.00%
Intercos Cosmetics Suzhou Co. Ltd. Suzhou (P.R.C.) U.S. dollar 12,800
100.00%
Intercos Daily Product (SIP) Co. Ltd ** Suzhou (P.R.C.) RMB 5,000
100.00%
Intercos Asia Pacific Limited Hong Kong U.S. dollar 27,004* 100.00%
Intercos Concepts S.r.l.*** Milan Euro 10 100.00%
* The investment in Intercos Asia Pacific is recorded for USD 27,501 thousand and HKD 26 thousand which, converted at the exchange rate at
the transaction date is €3 thousand.
** The company Intercos Daily Product (SIP) Co. Ltd is not yet operational at the date of this report.
*** The company Intercos Concept S.r.l. was incorporated on October 21, 2016.

This Consolidated Half Year Financial Report has been translated into English solely for the convenience of the international reader. In case of discrepancies, the Italian language document is the sole authoritative and universally valid version. 13
All amounts in the interim financial statements are expressed in thousands of Euro, unless otherwise indicated.
The exchange rates used for the translation of amounts expressed in currencies other than the Euro are the
following:
Income Statement
9 months ended 9/30/2016
Income Statement 9 months ended
9/30/2015
Statement of Financial Position
9/30/2016
Statement of Financial Position
12/31/2015
Average for period Average for period At September 30, 2016 At December 31, 2015
U.S. dollar 1.1158 1.1145 1.1161 1.0887
Pound sterling 0.8022 0.7275 0.8610 0.7340
Swiss franc 1.0936 1.0619 1.0876 1.0835
Chinese renminbi (yuan) 7.3432 6.9647 7.4463 7.0608
South Korean won 1296.2855 1251.7900 1229.7600 1280.7800
Brazilian real 3.9642 3.5183 3.6210 4.3117

This Consolidated Half Year Financial Report has been translated into English solely for the convenience of the international reader. In case of discrepancies, the Italian language document is the sole authoritative and universally valid version. 14
SEGMENT REPORTING
At September 30, 2016 the Group’s business is aggregated into two reporting segments identified on the basis
of the following product lines:
“Make-up” Business Unit: specialized in the creation, development, manufacture and marketing of
powders, emulsions, lipsticks, nail polishes and types of cosmetics using delivery systems in the form
of pens/pencils for the face, eyes and lips.
“Skin Care” Business Unit: specialized in the manufacture and marketing of cosmetic and skin
care creams.
The Group’s main manufacturing facilities are in Italy, America, Switzerland, China and Brazil.
Financial information reported according to these business units is periodically reviewed by the Board of
Directors and also used for planning and budgeting purposes.
Detailed information on each identified segment for the nine months ended September 30, 2016 and
September 30, 2015 is presented in the following tables.
9 months ended 9/30/2016 - (in € thousands) Make-up Line Skin Care Line Total
Revenues 276,143 39,184 315,327
Adjusted EBITDA 33,645 5,264 38,909
Depreciation, amortization and impairment reversals (losses) (13,647) (1,901) (15,548)
Nonrecurring income (expenses) 1,110
Finance income (expenses) (7,868)
Result from investments accounted for using the equity method 29
Income taxes (7,934)
Profit for the period 8,697
Net invested capital at 9/30/2016 234,301 43,397 277,698
9 months ended 9/30/2015 - (in € thousands) Make-up Line Skin Care Line Total
Revenues 248,260 40,162 288,422
Adjusted EBITDA 33,886 7,876 41,762
Depreciation, amortization and impairment reversals (losses) (14,678) (1,458) (16,136)
Nonrecurring income (expenses) (268)
Finance income (expenses) (10,579)
Result from investments accounted for using the equity method 116
Income taxes (7,335)
Profit for the period 7,561
Net invested capital at 12/31/2015 219,306 47,681 266,986

This Consolidated Half Year Financial Report has been translated into English solely for the convenience of the international reader. In case of discrepancies, the Italian language document is the sole authoritative and universally valid version. 15
The Make-Up Business Unit reported revenues of €276,143 thousand, with an increase of
€27,883 thousand (+11.2%) compared to the reclassified figure for the corresponding period of the prior
year, and basically includes all the product families.
Adjusted EBITDA 1 (that is, the operating profit before depreciation, amortization and impairment reversals
(losses) and nonrecurring income (expenses) is €33,645 thousand, a decrease of €241 thousand or -0.7%
compared to €33,886 thousand for the first nine months of 2015). Mostly in line with the same period of the
prior year.
The Skin Care Business Unit recorded revenues of €39,184 thousand, with a decrease of €978 thousand or
-2.4%, compared to the reclassified figure for the same period of 2015.
Adjusted EBITDA is equal to €5,264 thousand compared to €7,876 thousand (reclassified figure) for the first
nine months of 2015, a decrease of €2,612 thousand, or -33.2%.
The increase in volumes is not reflected in an increase in EBITDA due to the different mix and higher fixed
costs, although limited in the latter case.
Detailed information on sales by geographical area and by reference to the location in which the recipient of
the sales invoice has its headquarters is as follows.
(in € thousands)
Sales by Business Unit 9 months ended
9/30/2016 9 months ended
9/30/2015
Make-Up 276,143 248,260
Skin Care 39,184 40,162
Total 315,327 288,422
(in € thousands)
Sales by geographical area 9 months ended
9/30/2016 9 months ended
9/30/2015
Americas 106,816 116,068
EMEA 176,830 135,541
Asia 31,680 36,813
Total 315,327 288,422
The differing revenue trends by geographical area for the nine months to September 30, 2016 compared to the
corresponding period of the prior year can be summarized as follows:
The Americas area records a decrease in sales of 8.0%, especially in the Prestige market.
The EMEA area shows sales of €176,830 thousand compared to €135,541 thousand in the
corresponding period of the prior year, with a strong increase of €41,289 thousand (+30.5%) in the
Multinational and Retailers markets.
The Asia area reports a decrease of 13.9% to total revenues of €31,680 compared to €36,813 in the
same period of the prior year.
1 Adjusted EBITDA, as defined, represents a performance measure used by management to monitor and evaluate its operating performance.
Adjusted EBITDA is an alternative performance measure of the operating profit of the Group and, as such, should not be construed as a substitute
for the conventional performance measures required by IFRS. Since the composition of EBITDA is not regulated by IFRS, the criteria used in its determination by the Group may not be the same as that adopted by other companies and therefore is not a comparable performance measure.

This Consolidated Half Year Financial Report has been translated into English solely for the convenience of the international reader. In case of discrepancies, the Italian language document is the sole authoritative and universally valid version. 16
COMMENTS ON THE OPERATIONS OF THE GROUP
Comments on the reclassified statement of financial position - Financial Structure:
The financial structure of the Group at September 30, 2016 compared to December 31, 2015 is represented as
follows:
9/30/2016 12/31/2015
Inventories 85,779 69,884
Trade receivables and other receivables 90,683 85,221
Income taxes receivable 701 2,907
Current non-financial liabilities (*) (101,051) (91,871)
A. Net working capital 76,112 66,141
Property, plant and equipment 93,932 98,254
Other intangible assets (**) 100,249 98,752
Other non-current assets (*) 26,472 24,240
B. Fixed assets 220,653 221,245
C. Non-current assets held for sale 5,633 -
D. Employee severance indemnities (9,780) (8,379)
E. Provisions (903) (2,777)
F. Other non-current liabilities (*) (8,384) (9,244)
G. Net invested capital 277,698 266,986
Financed by: Current financial position (*) (2,624) (20,362)
Non-current net financial position (*) 162,815 168,959
H. Total net financial position 160,191 148,596
I. Equity 123,140 118,390
L. Total (H+I) 283,331 266,986
(*) Details of the composition of this item are provided in the “Reconciliation Schedules” on page 18.
(**) Includes goodwill.
Inventories amount to €85,779 thousand at September 30, 2016 and show an increase of €15,895 thousand
compared to December 31, 2015. This change principally refers to the Europe and Americas area and is

This Consolidated Half Year Financial Report has been translated into English solely for the convenience of the international reader. In case of discrepancies, the Italian language document is the sole authoritative and universally valid version. 17
mainly a result of higher product volumes in the Europe area, in addition to seasonal factors to which the
Group is exposed which require concentration of a part of production in the first half of the year in order to
meet sales requirements in the second part of the year.
Trade receivables are €90,683 thousand at September 30, 2016, with an increase of €5,462 thousand (+6.4%)
compared to December 31, 2015; the change is mainly due to Asian legal entities.
Equity increased by €4,748 thousand as a result of the profit reported of €8,697 thousand, the change in
exchange differences on translating foreign operations of €1,983 thousand, the actuarial loss of €852 thousand
and the negative consolidation reserve of €1,114 thousand, which mainly includes the effect of the acquisition
of 100% of the subsidiary Drop Nail for €535 thousand and the payment of dividends to non-controlling
interests for €500 thousand.
The net financial position increased by €11,595 thousand compared to December 31, 2015.
This Consolidated Half Year Financial Report has been translated into English solely for the convenience of the international reader. In case of discrepancies, the Italian language document is the sole authoritative and universally valid version. 18
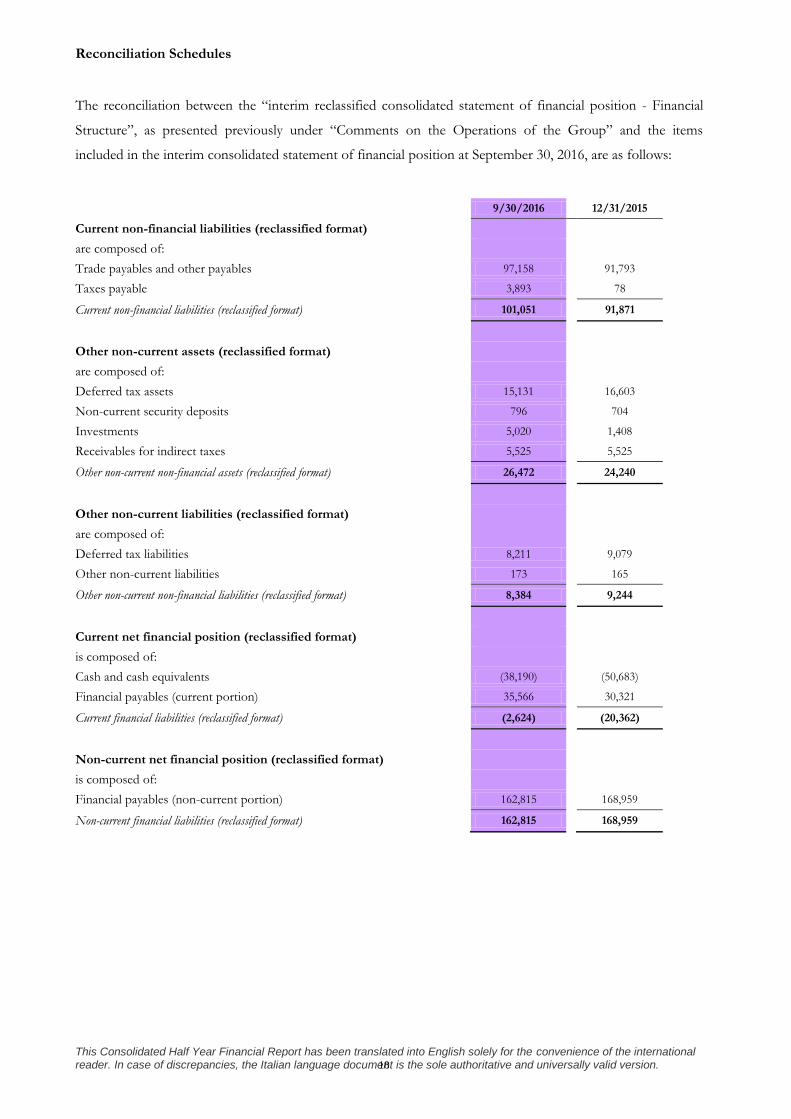
Reconciliation Schedules
The reconciliation between the “interim reclassified consolidated statement of financial position - Financial
Structure”, as presented previously under “Comments on the Operations of the Group” and the items
included in the interim consolidated statement of financial position at September 30, 2016, are as follows:
9/30/2016
12/31/2015
Current non-financial liabilities (reclassified format)
are composed of:
Trade payables and other payables
97,158
91,793
Taxes payable
3,893
78
Current non-financial liabilities (reclassified format)
101,051
91,871
Other non-current assets (reclassified format)
are composed of:
Deferred tax assets
15,131
16,603
Non-current security deposits
796
704
Investments
5,020
1,408
Receivables for indirect taxes
5,525
5,525
Other non-current non-financial assets (reclassified format)
26,472
24,240
Other non-current liabilities (reclassified format)
are composed of:
Deferred tax liabilities
8,211
9,079
Other non-current liabilities
173
165
Other non-current non-financial liabilities (reclassified format)
8,384
9,244
Current net financial position (reclassified format)
is composed of:
Cash and cash equivalents
(38,190)
(50,683)
Financial payables (current portion)
35,566
30,321
Current financial liabilities (reclassified format)
(2,624)
(20,362)
Non-current net financial position (reclassified format)
is composed of:
Financial payables (non-current portion)
162,815
168,959
Non-current financial liabilities (reclassified format)
162,815
168,959

This Consolidated Half Year Financial Report has been translated into English solely for the convenience of the international reader. In case of discrepancies, the Italian language document is the sole authoritative and universally valid version. 19
Movements in Property, plant and equipment
Movements in Property, plant and equipment during the first nine months of 2016 are the following:
(in € thousands) December 31,
2015 Increases / Depreciation
Translation differences /
Reclassifications
Change in the consolidation
area
Decreases / Utilization
September 30, 2016
Historical cost
Land and buildings 133,005 769 (5,654) (325) (1,059) 126,736
Plant and machinery 118,521 6,408 (281) 0 (420) 124,228
Industrial equipment 34,570 1,377 (109) 0 (68) 35,770
Office furniture and equipment 13,866 680 88 (110) (307) 14,218
Motor vehicles and internal transportation equipment
2,301 (0) (4) 0 (107) 2,190
Cell phones 21 0 0 0 0 21
Assets under construction and payments on account
3,811 5,530 (2,505) (0) (183) 6,653
Total 306,095 14,763 (8,464) (435) (2,143) 309,817
Accumulated depreciation Land and buildings 68,633 4,012 (615) 0 0 72,031
Plant and machinery 95,787 4,931 (797) 0 (431) 99,490
Industrial equipment 31,588 1,033 (51) 0 (68) 32,501
Office furniture and equipment 9,907 646 67 (43) (673) 9,905
Motor vehicles and internal transportation equipment
1,905 152 (3) 0 (82) 1,971
Cell phones 20 0 (3) 0 (31) (13)
Assets under construction and payments on account
0 0 0 0 0 0
Total 207,840 10,774 (1,402) (43) (1,285) 215,885
Net carrying amount 98,254 3,989 (7,062) (392) (859) 93,932
Movements in Intangible assets during the first nine months of 2016 are the following:
(in € thousands) December 31, 2015 Increases Decreases/
Adjustments/ Translation differences
Reclassifications Amortization September 30, 2016
Development costs 10,468 684 (31) 5,456 (3,332) 13,245
Patent rights 3,356 947 (12) 624 (1,069) 3,846
Concessions and licenses 1,220 150 (40) 425 (152) 1,603
Assets under development
6,131 3,400 0 (5,778) 0 3,753
Other intangible assets 901 381 0 0 (6) 1,276
TOTAL 22,075 5,562 (83) 727 (4,559) 23,722

This Consolidated Half Year Financial Report has been translated into English solely for the convenience of the international reader. In case of discrepancies, the Italian language document is the sole authoritative and universally valid version. 20
Borrowings from banks and other lenders
Details of Borrowings from banks and other lenders, with an indication of the relative due dates, are provided
in the following table:
(in € thousands)
September 30, 2016 Short-term Medium-term Long-term
Total
Intercos S.p.A. bonds
2,370 11,848 105,929 120,146
Medium/long-term bank borrowings (pool) 4,081 39,182 - 43,263
Medium/long-term bank borrowings (America) 228 2,276 5,362 7,866
Medium/long-term bank borrowings (CRB) 730 - - 730
Medium/long-term bank borrowings (Technology) 81 - - 81
Drop Nail mortgage 122 - - 122
Payables under Law 46/Mediocredito 209 1,015 - 1,224
Medium/long-term debt 7,820 54,320 111,291 173,432
Revolving credit facility Intercos S.p.A. - - - -
Revolving credit facility Intercos America - - - -
Revolving credit facility Intercos China 12,092 - - 12,092
Bank overdrafts 2,407 - - 2,407
Advances on invoices 10,330 - - 10,330
Short-term debt 24,830 - - 24,830
Borrowings from other lenders 120 - - 120
Factoring companies payable - - - -
Total 32,770 54,320 111,291 198,381
Details of medium/long-term debt outstanding at September 30, 2016 are as follows:
Company Bank Amount Internal rate of
return Description
Intercos S.p.A. Bank pool 11,012 2.187% Tranche in EUR
Intercos S.p.A. Bank pool 14,598 3.397% Tranche in USD
Intercos S.p.A. Institutional investors 120,146 4.256% Bonds
Intercos Europe S.p.A. Bank pool 17,653 2.248% Tranche in EUR
163,409
Intercos S.p.A. Other lenders 122 3.36% Low-rate loan Law 46 grant 11337 (EUR)
122
CRB Sa SH Bank 92 0.00% Loan guarantee
CRB Sa BCV Bank 1,380 1.95% Fin. Mortgage (in CHF)
CRB Sa UBS Bank 1,710 0.99% Fin. Filling Plant (in CHF)
CRB Sa BCV Bank 4,684 2.18% Batiplus (in CHF)
7,866
Intercos Technology HSBC Bank 730 7.180% Fin. ST HSBC (in RMB)
Drop Nail BPM Bank 81 1.505% Fin. Mortgage (in EUR)
81
This Consolidated Half Year Financial Report has been translated into English solely for the convenience of the international reader. In case of discrepancies, the Italian language document is the sole authoritative and universally valid version. 21
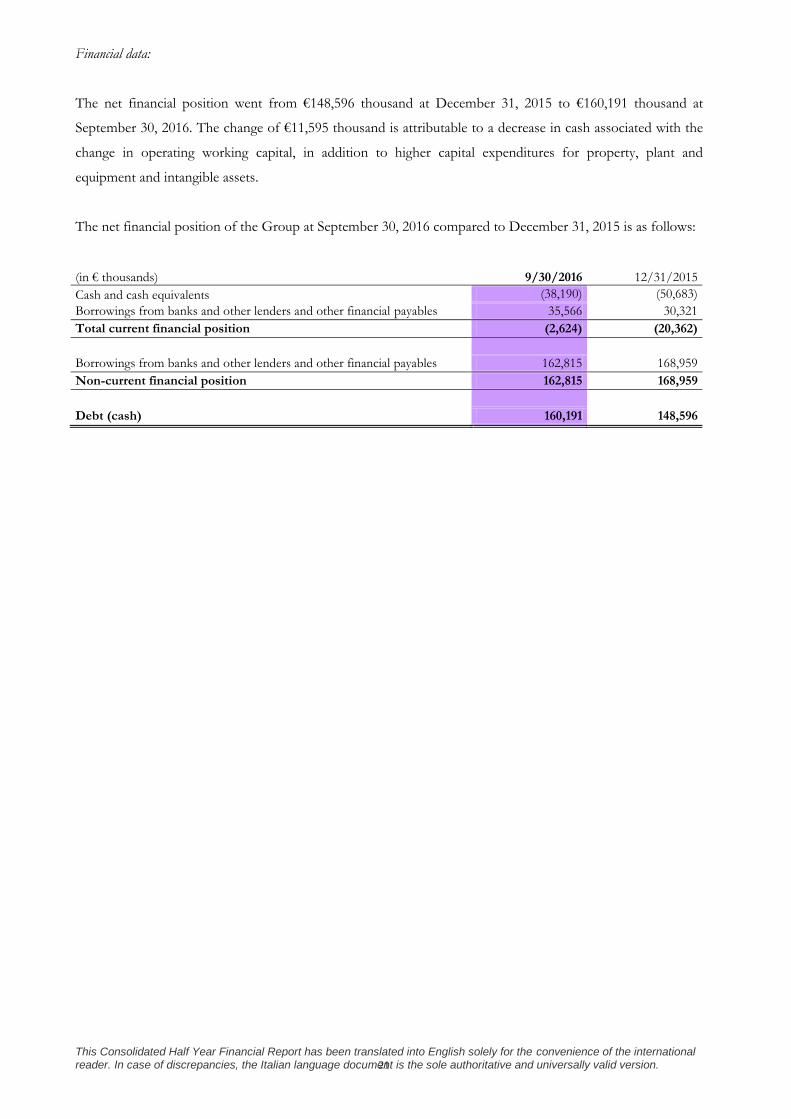
Financial data:
The net financial position went from €148,596 thousand at December 31, 2015 to €160,191 thousand at
September 30, 2016. The change of €11,595 thousand is attributable to a decrease in cash associated with the
change in operating working capital, in addition to higher capital expenditures for property, plant and
equipment and intangible assets.
The net financial position of the Group at September 30, 2016 compared to December 31, 2015 is as follows:
(in € thousands) 9/30/2016 12/31/2015
Cash and cash equivalents (38,190) (50,683)
Borrowings from banks and other lenders and other financial payables 35,566 30,321
Total current financial position (2,624) (20,362)
Borrowings from banks and other lenders and other financial payables 162,815 168,959
Non-current financial position 162,815 168,959
Debt (cash) 160,191 148,596
This Consolidated Half Year Financial Report has been translated into English solely for the convenience of the international reader. In case of discrepancies, the Italian language document is the sole authoritative and universally valid version. 22
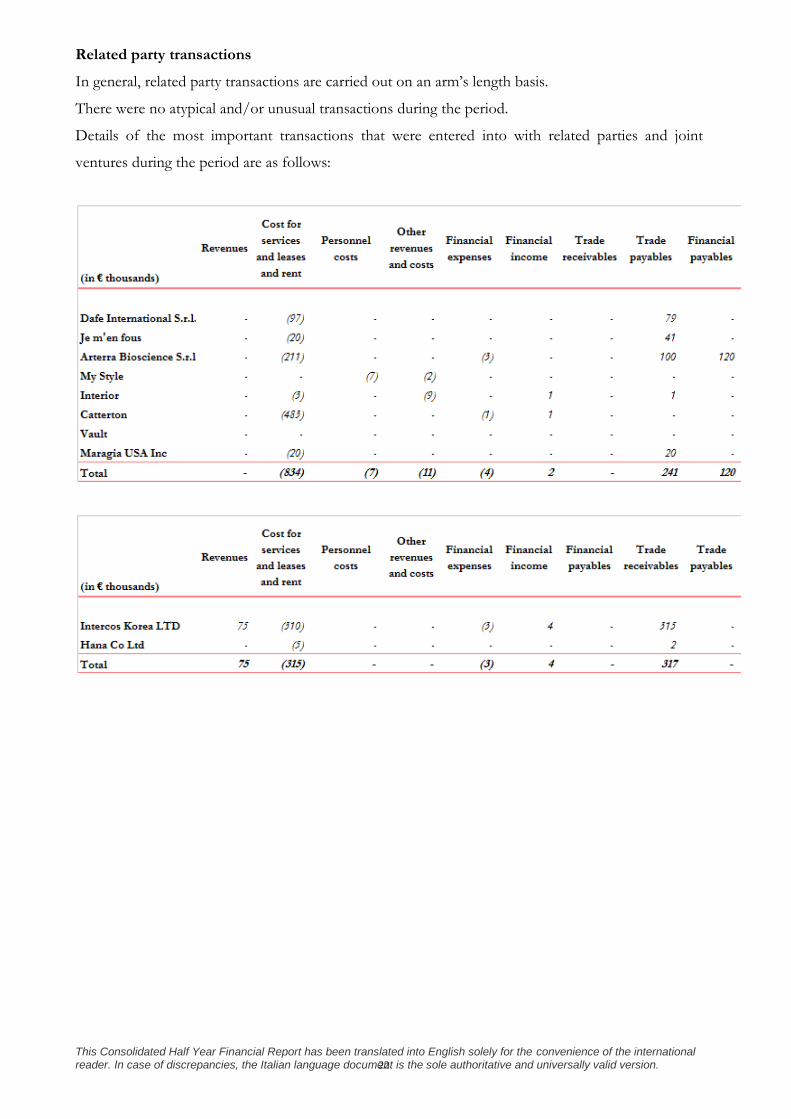
Related party transactions
In general, related party transactions are carried out on an arm’s length basis.
There were no atypical and/or unusual transactions during the period.
Details of the most important transactions that were entered into with related parties and joint
ventures during the period are as follows:
This Consolidated Half Year Financial Report has been translated into English solely for the convenience of the international reader. In case of discrepancies, the Italian language document is the sole authoritative and universally valid version. 23
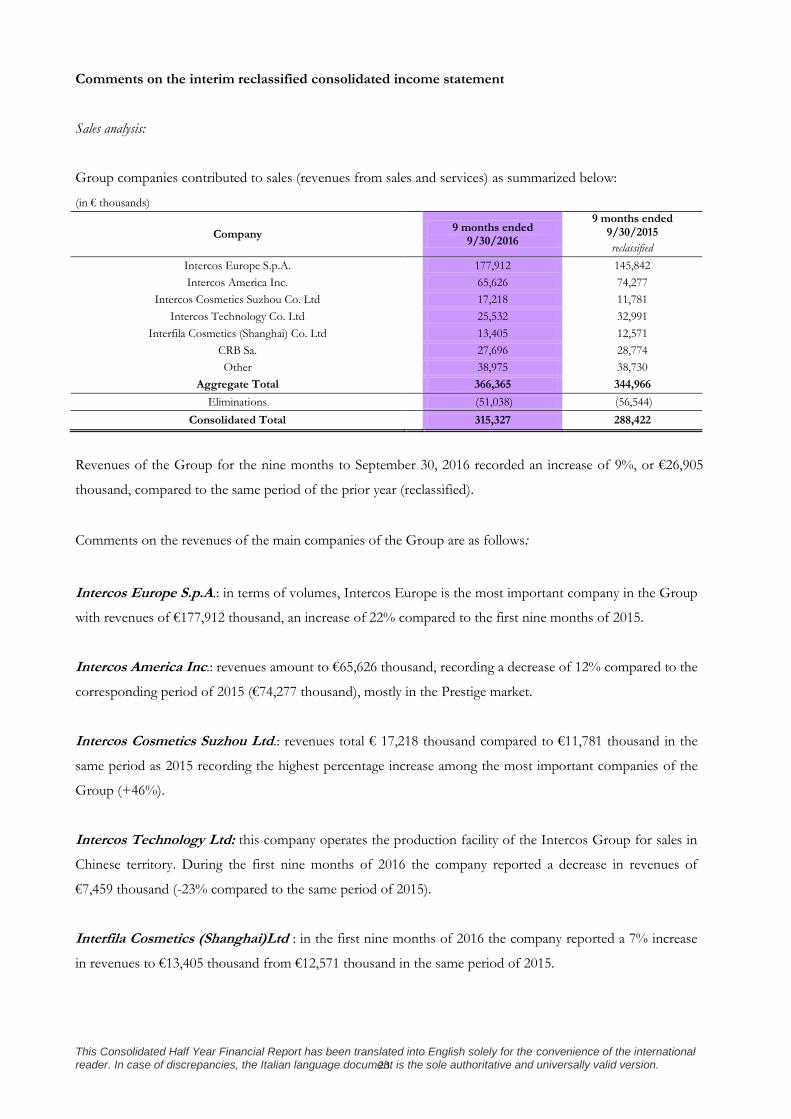
Comments on the interim reclassified consolidated income statement
Sales analysis:
Group companies contributed to sales (revenues from sales and services) as summarized below:
(in € thousands)
Company 9 months ended
9/30/2016
9 months ended 9/30/2015
reclassified
Intercos Europe S.p.A.
177,912 145,842
Intercos America Inc.
65,626 74,277
Intercos Cosmetics Suzhou Co. Ltd
17,218 11,781
Intercos Technology Co. Ltd
25,532 32,991
Interfila Cosmetics (Shanghai) Co. Ltd
13,405 12,571
CRB Sa.
27,696 28,774
Other
38,975 38,730
Aggregate Total
366,365 344,966
Eliminations (51,038) (56,544)
Consolidated Total 315,327 288,422
Revenues of the Group for the nine months to September 30, 2016 recorded an increase of 9%, or €26,905
thousand, compared to the same period of the prior year (reclassified).
Comments on the revenues of the main companies of the Group are as follows:
Intercos Europe S.p.A.: in terms of volumes, Intercos Europe is the most important company in the Group
with revenues of €177,912 thousand, an increase of 22% compared to the first nine months of 2015.
Intercos America Inc.: revenues amount to €65,626 thousand, recording a decrease of 12% compared to the
corresponding period of 2015 (€74,277 thousand), mostly in the Prestige market.
Intercos Cosmetics Suzhou Ltd.: revenues total € 17,218 thousand compared to €11,781 thousand in the
same period as 2015 recording the highest percentage increase among the most important companies of the
Group (+46%).
Intercos Technology Ltd: this company operates the production facility of the Intercos Group for sales in
Chinese territory. During the first nine months of 2016 the company reported a decrease in revenues of
€7,459 thousand (-23% compared to the same period of 2015).
Interfila Cosmetics (Shanghai)Ltd : in the first nine months of 2016 the company reported a 7% increase
in revenues to €13,405 thousand from €12,571 thousand in the same period of 2015.
This Consolidated Half Year Financial Report has been translated into English solely for the convenience of the international reader. In case of discrepancies, the Italian language document is the sole authoritative and universally valid version. 24
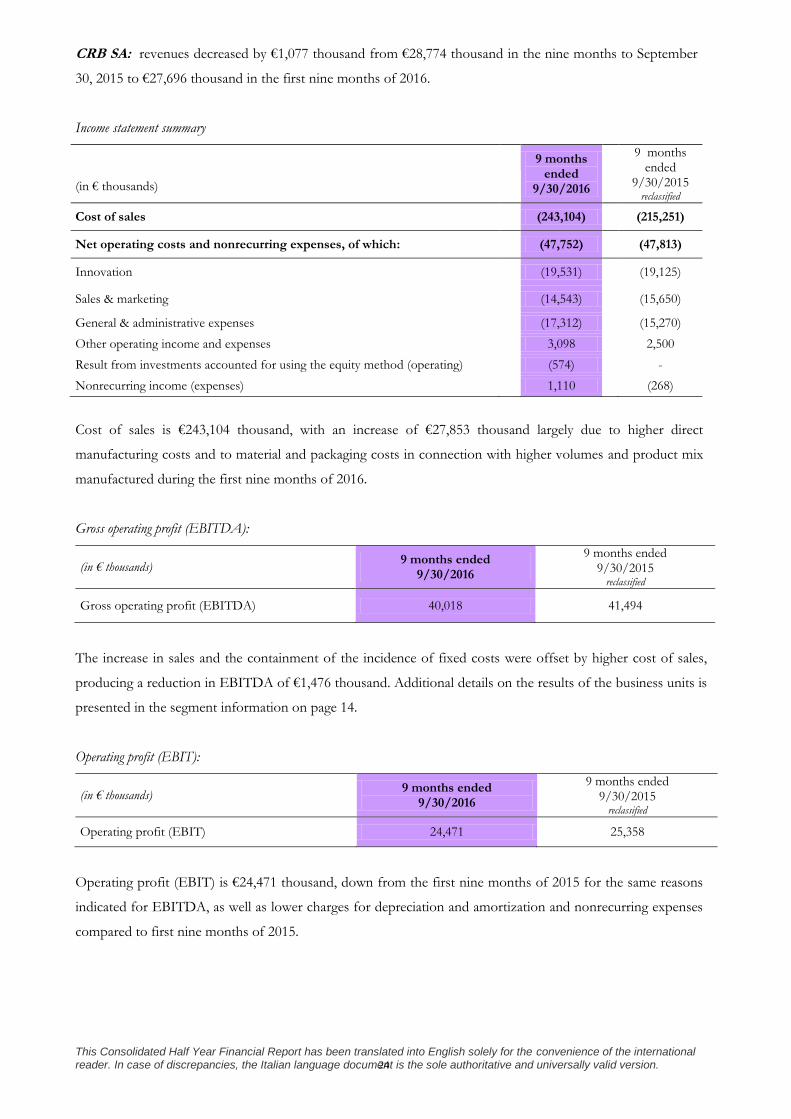
CRB SA: revenues decreased by €1,077 thousand from €28,774 thousand in the nine months to September
30, 2015 to €27,696 thousand in the first nine months of 2016.
Income statement summary
9 months
ended 9/30/2016
9 months ended
9/30/2015 reclassified
(in € thousands)
Cost of sales (243,104)
(215,251)
Net operating costs and nonrecurring expenses, of which: (47,752)
(47,813)
Innovation (19,531)
(19,125)
Sales & marketing (14,543)
(15,650)
General & administrative expenses (17,312)
(15,270)
Other operating income and expenses 3,098
2,500
Result from investments accounted for using the equity method (operating) (574)
-
Nonrecurring income (expenses) 1,110
(268)
Cost of sales is €243,104 thousand, with an increase of €27,853 thousand largely due to higher direct
manufacturing costs and to material and packaging costs in connection with higher volumes and product mix
manufactured during the first nine months of 2016.
Gross operating profit (EBITDA):
(in € thousands) 9 months ended
9/30/2016
9 months ended 9/30/2015
reclassified
Gross operating profit (EBITDA) 40,018 41,494
The increase in sales and the containment of the incidence of fixed costs were offset by higher cost of sales,
producing a reduction in EBITDA of €1,476 thousand. Additional details on the results of the business units is
presented in the segment information on page 14.
Operating profit (EBIT):
(in € thousands) 9 months ended
9/30/2016
9 months ended 9/30/2015
reclassified
Operating profit (EBIT) 24,471 25,358
Operating profit (EBIT) is €24,471 thousand, down from the first nine months of 2015 for the same reasons
indicated for EBITDA, as well as lower charges for depreciation and amortization and nonrecurring expenses
compared to first nine months of 2015.

This Consolidated Half Year Financial Report has been translated into English solely for the convenience of the international reader. In case of discrepancies, the Italian language document is the sole authoritative and universally valid version. 25
Profit before taxes (EBT):
(in € thousands) 9 months ended
9/30/2016
9 months ended 9/30/2015
reclassified
Profit before taxes (EBT) 16,632 14,895
Profit before taxes (EBT) is €16,632 thousand, with an increase compared to €14,895 thousand in the first
nine months of 2015 as a result of lower financial expenses.
Profit for the period:
(in € thousands) 9 months ended
9/30/2016
9 months ended 9/30/2015
reclassified
Profit for the period 8,697 7,561
The profit for the nine-month period is €8,697 thousand and an improvement over €7,561 thousand in the
same period of 2015 due to lower net expenses, which is reflected in the earnings per share.

This Consolidated Half Year Financial Report has been translated into English solely for the convenience of the international reader. In case of discrepancies, the Italian language document is the sole authoritative and universally valid version. 26
OUTLOOK
A substantially positive performance is expected for the full year 2016, in effect confirming the Group’s
expectations, as set out in the business plan.
NONRECURRING SIGNIFICANT EVENTS AND TRANSACTIONS
There were no nonrecurring significant events or transactions during the first nine months of 2016.
PREVEDIBILE EVOLUZIONE DELLA GESTIONE SIGNIFICANT EVENTS DURING THE FIRST NINE MONTHS OF 2016 AND SUBSEUQENT EVENTS
On January 19, 2016 Intercos S.p.A. (parent) signed an amicable settlement agreement with
Woojung Tech. Co., Ltd. and Mr Dong-Pil Choi to definitively close the dispute begun in September
2014 between the company and the latter, in relation to which a summons was filed by
Intercos S.p.A. for trade secret misappropriation before the Courts in Los Angeles, California.
On February 9, 2016 the board of directors of Intercos S.p.A. approved the transfer of the
company’s registered office from Milan, Piazza Eleonora Duse 2, to Milan, Piazza Generale
Armando Diaz 1, as did the subsidiaries Drop Nail S.r.l. (on February 15, 2016), and Intercos Europe
S.p.A. and Vitalab S.r.l. (on March 25, 2016).
On February 10, 2016 Drop Nail S.r.l.’s shareholder Paragon Cosmetics S.r.l. manifested its intent
to: 1) divest of its interest in the capital of Drop Nail S.r.l. through the sale of its 40% investment,
equal to a nominal amount of €20 thousand and 2) sell its remaining receivable due from Drop Nail
S.r.l., for the shareholder loans extended in the past, for a total amount of €1 thousand.
Intercos S.p.A, as part of its business plan aimed at strengthening its product range represented by
nail polishes and nail care products, purchased Paragon’s investment and receivable thus bringing its
investment to €1,187,488, representing 100% of the capital of the company Drop Nail S.r.l.
On May 2, 2016 a share capital increase was approved by Intercos Do Brasil Indùstria e Comércio
de Productos Cosmeticos LTDA (IDOBRASIL) for R$8,000,000 which was entirely subscribed to
and paid in by Intercos S.p.A. as the shareholder of IDOBRASIL.
Following the capital increase, the share capital of IDOBRASIL amounts to a total of R$30,377,143,
divided into 30,377,143 shares of R$1 each, held by the shareholders as follows: (a) Intercos S.p.A.
with 30,280,543 shares for a total of R$30,280,543; and (b) Intercos America Inc. with 96,600 shares
for a total of R$96,600.
This Consolidated Half Year Financial Report has been translated into English solely for the convenience of the international reader. In case of discrepancies, the Italian language document is the sole authoritative and universally valid version. 27
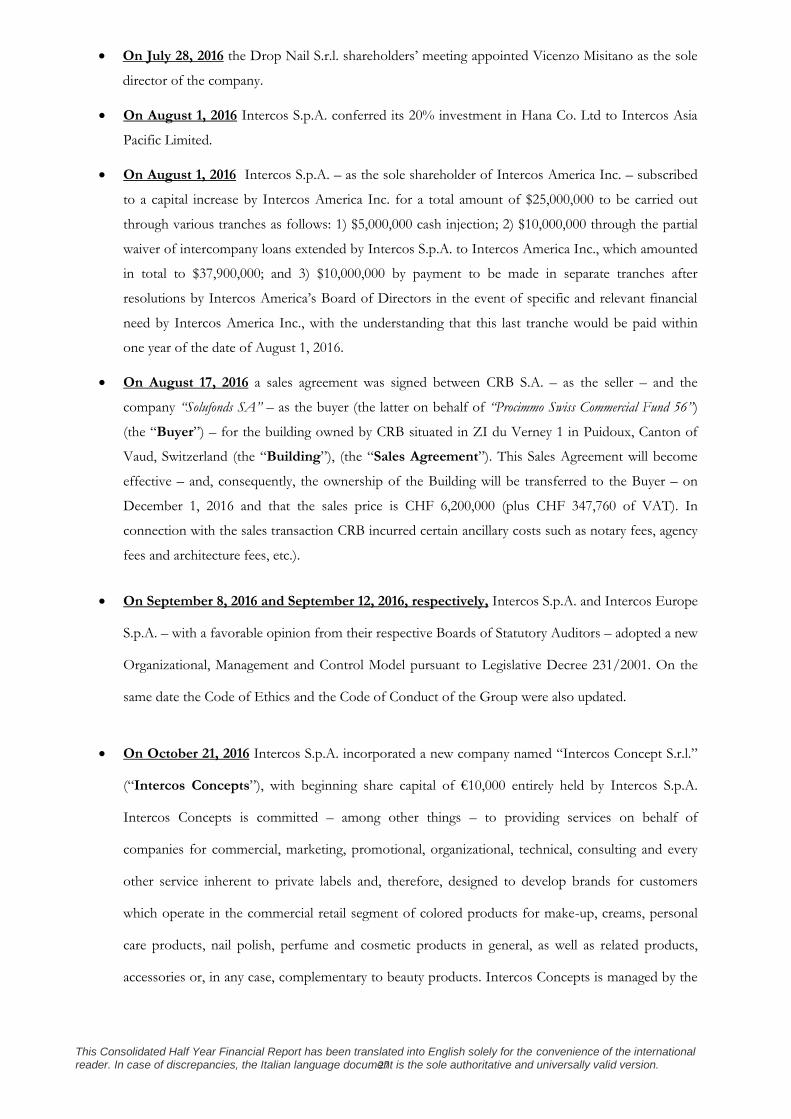
On July 28, 2016 the Drop Nail S.r.l. shareholders’ meeting appointed Vicenzo Misitano as the sole
director of the company.
On August 1, 2016 Intercos S.p.A. conferred its 20% investment in Hana Co. Ltd to Intercos Asia
Pacific Limited.
On August 1, 2016 Intercos S.p.A. – as the sole shareholder of Intercos America Inc. – subscribed
to a capital increase by Intercos America Inc. for a total amount of $25,000,000 to be carried out
through various tranches as follows: 1) $5,000,000 cash injection; 2) $10,000,000 through the partial
waiver of intercompany loans extended by Intercos S.p.A. to Intercos America Inc., which amounted
in total to $37,900,000; and 3) $10,000,000 by payment to be made in separate tranches after
resolutions by Intercos America’s Board of Directors in the event of specific and relevant financial
need by Intercos America Inc., with the understanding that this last tranche would be paid within
one year of the date of August 1, 2016.
On August 17, 2016 a sales agreement was signed between CRB S.A. – as the seller – and the
company “Solufonds SA” – as the buyer (the latter on behalf of “Procimmo Swiss Commercial Fund 56”)
(the “Buyer”) – for the building owned by CRB situated in ZI du Verney 1 in Puidoux, Canton of
Vaud, Switzerland (the “Building”), (the “Sales Agreement”). This Sales Agreement will become
effective – and, consequently, the ownership of the Building will be transferred to the Buyer – on
December 1, 2016 and that the sales price is CHF 6,200,000 (plus CHF 347,760 of VAT). In
connection with the sales transaction CRB incurred certain ancillary costs such as notary fees, agency
fees and architecture fees, etc.).
On September 8, 2016 and September 12, 2016, respectively, Intercos S.p.A. and Intercos Europe
S.p.A. – with a favorable opinion from their respective Boards of Statutory Auditors – adopted a new
Organizational, Management and Control Model pursuant to Legislative Decree 231/2001. On the
same date the Code of Ethics and the Code of Conduct of the Group were also updated.
On October 21, 2016 Intercos S.p.A. incorporated a new company named “Intercos Concept S.r.l.”
(“Intercos Concepts”), with beginning share capital of €10,000 entirely held by Intercos S.p.A.
Intercos Concepts is committed – among other things – to providing services on behalf of
companies for commercial, marketing, promotional, organizational, technical, consulting and every
other service inherent to private labels and, therefore, designed to develop brands for customers
which operate in the commercial retail segment of colored products for make-up, creams, personal
care products, nail polish, perfume and cosmetic products in general, as well as related products,
accessories or, in any case, complementary to beauty products. Intercos Concepts is managed by the

This Consolidated Half Year Financial Report has been translated into English solely for the convenience of the international reader. In case of discrepancies, the Italian language document is the sole authoritative and universally valid version. 28
sole director, Renato Semerari, born in Busto Arsizio (Varese) on July 30, 1961, Tax Code number
SMR RNT 61L30 B300R.
On October 21, 2016 the Intercos S.p.A. shareholders’ meeting, in order to render the company’s
management more efficient, modified the corporate charter, increasing the possible number of
members of the Board of Directors from 5 to 7, and appointing new members to the Board: Paolo
Valsecchi, the C.O.O, among other things, of the Intercos Group and a representative of the
company holding important powers in vast areas of the company’s business, and the aforementioned
Renato Semerari.
On November 1, 2016 Intercos S.p.A. announced the postponement, until spring 2018, of the
project to list the Hong Kong holding company, Hong Kong Intercos Asia Pacific, and Asian
subsidiaries of the Group.

This Consolidated Half Year Financial Report has been translated into English solely for the convenience of the international reader. In case of discrepancies, the Italian language document is the sole authoritative and universally valid version. 29
INTERCOS GROUP Global Cosmetic Manufacturer
INTERIM CONSOLIDATED FINANCIAL
STATEMENTS
AT SEPTEMBER 30, 2016
This Consolidated Half Year Financial Report has been translated into English solely for the convenience of the international reader. In case of discrepancies, the Italian language document is the sole authoritative and universally valid version. 30
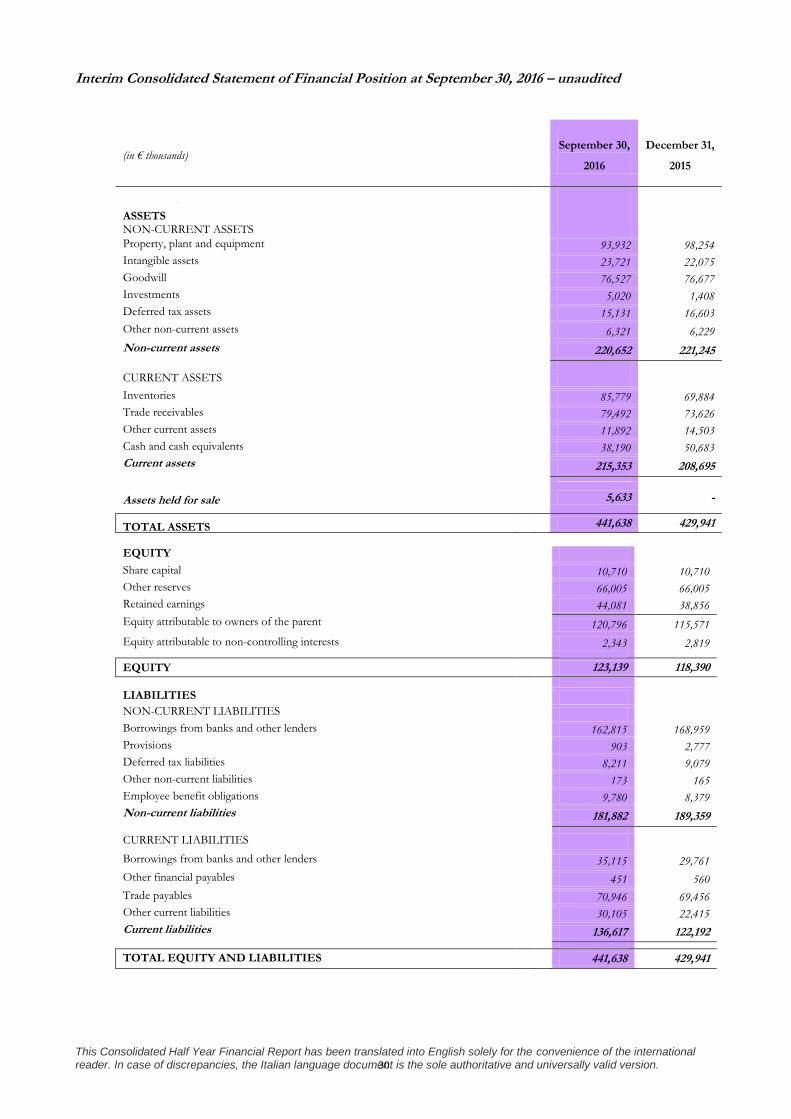
Interim Consolidated Statement of Financial Position at September 30, 2016 – unaudited
(in € thousands) September 30,
2016
December 31,
2015
ATTIVITÀ
ASSETS
NON-CURRENT ASSETS
Property, plant and equipment
93,932 98,254
Intangible assets
23,721 22,075
Goodwill
76,527 76,677
Investments
5,020 1,408
Deferred tax assets
15,131 16,603
Other non-current assets
6,321 6,229
Non-current assets
220,652 221,245
CURRENT ASSETS
Inventories
85,779 69,884
Trade receivables
79,492 73,626
Other current assets
11,892 14,503
Cash and cash equivalents
38,190 50,683
Current assets
215,353 208,695
Assets held for sale 5,633 -
TOTAL ASSETS 441,638 429,941
EQUITY
Share capital
10,710 10,710
Other reserves
66,005 66,005
Retained earnings
44,081 38,856
Equity attributable to owners of the parent
120,796 115,571
Equity attributable to non-controlling interests
2,343 2,819
EQUITY 123,139 118,390
LIABILITIES
NON-CURRENT LIABILITIES
Borrowings from banks and other lenders
162,815 168,959
Provisions
903 2,777
Deferred tax liabilities
8,211 9,079
Other non-current liabilities
173 165
Employee benefit obligations
9,780 8,379
Non-current liabilities
181,882 189,359
CURRENT LIABILITIES
Borrowings from banks and other lenders
35,115 29,761
Other financial payables
451 560
Trade payables
70,946 69,456
Other current liabilities
30,105 22,415
Current liabilities
136,617 122,192
-
TOTAL EQUITY AND LIABILITIES 441,638 429,941

This Consolidated Half Year Financial Report has been translated into English solely for the convenience of the international reader. In case of discrepancies, the Italian language document is the sole authoritative and universally valid version. 31
Interim Consolidated Income Statement for the nine months ended September 30, 2016 - unaudited
(in € thousands)
9 months ended September 30,
2016
9 months ended September 30,
2015 reclassified
Revenues
315,327 288,422
Cost of sales
(243,104) (215,251)
Gross industrial margin
72,223 73,171
Research & Development and innovation costs
(19,531) (19,125)
Selling expenses
(14,543) (15,650)
General and administrative expenses
(17,312) (15,270)
Other operating income (expenses)
3,098 2,500
Result from investments accounted for using the equity method (operating)
(574) 0
Nonrecurring expenses
1,110 (268)
Operating profit (EBIT)
24,471 25,358
Financial income
3,547 7,211
Financial expenses
(11,415) (17,789)
Result from investments accounted for using the equity method
29 116
Profit before tax (EBT)
16,632 14,895
Income taxes
(7,934) (7,335)
Profit for the period 8,697 7,561
Attributable to - owners of the parent 8,380 7,522
- non-controlling interests 317 39
Earnings per share ^ Basic and diluted
0.10 0.08
^ Earnings per share restated
Interim Consolidated Statement of Comprehensive Income for the nine months ended September 30, 2016 - unaudited
- u
d
(in € thousands)
9 month ended September 30,
2016
9 months ended to September
30, 2015 reclassified
Profit for the period 8,697 7,561
Other comprehensive income that will not be reclassified subsequently to the income statement, net of tax effect - Actuarial gains (losses) on remeasurement of employee defined benefit plans
(1,277) (238)
- Tax effect
425 (9)
Total (852) (247)
Other comprehensive income that will be reclassified subsequently to the income statement, net of tax effect - Exchange differences on translating foreign operations
(1,983) 4,958
Total (1,983) 4,958
Comprehensive income for the period 5,862 12,272
Attributable to:
- owners of the parent 5,716 12,173
- non-controlling interests 146 99

This Consolidated Half Year Financial Report has been translated into English solely for the convenience of the international reader. In case of discrepancies, the Italian language document is the sole authoritative and universally valid version. 32
Interim Consolidated Statement of Changes in Equity at September 30, 2016 - unaudited
(in € thousands) RETAINED EARNIGS
ATTRIBUTABLE TO NON
CONTROLLING INTERESTS
Description Share capital
Other reserves (Share
premium reserve)
Reserves and
retained earnings
Profit (loss) for the period
Share capital
Profit (loss) for
the period Total
Balances at 12/31/2015 10,710 66,005 18,064 20,792 2,599 220 118,390
Appropriation of 2015 profit 20,792 (20,792) 220 (220) -
Exchange differences on translating foreign operations
(1,827) (156) (1,983)
Remeasurement of employee defined benefit plans (OCI)
(838) (14) (852)
Consolidation reserve (491) (623) (1,114)
Profit for the nine months ended September 30, 2016
8,380 317 8,697
Balances at September 30, 2016
10,710 66,005 38,365 5,716 2,197 146 123,139

This Consolidated Half Year Financial Report has been translated into English solely for the convenience of the international reader. In case of discrepancies, the Italian language document is the sole authoritative and universally valid version. 33
Interim Consolidated Statement of Cash Flows for the nine months ended September 30, 2016 - unaudited
(in € thousands) 9 months ended
September 30, 2016 9 months ended
September 30, 2015
reclassified
Profit from continuing operations
8,697
7,561
Profit for the period attributable to owners of the parent
8,697
7,561
Depreciation, amortization and impairment reversals (losses)
15,336
15,822
Other operating income (expenses)
(423)
Nonrecurring income (expenses)
(1,110)
268
Change in provisions
(216)
(2,974)
Financial income (expenses)
7,868
10,578
Decrease / (Increase) in inventories
(16,608)
(7,775)
Decrease / (Increase) in trade receivables, net
(6,860)
598
Increase / (Decrease) in trade payables
2,047
(4,860)
Decrease / (Increase) in other assets
5,628
4,368
Increase / (Decrease) in other payables
7,157
4,656
Cash flows provided by (used in) operating activities ( a )
21,518
28,242
Acquisition of property, plant and equipment, net
(14,764)
(8,463)
Acquisition of intangible assets, net
(5,561)
(4,127)
Acquisitions of investments
(3,612)
(971)
Cash flows (used in) investing activities ( b )
(23,937)
(13,561)
Increase / (Decrease) in borrowings from banks and other lenders
(1,978)
(8,808)
Interest paid during the period
(6,230)
(5,473)
Cash flows provided by (used in) financing activities ( c )
(8,207)
(14,281)
Change in equity (d)
(1,114)
(317)
Net increase (decrease) in cash and cash equivalents ( a )+( b )+( c )+( d )
(11,743)
82
Cash and cash equivalents at beginning of the year
50,683
32,727
Translation exchange differences
751
(898)
Cash and cash equivalents at end of the period
38,190
33,707
Net increase (decrease) in cash and cash equivalents during the period
(11,743)
82


