
RESEARCH ARTICLE Panigrahy et.al / IJIPSR / 2 (6), 2014, 1192-1206
Department of Pharmaceutical Analysis ISSN (online) 2347-2154
Available online: www.ijipsr.com June Issue 1192
DEVELOPMENT AND VALIDATION OF STABILITY INDICATING
METHOD FOR SIMULTANEOUS ESTIMATION OF FAMOTIDINE
AND DOMPERIDONE IN BULK AND TABLET DOSAGE FORM
USING RP-HPLC
1Uttam Prasad Panigrahy
*,
2A. Sunil Kumar Reddy
1Department of Pharmaceutical Analysis and Quality Assurance, Malla Reddy College
Pharmacy, Secunderabad, INDIA 2
Department of Pharmaceutical Chemistry, Bharat Institute of Technology-Pharmacy,
Ibrahimpatnam, Hyderabad-501510, INDIA
Corresponding Author:
Uttam Prasad Panigrahy
Department Of Pharmaceutical Analysis and Quality Assurance
Malla Reddy College Pharmacy, Secunderabad, INDIA
Email: [email protected]
Phone: +919640020286
International Journal of Innovative
Pharmaceutical Sciences and Research www.ijipsr.com
Abstract
A novel method for the simultaneous estimation of Famotidine and Domperidone tablet in combined dosage form was
developed and validated by reverse phase high performance liquid chromatography. The determination was performed
on a Symmetry C18 column (250mm x 4.6mm ID, 5µm particle size) and the mobile phase consisting of a mixture of
0.002M Sodium dihydrogen phosphate buffer (pH adjusted to 5.8 with Orthophosphoric acid) and Acetonitrile (60:40,
v/v) was delivered at a flow rate of 1 ml/min and detector wavelength at 287nm. The retention time of Famotidine and
Domperidone was found to be 3.216 and 5.762min respectively. The linearity for Famotidine and Domperidone was
obtained in the concentration range of 5-30µg/ml and 2.5-15µg/ml with correlation coefficients (r2) of the regression
equations greater than 0.999 in all cases respectively. Results of assay and recovery studies were statistically evaluated
for its accuracy and precision as per ICH guidelines. Famotidine and Domperidone API and market formulation were
subjected to acid and alkali hydrolysis, thermal and photolytic forced degradation. The peak purity of drug substance
and drug product peak also confirmed the specificity of the method with respect to the degradation products. In the
forced degradation study Famotidine and Domperidone showed maximum degradation in basic hydrolysis stress study
followed by less degradation in acid, thermal and photolytic degradation. The developed method was simple, specific,
sensitive, rapid, and economic and can be used for estimation of Famotidine and Domperidone in bulk and their
combined dosage form for routine analysis and stability studies.
Key words: Famotidine, Domperidone, Method validation, RP-HPLC, Forced degradation, ICH.

RESEARCH ARTICLE Panigrahy et.al / IJIPSR / 2 (6), 2014, 1192-1206
Department of Pharmaceutical Analysis ISSN (online) 2347-2154
Available online: www.ijipsr.com June Issue 1193
INTRODUCTION
Famotidine (Fig.1) is chemically known as 3-([2-(diaminomethyleneamino) thiazol- 4-yl] methyl
thio) - N'-sulfamoylpropanimidamide is used in the treatment of peptic ulcer and gastro
esophageal disease [1]. Domperidone (Fig. 2) is chemically known as 5-chloro-1-(1-[3-(2-oxo-2,
3-dihydro-1H-benzo[d]imidazol-1-yl) propyl] piperidin-4-yl)-1H-benzo[d]imidazol-2(3H)-one
is used in the treatment of gastro esophageal reflux disease [2]. Literature survey reveals
Spectrophotometry [3, 4], derivative Spectrophotometry [5, 6], RP-HPLC [7, 8, 9], HPTLC [10]
methods have been reported as a single as well as combination with other drugs. However, there
is few work was reported for the simultaneous estimation of these drugs by RP-HPLC method.
Hence, in the present study an attempt has been made to develop simple, accurate, sensitive,
precise and repeatable RP-HPLC method, for the simultaneous estimation of both drugs in tablet
dosage form with degradation studies.
Fig. 1: Structure of Famotidine Fig. 2: Structure of Domperidone
MATERIALS & METHODS
Apparatus
The chromatography was performed on a Waters 515 HPLC system, equipped with 2998 PDA
detector and Empower 2 software, Symmetry C18 column (250mm x 4.6mm ID, 5µm) was used
as stationary phase. Semi-micro analytical balance (India), an Ultrasonic bath sonicator
(Frontline FS 4, Mumbai, India) and Whatmann filter paper No. 41 (Whatmann International
Ltd., England) were used in the study.
Reagents and materials
Famotidine and Domperidone bulk powder was obtained from Kekule Pharma Ltd., Hyderabad
and NMR Drugs Private Ltd., India respectively. The commercial fixed dose combination
product Dompon-F tablet was procured from the Finecure Pharmaceuticals Limited, India.
Acetonitrile (HPLC grade, Merck, India), Sodium dihydrogen phosphate buffer (AR, Finar

RESEARCH ARTICLE Panigrahy et.al / IJIPSR / 2 (6), 2014, 1192-1206
Department of Pharmaceutical Analysis ISSN (online) 2347-2154
Available online: www.ijipsr.com June Issue 1194
Reagent, Ahmedabad, India), Ortho phosphoric acid (AR, Finar Reagent, Ahmedabad, India) and
purified water (HPLC grade, Rankem, India) was used in the study.
Chromatographic condition
In this work a reverse phase Symmetry C18 column (250mm x 4.6mm ID, 5µm) was used as a
stationary phase and a mobile phase consisting of a mixture of 0.002M Sodium dihydrogen
phosphate buffer (pH adjusted to 5.8 with Orthophosphoric acid) and Acetonitrile (60:40, v/v)
was delivered at a flow rate of 1 ml/min and detector wavelength at 287nm.
Preparation of mobile phase
Solution A
Accurately weighed about 0.312 grams of Sodium dihydrogen phosphate was taken into a
1000ml beaker and dissolved and diluted to 1000ml with HPLC grade water and degassed in
ultrasonic water bath and filtered through 0.45µm filter using vacuum filtration and the pH of 5.8
was adjusted by using ortho phosphoric acid.
Solution B
Acectonitrile HPLC grade
Mobile phase
Volume of solution (A) and Solution (B) taken in the ratio 60:40 (v/v) and mixed well and
filtered through 0.45 µm membrane filter and degas for 10 minutes.
Preparation of standard stock solutions
An accurately weighed 20 mg of Famotidine and 10mg of Domperidone were transferred to 100
ml volumetric flask, dissolved in 50 ml with Mobile phase and sonicated to dissolve it
completely and diluted up to mark with Mobile phase to get 200 µg/ml solution of Famotidine
and 100µg/ml solution of Domperidone.
Method Validation
The method was validated in compliance with ICH guidelines [11]
Preparation of calibration curve
Aliquots of 0.25,0.5,0.75,1,1.25 and 1.5ml of mixed standard working solutions (equivalent to
5,10,15,20,25 and 30µg/ml of Famotidine and 2.5,5,7.5,10,12.5 and15µg/ml of Domperidone)
were transferred in a series of 10 ml volumetric flasks, and the volume was made up to the mark
with Mobile phase. Each solution was injected under the operating chromatographic condition
as described above and responses were recorded. Calibration curves were constructed by

RESEARCH ARTICLE Panigrahy et.al / IJIPSR / 2 (6), 2014, 1192-1206
Department of Pharmaceutical Analysis ISSN (online) 2347-2154
Available online: www.ijipsr.com June Issue 1195
plotting the peak areas versus the concentration, and the regression equations were calculated
(Table 1 and Table 2) and (Fig. 3 and Fig. 4). Each response was average of three
determinations.
Table 1: Linearity of Famotidine Table 2: Linearity of Domperidone
Fig. 3: Linearity of Famotidine Fig. 4: Linearity of Domperidone
Accuracy (recovery study)
The accuracy of the method was determined by calculating the recoveries of Famotidine and
Domperidone by the standard addition method. Known amounts of standard solutions of
Famotidine and Domperidone were added at 50, 100 and 150 % level to pre-quantified sample
solutions of Dompon-F tablet.
Preparation of Standard Stock Solution
Accurately weighed 20mg of Famotidine and 10mg of Domperidone working standard were
taken into 100ml clean dry volumetric flasks, mobile phase was added and sonicated to dissolve
it completely and volume was made up to the mark with the mobile phase. 1ml was pipette out
from the above Famotidine and Domperidone stock solutions into a 10ml volumetric flask and
Concentration
(µg/ml)
Peak Area
5 337138
10 651929
15 983591
20 1318503
25 1655865
30 1993676
Concentration
(µg/ml) Peak Area
2.5 84256
5 163706
7.5 246929
10 331588
12.5 416755
15 505138

RESEARCH ARTICLE Panigrahy et.al / IJIPSR / 2 (6), 2014, 1192-1206
Department of Pharmaceutical Analysis ISSN (online) 2347-2154
Available online: www.ijipsr.com June Issue 1196
diluted up to the mark with mobile phase to get a concentration of 20µg/ml solution of
Famotidine and 10µg/ml solution of Domperidone.
Preparation Sample Solutions
For preparation of 50% solution (With respect to target Assay concentration)
Tablet powder equivalent to 10 mg of Famotidine and 5mg of Domperidone sample was taken
into 100ml clean dry volumetric flask, mobile phase was added and sonicated to dissolve it
completely and volume was made up to the mark with the same solvent. 1ml of above solution
was pipetted out into 10ml volumetric flask and made up to the mark with mobile phase to get a
concentration of 10µg/ml solution of Famotidine and 5µg/ml solution of Domperidone.
For preparation of 100% solution (With respect to target Assay concentration)
Tablet powder equivalent to 20 mg of Famotidine and 10mg of Domperidone sample was taken
into 100ml clean dry volumetric flask, mobile phase was added and sonicated to dissolve it
completely and volume was made up to the mark with the same solvent. 1ml of above solution
was pipetted out into 10ml volumetric flask and made up to the mark with mobile phase to get a
concentration of 20µg/ml solution of Famotidine and 10µg/ml solution of Domperidone.
For preparation of 150% solution (With respect to target Assay concentration)
Tablet powder equivalent to 30 mg of Famotidine and 15mg of Domperidone sample was taken
into 100ml clean dry volumetric flask, mobile phase was added and sonicated to dissolve it
completely and volume was made up to the mark with the same solvent. 1ml of above solution
was pipetted out into 10ml volumetric flask and made up to the mark with mobile phase to get a
concentration of 30µg/ml solution of Famotidine and 15µg/ml solution of Domperidone. The
amounts of Famotidine and Domperidone were estimated by applying obtained values to the
respective regression line equations (Table 3).
Method precision (Repeatability)
Tablet powder equivalent to 20mg of Famotidine and 10mg of Domperidone sample was taken
into 100ml clean dry volumetric flask, mobile phase was added and sonicated to dissolve it
completely and volume was made up to the mark with the same mobile phase. 1ml of above
solution was pipetted out into 10ml volumetric flask and made up to the mark with mobile phase
to get a concentration of 20µg/ml solution of Famotidine and 10µg/ml solution of Domperidone.
A homogenous sample of a single batch analysed six times and was checked whether the method
is giving consistent results. The %RSD for the area of six replicate injections was calculated as
mentioned in Table 3. The system precision was carried out to ensure that the analytical system

RESEARCH ARTICLE Panigrahy et.al / IJIPSR / 2 (6), 2014, 1192-1206
Department of Pharmaceutical Analysis ISSN (online) 2347-2154
Available online: www.ijipsr.com June Issue 1197
is working properly. The Standard preparation was injected six times into the HPLC and the
%RSD for the area of six replicate injections was calculated as mentioned in Table 3.
Intermediate precision/ruggedness:
The intermediate precision (also known as Ruggedness) of the method was evaluated by
performing precision on different days by different analysts. Tablet powder equivalent to 20 mg
of Famotidine and 10mg of Domperidone sample was taken into 100ml clean dry volumetric
flask, mobile phase was added and sonicated to dissolve it completely and volume was made up
to the mark with the mobile phase. 1ml of above solution was pipetted out into 10ml volumetric
flask and made up to the mark with mobile phase to get a concentration of 20µg/ml of
Famotidine and 10µg/ml of Domperidone. The sample solution was injected for six times and the
area for all six injections was measured in HPLC. The %RSD for the area of six replicate
injections was calculated. As mentioned in Table 3.
Table 3: Summary of Validation Parameter for Famotidine and Domperidone
Parameters RP-HPLC method
Famotidine Domperidone
Concentration range (µg/ml) 5-30 2.5-15
Slope 66454 33694
Intercept 6157 3426
Correlation coefficient 0.999 0.999
LOD (µg/ml ) 0.33 0.21
LOQ (µg/ml) 1.02 0.63
Repeatability
(% RSD, n=6) 0.51 0.64
Ruggedness
(% RSD, n=6) 0.5 0.47
System precision
(% RSD, n=6) 0.42 0.63
Accuracy± % RSD 99.62± 0.17% 99.73± 0.32%
Robustness:
As part of the Robustness, deliberate change in the flow rate, mobile phase composition rate
of ±10% was made to evaluate the impact on the method. The results reveal that the method
is robust. The results are summarized in Table 4, 5, 6 and 7.

RESEARCH ARTICLE Panigrahy et.al / IJIPSR / 2 (6), 2014, 1192-1206
Department of Pharmaceutical Analysis ISSN (online) 2347-2154
Available online: www.ijipsr.com June Issue 1198
Table 4: Summary of Robustness (Change in Flow Rate) For Famotidine
Flow rate
(ml/min)
System Suitability Results % Assay
(n=3)
%RSD
USP Plate Count USP Tailing
0.9 2555 1.15 99.61 0.35
1.0 3674 1.21 99.70 0.30
1.1 3057 1.12 99.85 0.18
Table 5: Summary of Robustness (Change in Flow Rate) For Domperidone
Flow rate
(ml/min)
System Suitability Results % Assay
(n=3)
%RSD
USP Plate Count USP Tailing
0.9 6975 1.19 99.46 0.21
1.0 7645 1.15 99.24 1.2
1.1 7647 1.19 99.81 0.26
Table 6: Summary of Robustness (Change in Organic Phase) For Famotidine
Change in Organic
phase Composition in
the mobile phase
System Suitability Results % Assay
(n=3)
%RSD USP Plate
Count USP Tailing
10% less 2994 1.37 99.63 0.12
*Actual 3674 1.21 99.70 0.30
10% more 3003 1.15 99.77 0.21

RESEARCH ARTICLE Panigrahy et.al / IJIPSR / 2 (6), 2014, 1192-1206
Department of Pharmaceutical Analysis ISSN (online) 2347-2154
Available online: www.ijipsr.com June Issue 1199
Table 7: Summary of Robustness (Change in Organic Phase) For Domperidone
Change in Organic
phase Composition in
the mobile phase
System Suitability Results % Assay
(n=3)
%RSD USP Plate
Count USP Tailing
10% less 7632 1.17 99.43 0.16
*Actual 7645 1.15 99.24 1.2
10% more 7179 1.05 99.75 0.23
System Suitability
Tailing factor for the peaks of Famotidine and Domperidone should be less than 1.5. Theoretical
plates for the Famotidine and Domperidone peaks should be more than 2000. (Table 8).
Table 8: System Suitability Test Parameters for Famotidine and Domperidone
Parameter Famotidine Domperidone
Retention Time (Mins) 3.216 5.762
Theoretical plates 3674 7645
Tailing factor 1.21 1.15
Resolution 10.10
Preparation of Marketed sample solution for Assay: Twenty tablets were accurately weighed
and powdered and powder equivalent to 20 mg of Famotidine and 10mg of Domperidone sample
were taken into 100ml clean dry volumetric flasks, mobile phase was added and sonicated to
dissolve it completely and volume was made up to the mark with the same mobile phase. 1ml
was pipette out from the above Famotidine and Domperidone stock solutions into a 10ml
volumetric flask and diluted up to the mark with mobile phase to get a concentration of 20µg/ml
solution of Famotidine and 10µg/ml solution of Domperidone. 20 L of the standard, sample
were injected into the chromatographic system and the areas was measured for the Famotidine
and Domperidone and the % Assay was calculated by comparing the peak area of standard and
sample chromatogram was shown in Table 9 and Fig 5 and 6.

RESEARCH ARTICLE Panigrahy et.al / IJIPSR / 2 (6), 2014, 1192-1206
Department of Pharmaceutical Analysis ISSN (online) 2347-2154
Available online: www.ijipsr.com June Issue 1200
Fig. 5: standard chromatogram of Famotidine and Domperidone
Fig. 6: sample chromatogram of Famotidine and Domperidone
Table 9: Analysis of Marketed Formulation of Famotidine and Domperidone
Label Claim (mg) Amount Found (mg) % Label Claim ± % RSD
(n=3)
Famotidine Domperidone Famotidine Domperidone Famotidine Domperidone
20 10 19.94 9.924 99.70±0.30 99.24±1.2

RESEARCH ARTICLE Panigrahy et.al / IJIPSR / 2 (6), 2014, 1192-1206
Department of Pharmaceutical Analysis ISSN (online) 2347-2154
Available online: www.ijipsr.com June Issue 1201
RESULTS AND DISCUSSION
To optimize the RP-HPLC parameters, several mobile phase compositions were tried. A
satisfactory separation and good peak symmetry for Famotidine and Domperidone were obtained
with a mobile phase containing a mixture of 0.01M Sodium dihydrogen phosphate buffer (pH
adjusted to 5.8 with Orthophosphoric acid) and Acetonitrile (60:40, v/v) was delivered at a flow
rate of 1 ml/min to get better reproducibility and repeatability. Quantification was achieved with
PDA detection at 287nm based on peak area. The retention time of Famotidine and Domperidone
was found to be 3.216 and 5.762min respectively (Fig. 5). Linear correlation was obtained
between peak area versus concentrations of Famotidine and Domperidone in the concentration
ranges of concentration range of 5-30 µg/ml and 2.5-15µg/ml are r2=0.999 and r
2=0.999 and
mean accuracies 99.62± 0.17% and 99.73± 0.32% for Famotidine and Domperidone, which
indicates accuracy of the proposed method. The % RSD values for Famotidine and Domperidone
were found to be < 2 %, which indicates that the proposed method is repeatable. The % RSD
values of repeatability are 0.51% and 0.64% for Famotidine and Domperidone respectively and
% RSD values of system precision are 0.42% and 0.63% for Famotidine and Domperidone
respectively. The % RSD values of ruggedness are 0.5% and 0.47% for Famotidine and
Domperidone respectively, reveal that the proposed method is precise. LOD values for
Famotidine and Domperidone were found to be 0.33µg/ml and 0.21µg/ml, respectively and LOQ
values for Famotidine and Domperidone were found to be 1.02µg/ml and 0.63µg/ml,
respectively (Table 3). The % RSD values for Famotidine and Domperidone were found to be <
2 %, which indicates that the proposed method is robust (Table 4, 5, 6 and 7). These data show
that the proposed method is sensitive for the determination of Famotidine and Domperidone. The
results of system suitability testing are given in (Table 8). Degradation study [12] of
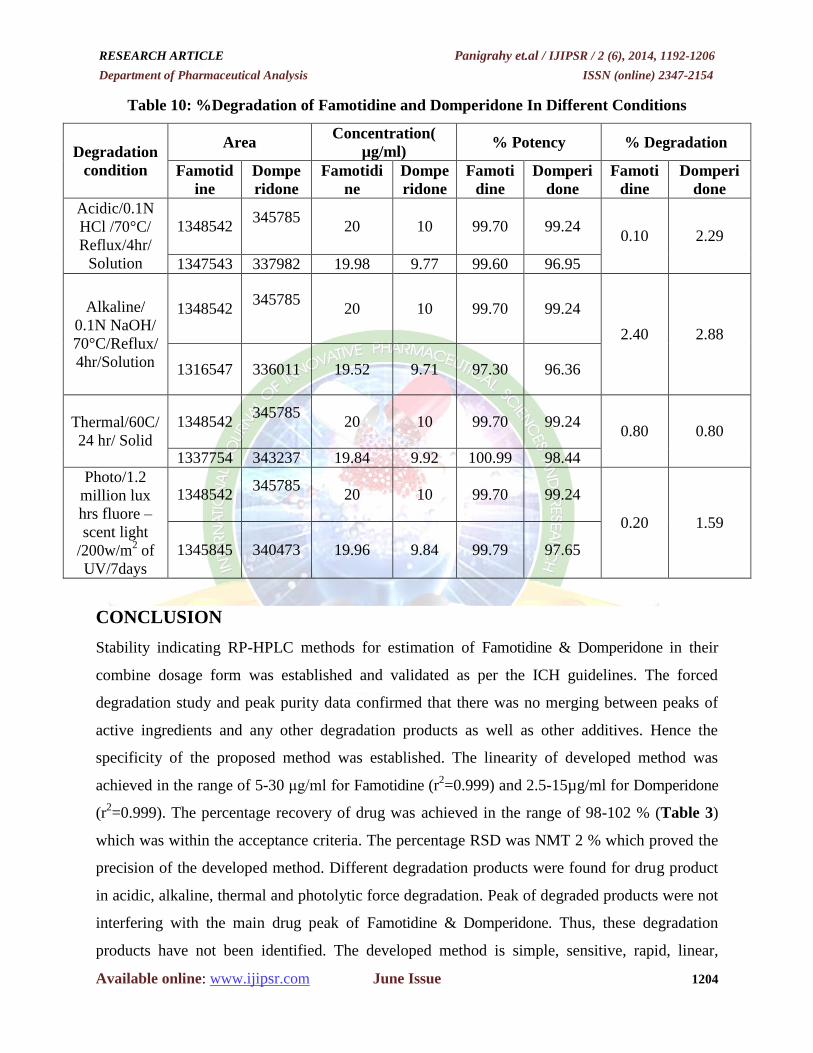
Famotidine and Domperidone in 0.1N HCl at 70°C for 4 hours in reflux condition:
Famotidine and Domperidone peak was observed at retention time 3.193 min and 5.211 min
respectively (Fig. 7). The % drug degradation observed of Famotidine and Domperidone was
0.10 % and 2.29 % respectively (Table 10). From this it is observed that Famotidine and
Domperidone showed less degradation in acid hydrolysis degradation condition.

RESEARCH ARTICLE Panigrahy et.al / IJIPSR / 2 (6), 2014, 1192-1206
Department of Pharmaceutical Analysis ISSN (online) 2347-2154
Available online: www.ijipsr.com June Issue 1202
Fig. 7: Acid hydrolysis of Famotidine and Domperidone
Degradation study of Famotidine and Domperidone in 0.1N NaOH at 70°C for 4 hours in
reflux condition: Famotidine and Domperidone peak was observed at retention time 3.206 min
and 5.696 min respectively (Fig. 8). The % drug degradation observed of Famotidine and
Domperidone was 2.40 % and 2.88 % respectively (Table 10). From this it is observed that
Famotidine and Domperidone showed maximum degradation in base hydrolysis degradation
condition.
Fig. 8: Base hydrolysis of Famotidine and Domperidone
Thermal Degradation study of Famotidine and Domperidone at 60°C for about 24 hrs:
Thermal degradation of Famotidine and Domperidone at 60°C for about 24 hrs in hot air oven
was carried out. There was no degradation peak found in thermal degradation chromatogram
because there was lower degradation found in thermal degradation study. % Degradation of

RESEARCH ARTICLE Panigrahy et.al / IJIPSR / 2 (6), 2014, 1192-1206
Department of Pharmaceutical Analysis ISSN (online) 2347-2154
Available online: www.ijipsr.com June Issue 1203
Famotidine and Domperidone was found to be 0.80 % and 0.80 % respectively. (Fig. 9 and
Table 10).
Fig. 9: Thermal degradation of Famotidine and Domperidone
Photolytic Degradation study of Famotidine and Domperidone: Sample and drug substances
were exposed to energy of 1.2 million lux hrs fluorescent light and 200 w/m2 of UV for about 7
days. % degradation of Famotidine and Domperidone was found to be 0.20 % and 1.59 %
respectively (Fig. 10 and Table 10).
Fig. 10: Photo stability of Famotidine and Domperidone
RESEARCH ARTICLE Panigrahy et.al / IJIPSR / 2 (6), 2014, 1192-1206
Department of Pharmaceutical Analysis ISSN (online) 2347-2154
Available online: www.ijipsr.com June Issue 1204
Table 10: %Degradation of Famotidine and Domperidone In Different Conditions
Degradation
condition
Area Concentration(
µg/ml) % Potency % Degradation
Famotid
ine
Dompe
ridone
Famotidi
ne
Dompe
ridone
Famoti
dine
Domperi
done
Famoti
dine
Domperi
done
Acidic/0.1N
HCl /70°C/
Reflux/4hr/
Solution
1348542 345785
20 10 99.70 99.24
0.10 2.29
1347543 337982 19.98 9.77 99.60 96.95
Alkaline/
0.1N NaOH/
70°C/Reflux/
4hr/Solution
1348542 345785
20 10 99.70 99.24
2.40 2.88
1316547 336011 19.52 9.71 97.30 96.36
Thermal/60C/
24 hr/ Solid
1348542 345785
20 10 99.70 99.24
0.80 0.80
1337754 343237 19.84 9.92 100.99 98.44
Photo/1.2
million lux
hrs fluore –
scent light
/200w/m2 of
UV/7days
1348542 345785
20 10 99.70 99.24
0.20 1.59
1345845 340473 19.96 9.84 99.79 97.65
CONCLUSION
Stability indicating RP-HPLC methods for estimation of Famotidine & Domperidone in their
combine dosage form was established and validated as per the ICH guidelines. The forced
degradation study and peak purity data confirmed that there was no merging between peaks of
active ingredients and any other degradation products as well as other additives. Hence the
specificity of the proposed method was established. The linearity of developed method was
achieved in the range of 5-30 μg/ml for Famotidine (r2=0.999) and 2.5-15µg/ml for Domperidone
(r2=0.999). The percentage recovery of drug was achieved in the range of 98-102 % (Table 3)
which was within the acceptance criteria. The percentage RSD was NMT 2 % which proved the
precision of the developed method. Different degradation products were found for drug product
in acidic, alkaline, thermal and photolytic force degradation. Peak of degraded products were not
interfering with the main drug peak of Famotidine & Domperidone. Thus, these degradation
products have not been identified. The developed method is simple, sensitive, rapid, linear,
RESEARCH ARTICLE Panigrahy et.al / IJIPSR / 2 (6), 2014, 1192-1206
Department of Pharmaceutical Analysis ISSN (online) 2347-2154
Available online: www.ijipsr.com June Issue 1205
precise, rugged, accurate, specific, and robust. Hence it can be used for the routine analysis of
Famotidine & Domperidone in their bulk and combine dosage form in quality control laboratory
and stability studies.
ACKNOWLEDGEMENT
The authors are thankful to Malla Reddy College of Pharmacy for providing the chemicals and
instruments. Kekule Pharma Ltd., Hyderabad and NMR Drugs Private Ltd., India for providing a
sample for research.
REFERENCES
1. Humphries TJ, Merritt GJ. "Review article: drug interactions with agents used to treat
acid-related diseases". Aliment. Pharmacol. Ther. 13 (Suppl3): 18–26.
2. "Investigational New Drug Application, Domperidone". http://www.fda.gov.
3. R Sahu, Preeti Nagar, S Bhattacharya, Deepti Jain: Simultaneous spectrophotometric
estimation of famotidine and domperidone in combined tablet dosage form. Indian J
Pharm Sci 2006; 68:503-506.
4. Dipali D. Tajane, Sacchidanand R. Gite, Aditi R. Shah, Arun B. Kale, Ranjit V. Gadhave
and Vishnu P. Choudhari: Spectrophotometric Simultaneous Determination of
Famotidine and Domperidone in Combined Tablet Dosage Form by Ratio Derivative and
Area under Curve Method. Der Pharmacia Sinica, 2011, 2 (3): 60-66.
5. V. Rajani Sekhar, Y. Padmanabha Reddy, P. Ramalingam and D. Harihara Thej: RP-
HPLC and UV-derivative spectrophotometry technique for the simultaneous estimation
of ibuprofen and famotidine in pharmaceutical dosage form. Der Pharmacia Sinica, 2013,
4(2):160-170.
6. Patel A.H., Patel J.K., Patel K.N., Rajput G.C., Rajgor N.B.: Development and Validation
of Derivative Spectrophotometric Method for Simultaneous Estimation of Domperidone
and Rabeprazole Sodium in Bulk and Dosage Forms. International Journal on
Pharmaceutical and Biological Research, Vol. 1(1), 2010, 1-5
7. Khokhar Vishal G, Rabadia Pankaj, Suvagya Vijay, Agola Ashwin: RP-HPLC method
development for simultaneous estimation of famotidine and domperidone in their
pharmaceutical dosage form, Inventi Rapid: Pharm Analysis & Quality Assurance, Vol.
2013.

RESEARCH ARTICLE Panigrahy et.al / IJIPSR / 2 (6), 2014, 1192-1206
Department of Pharmaceutical Analysis ISSN (online) 2347-2154
Available online: www.ijipsr.com June Issue 1206
8. Aruna K Vanka, AnilKumar Voodikala, Saikumar V Simhadri, Srinivas Rao Atla,
Santoshkumar Tata, Development and validation of RP-HPLC method for the
simultaneous estimation of Famotidine and Domperidone tablet dosage form,
International Journal of Pharmacy and Pharmaceutical Sciences, Vol. 5(1), 2013.
9. Md. Ahsanul Haque, Mohammad Shahriar, Most. Nazma Parvin and S. M. Ashraful
Islam: Validated RP-HPLC Method for Estimation of Ranitidine Hydrochloride,
Domperidone and Naproxen in Solid Dosage Form. Asian J. Pharm. Ana. 2011; Vol.
1(3), Pg 59-63.
10. Padmanabh Deshpande, Santosh Gandhi, Vandana Bhavnani, Raviraj Bandewar,
Abhijeet Dhiware, Vrushali Diwale: High Performance Thin Layer Chromatographic
Determination of Famotidine and Domperidone in Combined Tablet Dosage Form.
Research Journal of Pharmaceutical, Biological and Chemical Sciences 1(4), October –
December 2010, 354-359.
11. International Conference on Harmonization, Q2 (R1), Harmonised Tripartite guidelines,
Validation of Analytical Procedures: Text and Methodology, Geneva, November 2005.
12. Shabir GA: Validation of high-performance liquid chromatography methods for
pharmaceutical analysis. Understanding the differences and similarities between
validation requirements of the US food and drug administration, the US Pharmacopeia
and the International Conference on Harmonization. J Chromatogr A 2003, 987:57–66.


