Introduction of high-content screening method for studying drug-
induced mitochondrial dysfunction in hepatocytes
Merja Mustonen
Helsingin yliopisto Farmasian tiedekunta
Farmakologian ja toksikologian osasto Tammikuu 2011

Erityiskiitokset Satu Juhilalle ja Kaisa Unkilalle erikoistyöni ohjaamisesta. Lisäksi
haluan kiittää koko Orion Oyj Orion Pharman Non-Clinical Safety Assessment- osaston
henkilökuntaa siitä että sain tehdä erikoistyöni siellä sekä mahtavista yhteisistä hetkistä
ja saamastani tsempistä erikoistyötä tehdessäni.
HELSINGIN YLIOPISTO HELSINGFORS UNIVERSITET UNIVERSITY OF HELSINKI
Tiedekunta Fakultet Faculty Faculty of Pharmacy
Osasto Sektion Department Department of Phamacology and Toxicology
Tekijä Författare Author Merja Mustonen Työn nimi Arbetets titel Title Introduction of high-content screening method for studying drug-induced mitochondrial dysfunction in hepatocytes Oppiaine Läroämne Subject Pharmacology and Toxicology Työn laji Arbetets art Level Pro gradu
Aika Datum Month and year Tammikuu 2011
Sivumäärä Sidoantal Number of pages 93
Tiivistelmä Referat Abstract Drug induced liver injury is one of the frequent reasons for the drug removal from the market. During the recent years there has been a pressure to develop more cost efficient, faster and easier ways to investigate drug-induced toxicity in order to recognize hepatotoxic drugs in the earlier phases of drug development. High Content Screening (HCS) instrument is an automated microscope equipped with image analysis software. It makes the image analysis faster and decreases the risk for an error caused by a person by analyzing the images always in the same way. Because the amount of drug and time needed in the analysis are smaller and multiple parameters can be analyzed from the same cells, the method should be more sensitive, effective and cheaper than the conventional assays in cytotoxicity testing. Liver cells are rich in mitochondria and many drugs target their toxicity to hepatocyte mitochondria. Mitochondria produce the majority of the ATP in the cell through oxidative phosphorylation. They maintain biochemical homeostasis in the cell and participate in cell death. Mitochondria is divided into two compartments by inner and outer mitochondrial membranes. The oxidative phosphorylation happens in the inner mitochondrial membrane. A part of the respiratory chain, a protein called cytochrome c, activates caspase cascades when released. This leads to apoptosis. The aim of this study was to implement, optimize and compare mitochondrial toxicity HCS assays in live cells and fixed cells in two cellular models: human HepG2 hepatoma cell line and rat primary hepatocytes. Three different hepato- and mitochondriatoxic drugs (staurosporine, rotenone and tolcapone) were used. Cells were treated with the drugs, incubated with the fluorescent probes and then the images were analyzed using Cellomics ArrayScan VTI reader. Finally the results obtained after optimizing methods were compared to each other and to the results of the conventional cytotoxicity assays, ATP and LDH measurements. After optimization the live cell method and rat primary hepatocytes were selected to be used in the experiments. Staurosporine was the most toxic of the three drugs and caused most damage to the cells most quickly. Rotenone was not that toxic, but the results were more reproducible and thus it would serve as a good positive control in the screening. Tolcapone was the least toxic. So far the conventional analysis of cytotoxicity worked better than the HCS methods. More optimization needs to be done to get the HCS method more sensitive. This was not possible in this study due to time limit. Avainsanat Nyckelord Keywords High Content Screening (HCS), Mitochondria, Hepatotoxicity, Fluorescent Microscopy Säilytyspaikka Förvaringställe Where deposited Department of Pharmacology and Toxicology, Office of the Faculty of Pharmacy Muita tietoja Övriga uppgifter Additional information Instructors PhD Satu Juhila and Dosent, PhD Kaisa Unkila, Orion Oyj Orion Pharma

HELSINGIN YLIOPISTO HELSINGFORS UNIVERSITET UNIVERSITY OF HELSINKI
Tiedekunta Fakultet Faculty Farmasian tiedekunta
Osasto Sektion Department Farmakologian ja toksikologian osasto
Tekijä Författare Author Merja Mustonen Työn nimi Arbetets titel Title Introduction of high-content screening method for studying drug-induced mitochondrial dysfunction in hepatocytes Oppiaine Läroämne Subject Farmakologia ja toksikologia Työn laji Arbetets art Level Pro gradu
Aika Datum Month and year Tammikuu 2011
Sivumäärä Sidoantal Number of pages 93
Tiivistelmä Referat Abstract Lääkkeitä kehitettäessä on pitkään jo pyritty löytämään tehokkaampia, nopeampia ja kalliita eläinkokeita korvaavia toksisuuden tutkimismenetelmiä. High Content Screening (HCS)-laitteisto koostuu yksinkertaistetusti tietokoneeseen yhdistetystä fluoresenssimikroskoopista. Koneessa oleva kuva-analyysiin sopiva ohjelmisto nopeuttaa analyysiä ja poistaa henkilöriippuvaiset virhetekijät analyysistä, kun tulokset analysoidaan aina samalla tavalla. Menetelmän pitäisi olla herkempi, tehokkaampi ja edullisempi kuin perinteiset toksisuuden tutkimusmenetelmät, sillä tarvittavan lääkeaineen ja ajan määrä on pienempi. Lisäksi samoista soluista voi analysoida useita parametrejä. Maksa on elimistön pääasiallinen lääkkeiden ja muiden vierasaineiden metaboliapaikka. Maksasoluissa on runsaasti mitokondrioita, joihin useat maksatoksiset lääkeaineet kohdistavat toksisuutensa. Mitokondriot ovat elintärkeitä soluorganelleja. Ne tuottavat solun tarvitseman ATP:n, ovat mukana solun biokemiallisen tasapainon säätelyssä sekä osallisena solukuolemassa. Mitokondrion ulko- ja sisäkalvo eristävät kalvojen välisen tilan ja matrixin sytoplasmasta. Pro Gradun tutkimusosiossa pyrittiin kehittämään ja optimoimaan uusia HCS-menetelmiä lääkeaineiden mitokondriaalisen toksisuuden tutkimiseen. Tutkimuksessa vertailtiin kahta eri menetelmää (eläville ja fiksatuille soluille), kahta eri solutyyppiä (rotan primaarihepatosyytit ja humaani HepG2-solulinja), sekä kolmea eri lääkeainetta (staurosporiini, rotenoni ja tolkaponi). Optimoitujen menetelmien tuloksia verrattiin myös konventionaalisiin sytotoksisuuden mittausmenetelmiin (ATP ja LDH). Optimoinnin tulosten perusteella varsinaiset kokeet päätettiin tehdä elävillä primaarihepatosyyteillä. Lääkeaineista staurosporiini oli toksisin. Se aiheutti eniten vahinkoa soluille lyhyimmässä ajassa. Rotenoni ei ollut yhtä toksinen, mutta antoi toistettavimmat tulokset ja toimi hyvänä positiivisena kontrollina. Tolkaponi oli vähiten toksinen. Toistaiseksi konventionaaliset toksisuuden mittausmenetelmät toimivat luotettavammin toksisuuden mittauksessa kuin optimoidut HCS-menetelmät. Menetelmää, ja erityisesti parametriasetuksia, on optimoitava vielä lisää herkkyyden parantamiseksi. Tämä ei kuitenkaan annetuissa aikarajoissa ollut mahdollista. Avainsanat Nyckelord Keywords High Content Screening (HCS), Mitokondrio, Maksatoksisuus, Fluoresoivat leimat Säilytyspaikka Förvaringställe Where deposited Farmakologian ja toksikologian osasto, Farmasian tiedekunnan kanslia Muita tietoja Övriga uppgifter Additional information Ohjaajat PhD Satu Juhila ja Dosentti, PhD Kaisa Unkila, Orion Oyj Orion Pharma

I LITERATURE PART ................................................................................................. 1
1. INTRODUCTION ..................................................................................................... 1
2. MITOCHONDRIA: STRUCTURE AND FUNCTION.............................................. 1
2.1 Structure .............................................................................................................. 1
2.1.1 Mitochondrial membranes ............................................................................. 2
2.1.2 Intermembrane space .................................................................................... 3
2.1.3 The matrix .................................................................................................... 4
2.2 Function .............................................................................................................. 4
2.2.1. Oxidative Phosphorylation ........................................................................... 5
2.2.2 Control of the intracellular calcium and ion balance ...................................... 9
3. APOPTOSIS AND NECROSIS .............................................................................. 10
3.1 Apoptosis .......................................................................................................... 10
3.2 Necrosis ............................................................................................................. 13
4. MITOCHONDRIAL MECHANISMS OF HEPATOCYTE DYSFUNCTION ......... 13
4.1 Mitochondrial hepatotoxicity ............................................................................. 13
4.2 Mitochondrial free radical production, disruption of the energy metabolism and
triggering of the apoptosis ....................................................................................... 14
5. HIGH CONTENT SCREENING IN THE INVESTIGATION OF
MITOCHONDRIAL HEPATOTOXICITY ................................................................. 17
5.1. Development of the High Content Screening methods ...................................... 17
5.2 Fluorescent probes ............................................................................................. 19
5.3 High Content Screening and mitochondria ......................................................... 20
6. SUMMARY ............................................................................................................ 21
II EXPERIMENTAL PART ........................................................................................ 23
7. INTRODUCTION ................................................................................................... 23
8. SPECIFIC AIMS OF THIS STUDY ........................................................................ 24
9. MATERIALS AND METHODS ............................................................................ 25
9.1 Materials and reagents ....................................................................................... 25
9.1.1 Cell Models ................................................................................................ 26
9.1.2 Probes ......................................................................................................... 29
9.1.3 Model substances ........................................................................................ 32
9.2 Optimization of live cell method ........................................................................ 34
9.3 Optimization of fixed cell method ...................................................................... 34
9.4 Cellomics ArrayScan VTI HCS Reader settings, bioapplications and specific
parameters of the cell imaging measurements .......................................................... 36
9.4.1 Input parameters ......................................................................................... 38
9.4.2 Output parameters ....................................................................................... 39
9.5 Conventional analysis of cytotoxicity................................................................. 39
9.5.1 ATP assay ................................................................................................... 39
9.5.2 LDH assay .................................................................................................. 40
9.6 Evaluation of phototoxicity ................................................................................ 40
10. RESULTS ............................................................................................................. 41
10.1 Optimization of cell culture conditions............................................................. 41
10.2 Optimization of live cell method ...................................................................... 46
10.3 Optimization of fixed cell method .................................................................... 48
10.4 Image acquisition and analysis with the Cellomics ArrayScan VTI Reader ...... 52
10.4.1 Input parameters ....................................................................................... 52
10.4.2 Cellomics ArrayScan scanning results and output parameters .................... 62
10.4 Conventional analysis of cytotoxicity ............................................................... 77
10.5 Evaluation of phototoxicity .............................................................................. 80
11. DISCUSSION ....................................................................................................... 82
12. CONCLUSIONS ................................................................................................... 86

Abbreviations
Acetyl CoA = Acetyl coenzyme A
ADP = Adenosine diphosphate
APAF = Apoptotic protease activating factor
ATP = Adenosine triphosphate
Bcl-2 = B-cell lymphoma 2
DILI = Drug-induced liver injury
DMEM = Dulbecco’s modified eagle medium
ER = Endoplasmic reticulum
ETC = Electron transport chain
FAD /FADH2 = Flavin adenine dinucleotide
GSH = Glutathione
HCA = High content analysis
HCS = High content screening
IAP = Inhibitors of apoptosis
LDH = Lactate dehydrogenase
LMWA = low-molecular weight antioxidants
MEM = Minimum essential medium
MPTP = Mitochondrial permeability transition pore
NADH / NAD+ = Nicotinamide adenine dinucleotide
NO = Nitric Oxygen
RNS = Reactive Nitrogen Species
ROS = Reactive Oxygen Species
SMAC = Second mitochondrial-derived activator of caspase
TCA = Trichloroacetic acid
TMRM = Tetramethyl Rhodamine Methyl Ester

1
I LITERATURE PART
1. INTRODUCTION
Mitochondria are membrane-enclosed organelles that are present in virtually all
eukaryotic cells, except mature erythrocytes and platelets (Mannella 2008, Neustadt and
Pieczenik 2008). They produce more than 90% of the energy in the cell and they control
cell death and survival by participating in apoptosis. Mitochondria are not only
predominant in the ATP production and important regulators of the apoptosis but they
are also the main producers of cellular reactive oxygen species (ROS) and they maintain
biochemical balance inside the cell by controlling e.g. ion balance (Szewczyk and
Wojtzcak 2002). Hepatocytes are rich in mitochondria and their role in drug
development is crucial, since many drugs direct their toxicity through the mitochondria
(Xu et al 2004).
2. MITOCHONDRIA: STRUCTURE AND FUNCTION
2.1 Structure
Mitochondria are very mobile and plastic organelles. They can fuse with one another,
and then separate again (Parone et al 2006). In many cells, they form a complex
reticulum that interacts with other cellular organelles, especially microtubules,
cytoskeleton and endoplasmic reticulum (Frey and Mannella 2008). This enables the
2
unique orientation and distribution of mitochondria in different types of cells and tissues.
Some cells have only single mitochondria whereas others have thousands of them.
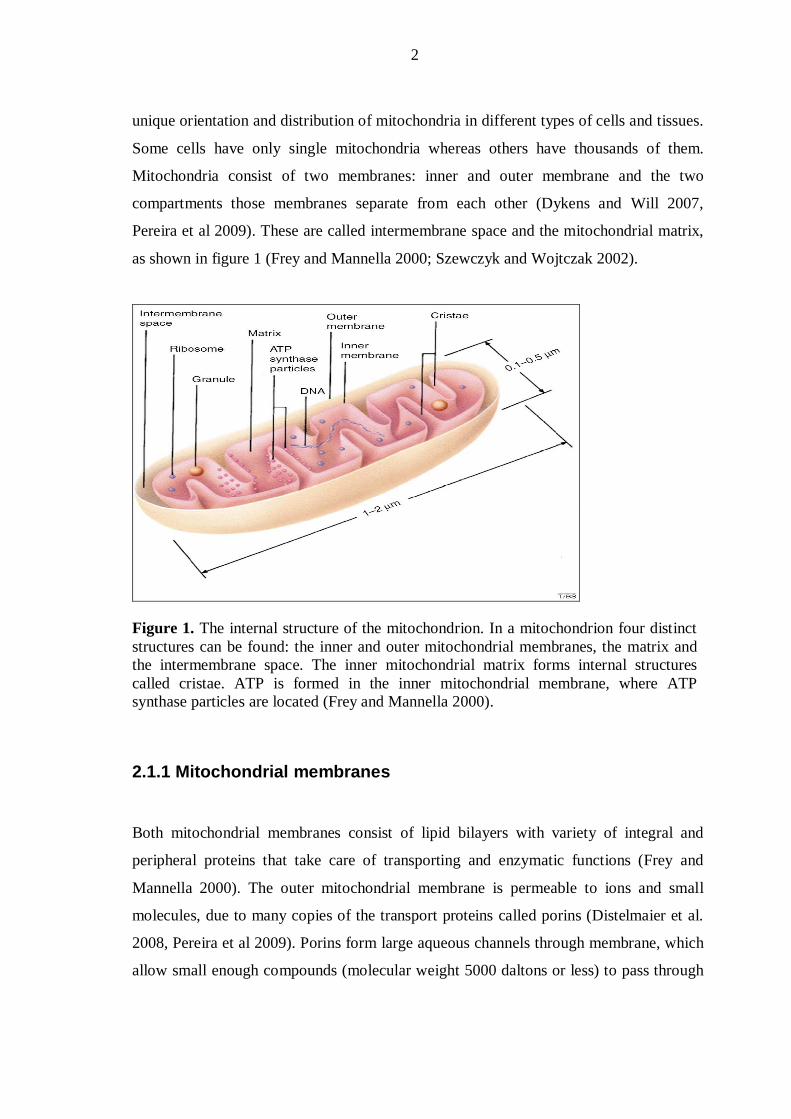
Mitochondria consist of two membranes: inner and outer membrane and the two
compartments those membranes separate from each other (Dykens and Will 2007,
Pereira et al 2009). These are called intermembrane space and the mitochondrial matrix,
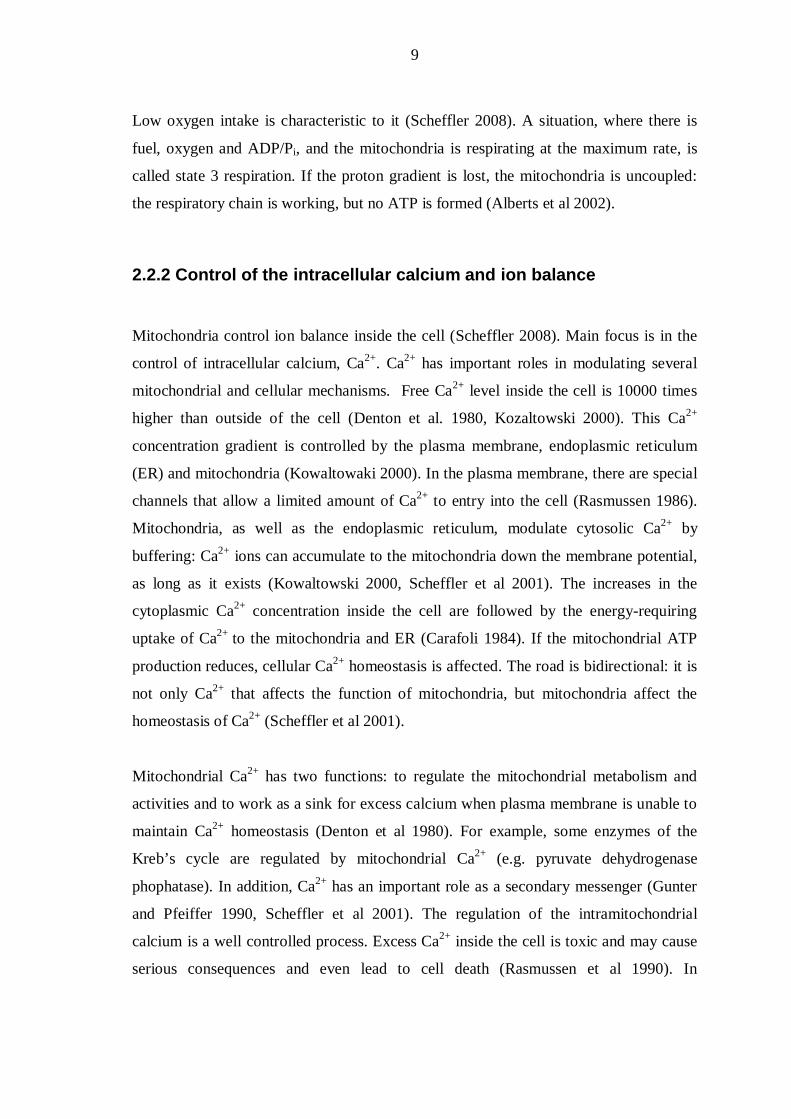
as shown in figure 1 (Frey and Mannella 2000; Szewczyk and Wojtczak 2002).
Figure 1. The internal structure of the mitochondrion. In a mitochondrion four distinct structures can be found: the inner and outer mitochondrial membranes, the matrix and the intermembrane space. The inner mitochondrial matrix forms internal structures called cristae. ATP is formed in the inner mitochondrial membrane, where ATP synthase particles are located (Frey and Mannella 2000).
2.1.1 Mitochondrial membranes
Both mitochondrial membranes consist of lipid bilayers with variety of integral and
peripheral proteins that take care of transporting and enzymatic functions (Frey and
Mannella 2000). The outer mitochondrial membrane is permeable to ions and small
molecules, due to many copies of the transport proteins called porins (Distelmaier et al.
2008, Pereira et al 2009). Porins form large aqueous channels through membrane, which
allow small enough compounds (molecular weight 5000 daltons or less) to pass through

3
the intermembrane space freely (Dykens and Will 2007; Szewczyk and Wojtczak 2002).
Bigger molecules can enter mitochondria only by active transport through mitochondrial
membrane transport proteins. Outer membrane also contains enzymes that are needed in
diverse biochemical actions, such as elongation of fatty acids (Toogood 2008).
The inner mitochondrial membrane is highly specialized and forms invaginations called
cristae, as seen in figure 1 (Mannella 2008, Pereira et al 2009). The inner mitochondrial
membrane is the place where most of the vital biochemical functions of the mitochondria
take place. The cristae greatly increase this area allowing proteins, such as cytochromes,
to function efficiently (Toogood 2008). Lipid bilayer of the inner mitochondrial
membrane contains relatively high amount of specialized lipid molecule, cardiolipin.
This structure resembles the composition of the bacterial membranes, and according to
endosymbiont hypothesis mitochondria are prokaryotic origin, internalized by eukaryotic
cells. The structure of the inner mitochondrial membrane makes it impermeable to
unwanted ions. However, cardiolipin is not unique to mitochondrial membranes; it exists
also in other membranes in the cell. The concentration of cardiolipin is exceptionally
high in mitochondrial membranes: this is a mark of highly enclosed matrix of the
organelle. Inner membrane is associated with the molecular machinery of chemiosmosis
and it contains the entire respiratory chain and ATP synthase complex (Mannella 2008;
Szewczyk and Wojtczak 2002). Because of respiratory chain that is coupled with proton
pumping, there is a high voltage difference across the membrane (Dykens and Will
2007).
2.1.2 Intermembrane space
Because the outer mitochondrial membrane is highly permeable to small molecules, the
consistency of intermembrane compartment is same than in the cytosol, as far as low-
molecular-weight compounds (ions, sugars etc) are concerned (Mannella 2008,
Szewczyk and Wojtczak 2002). Large proteins must have specific signal sequences to be
addressed to mitochondria. One of the intermembrane space proteins is cytochrome c, an
important protein that triggers apoptosis if released from the outer part of the inner

4
membrane where it is usually located. On the whole, the volume of intermembrane space
is small.
2.1.3 The matrix
Mitochondrial matrix is a dense solution containing hundreds of enzymes, metabolites
and inorganic ions (Mannella 2008, Pereira et al 2009, Szewczyk and Wojtczak 2002). It
is the place where the major biochemical mitochondrial functions take place (Dykens and
Will 2007). It is the site of the Kreb’s cycle and it also contains the mitochondrial
genome and other various enzymes required for the expression of the mitochondrial
genes.
2.2 Function
Depending on the cellular energy requirements, different cells have different amounts of
mitochondria (Neustadt and Pieczenik 2008). Metabolically most active cells have the
greatest number of mitochondria, e.g. skeletal muscle cells, various cells in the brain and
hepatocytes in the liver (Szewczyk and Wojtczak 2002). In addition, depending of the
type of the cell and its function, the density of the cristae vary a lot, being the greatest in
the cells which do constant work and need much energy (Szewczyk and Wojtczak 2002).
E.g. cardiac muscle cells have many highly invaginated mitochondria and a little amount
of matrix. In the mitochondria of the hepatocytes the area of the inner membrane is five
times greater than the outer membrane.
Mitochondria are the main source of energy in the cells, and they produce more than
90% of the ATP needed in the cell (Wojtczak 2008). They are not only crucial for the
energy production and the metabolic pathways, but they have a central role in cell death
and survival (Kwong et al 2007). They also contribute to the ion balance inside the cell
(Denton et al 1980). Infants have specific brown fat tissue where mitochondria produce
heat by uncoupling the H+ efflux from producing ATP (Kowaltowski 2000). The

5
oxidative phosphorylation and the control of the ion balance as well as the regulation of
the cell death are discussed in detail below.
2.2.1. Oxidative Phosphorylation
Oxidative phosphorylation consists of two events: the flow of the electrons through
electron transport chain (ETC) to molecular oxygen and the phosphorylation of the
ADP by inorganic phosphate to form ATP (Toogood 2008, Szewczyk and Wojtczak
2002). These processes are located in the matrix and the inner membrane of the
mitochondria. Despite the fact that, in principle, these two events are independent, they
are still coupled together: one cannot occur without the other. Energy released from the
process called Kreb’s cycle in form of reduced NADH or FADH2 is used to form ATP
in the end of the ETC (Dykens and Will 2007).
Mitochondria have two principal sources of energy: pyruvate and fatty acids (Labbe
2008). Pyruvates come from sugars (for example glucose) and fatty acids from
triacylglycerols. They both are converted into acetyl coenzyme A (Acetyl CoA) by
enzymes located in the mitochondrial matrix as shown in figure 2. Acetyl CoA is taken
to Kreb’s cycle, which changes acetyl CoA into high-energy electron carriers NADH
and FADH2. Those are transferred to the inner mitochondrial membrane (Dykens and
Will 2007). Here they enter the ETC (Szewczyk and Wojtczak 2002). NADH is more
potent in maintaining electrochemical gradient across the membrane, since it gives its
electrons to complex I in ETC, whereas FADH2 gives electrons to complex II (Figure
3). This way NADH goes through the whole ETC transferring more H+ ions across the
membrane. Energy released from NADH and FADH2 is used to form ATP via
electrochemical gradient. Oxygen is needed in the end of the ETC, where it is converted
into water. It is the final product of this process (Szewczyk and Wojtczak, 2002). In the
next chapters these processes are discussed in detail.

6
Figure 2. The citric acid cycle, electron transport chain and ATP production in the mitochondria. This process produces energy for the cell by converting pyruvate and fatty acids to Acetyl CoA and further to NADH. NADH gives it electrons to electron transport chain, which moves electrons outside the cell thus generating the electrochemical gradient across the membrane. When H+ is taken back to cell, it produced ATP (Alberts et al 2002).
ETC consists of the membrane-bound respiratory enzyme complexes, seen in figure 3
(Bellance et al 2009). The first one of the complexes, the complex I, is a NADH-
dehydrogenase. This is the largest of the respiratory complexes, and it accepts electrons
from NADH after it has left the Kreb’s cycle (Dykens and Will 2007, Pereira et al
2009). In this process NADH is oxidated into NAD+. Each NADH gives two electrons
to complex I. They pass through the Complex I and its iron-sulfur-centers to an electron
carrier ubiquinone (also called coenzyme Q), which is a carrier between complexes I
and III (Scheffler 2008). During this process, four H+ are taken out of the mitochondrial
matrix to the intermembrane space to maintain electrochemical gradient.

7
Figure 3: The electron-transport chain of mitochondria. Electrons from NADH move through all the complexes, whereas electrons from FADH2 go straight to the complex II. Complexes I, III and IV move H+ through the membrane (Figure from Bellance et al 2009)
Complex II, a succinate dehydrogenase, is attached to the inner surface of the inner
mitochondrial membrane (Szewczyk and Wojtczak 2002). It accepts electrons from
FADH2 converting it to FAD (Pereira et al 2009, Sas et al 2007). After this, ubiquinone,
the same carrier that takes electrons from the complex I, takes electrons to the complex
III. Complex II is located between complexes I and III, as shown in figure 3. It does not
carry H+ across the inner membrane.
Complex III, a ubiquinol-cytochrome c oxidoreductase (also called cytochrome b-c1
complex), catalyses the electron transfer from ubiquinone to cytochrome c. Cytochrome
c is a peripheral protein, which is bound to the outer side of the inner mitochondrial
membrane, and it is a trigger of apoptosis when released from the mitochondrial
membrane, as discussed in chapter 3: apoptosis and necrosis (Szewczyk and Wojtczak
2002). Like the complex I, the complex III transfers four H+ ions across the inner
membrane.
Complex IV is a cytochrome C oxidase. It catalyzes the formation of water from
molecular oxygen. Electrons from reduced cytochrome c are transferred to oxygen, and
the result is two molecules of water (Szewczyk and Wojtczak 2002). Complex IV

8
transfers two H+ ions across the membrane, the other two H+ ions are used in the
formation of water (Sas et al 2007). Oxygen reduction is irreversible: once formed, the
process cannot go to the reverse way. The formation of water is the force that transfers
electrons through the whole ETC: the oxidation potential grows during the whole ETC
being the greatest in the molecular oxygen.
The energy from high-energy electrons released during respiration is used to pump H+
ions from the matrix to the intermembrane space. This forms electrochemical potential
(proton gradient) across the inner mitochondrial membrane: inside is negative, outside
positive (Szewczyk and Wojtczak 2002). pH inside the matrix is 8. Both electric- and
pH gradient drive protons back into the matrix from the cytosol. This process is called
chemiosmotic coupling (Szewczyk and Wojtczak 2002). The potential energy stored
into this gradient is used to produce ATP (Distelmaier et al. 2007). ATP synthesis takes
place in an ATP synthase, the “Complex V” in the electron transport chain (Bellance et
al 2009). Despite the name and the fact that it is a part of oxidative phosphorylation,
complex V is not a part of the respiratory chain (Sas et al 2007). The ATP synthase is
formed of two distinct components: Fo and F1. The Fo portion forms a hydrophilic
pathway for protons to across the inner mitochondrial membrane. The return of the
protons to the matrix is coupled to the formation of ATP from ADP and phosphate ions.
This happens by rotational catalysis: the rotation of the F1-portion driven by proton
motive force couples this motion to the synthesis of ATP (Szewczyk and Wojtczak
2002). Formed ATP is taken off from the cell by special carrier proteins. Unlike oxygen
formation in complex IV, ATP formation is reversible. When needed, ATP is
hydrolyzed back to ADP and Pi. In this process, protons are pumped back to the cytosol
and energy is released.
There are specific situations when either oxygen or ADP/Pi is not available. If fuels are
available for the cell, the rate of the oxygen consumption depends mainly on the supply
of the ADP and Pi (Scheffler 2008). If there is oxygen, but no ADP/Pi, the proton
gradient over the inner mitochondrial membrane becomes the rate-limiting factor for the
electron flow and the electron transport across membrane is inhibited (Sas et al 2007;
Scheffler 2008). This kind of situation is called “the resting state”, or state 4 respiration.
9
Low oxygen intake is characteristic to it (Scheffler 2008). A situation, where there is
fuel, oxygen and ADP/Pi, and the mitochondria is respirating at the maximum rate, is
called state 3 respiration. If the proton gradient is lost, the mitochondria is uncoupled:
the respiratory chain is working, but no ATP is formed (Alberts et al 2002).
2.2.2 Control of the intracellular calcium and ion balance
Mitochondria control ion balance inside the cell (Scheffler 2008). Main focus is in the
control of intracellular calcium, Ca2+. Ca2+ has important roles in modulating several
mitochondrial and cellular mechanisms. Free Ca2+ level inside the cell is 10000 times
higher than outside of the cell (Denton et al. 1980, Kozaltowski 2000). This Ca2+
concentration gradient is controlled by the plasma membrane, endoplasmic reticulum
(ER) and mitochondria (Kowaltowaki 2000). In the plasma membrane, there are special
channels that allow a limited amount of Ca2+ to entry into the cell (Rasmussen 1986).
Mitochondria, as well as the endoplasmic reticulum, modulate cytosolic Ca2+ by
buffering: Ca2+ ions can accumulate to the mitochondria down the membrane potential,
as long as it exists (Kowaltowski 2000, Scheffler et al 2001). The increases in the
cytoplasmic Ca2+ concentration inside the cell are followed by the energy-requiring
uptake of Ca2+ to the mitochondria and ER (Carafoli 1984). If the mitochondrial ATP
production reduces, cellular Ca2+ homeostasis is affected. The road is bidirectional: it is
not only Ca2+ that affects the function of mitochondria, but mitochondria affect the
homeostasis of Ca2+ (Scheffler et al 2001).
Mitochondrial Ca2+ has two functions: to regulate the mitochondrial metabolism and
activities and to work as a sink for excess calcium when plasma membrane is unable to
maintain Ca2+ homeostasis (Denton et al 1980). For example, some enzymes of the
Kreb’s cycle are regulated by mitochondrial Ca2+ (e.g. pyruvate dehydrogenase
phophatase). In addition, Ca2+ has an important role as a secondary messenger (Gunter
and Pfeiffer 1990, Scheffler et al 2001). The regulation of the intramitochondrial
calcium is a well controlled process. Excess Ca2+ inside the cell is toxic and may cause
serious consequences and even lead to cell death (Rasmussen et al 1990). In

10
hepatocytes, disruption of the intracellular Ca2+ regulation leads to the failure of the
structural molecules inside the cell that maintain the shape of the cell, especially actin
filaments (Lee 2003).
3. APOPTOSIS AND NECROSIS
Apoptosis and necrosis are the two most common mechanisms of the cell death
(Edinger and Thompson 2004). The dying mechanism of the cell is dependent of the
context and cause of the cell death and often the cell death can have characters both
from apoptosis and necrosis (Edinger and Thompson 2004). Apoptosis is a programmed
cell death, which means that it is an intrinsic mechanism for a suicide of the cell and it
is regulated by several cellular signalling pathways (Danial and Korsmayer 2004).
Apoptotic cell death is a clean way for cell to die and usually it does not harm the
neighbouring cells. In contrast to apoptosis, necrosis is often considered as passive cell
death, causing inflammation and further tissue damage (Fiers et al 1999). Apoptotic cell
death needs energy in a form of ATP: in situations that there is no ATP available, the
cells die by necrosis (Suen et al 2008). These two ways of cell death are discussed in
detail below.
3.1 Apoptosis
Apoptosis is crucial in the tissue development, tissue turnover and protection from
cancer as it prevents the overgrowth of the tissues and destroys defective cells (Bertrand
et al 1994, Suen et al 2008). Apoptosis balances cell division and controls the deletion
of the structures that are no longer needed. In these situations apoptosis is maintaining
normal functions of the body (Fiers et al 1999). In some cases, apoptosis is triggered by
drugs or other xenobiotics leading to harmful and/or not intended cell death (Edinger
and Thompson 2004).

11
During apoptosis, cell undergoes controlled process which leads to controlled
eradication of the cell (Danial and Korsmeyer 2004). In apoptotic cell death
biochemical events lead to changes in cell morphology: these include condensation and
fragmentation of the nucleus, DNA cleavage into small parts, blebbing of the cell
membrane, cell shrinkage, and packaging of the cell into apoptotic bodies without
breaking the plasma membrane (Gomez-Lechon et al 2001 and Parone et al. 2006).
Apoptotic bodies are recognized by phagocytic cells and they are phagocyted. No
damage to the neighbour cells is occurred and the immune system is not activated (Suen
et al 2008).
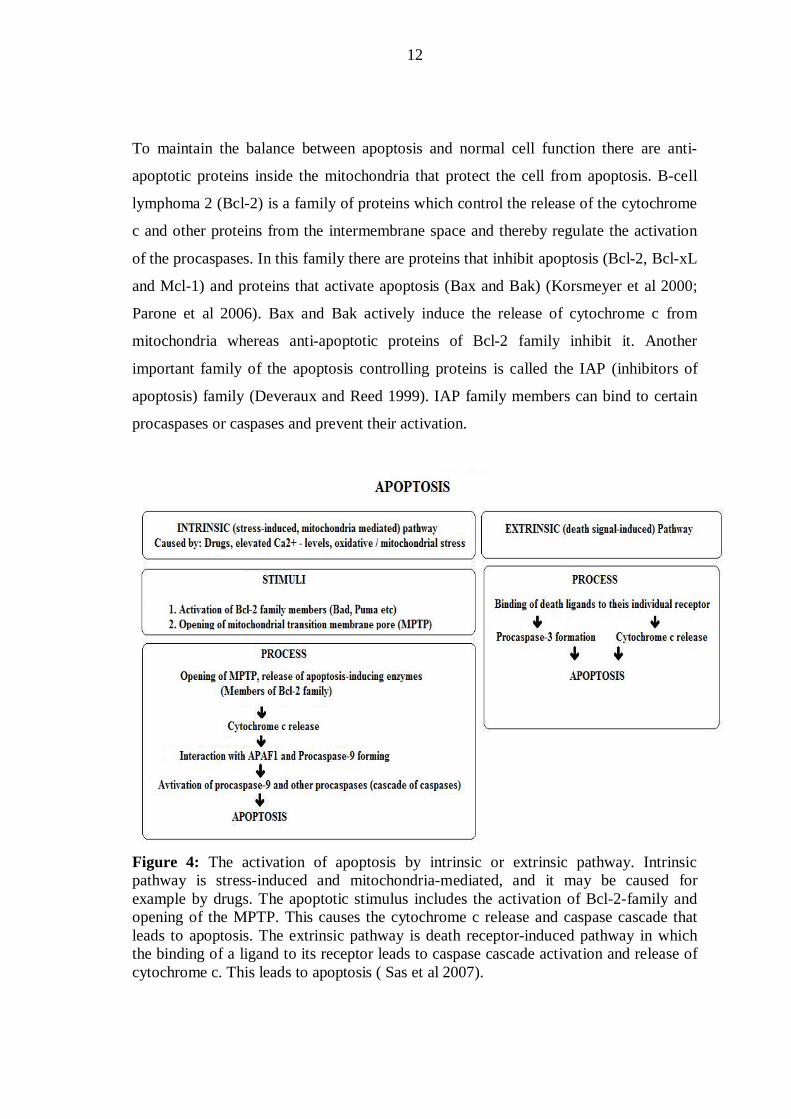
Apoptosis is activated by two routes as shown in figure 5: intrinsic and extrinsic (Suen
et al 2008). Both pathways induce apoptosis by activating the initiator procaspases
which in turn activate cascade of caspases (Parone et al 2006). Caspases are proteases
that are synthesized as inactive precursors and are activated usually by other caspases
(caspase cascade) (Fiers et al 1999). Caspases also activate some other key proteins in
the cell; these proteins may cause for example the cleavage of the nuclear lamina or the
destruction of the DNA through DNA-degrading enzymes (Kwong et al 2007).
Extrinsic pathway is a death receptor-mediated apoptosis (Sas et al 2007, Suen et al
2008). It is activated by cell surface receptors which lead to the activation of caspases
which in turn activate the apoptotic machinery, as seen in figure 5. Insintric pathway is
regulated by mitochondria. Mitochondria control the release of different pro- and anti-
apoptotic proteins from the intermembrane space. The most important of these proteins
is cytochrome c. It binds to an adaptor protein called Apoptotic Protease Activating
Factor 1 (APAF1) in cytosol leading to the activation of the caspase 9. This activates
the caspases that lead to the destruction of the cell (Suen et al 2008). Other important
proteins that mitochondria regulate are for example Second Mitochondrial-derived
Activator of Caspase (SMAC) and Diablo, which together form a SMAC/Diablo-
complex (Wang et al 2008). Cytochrome c, SMAC and Diablo are pro-apoptotic
proteins that induce apoptosis (Bertrandt et al 1994, Malhi and Gores 2008, Parone et al.
2006).
12
To maintain the balance between apoptosis and normal cell function there are anti-
apoptotic proteins inside the mitochondria that protect the cell from apoptosis. B-cell
lymphoma 2 (Bcl-2) is a family of proteins which control the release of the cytochrome
c and other proteins from the intermembrane space and thereby regulate the activation
of the procaspases. In this family there are proteins that inhibit apoptosis (Bcl-2, Bcl-xL
and Mcl-1) and proteins that activate apoptosis (Bax and Bak) (Korsmeyer et al 2000;
Parone et al 2006). Bax and Bak actively induce the release of cytochrome c from
mitochondria whereas anti-apoptotic proteins of Bcl-2 family inhibit it. Another
important family of the apoptosis controlling proteins is called the IAP (inhibitors of
apoptosis) family (Deveraux and Reed 1999). IAP family members can bind to certain
procaspases or caspases and prevent their activation.
Figure 4: The activation of apoptosis by intrinsic or extrinsic pathway. Intrinsic pathway is stress-induced and mitochondria-mediated, and it may be caused for example by drugs. The apoptotic stimulus includes the activation of Bcl-2-family and opening of the MPTP. This causes the cytochrome c release and caspase cascade that leads to apoptosis. The extrinsic pathway is death receptor-induced pathway in which the binding of a ligand to its receptor leads to caspase cascade activation and release of cytochrome c. This leads to apoptosis ( Sas et al 2007).

13
3.2 Necrosis
Necrosis is the form of cell death which is caused by bioenergetic catastrophe caused by
the lack of ATP (Edinger and Thompson 2004). Unlike in the apoptotic cell death, in
necrosis the nucleus is not condensed and fragmented, even if there are some nuclear
morphology changes detectable (Proskuryakov et al 2003). Necrosis is often thought to
be caused by factors external to cell or tissue, such as drugs, toxins, trauma or infection.
For example in heart attack hypoxic heart muscle cells die by necrosis causing even
larger damage to heart. Cell death is also determined so that smaller injuries usually end
up to apoptotic death whereas more severe forms of injuries to the cell result in necrosis
(Gómez-Lechón et al 2001).
Typical for the beginning of the necrotic cell death is the swelling of the cell, digestion
of the chromatin and disruption of the membranes of the organelles. In the later stage of
the necrosis the ER is vacuolized, the DNA hydrolyzed and the cell is lysed (Kass and
Price 2008). The release of the intracellular contents and proinflammatory molecules
after the cell membrane is ruptured leads to inflammation of the rounding tissue.
4. MITOCHONDRIAL MECHANISMS OF HEPATOCYTE DYSFUNCTION
4.1 Mitochondrial hepatotoxicity
Hepatotoxicity can be caused by a xenobiotic such as a drug molecule itself or by its
reactive metabolite (Dykens and Will 2007). There is relatively large amount of
mitochondria in the liver cells. Approximately 75% of the hepatic blood comes straight
from gastrointestinal-tract and due to this oral drugs go first to the liver after the
absorption from the gastrointestinal tract (Jaeschke et al 2002). Inside the liver cells,

14
mitochondrial dysfunction may lead to many different types of liver damages, such as
hepatitis (inflammation, including cytolytic acute hepatitis, cholestatic acute hepatitis
and mixed acute hepatitis), direct injury, cholestasis (without necrosis or inflammation),
steatosis (fatty liver), steatohepatitis (with both steatosis and necroinflammation),
hepatosis, and idiosyncratic injury (Boelsterli and Kim 2006, Jaeschke et al 2002,
Tafazoli et al 2004). Hepatotoxicity caused by drugs is infrequent and normally detected
idiosyncratically, so that there is a delay between the physiological reaction and the
ingestion of the drug (Lee 2003). All the mentioned damages are not caused only
through mitochondrial dysfunctions, but it is one of most common causes for drug-
induced liver injury (DILI) (Dykens and Will 2007; Labbe et al 2008).
4.2 Mitochondrial free radical production, disruption of the
energy metabolism and triggering of the apoptosis
There are three general functions in the mitochondria that are mainly affected by drugs.
These three are free radical production (ROS and RNS), disruption of the energy
metabolism (disruption of both fatty-acid oxidation and energy production) and
induction of the apoptosis (Lee 2003, Mito Sciences 2009).
As described before, most of the electrons from FADH2 or NADH to the mitochondrial
respiratory chain move through all the mitochondrial respiratory complexes and finally
combine with oxygen and protons to form water in the complex IV (Dykens and Will
2007). Free oxygen radicals, called reactive oxygen species (ROS) may form if for
example some of the complexes in the mitochondria are inhibited by certain drugs or
their metabolites (O’Brien et al 2006). Small portion of the electrons of the electron
transport chain may react directly with oxygen and produce superoxide anion which in
turn is converted into hydrogen peroxide by mitochondrial enzymes (Neustadt and
Pieczenik 2008; Pereira et al 2009). In normal physiological state 0.4-4% of the oxygen
consumed in mitochondria is turned into superoxide radicals. These oxygen radicals are
detoxified by mitochondrial antioxidant defences which include many different
15
enzymes, nucleic acids, lipids or proteins and finally water is formed and no damage is
occurred: these are discussed in detail below (Neustadt and Pieczenik, 2008, Wojtczak
2008). In case that there either are not enough mitochondrial antioxidants or the ROS
production is too fast, ROS start to accumulate into mitochondria (Labbe et al 2008,
Turrens 2003). Most of the harmful ROS produced is formed in the complexes I and II
where NADH and FADH2 give their electrons to the electron transport chain (Turrens
2003). When excess and harmful ROS production continues and the mitochondrial
dysfunction is prolonged, the high amount of ROS may lead to the damage of the
mitochondrial structures that are vulnerable to free radicals, including lipids, proteins,
oxidative phosphorylation enzymes and mitochondrial genome (Brookes 2005 Jaeschke
et al 2001). For example the damage of the proteins of the oxidative phosphorylation
leads to harmful circle, when electron transport chain is not working which is needed to
form water, and thus even more ROS is produced (Dykens and Will 2007).
Cells do have some defence mechanisms against oxidative stress (Roma and Pozzi
2008). Defence mechanism against oxidative stress and inactivation of ROS is
prevented by metal chelation. In addition, physical defences stabilize biological sites
such as membranes and form steric interference to prevent ROS reaching the target
(Kohen and Nyska 2002; Roma and Pozzi 2008; Turrens 2003). Antioxidants are one of
the most important among various defence system mechanisms (Pieczenik and Neustadt
2006). They can remove pro-oxidants directly by inactivating them and cells have
variety of antioxidative compounds that ensure maximum protection for the cell
organelles and mitochondria (Labbe et al 2008). This antioxidant defence system
contains two major groups; antioxidant enzymes and low-molecular weight antioxidants
(LMWA). Antioxidant enzymes include direct-acting enzymes and supporting enzymes,
whereas LMWA-group contains several compounds that can react directly or indirectly
with ROS and prevent their harmful effects. The result in each case is that ROS are
converted into water and made harmless.
Another form of reactive species is reactive nitrogen species (RNS) (Neustadt and
Pieczenik, 2008). RNS forms when nitric oxide (NO) is freely diffused into
mitochondria from the cytosol or formed by mitochondrial nitric oxide synthase. NO

16
reacts with superoxide radical and forms peroxynitrite. Some mitochondrial
components, such as complex I, are more sensitive to RNS than ROS. RNS, as well as
ROS, can lead to cell death (Jaeschke 2001).
Energy metabolism disruption happens if the ATP production falls below that of the
ATP demand (Sas et al 2007). Reduced ATP production may be the result of lost proton
gradient across the inner mitochondrial membrane and is often due to the impaired
electron transport activity in the ETC (Sas et al 207; Pereira et al 2009). The impairment
itself can be caused by excessive amount of calcium inside mitochondria or exposure to
ROS or RNS (Turrens 2003). In addition, impaired ETC activity can occur in response
to inhibition of any enzyme, transport, or pore activity necessary for oxidative
phosphorylation.
The problems in the ETC may increase the inner mitochondrial membrane permeability
which is known as the opening of the mitochondrial permeability transition pore
(MPTP) (Sas et al 2007). MPTP is located in the contact sites of the inner and outer
mitochondrial membrane, and it is composed of several proteins forming multiprotein
complex (Toogood 2008). The opening of the MPTP causes a rapid loss of the proton
gradient and leakage of the bigger molecules into mitochondria that in normal
circumstances are outside of the mitochondrial matrix. This leads to the accumulation of
water and rupture of the outer mitochondrial membrane, which in turn releases the
proapoptotic proteins into the cytosol, mainly cytochrome c. Opening of the MPTP may
be triggered by endogenous compounds, extracellular cytokines or drugs (Kowaltowski
1999).
To investigate the cytotoxicity in the hepatocytes, several different parameters can be
measured. Glutathione is one of the major antioxidants in the body, and the amount of
cellular glutathione (GSH) is declined due to the increased amount of ROS or RNS
(Kowaltowski 1999). Thus, both the increased amount of ROS (or RNS) the cellular
levels of GSH can be measured (Armstrong et al 2002). Energy metabolism disruption
can be detected by measuring ATP production, mitochondrial membrane potential

17
(problems in ETC) or oxygen consumption. Cytochrome c release and the activation of
different caspases (caspases 9 or caspases 3) can be measured as a marker of apoptosis.
5. HIGH CONTENT SCREENING IN THE INVESTIGATION OF MITOCHONDRIAL HEPATOTOXICITY
5.1. Development of the High Content Screening methods
Complete toxicological evaluation of even a single drug candidate is complicated,
expensive and may take several years to perform (O’Brien et al 2008). Drug-induced
liver injury is one of the most important toxicity mechanism, and among human
toxicities it has the poorest correlation with the regulatory animal toxicity tests. In
addition, hepatotoxicity is the most frequent reason for withdrawal of an approved drug
and the most common reason for black box warnings (Xu et al 2004).
In the past, toxicity has been primarily tested in vivo. The determination of
hepatotoxicity has accompanied by several whole-animal assays, which require large
number of animals (Pereira et al 2009). Studies made in the past show that animal
models do not predict human toxicity adequately (Xu et al 2004). Because of this and
due to low consistency with standard in vitro cytotoxicity screening assay results,
human hepatotoxicity has not been very predictable (Dykens and Will 2007; O’Brien et
al 2006). Cell based assays are increasingly widely used in cytotoxicity screening
(Lundholt et al. 2003). Over the last few years a major progress has been made to
develop different in vitro tests to fulfil testing requirements and to reduce the amount of
animal tests (Lundholt et al 2003). In vitro testing includes use of living systems such as
cultured animal- or human cells and tissues. Although conventional cytotoxicity assays,
such as measuring lactate dehydrogenase (LDH) and ATP-levels inside the cells have
had a good specificity, the sensitivity has been worse (Gomez-Lechon et al 2001).

18
Conventional cytotoxicity assays usually measure end-stage toxicity (O’Brien et al
2006). However, even severe toxicity is not always lethal. Also, most cytotoxicity
assays do not include preincubation with drugs for days, even if the in vitro cytotoxicity
often takes several days to unfold (O’Brien et al 2006). In addition, most assays express
only one endpoint, even if the toxicity is often caused by multiple mechanisms that need
to be tested separately by different methods (Gerets et al 2008, Jaeschke et al 2002).
High Content Screening (HCS) is one of the latest improvements in the automation of
quantitative epifluorescence microscopy and image analysis (O’Brien et al 2006). It
includes the application of the multiparameter fluorescent probe technology. In
principle it is a sophisticated image analysis program equipped with a microscope
situated in a box (Irwin et al 2007; Thermo Scientific 2010). It is a way to understand
compound activities in cell based assays where different parameters can be measured
and observed: the distribution of certain targets in a cell or individual cell or organelle
morphology (O’Brien et al 2006). High content screening also enables kinetic
monitoring of multiple biomarkers of processes that cause toxicity using live cells in
vitro. When comparing to other methods and technologies automated fluorescent
imaging enables non-invasive, very sensitive and safe detection (Terai and Nagano
2008). In a HCS assay each well is usually measured multiple times including many
different drug concentrations, which provides more confidence to the collected data
(Irwin et al 2007).
Cells used in HCS techniques are usually primary cells or tumor cell cultures. It is also
possible to use fluorescent-labelled histological slides (Irwin et al 2007). The goal of the
assay determines if it is more reliable to use live versus fixed, and animal versus human
cells. For example, compounds tested may cause either cytostatic or cytotoxic effect,
and the cytostatic effects are primarily seen with dividing cell populations, whereas
primary cells usually have limited ability to divide (Irwin et al 2007).

19
5.2 Fluorescent probes
Fluorescent probes are molecules that react with specific biological molecules and make
them visible from their environment (Johnson 1998). Probes cause a change in either
the fluorescence intensity or excitation/emission wavelength: in general, change in the
photochemical properties (Terai and Nagano 2008). The changes in the intensity, as
well as the modulation of the fluorescence signal as a result of the “activation” (e.g.
permeabilization of mitochondria) and “accumulation” (e.g nuclear translocation) can
be measured (Terai and Nagano 2008). According to these changes the analysis of the
results is carried out. Fluorescent probes have been used since 1980’s. Nowadays more
and more probes with improved properties are available for the biological applications.
There are probes separately for enzymes and proteins as well as for lipids, membrane
potential measurements and ions (Johnson 1998).
As an example in the figure 5 untreated primary rat hepatocytes have been stained with
mitochondrial membrane potential dye Tetramethyl Rhodamine Methyl Ester (TMRM)
(20nM) and nuclear dye Hoechst 33342 (0.8 µM). The red labelled structures are
mitochondria, the blue spots are nuclei.

20
Figure 5: TMRM (20 nM) and Hoechst 33342 (0.8µM) stained, untreated primary rat hepatocytes. TMRM is one of the most commonly used mitochondrial dyes and Hoechst 33342 stains nuclei. This picture taken with Cellomics ArrayScan by using 20x objective shows how cells appear under the microscope.
5.3 High Content Screening and mitochondria
As discussed earlier, mitochondria are common targets for toxicants due to their central
role in cell viability: they are sensitive markers of the cell health and stress (O’Brien et
al 2006). It has been shown that mitochondrial toxicity is one of the most sensitive
parameters measuring early cytotoxicity, among cell proliferation and nuclear area
(meaning condensation of the nucleus) (O’Brien et al 2006). Most of the mitochondrial
dysfunctions are seen as alterations in mitochondrial membrane potential or as lowered
activity in the enzymatic oxidoreductases (Pereira et al 2009). The early sign of the cell

21
injury in which mitochondria is trying to adapt is the growth in mitochondrial
biogenesis and specific mitochondrial enzymes activities (O’Brien et al 2006). HCS
enables the studying of the mitochondria in many ways. Mitochondrial proteins and
their significance in different diseases, mitochondrial pathways for cell signalling and
the structure of the mitochondria are all possible to examine by HCS (O’Brien et al
2006; Thermo Scientific 2010b). The mechanistically-based analyses allow to study the
effects to mitochondrial genetics, calcium homeostasis and oxidative phosphorylation
(Pereira et al 2009). Such assays are sensitive and enormous amount of data can be
obtained. This information can be used to construct databases to determine if there are
some mechanistically different types of mitochondrial toxicities that might have some
common structural motifs. This may eventually lead to the design of new drug
candidates with lower risk to mitochondria and improving the success rates in the
development of new drugs (Dykens and Will 2007).
6. SUMMARY
Mitochondria are important in measuring early-stage toxicity in the liver cells due to
their key role in cell functions and death. Both types of cell death, physiological cell
death apoptosis and accidental cell death necrosis, involve two-step process to be
activated. First, several physiological and pathological stimuli trigger the increase in
mitochondrial membrane permeability (Sas et al 2007). This releases the proapoptotic
factors and destroys the electrochemical gradient over the inner mitochondrial
membrane. Also the MPTP is formed. Secondarily the consequences of the
mitochondrial dysfunction (lost of the transmembrane potential, uncoupling of the
respiratory chain, ROS and RNS formation, outflow of Ca2+ and glutathione and release
of the intermembrane proteins, e.g. cytochrome c) lead to either plasma membrane
disruption (necrosis) and / or activation of the caspases leading to apoptosis (Brookes
2005 Jaeschke et al 2001). The rate of these two processes (protease/endonuclease
activation versus bioenergetic catastrophe) defines whether a cell undergoes apoptosis

22
or necrosis. The fact that these mitochondrial events control cell death in liver as well as
in other organs has major implications for the development of new drugs. It is obvious
that methods that more faithfully report mitochondrial toxicity would serve the early
stages of drug development by filtering out the mitochondrial toxic drugs which would
further lead to savings in time, money and resources (Dykens and Will 2007).

23
II EXPERIMENTAL PART
7. INTRODUCTION
High Content Analysis (HCA) means the process where image acquired from sensitive
camera equipped high-resolution light microscope (usually a fluorescence microscope)
is analyzed automatically with appropriate software producing a lot of information (this
is why the term used is High Content). High content screening (HCS) is based to the
HCA, combining the integration of the use of fluorescence based reagents, optical
imaging instrumentation and image analysis software to automatically measure
physiological processes in the cells. The term “screening” usually means analysis which
is done using at least 96 well plates and several molecules are tested simultaneously and
with high speed (Thermo Scientific 2010). The HCS analysis progress is show in figure
6.
Figure 6: How does HCS analysis progress. Four steps in HCS: First (after choosing the suitable cells for specific assay) is the sample preparation including cell production and

24
plating, cell treatment, probe exposure and fixation of the cells if needed. The second step is to do the image acquisition, meaning defining the input parameters, exposure times and channels used. The third step is the image analysis and the fourth, final step the data analysis.
Advantages
Advantages in HCS compared to former analysis techniques are its capability to analyse
pictures automatically,not manually (Thermo Scientific 2010). Especially in screening
manual analysis of the pictures would take far too much time. In addition, it is possible
to scan multiple parameters per cell at the same time using HCS– this is a clear
advantage when comparing to conventional screening methods. The drug responses are
not limited to only one cellular object, which causes that the physiological relevance is
high. Analysis is also possible to be performed on single cell level or sub-cellular level.
The data obtained can be stored and analyzed again and again. Additional information is
possible to reach without performing the cell culture again in the limits of it
infrastructure (see challenges).
Challenges
Major challenges in HCS technique are high variability between assays and the huge
amount of data it is producing, which causes problems to IT infrastructure. The reason
for high variability is microscopical technique, when differences can be measured from
single cell -level. Image analysis and parameter setting is demanding especially in
cytotoxicity measuring when the appearance of untreated and treated cells can vary a
lot. In addition, finding a suitable cell model and culture conditions for HCS might be
challenging. Also HCS instrument is a big investment for organization.
8. SPECIFIC AIMS OF THIS STUDY
The major goal of this study is to set up and optimize new HCS methods for early drug
cytotoxicity screening. The objective was to implement more reliable, sensitive and
robust methods with higher throughput screening. Because mitochondria play an

25
important role in cytotoxicity, the special focus of the study was in the mitochondrial
toxicity measurement.
The specific aims of the study were:
1. To implement, optimize and compare mitochondrial toxicity HCS assays in live
cells and fixed cells in two cellular models: HepG2 hepatoma cell line and rat
primary hepatocytes.
2. To compare the results of HCS cytotoxicity assays with conventional cytotoxicity
assays (ATP and LDH measurements)
9. MATERIALS AND METHODS
9.1 Materials and reagents
Chemicals
Dulbecco’s Modified Eagle Medium (1X) (DMEM, Gibco, Invitrogen #21969-035),
Fetal Bovine Serum (heat Inactivated; Gibco, Invitrgen #10500-064), Penicillin-
Streptomycin liquid 100X (Gibco, Invitrogen #15140-122), GlutaMAX 200mM (Gibco,
Invitrogen 35050-038), Sodium Pyruvate MEM (Gibco, Invitrogen S11360-039),
Trypsin-EDTA (Gibco, Invitrogen #15400-054), Hoechst 33342 (Invitrogen H3570),
Dulbecco’s phosphate buffered saline (Gibco 14190), Minimum Essential Medium,
MEM (Gibco, 51200-046) were acquired from Gibco, Invitrogen. Non-essential amino
acid solution 100x, without L-glutamine (Sigma, M7145-100ML), Staurosporine
(Sigma S4400), Rotenone (Sigma R8875) and Dimethyl Sulphoxide (DMSO, Sigma,
D2650) were acquired from Sigma. Tolcapone was from Orion Oyj, Orion Pharma.
ATP reagent (BioThema 155-050) was acquired from BioThema. LDH cytotoxicity
assay kit (Roche 11644793001) was acquired from Roche. Tetramethylrhodamine
methyl ester, perchlorate TMRM (Molecular Probes T668), Mitotracker Red CMXRos
26
(Molecular Probes, M7152) and Alexa Fluor488 goat anti-mouse IgG (H+L) (Molecular
Probes A11001) were acquired from Invitrogen (Molecular Probes). Mycoalert Assay
kit (Lonza, LT07-118) was acquired from Lonza. Primary purified Mouse Anti-
Cytochrome c (BD BioScienses 556432), 96-well plates NUNC plastic (BD 167008)
and poly-d-lysine coated (BD, BDAA356407) were acquired from BD Bioscienses.
9.1.1 Cell Models
In this thesis two cell models were used: human hepatoma cell line HepG2 and primary
rat hepatocytes. These two were chosen since they are both widely used in drug
development (Hewitt et al 2007; O’Brien 2008). HepG2-cell line is best characterized
and most frequently used cell line in drug development (Brandon et al 2006). In general,
two major bioinformation pathways exist in metabolic processes in liver: phase I and II.
Cytochrome P450 pathway is the most important (and largest) of phase I enzymes;
major enzymes of the phase II enzymes are sulfotransferase (SULT), uridine
diphosphoglucuronosyl transferase (UGT) and glutathione transferase (GST). HepG2-
cells express many of the phase I and II enzymes: for example nearly all phase II
enzymes (excluding UGT) exist (Westerink and Schoonen, 2007a). Primary
hepatocytes, when handled and isolated appropriately, contain a broad complement of
transport proteins and metabolic enzymes: both phase I and II. However, the expression
of these enzymes is lower with HeoG2-cells than with primary hepatocytes, which may
affect to metabolism of tested compounds. Controversially, HepG2-cells are easier and
cheaper to handle and cultivate than primary rat hepatocytes, but derived from rat, when
researching human drugs the correlation between human and rat becomes an issue.
These two cell models were both handled and treated similarly in experiments and the
results were compared: these are told in detail below.
HepG2
In this study, Hep G2 cells (obtained from ATCC, passage number before acquiring
cells unknown) were used as a cellular model system to implement new cytotoxicity
assays for the drug screening. The cell stocks were stored in liquid N2. They were

27
grown according to ATCC instructions in flat-bottomed culture flasks. Cell cultivations
and treatments were done in a cell incubator HeraCell (Heraeus, Kendno Laboratory
Products) and a laminar flow hood (Kojair). Hep G2 cell vials including 10 x 10^6 cells
/ vial were taken from the liquid nitrogen storage tank and thawed quickly in a water
bath at +37°C (Julabo EcoTemp TW12) and transferred to grow in flasks. Cells were
grown in a cell culture incubator at 37oC and 5% CO2 in humidified atmosphere in
Dulbecco’s Modified Eagle medium (DMEM) or Minimum Essential Medium (MEM)
supplemented with 10% heat inactivated FBS, 1% penicillin-streptomycin, 1%
glutaMAX I and 1% non-essential amino acids mixture. In addition, MEM was
supplemented with 1% Sodium Pyruvate MEM.
Used solutions were prewarmed to +37oC in water bath. Cells were treated gently to
avoid causing any harm to them (e.g. breaking the cell membrane). It was paid attention
that during subculturing or other treatments the cells were not let to dry or be too long
time in a washing buffer.
Subculturing procedure
New cultivations were started in 25cm2 flasks to help cells to reach appropriate
confluence. After the cells had reached the confluence of ~80%, they were transferred
into 75cm2 flasks. Old medium was removed and cells were rinsed twice with
Dulbecco’s phosphate buffered saline (á 15ml). To detach the cells trypsin-EDTA (5
ml) was added and the cells were kept in the incubator for 2 minutes or more if needed.
The detachment of the cells was assured under microscope. Adherent HepG2- cells
looked longish in poly-d-lysine coated -flasks and detached ones were round shape. In
NUNC plastic non-coated flasks the difference was not that obvious, cells were round
shape both when attached and detached. Extra attention was paid to those cells to make
sure they had detached properly. Trypsin was inactivated using culture media, either
DMEM or MEM, by adding 5ml of the medium to culture flasks. Cells were pipetted
back and forth to dislodge and break the cell clumps. Cells were transferred into new
75cm2 culture flasks, in ratio 1:2 or 1:5, depending on the purpose when they were
needed for the next time. ATCC recommends subcultivation ratio to be 1:4-1:6 and the
medium renewal twice a week. In these experiments, cells the following ratios were

28
used: 1:2 one day before 80% confluence, and 1:5 three or four days before 80%
confluence. Cells, which were trypsinized and transferred to new flask, formed a new
passage which was marked using P-letter (P4, P5 or P6 etc). The highest passage
number used in this study was P15, because cells were not passaged more than 10 times
after thawing.
Optimization of culture plates, cell confluence and medium used
In order to plate the cells to 96-well plates, the cell count was performed by cell counter
(Bûrger). Normally, the volume of media in each well was 100µl, and the desired cell
density was optimized for each treatment as discussed in the following. After seeding
the cells to 96-well-plates, the cells were observed under a phase contrast microscope on
daily basis for 4 days. Photos were taken each day using Olympus Ix50. The fresh
media was changed after two days of plating according to ATCC recommendations.
Flasks had filter caps for good gas exchange.
Mycoplasma test
HepG2-cells were tested for mycoplasmas with Mycoalert Assay kit (Lonza, LT07-
118). MycoAlert reagent and Mycoalert Substrate were prepared according to
manufacturer’s instructions. Reagent vial was mixed and let to equilibrate for 15
minutes at room temperature. MycoAlert assay Control set was used as a negative and
positive control. One ml of MycoAlert Assay Buffer was added into the vial containing
the lyophilized MycoAlert Assay Control (positive control). MycoAlert Assay buffer
was used as negative control.
For mycoplasma testing 2 millilitres of cell culture supernatant was centrifuged at 740G
(1500RPM) for 5 minutes. 100µl of cleared supernatant was transferred to luminescence
compatible plate. 100µl of MycoAlert Reagent was added to each sample and incubated
for 5 min before the first luminometric measurement. 100µl of MycoAlert substrate was
added to each sample and after 10 minutes the second measurement was performed
followed by the calculation of ratio: 21
tMeasurementMeasuremen

29
Primary rat hepatocytes
Male HanTac: WH-rats (Taconic M&B, Ry, Denmark), weight about 300g, age about 7
weeks were used to isolate fresh hepatocytes by in situ collagenase perfusion (Seglen P,
1976). Rats were anesthetized with Mebunat (60 mg/ml) 70 mg/kg prior to undergoing
liver perfusion. All animals used were handled in accordance with the principle of
Animal Ethics committee of the state Provincial Office of Southern Finland,
Hämeenlinna –approved animal protocol for hepatocyte perfusion.
Primary rat hepatocytes were seeded to commercially collagen-coated 96 well plates,
30000 cells to each well. Desired viability was above 80% and it was determined using
cell counter (Byrger). William’s E medium supplemented with 10% FCS, 2mM
glutamine, 10mM Hepes, 50 µg/ml gentamycin, 1µM insulin, 40ng/ml dexamethasone
and 2.5 µg/ml amfoterisine was used as a culture medium. After 2 hours of seeding,
cells were washed with pre-warmed 37oC PBS 100µl/well to remove dead cells from the
wells. Dead cells cause autofluorescence with certain probes and will be discussed in
more detail later. After washing with PBS, medium was changed to serum free
medium. Cells were washed with pre-warmed PBS again just before experiments.
9.1.2 Probes
Four different fluorescence probes were used in these studies: Hoechst 33342,
tetramethylrhodaminemethylester (TMRM), Mitotracker Red CMXRos and cytochrome
c primary antibody together with Alexa 488 conjugated secondary antibody. Of these
four probes, Hoechst 33342 and TMRM were used together in live cell method, whereas
Hoechst 33342, Mitotracker Red CMXRos and cytochrome c antibody together with
Alexa 488 conjugated secondary antibody were used in fixed cell method. In order to
avoid mitochondrial toxicity and potential artefacts caused by fluorophores, the
concentrations of the dyes were kept as low as possible.
30
Hoechst 33342
Hoechst 33342 is a bisbenzimide dye which is cell membrane-permeant and and binds
to minor groove of DNA. It is widely used for staining the nuclei of living cells in many
cellular applications, including cell-cycle and apoptosis studies (Invitrogen 2010). As
described in the literature part of this thesis, the characteristic breakdown of the nucleus
during apoptosis comprises collapse and fragmentation of the chromatin, degradation of
the nuclear envelope and nuclear blebbing. Hoechst 33342 is lipophilic and therefore it
is readily taken up by intact cells or during the initial stages of apoptosis, which is an
advantage in this experiment when comparing to other nucleus stains. In addition
Hoechst 33342 can be excited by the most conventional fluorescence excitation sources
and it exhibits relatively large Stoke shifts, thus making it suitable for multicolour
labelling techniques. Hoechst 33342 excitation / emission maxims are 350 / 460nm. It
fluorescents bright blue / cyan -colour upon binding to DNA.
Tetramethylrhodamine methyl ester, TMRM
TMRM is a potentiometric, mitochondria-selective stain, which is accumulated to live
mitochondria driven by membrane potential (Ehrenberg et al 1988). It is rapidly and
reversibly taken up by healthy, live cells. It is non-toxic and highly fluorescent. During
cell death, active mitochondria are disrupted. Disruption includes changes in membrane
potential and alterations to the oxidation-reduction potential of the mitochondria due to
the opening of the mitochondrial permeability transition pore (MPTP). The opening of
MPTP allows small molecules and ions to pass through the mitochondrial membrane.
The result is decoupling of the respiratory chain and the release of cytochrome c into the
cytosol as well as the loss of membrane potential, which leads to cell death. Due to all
these changes during apoptosis, TMRM is not working in dead cells and the reduced
intensity of TMRM fluorescence in the cells is a marker of apoptosis. In this study, two
parameters were measured. The reduced membrane potential is seen as a reduced
intensity of fluorescence of TMRM. The second parameter measured was the area of
mitochondria, which is, as well as the intensity of fluorescence, smaller in apoptotic
cells. When these parameters are compared to those parameters of the healthy cells, the
apoptotic status of cells can be predicted. The excitation and emission maxims of
TMRM are 548nm and 573nm, respectively.
31
MitoTracker Red CMXRos
Mitotracker Red CMXRos is cationic, lipophilic cell-permeant probe, which contains a
midly-reactive chloromethyl moiety for labelling mitochondria (Gilmore et al 1999).
When cells are incubated with this probe, it passively diffuses across the plasma
membrane and accumulates in active mitochondria upon membrane potential: cationic
fluorophore accumulates into the negatively charged mitochondrial matrix. It is also
retained in the mitochondria after fixation of the cells, due to the chloromethyl group
which binds to mitochondrial proteins. Its emission / excitation maxims are 578 / 599
nm. In this study, MitoTracker Red CMXRos staining was aimed to be used to study the
colocalization of mitochondria and the cytochrome c between healthy and damaged
cells. However, the method to be used required optimization, that was beyond the time
limit of this thesis. Therefore, the results of this staining are not shown.
Cytochrome c antibody and Alexa 488 conjugated secondary antibody
Rat cytochrome c-antibody was used as a primary antibody. It is a monoclonal antibody,
which is produced in mouse cells. In these cells, rat cytochrome c has been used as an
antigen. Alexa 488 conjugated anti-mouse IgG was used as a secondary antibody. (Bd
Bioscienses 2010).
Cytochrome C is a water-soluble protein which either promotes cell survival or death
depending upon its intracellular location (more details, see literature part, chapter 3.1
Apoptosis and necrosis). Proapoptotic stimulus releases cytochrome c to cytosol, where
it activates caspases that lead to apoptotic cell death. Cytochrome c-antibody recognizes
the cytochrome c and binds to it. Alexa 488 conjugated to goat anti-mouse IgG (H+L)
secondary antibody was used as fluorophore to detect cytochrome c localization. Alexa
488 emission / excitation maxims are 495/519 nm.
Table 1: Cellomics ArrayScan filters and wavelengths. The four probes used in experiments and the wavelengths for excitation / emission and the Cellomics ArrayScan filters used.

32
9.1.3 Model substances
In this study three different substances known to be toxic to mitochondria were used:
staurosporine, rotenone and tolcapone. Staurosporine, rotenone and tolcapone
concentrations, 7 concentrations each (0.078, 0.016, 0.3125, 0.625, 1.25, 2.5, 5.0 and
10.0µM staurosporine, 0.078, 0.016, 0.3125, 0.625, 1.25, 2.5, 5.0 and 10.0µM rotenone
and 0.78, 0.16, 3.125, 6.25, 12.5, 25, 50 and 100µM tolcapone) were chosen according
to literature and optimized so that the toxicity is seen with chosen concentrations
(Tafazoli et al 2004; Feng and Kaplowitz 2002). The sedimentation of the drug
compounds with previously mentioned concentrations was done using nephelometer.
No sedimentation was found using these concentrations.
Hoechst 33342 TMRM Mitotracker
Red CMXRos
Cytochrome c
ab + Alexa488
conj. sec ab
Parameter Cell count, nucleus
area and intensity
Mitochondria
intensity and area
Localization of
mitochondria
(Colocalization
with Cytochrome
c)
Localization of
cytochrome c in
cells
(Colocalization
with
mitochondria)
Emission/
Excitation
350/460 nm 548/573 578/599nm 495/519nm
Filter used
in
Cellomics
ArrayScan
XF93 Hoechst
33342,
XF93 TRITC XF93 TRITC XF93 FITC
Excitation
filter wave-
lenghts
365±25 nm -
515±10 nm
549±4 nm -
600±13 nm
549±4 nm -
600±13 nm
475±20 nm -
515±10 nm
33
Staurosporine
Staurosporine is a microbial alkaloid broad spectrum inhibitor of protein kinases,
especially protein kinase C (PKC) and has been shown to induce apoptosis through
mitochondria-mediated cell death signalling (Fallon 1990, Wang et al 2008).
Staurosporine induces mitochondria dysfunction figured as cytochrome c release and
bid cleavage, but it also induces both caspase-8 and caspase-9 cleavages (the role of bid
is discussed in detail in section 3: Apoptosis and necrosis). These two, caspase-8 and
caspase-9, are caspases which can induce apoptosis (see literature part).
Rotenone
Rotenone is a naturally occurring botanical compound obtained from the roots of Derris
sp. It is an inhibitor of mitochondrial electron transport, specifically inhibiting NAD-
linked substrate oxidation by mitochondria at the oxygen side of NADH dehydrogenase
(complex I). This increases the formation of ubisemiquinone, the primary electron
donor in mitochondrial superoxide generation and leads to formation of reactive oxygen
species (ROS) and decreased formation of ATP. As told in the literature part of this
thesis, the extend formation of ROS may lead to apoptosis. With rotenone, apoptosis is
closely linked to formation of ROS (Li et al. 2003). The reaction is dose-dependent.
Tolcapone
Tolcapone is a catechol-O-methyl (COMT) transferase inhibitor which was indicated to
treat Parkinson’s disease but was withdrawed from market soon after (Tafazoli et al
2005). Nowadays it is back on the market with black box warnings (Dykens and Will
2007). The exact mechanism of toxicity remains obscure, but it has been suggested that
mitochondrial uncoupling of oxidative phosphorylation may be involved in cytotoxicity
and hepatotoxicity (Haasio et al. 2002). In the liver, tolcapone is metabolized to amine
and acetylamine (Smith et al 2003). These metabolites are supposed to form reactive
species and cause oxidative stress, which leads to GSH oxidation and lipid peroxidation.

34
9.2 Optimization of live cell method
The following steps in optimizing live cell method were done only for HepG2-cells. In
order to optimize the cell density for the experiments, three replicates of 2000, 4000,
5000, 8000, 10000, 16000, 20000 and 40000 cells/well were plated to 96-well plates.
Two different materials were tested: non-coated plastic or poly-d-lysine coated 96-well
plates. The confluence, as well as growth and overall condition of the cells, were
observed daily for four days using phase contrast microscope.
Cells were let to attach and recover for either 20 hours (HepG2) or 24 hours (primary rat
hepatocytes) in a cell incubator (37oC, 5% CO2). To find optimal test compound
concentrations cells were treated with 0.078-10µM staurosporine, 0.078-10µM rotenone
and 0.78-100µM tolcapone or vehicle only (0.5% DMSO) and incubated at +37°C, 5%
CO2 for either 2, 6 or 24 hours. As a control there were also non-treated cells without
DMSO.
After treatments, cells were loaded with Hoechst 33342 and TMRM at concentrations of
0.2, 0.4, 0.8 or 1.6 µM of Hoechst 33342 and 5 / 10 / 20 / 40 nM TMRM for 1 h. After
incubation, the cells were observed using Cellomics ArrayScan. Different exposure
times were used depending on the probe concentration, and according to the results the
optimum dye concentrations were chosen. This was done separately to both cell types,
for HepG2 and primary rat hepatocytes.
9.3 Optimization of fixed cell method
For optimization of fixed cell method the cells were treated similarly as described
above. For probe concentration testing cells were stained with 50 / 75 / 100 / 150 / 200
nm of Mitotracker Red CMXRos. Hoechst 33342 concentration was 0.8µM that was
was optimized in live cell method. Cells were observed using Cellomics ArrayScan and
after this cells were fixed.
35
Pre-warmed 3.7% formaldehyde solution was used for fixation of the cells. Pre-
warming ìs crucial to maintain cell integrity. Cells were incubated with fixation solution
in dark chamber at 37oC (not in a CO2- incubator) for 15 minutes. This was the
recommendation of manufacturer (invitrogen). Cells were washed twice with PBS á
100µl. Permeabilization was done using 0.2% triton X-100 solution, which was
incubated with the cells at room temperature for 10 minutes. Cells were washed once
with PBS before proceeding to immunocytochemistry protocol.
In immunocytochemistry protocol cells were first washed with 100µl/well of PBS. PBS
was then aspirated and cells were incubated in blocking buffer (10% FBS in PBS) at
room temperature for 15 minutes. After this cells were incubated with primary antibody
solution (antibody diluted in 1:150, 1:300 or 1:450 in PBS with 10% FCS and 0.2%
triton-X 100) for 2 hours in dark chamber in +37oC. After incubation with primary
antibody solution cells were washed three times for 5 minutes with wash buffer.
Secondary antibody / staining solution (antibody diluted in 1:150, 1:300 or 1:450 in
PBS with 10% FCS and 0.2% triton-X 100) was added, and cells were incubated at
room temperature for 45 minutes. Cells were washed twice with wash buffer and finally
wash buffer was replaced with PBS. Cells were evaluated with Cellomics ArrayScan.
To study if there were any photo bleaching or other changes happening during
immunocytochemistry staining cells were treated as normal and scanned after each step
when doing an immunocytochemistry protocol. The cells were stained with either of the
four following ways:
1: 0.8µM Hoechst 33342
2: 0.8µM Hoechst 33342 + 100nm Mitotracker Red CMXRos
3: 0,8µM Hoechst 33342 + 1:300 cytochrome c antibody and 1: 300 Alexa 488
conjugated secondary antibody or
4: 0.8µM Hoechst 33342 + 100nm Mitotracker Red CMXRos + 1:300 cytochrome c
antibody and 1: 300 Alexa 488 conjugated secondary antibody.
36
Cells were scanned in many stages: after Mitotracker Red CMXRos staining (=before
fixation), between fixation and permeabilization, after permeabilization before
immunocytochemistry, and also after blocking, before adding primary antibody to the
cells. This was done to see how the signal is changing during protocol and also to see if
there is leaking between different channels.
9.4 Cellomics ArrayScan VTI HCS Reader settings,
bioapplications and specific parameters of the cell imaging
measurements
Cellomics ArrayScan VTI HCS Reader is an automated epifluorescent Zeiss
microscope developed for HCS. It is situated in a box and image analysis software is
added to the computer that receives the images from microscope. Excitation source is a
mercury-xenon lamp which has a broad excitation spectrum. Lamp can be easily
changed when the excitation power is getting lower. Cellomics ArrayScan used in this
study has three different objectives: 10x, 20x and 40x and automated focusing.
Workstation can be equipped with plate handler. Six channels exist in Cellomics
ArrayScan. All the channels are possible to use with different bioapplications,
depending on the amount of probes and the aim of the study. Each channel is possible to
equip with different filter that define certain excitation/emission wavelengths for each
channel. This enables the use of different probes that need different wavelengths for
excitation and emission. Channels and filters used in these experiments are told in table
1.
Bioapplications are software that indicate which input parameters must be defined to
obtain certain output parameters and results from scans. They provide information of
the biological properties of the cells. Different parameters can be measured by different
bioapplications). Bioapplications used in this thesis, Cell Health Profiling and
Compartmental Analysis, are examples of the bioapplications that provide general
information of the cell. There is also bioapplications that report more specific features

37
of the cells available: total amount of different bioapplications is 18 at the moment.
Data obtained by using each bioapplication can be from individual cell level to a
subpopulation of cells or to the whole population of the cells in a well. Data of each cell
includes size, shape, the amount of fluorescent label (meaning intensity) and pattern of
fluorescence.
Cell Health Profiling -Bioapplication
Cell Health Profiling protocol was used in live cell analysis. This bioapplication is used
to measure different cell health indicators (mitochondrial transmembrane potential,
nucleus morphology and size) from both nucleus area and cytoplasm (circ and ring, will
be discussed in detail later). The primary object is defined at channel 1 (Hoechst 33342-
stained nuclei) and the measurement regions at other possible channels 2-6 is derived
from this. In this experiment only channel 2 was used to measure mitochondrial
transmembrane potential using staining of the cells with TMRM.
Compartmental Analysis -Bioapplication
Compartmental Analysis -bioapplication was used for fixed cells. Compartmental
Analysis is used to determine the movements of macromolecules in or between
particular cellular regions, compartments or organelles (Thermo Scientific 2010).
Compartmental Analysis is a High Content Screening bioapplication which allows the
simultaneous quantitation of different macromolecules between four different cellular
regions: cellular circ, cellular ring, circ spots and ring spots, as seen in Figure 7. To do
this, the application measures the intensity from a primary cellular object in channel 1
(Nucleus) and after this the intensity from distinct regions of the cell, as well as the
intensity ratios and differences from the different regions. In cells which are stained
with cytochrome c antibody and Alexa 488 conjugated secondary antibody, the
movement of cytochrome c from mitochondria to nucleus after apoptosis can be
detected using Compartmental Analysis -bioapplication. The intensity of Alexa 488 in
nucleus (circ spots) is compared to the intensity of Alexa 488 in cytoplasm (ring spots)
to see the difference. This difference or ratio should be increasing in apoptotic cells,
when some of cytochrome c is leaking from mitochondria and moving to cytosol and
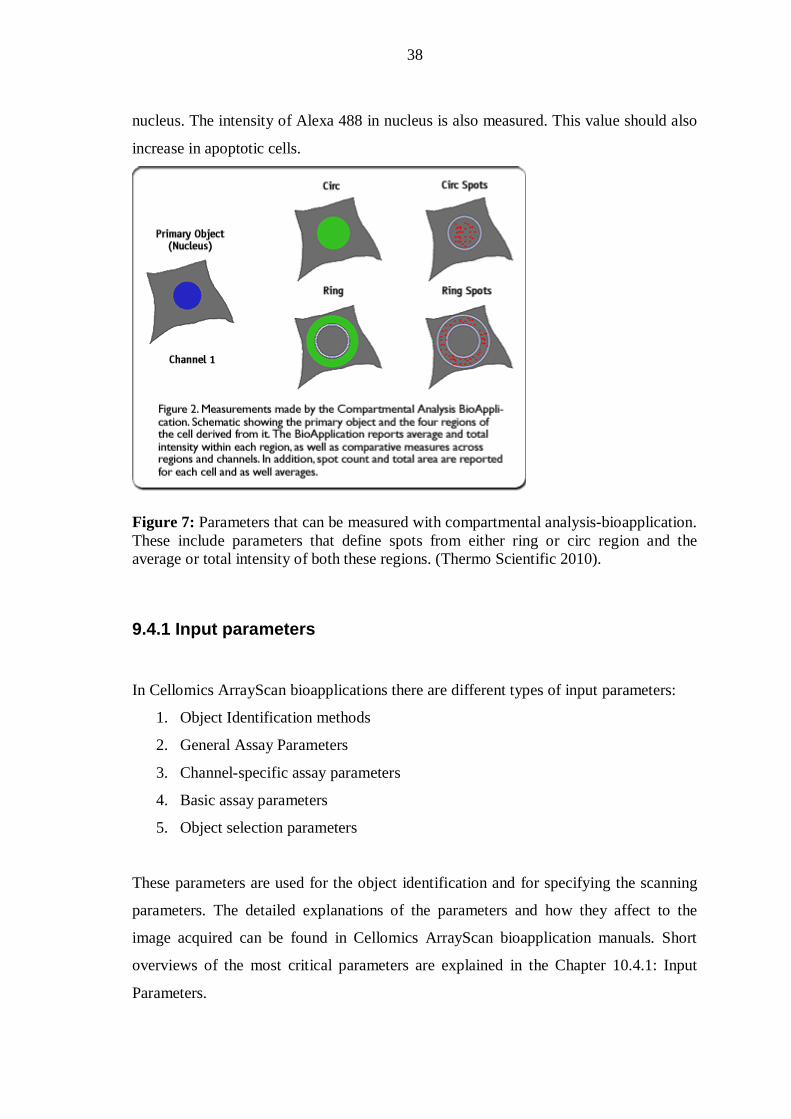
38
nucleus. The intensity of Alexa 488 in nucleus is also measured. This value should also
increase in apoptotic cells.
Figure 7: Parameters that can be measured with compartmental analysis-bioapplication. These include parameters that define spots from either ring or circ region and the average or total intensity of both these regions. (Thermo Scientific 2010).
9.4.1 Input parameters
In Cellomics ArrayScan bioapplications there are different types of input parameters:
1. Object Identification methods
2. General Assay Parameters
3. Channel-specific assay parameters
4. Basic assay parameters
5. Object selection parameters
These parameters are used for the object identification and for specifying the scanning
parameters. The detailed explanations of the parameters and how they affect to the
image acquired can be found in Cellomics ArrayScan bioapplication manuals. Short
overviews of the most critical parameters are explained in the Chapter 10.4.1: Input
Parameters.

39
9.4.2 Output parameters
Output parameters are the actual results of the scans in numeric form. Output
parameters are specific for each bioapplication used, and thus are not discussed here in
detail. All available parameters for Cell Health Profiling bioapplication and
Compartmental Analysis bioapplication can be found in the manuals of these
bioapplications (Thermo Scientific 2010). Optimization of selected output parameters
for these assays is explained in the Chapter 10.4.2: Cellomics results and Output
parameters.
9.5 Conventional analysis of cytotoxicity
Cells were grown the same way than in live cell method. DMSO concentration in
treatments was 0.5 %, which was the concentration used in reference wells for negative
control. As a positive control cells were treated with 0.2% digitonin. Digitonin is a cell
membrane-perturbing detergent causing cell death. After incubation the media were
pipetted to clear 96 well plates and stored in -80oC for LDH assay. Trichloroacetic acid
(TCA) was added to the cells, and the cell plates were stored in -80oC for ATP assay.
9.5.1 ATP assay
Adenosine triphosphate, ATP, is crucial for cells. The amount of ATP is decreased
during apoptosis. Cells in TCA were let to melt at room temperature for at least 1 hour.
Plates were centrifuged 260G (2500RPM) for 10 minutes at room temperature (22oC).
10 µl of each sample was added to a well of a white 96 well plate. 90µl of neutralizing
buffer (Tris-EDTA-buffer) was added and pH of the sample was measured. 25µl of
ATP reagent was dispensed by a dispenser to each well. ATP reagent used was firefly-
luciferin reagent with a stable light emission, with a decay rate of 0.9% in minute.

40
When reagent is added among sample, firefly luciferase reaction takes place. Reaction is
as following:
LIGHTCOinoxyluciferPPAMPOluciferinDATP iluciferase
22
In this reaction, the consumption of ATP is low and luciferase activity remains
unchanged during measurement. This allows cellular release of ATP to be monitored
during the measurement. Measurement was done using Fluoroscan Ascsw26. (Biothema
2010)
9.5.2 LDH assay
Lactate dehydrogenase, LDH, is a stable cytoplasmic enzyme found in all cells. After
cell membrane damage, LDH is released from cells to cell culture and can be measured.
As described above, 96 well plate cell-free culture media were stored at -80oC. They
were let to melt at room temperature for 1 to 1.5 hours. Media were centrifuged 10
minutes 250g at room temperature (+22oC). 20 µl of each supernatant was transferred to
a clear, flat-bottom 96-well plate. 30 µl of PBS was added to each well. Plates were
shaken for about two minutes. 50µl of LDH-reagent (includes pyruvic acid, NADH and
phosphate buffer) was added to each well and plates were incubated 20 minutes in dark
at room temperature. During incubation LDH-reaction mixture reacts with sample in
two steps. First NAD+ is reduced to NADH/H+ by the LDH-catalyzed conversion from
lactate to puryvate. Second, the catalyst transfers H/H+ from NADH/H+ to the
tetrazolium salt INT which is reduced to red coloured formazan. The intensity of this
colour was measured with Labsystems iEMS Reader. The higher the amount of LDH,
the more formazan is formed and the more intense the red colour. Formazan dye formed
has an absorption maximum at 500nm, where tetrazolium salt INT shows no absorption
(Roche 2010).
9.6 Evaluation of phototoxicity
41
Phototoxicity means toxic effects caused by the excitation of the probes in the cells and
it may cause the errors to the results particularly when measuring cytotoxicity by
fluorescent probe based methods. Phototoxicity is often dependent of the probe used
and it is thought to be the result of the non-radiative energy transfer during the
excitation of the probe. This may form free oxygen radicals. For this reason the
exposure time when scanning cells with Cellomics ArrayScan should be as short as
possible.
To see if there was significant phototoxicity in these experiments cells were first
distributed to 96 well plates. They were let to attach over night, about 20-24 hours.
Cells were stained with 0.2 / 0.4 / 0.8 / 1.6 µM Hoechst 33342 and 5 / 10 / 20 / 40 nM
TMRM. There were two plates, and only the other one was exposured using Cellomics
ArrayScan. ATP was measured from both plates, and results were compared to see if
there is difference between exposured and non exposured cells.
10. RESULTS
10.1 Optimization of cell culture conditions
HepG2
The optimization of cell culture conditions of HepG2 cells was done in many phases.
The amount and confluence of the cells in the wells of a 96-well plate were optimized,
and the influence of plate- and flask materials and coating, as well as different media
and their amount was studied. In the end of each optimization stage the cells were
stained using nucleus dye Hoechst 33342 and the plates were scanned using Cellomics
ArrayScan. The optimal cell culture settings were determined based on Cellomics
ArrayScan scan results and how the cells looked like under a normal phase microscope.
Particularly the confluence and the shape of cells were evaluated, since they both are
42
critical factors for successful image analysis and also indicate well-being of the cells.
The aim was to reach a state were the cells grow in a monolayer around 80 % confluent
at the time of scanning and they are big enough so that the nucleus and cytosol could be
easily identified and measured in image analysis.
Cell amounts tested vary from 2000 cells to 40000 cells in each well. The growth of the
cells was observed during several days. When scanned using Cellomics ArrayScan, the
optimal cell density was around 10000 cells in each well when the experiment was done
on the next day, and thus this was the amount of cells decided to use in these
experiments. If less than 10000 cells were subcultured in a well, the confluence was too
low, whereas more than 10000 cells / well caused cells to be close to each other and the
cells and nuclei could not be separated using Cellomics ArrayScan image analysis tools.
Two different culture media for HepG2 cells were used and compared in this study:
DMEM and MEM, one plate with DMEM and the other with MEM. Biggest difference
between these two mediums is the amount of glucose (DMEM: 4500mg/l, MEM:
1000mg/l ) and the lack of phenol red in MEM. In both mediums, glutamax I contains a
necessary amino acid L-glutamine in the stabilized form as dipeptide L-Alanyl-L-
Glutamine. This is an essential component of most cell culture media and serves as a
source of energy. Non-essential amino acids stimulate growth and prolong the viability
of the cells. In MEM, where there is no that much glucose, sodium pyruvate was used as
a source of carbohydrates. Different media were tested because the medium may have
an effect to the growth of the cells and behaviour in cytotoxicity tests, and the phenol
red in DMEM may cause some autofluorescence in Cellomics ArrayScan scans. Cells
were observed daily during four days and the differences in cell growth were followed.
No major differences were seen between the two media. In MEM, cells grew just a little
faster than in DMEM. In addition because there was a concern that the phenol red in
DMEM could cause some autofluorescence in Cellomics ArrayScan scans the MEM
was decided to use. The images of the HepG2 cells grown in DMEM and MEM media
are shown in figure 8.

43
Figure 8: The effect of medium for the growth of HepG2 cells: On the left is DMEM, MEM is on the right. Cell density 10000 cells / well, pictures have been taking one day after cultivation with a phase contrast microscope equipped with camera using 10x objective.
The amount of the medium was also tested, since it may have an effect to the growth
and distribution of cells especially in 96-well plates. To study this, HepG2 cells were
grown in 100ul or 200ul of medium / well of a 96-well plate for four days and the
differences were observed microscopically. No differences were seen in cell growth
between different amounts of medium. The smaller amount (100 µl) of medium / well
was decided to use, since less media, probes and particularly new drug candidate
molecules are consumed this way.
To study the effect of plating material on HepG2 growth the cells were cultivated on
plastic (NUNC, BD Bioscienses 167008) and poly-d-lysine coated (BD Bioscienses,
BDAA356407) flasks and 96-well plates. HepG2 cells grew better in poly-d-lysine
coated material than in NUNC plastic plates and flasks: the cells grew faster and they
were distributed more evenly in the wells with poly-d-lysine coating. In NUNC plastic
flasks and plates the cells grew in clumps and the identification of individual cells by
Cellomics ArrayScan image analysis tools was difficult or impossible. Therefore, poly-
d-lysine coated culture vessels were decided to use for HepG2 cells. The images of
HepG2 cells cultivated on two different plating materials are shown in Figure 9
(pictures from phase contrast microscope) and 10 (pictures from Cellomics ArrayScan).

44
Figure 9: The effect of plating material on the growth of HepG2 cells. NUNC plastic plate is on the left, poly-d-lysine coated plate on the right. Pictures are taken under a phase contrast microscope using 20x objective one day after plating of the cells (10000 cells / well).
Figure 10: The effect of plating material on the growth of HepG2 cells. NUNC plastic plate is on the left and poly-d-lysine coated plate is on the right. Cells are stained with 0.8µM Hoechst 33342 and pictures are taken using Cellomics ArrayScan 20x objective one day after plating of the cells (10000 cells / well).
Mycoplasma testing
To study that HepG2 cells are not infected by mycoplasmas they were tested using
Mycoalert assay. Mycoplasmas are the smallest and simplest prokaryotes, and they are
dependent on their hosts for many nutrients due their limited biosynthetic capabilities.
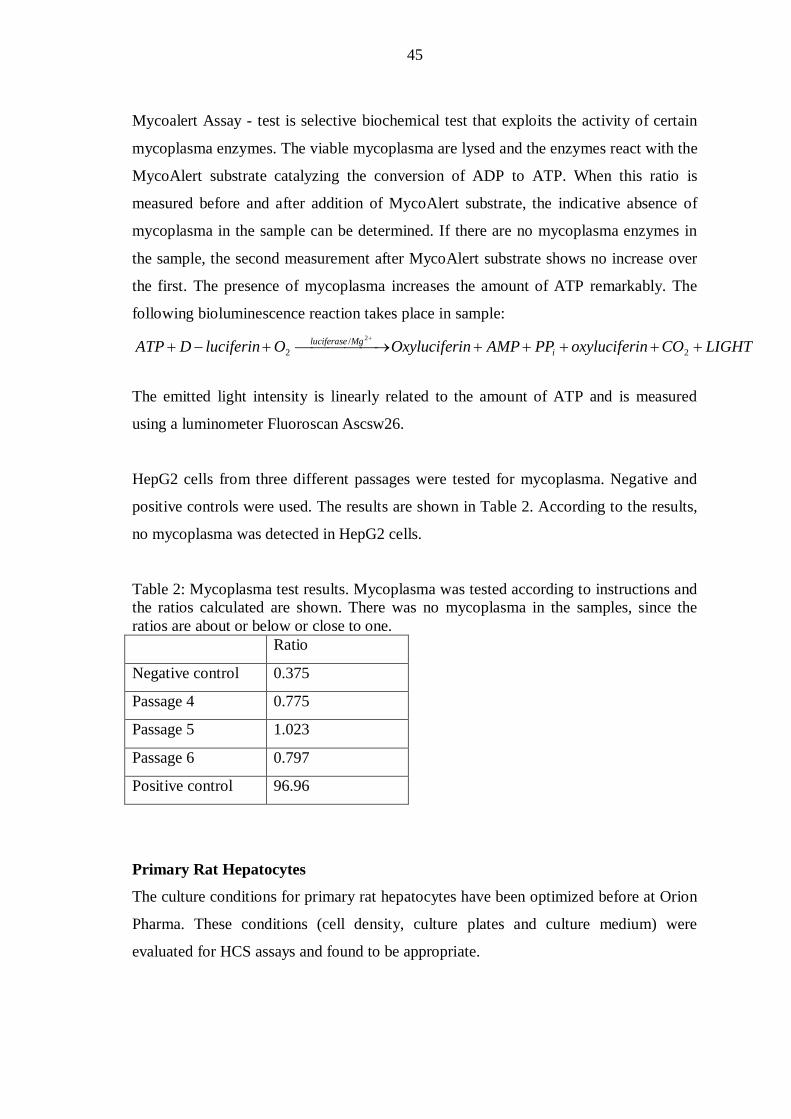
45
Mycoalert Assay - test is selective biochemical test that exploits the activity of certain
mycoplasma enzymes. The viable mycoplasma are lysed and the enzymes react with the
MycoAlert substrate catalyzing the conversion of ADP to ATP. When this ratio is
measured before and after addition of MycoAlert substrate, the indicative absence of
mycoplasma in the sample can be determined. If there are no mycoplasma enzymes in
the sample, the second measurement after MycoAlert substrate shows no increase over
the first. The presence of mycoplasma increases the amount of ATP remarkably. The
following bioluminescence reaction takes place in sample:
LIGHTCOinoxyluciferPPAMPinOxyluciferOluciferinDATP iMgluciferase
2/
22
The emitted light intensity is linearly related to the amount of ATP and is measured
using a luminometer Fluoroscan Ascsw26.
HepG2 cells from three different passages were tested for mycoplasma. Negative and
positive controls were used. The results are shown in Table 2. According to the results,
no mycoplasma was detected in HepG2 cells.
Table 2: Mycoplasma test results. Mycoplasma was tested according to instructions and the ratios calculated are shown. There was no mycoplasma in the samples, since the ratios are about or below or close to one. Ratio
Negative control 0.375
Passage 4 0.775
Passage 5 1.023
Passage 6 0.797
Positive control 96.96
Primary Rat Hepatocytes
The culture conditions for primary rat hepatocytes have been optimized before at Orion
Pharma. These conditions (cell density, culture plates and culture medium) were
evaluated for HCS assays and found to be appropriate.
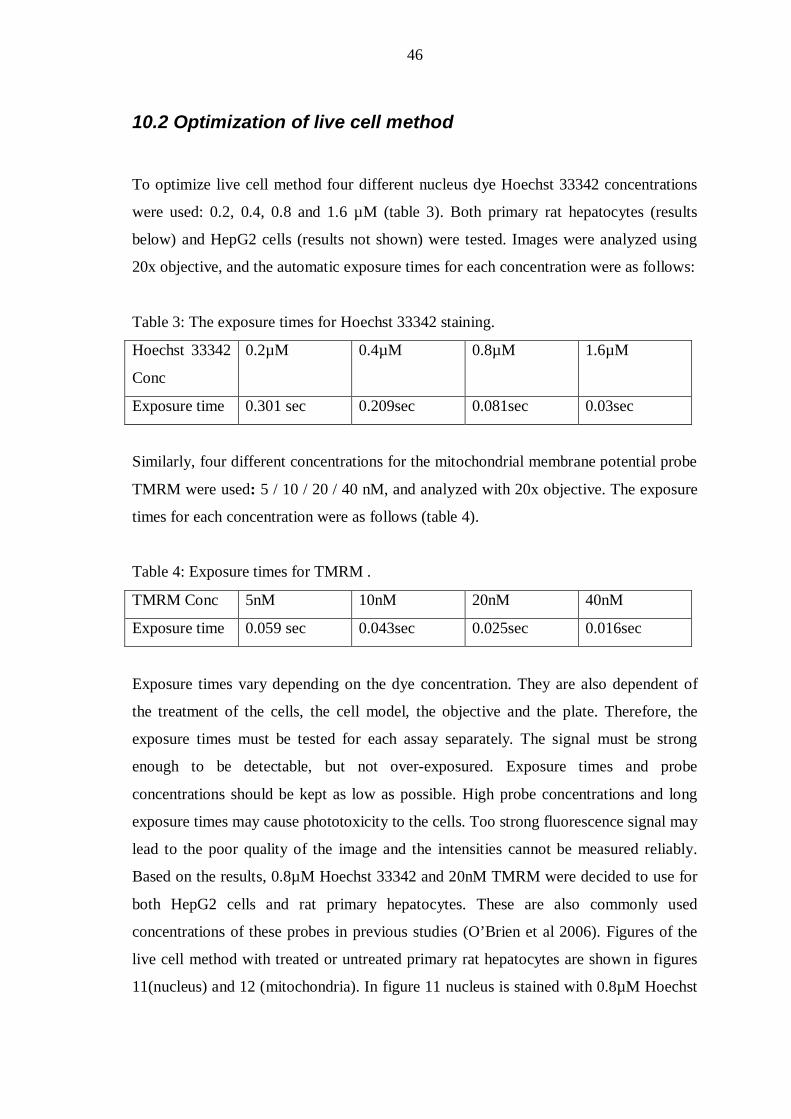
46
10.2 Optimization of live cell method
To optimize live cell method four different nucleus dye Hoechst 33342 concentrations
were used: 0.2, 0.4, 0.8 and 1.6 µM (table 3). Both primary rat hepatocytes (results
below) and HepG2 cells (results not shown) were tested. Images were analyzed using
20x objective, and the automatic exposure times for each concentration were as follows:
Table 3: The exposure times for Hoechst 33342 staining.
Hoechst 33342
Conc
0.2µM 0.4µM 0.8µM 1.6µM
Exposure time 0.301 sec 0.209sec 0.081sec 0.03sec
Similarly, four different concentrations for the mitochondrial membrane potential probe
TMRM were used: 5 / 10 / 20 / 40 nM, and analyzed with 20x objective. The exposure
times for each concentration were as follows (table 4).
Table 4: Exposure times for TMRM .
TMRM Conc 5nM 10nM 20nM 40nM
Exposure time 0.059 sec 0.043sec 0.025sec 0.016sec
Exposure times vary depending on the dye concentration. They are also dependent of
the treatment of the cells, the cell model, the objective and the plate. Therefore, the
exposure times must be tested for each assay separately. The signal must be strong
enough to be detectable, but not over-exposured. Exposure times and probe
concentrations should be kept as low as possible. High probe concentrations and long
exposure times may cause phototoxicity to the cells. Too strong fluorescence signal may
lead to the poor quality of the image and the intensities cannot be measured reliably.
Based on the results, 0.8µM Hoechst 33342 and 20nM TMRM were decided to use for
both HepG2 cells and rat primary hepatocytes. These are also commonly used
concentrations of these probes in previous studies (O’Brien et al 2006). Figures of the
live cell method with treated or untreated primary rat hepatocytes are shown in figures
11(nucleus) and 12 (mitochondria). In figure 11 nucleus is stained with 0.8µM Hoechst

47
33342 and in figure 12 mitochondria is stained with 20nM TMRM. In both figures
untreated cells are on the left, 2.5µM, 24h staurosporine treated cells are on the right.
Figures have been taken with 20x objective two days after plating.
Figure 11: Primary rat hepatocytes’ nucleus using live cell method. Cells have been stained with 0,8µM Hoechst 33342, untreated cells are on the left and 2.5µM staurosporine for 24h treated cells on the right. Figures have been taking using Cellomics ArrayScan and 20x objective two days after plating.
Figure 12: Primary rat hepatocytes using live cell method. Cells have been stained with 20nM TMRM, untreated cells are on the left and 2.5µM staurosporine for 24h treated cells on the right. Figures have been taking using Cellomics ArrayScan and 20x objective two days after plating.
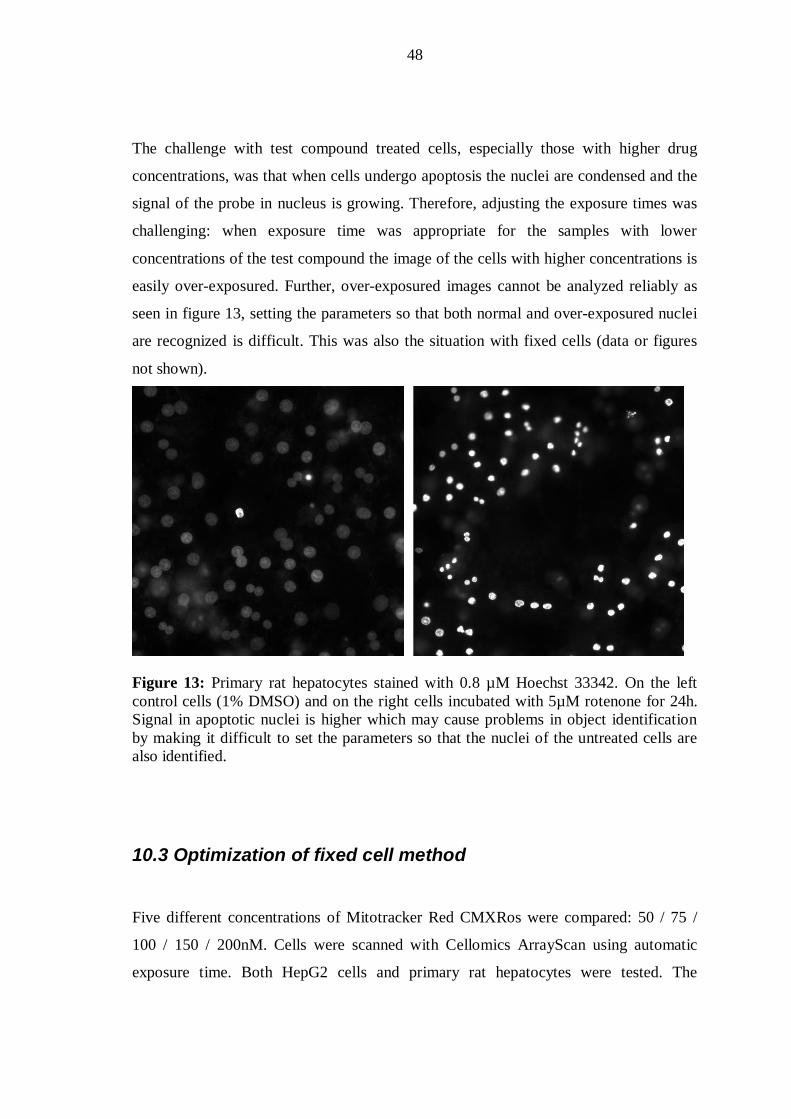
48
The challenge with test compound treated cells, especially those with higher drug
concentrations, was that when cells undergo apoptosis the nuclei are condensed and the
signal of the probe in nucleus is growing. Therefore, adjusting the exposure times was
challenging: when exposure time was appropriate for the samples with lower
concentrations of the test compound the image of the cells with higher concentrations is
easily over-exposured. Further, over-exposured images cannot be analyzed reliably as
seen in figure 13, setting the parameters so that both normal and over-exposured nuclei
are recognized is difficult. This was also the situation with fixed cells (data or figures
not shown).
Figure 13: Primary rat hepatocytes stained with 0.8 µM Hoechst 33342. On the left control cells (1% DMSO) and on the right cells incubated with 5µM rotenone for 24h. Signal in apoptotic nuclei is higher which may cause problems in object identification by making it difficult to set the parameters so that the nuclei of the untreated cells are also identified.
10.3 Optimization of fixed cell method
Five different concentrations of Mitotracker Red CMXRos were compared: 50 / 75 /
100 / 150 / 200nM. Cells were scanned with Cellomics ArrayScan using automatic
exposure time. Both HepG2 cells and primary rat hepatocytes were tested. The

49
concentration with good signal and low enough exposure time was chosen to
experiments. This concentration was 100nM.
Three different concentrations for cytochrome c primary antibody were used: 1:150,
1:300, 1:450. Alexa 488 conjugated secondary antibody was all the time the same
concentration: 1:150. Based on the results, primary antibody was chosen to use in a
concentration of 1:300.
Figures of the fixed cell method with treated or untreated primary rat hepatocytes are
shown in figures 14 (nucleus) and 15 (mitochondria). In figure 14 nucleus is stained
with 0.8µM Hoechst 33342 and in figure 15 with 1:300 primary antibody (cytochrome c
antibody) and with 1:150 alexa 488 conjugated secondary antibody. In both figures
untreated cells are on the left, 2.5 µM, 24h rotenone treated cells are on the right.
Figures have been taken with 20x objective two days after plating.
Figure 14: Primary rat hepatocytes’ nucleus using fixed cell method. Cells have been stained with 0,8 µM Hoechst 33342, untreated cells are on the left and 2.5 µM staurosporine for 24h treated cells on the right. Figures have been taking using Cellomics ArrayScan and 20x objective two days after plating.
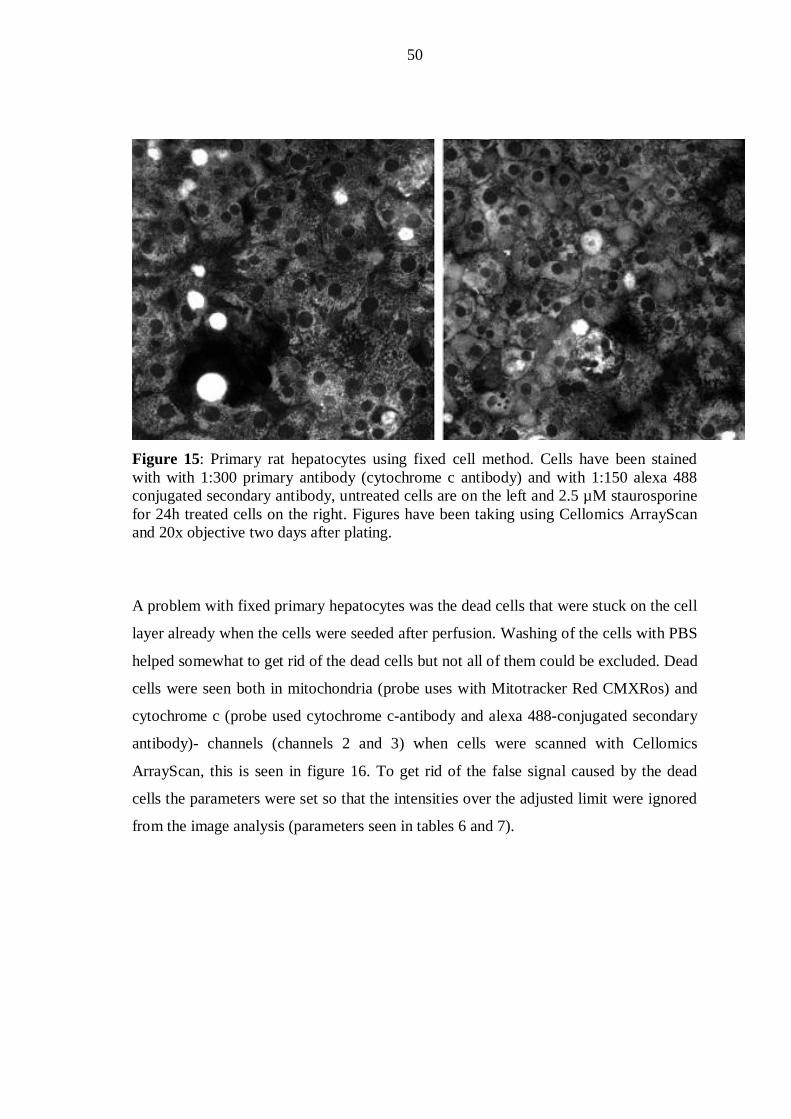
50
Figure 15: Primary rat hepatocytes using fixed cell method. Cells have been stained with with 1:300 primary antibody (cytochrome c antibody) and with 1:150 alexa 488 conjugated secondary antibody, untreated cells are on the left and 2.5 µM staurosporine for 24h treated cells on the right. Figures have been taking using Cellomics ArrayScan and 20x objective two days after plating.
A problem with fixed primary hepatocytes was the dead cells that were stuck on the cell
layer already when the cells were seeded after perfusion. Washing of the cells with PBS
helped somewhat to get rid of the dead cells but not all of them could be excluded. Dead
cells were seen both in mitochondria (probe uses with Mitotracker Red CMXRos) and
cytochrome c (probe used cytochrome c-antibody and alexa 488-conjugated secondary
antibody)- channels (channels 2 and 3) when cells were scanned with Cellomics
ArrayScan, this is seen in figure 16. To get rid of the false signal caused by the dead
cells the parameters were set so that the intensities over the adjusted limit were ignored
from the image analysis (parameters seen in tables 6 and 7).
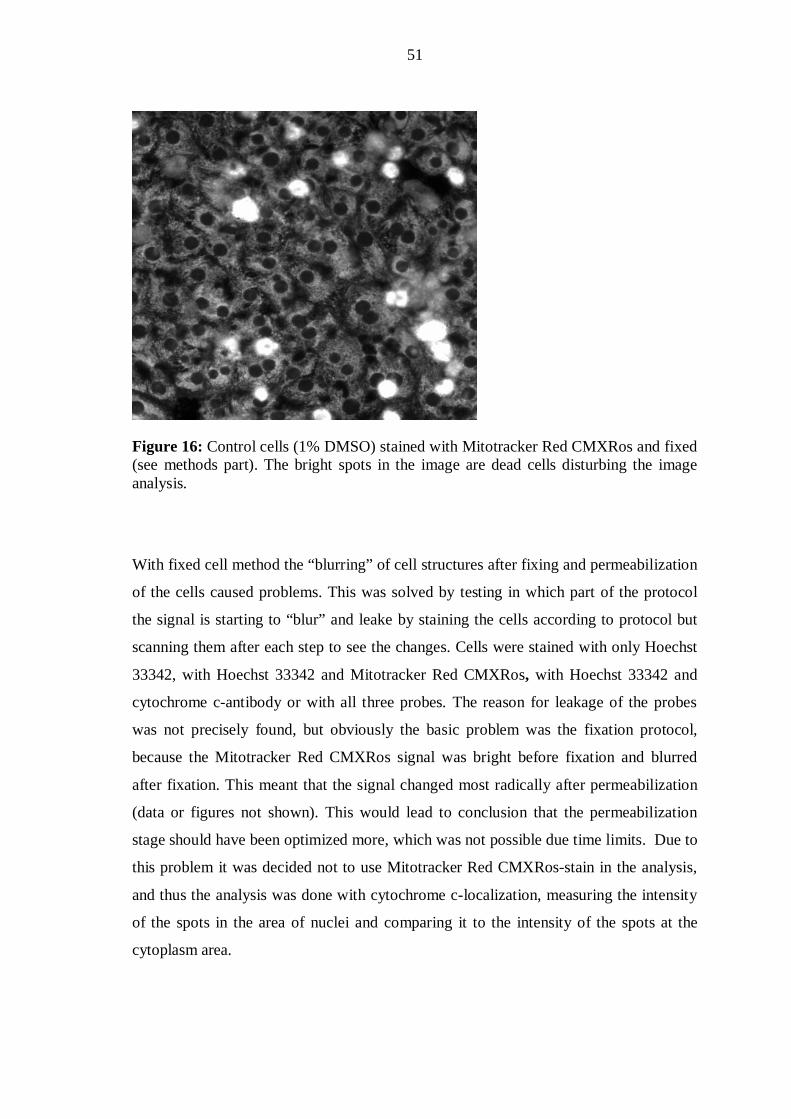
51
Figure 16: Control cells (1% DMSO) stained with Mitotracker Red CMXRos and fixed (see methods part). The bright spots in the image are dead cells disturbing the image analysis.
With fixed cell method the “blurring” of cell structures after fixing and permeabilization
of the cells caused problems. This was solved by testing in which part of the protocol
the signal is starting to “blur” and leake by staining the cells according to protocol but
scanning them after each step to see the changes. Cells were stained with only Hoechst
33342, with Hoechst 33342 and Mitotracker Red CMXRos, with Hoechst 33342 and
cytochrome c-antibody or with all three probes. The reason for leakage of the probes
was not precisely found, but obviously the basic problem was the fixation protocol,
because the Mitotracker Red CMXRos signal was bright before fixation and blurred
after fixation. This meant that the signal changed most radically after permeabilization
(data or figures not shown). This would lead to conclusion that the permeabilization
stage should have been optimized more, which was not possible due time limits. Due to
this problem it was decided not to use Mitotracker Red CMXRos-stain in the analysis,
and thus the analysis was done with cytochrome c-localization, measuring the intensity
of the spots in the area of nuclei and comparing it to the intensity of the spots at the
cytoplasm area.

52
10.4 Image acquisition and analysis with the Cellomics
ArrayScan VTI Reader
In practical, scanning with Cellomics ArrayScan follows the certain routines. First the
plate is placed into the instrument, and the assay protocol is selected. As explained later,
channel 1 is used to focus the image. Images are acquired from all the channels used,
and the quality of the images and proper focus is checked. Exposure time and objective
used (10x, 20x or 40x) are defined so that the parameters to be measured can be
identified in all the cells on the plate with different treatments. Correct filter channels,
objective, focus plain and exposure times are critical for good image analysis and they
cannot be changed afterwards. Other input parameters can be changed and optimized
later using the existing image.
10.4.1 Input parameters
In this study Hoechst 33342- stained nuclei of the cells were identified in the channel 1
as primary objects. Channel 1 objects are also used to focus the microscope during the
experiment. Parameters for this channel can be measured as either total or average
intensity or certain morphological changes of the nuclei. Three nuclear parameters were
measured in this study. First, the stained nuclei were used to count the number of the
nuclei in each microscopy field. In hepatocytes, there are often two nuclei in one cell,
and therefore the exact number of cells could not be measured. The second parameter
measured was the average intensity of fluorescence of the nuclei. Intensity of
fluorescence is higher in apoptotic nuclei comparing to healthy cells. The third
parameter measured was the area of the nuclei, which is smaller in apoptotic nuclei than
in healthy ones.
Parameters for channel 2 measure the intensity of the mitochondria or intensity ratio
between mitochondria and nucleus. Total or average intensity are possible to measure.

53
The total intensity is the sum of the intensities of all the individual pixels in the region.
The average intensity is equal to the total intensity divided by the number of pixels in
the region. The effect of parameters for each analysis is described separately for primary
rat hepatocytes and for HepG2 cells because each cell type displayed a distinct
morphology and staining properties. All the parameters used in scans are listed in the
Tables 5, 6 and 7.
Object identification methods
Object identification methods are used to identify objects. In this study, the image
analysis software recognises all the nuclei, but ignores the background signal. The
accurate set of object identification parameter is a requirement for proper quantitative
analysis of the assay. Different identification methods for each channel are explained in
detail below. The aim of the object identification is to set parameters so that only the
pixels that are above the threshold will be taken into analysis and the pixels below are
left away.
Fixed threshold determines the actual intensity of the image and it is set independently
of the image data. When the certain value is set, all the intensity below the value given
is excluded. Isodata and triangle thresholds are known as histogram-derived thresholds
that are dependent on the pixel intensities in the image. The equation used to determine
the actual threshold (Tf) is as following: Tf=(1+o)T, where o is the user-entered offset
value. In Cell Health Profiling bioapplication Isodata Threshold method is not possible
to use. The examples of the object identification are shown in figure 17. In figure there
is shown how objects are identified at Cellomics ArrayScan. Cells are untreated primary
rat hepatocytes, nucleus on the left are stained with 0.8µM Hoechst 33342 and
mitochondria on the right with 20nM TMRM. Figures have been taken two days after
plating with Cellomics ArrayScan and 20x objective. The examples of the defined
parameters are on the left, the yellow ring around one nucleus represents the nucleus
that is too big to be included into the analysis. This excludion is done with object area-
parameter on channel 1.

54
For primary rat hepatocytes triangle threshold was decided to use as object
identification method for channel 1 in Compartmental Analysis -bioapplication. When
comparing the three object identification methods, fixed threshold did not identify
nuclei properly in the image analysis. For HepG2-cells fixed threshold was the method
used in channel 1 in Compartmental Analysis –bioapplication since it identified nuclei
better than other triangle threshold method in these cells. In Cell Health Profiling -
bioapplication Fixed Treshold was used for both primary rat hepatocytes and HepG2-
cells in channel 1 (Hoechst 33342).
For channel 2 fixed threshold was the method used for both bioapplications and cell
types. In Compartmental Analysis object identification method for channel 2 is not a
crucial parameter, because the information is gained by comparing the ring and circ
values. In Cell Health Profiling-bioapplication when fixed threshold was compared to
Isodata threshold and no object identification method at all, fixed threshold identified
mitochondria the best.
Basic assay parameters
These assay parameters must be set carefully, because they control image acquisition
and object identification in the microwell plate. If image analysis parameters are not set
properly, it can cause systematic errors for the image analysis and results interpretation.
These parameters are common for both bioapplications used.
Background correction: This parameter is one of the most important parameter affecting
the object identification. It can be negative or positive. Method for background
correction with positive values means that the local minimum in the certain region of
the well is specified by the value entered and it is subtracted from that region of the
image. With negative background correction values the local minima is detected and it
is used to fit a surface representing the background, which is then subtracted.
Automated surface fitting is also possible; in this case the value of the background
correction is -1. In these assays positive background correction values were better than
negative for object identification in channel 1. For channel 2 background correction
parameters vary depending on the bioapplication used. For Cell Health Profiling
55
(channel 2) negative values identified mitochondria better than positive values, and
negative values were used. In Compartmental Analysis negative values were used with
HepG2 cells, whereas positive values were used with primary rat hepatocytes.
Object smoothing: Object smoothing factor -parameter enables the control of the degree
of the image smoothing before the identification of objects. Smoothing is useful if
fragments of objects are wanted to be connected, and it can be valuable when measuring
morphological changes. The parameter can have values ranging from 1 to 127, and the
bigger the value, the more smoothing is done. Insufficient smoothing can result in
unwanted object fragmentation, whereas excessive smoothing may cause poor
definition of the primary object. Too high values can cause for example two nuclei close
to each other to be identified as one. If sharp definition of the edges is desirable as in
Cell Health Profiling and Compartmental Analysis – bioapplications, it is best to keep
the value as small as possible if not 0. Here, the parameter value 1 was used in every
analysis.
Object segmentation: Object segmentation parameter helps in resolving individual
objects if needed. Object segmentation is a very useful parameter in a situation when
cells are in clumps or densely packed so that they touch each other. Object segmentation
parameter can have values from -255 to 255, and depending on the value the objects are
identified based on either geometry or peak intensity of the object, positive value being
geometric identification and negative peak intensity identification. Geometric
identification is based on shape and is useful if objects have boundary indentations.
Peak intensity separates objects according to their intensity and is good in situations
where objects do not have boundary indentations. The cell confluence in these studies
was optimized so that the minimal object segmentation would be needed here. Only
positive values were used because these values gave better mask than negative. Too
small values for the parameter (1-5) caused too much separation, whereas 5-10 was
appropriate. With HepG2-cells, which were more confluent than primary hepatocytes,
smaller values gave better results. The values used in this study are seen in tables 5, 6
and 7.
56
Object type: Object type parameter specifies whether the objects of interest are brighter
or darker than the background of the image. In both bioapplications the objects are
brighter than the background. The value of the parameter is 1 or 0, 1 meaning the object
being brighter than the image and 0 is the opposite situation. Object type parameter
value 1 was used here in all situations.
Reject Border Objects: This parameter can be either 1 or 0, when this is 1 the objects
that are in the edges of the image are not taken into account when analyzing results. The
situation is the opposite when the parameter is 0.
Object Area: Object area-parameter defines the area of the object. Object area was used
to measure the size of nucleus on channel 1 as a marker of cytotoxicity. The minimum
and maximum areas were given to exclude objects that were not real objects, e.g. local
intensity maxims that were not nucleus but just some impurity.
Channel-specific assay parameters
Channel-specific assay parameters are parameters that are set to each channel
separately. Unlike Object Identification- and Basic Assay parameters, each
bioapplication has its own channel-spesific assay parameters.
In Cell Health Profiling – bioapplication Channel-spesific assay parameters are used to
define the extents of measurement regions. Measurement region in channels 2-4 can be
set to be either circ or ring, in channels 5-6 only circ is possible. The size of the circ or
ring is related to the primary object in channel 1.
Target ring width –parameter is used to choose between the circ and ring region. If the
value is 0, circ is chosen and it can be modified with Target circ modifier-parameter. In
these experiments parameter 1, meaning ring region, was used. The width of the ring
was set as large as possible to get all the area of the mitochondria into the analysis.
Target ring distance – parameter defines the number of pixels which is left between
outer boundary of the circ and inner boundary of the ring. This is explained below.

57
Target circ modifier –parameter is used in modifying the circ region in case that circ
region is used. It determines the region correlated to object.
Mask modifier – parameter is used in controlling the modification of the object mask
used for gating.
Average intensity and Total intensity – parameters define the intensity maximum and
minimum of the ring / circ region.
For Compartmental Analysis – Bioapplication channel spesific assay parameters help in
adjusting cellular regions, circ and ring, in channels 2-6. The size of these regions can
be adjusted independently for each channel when needed. In this experiment the area of
the circ and ring played a crucial role since the difference of the spots in the nucleus vs.
in the cytoplasm was the parameter measured.
Circ modifier – parameter is used to set the circ region. The value is the number of
pixels that are dilated (positive value) or eroded (negative value) from the perimeter of
the primary object to define the area covered by the circ region.
Ring distance – parameter determines the distance of the ring from circ. When this is 0,
the ring region starts where circ area ends. With positive ring distance -values the
number of pixels is added to the perimeter of the primary object and with negative
values subtracted, to define the inner boundary of the ring region. In this analysis the
value of ring distance was set small, because if the value is too high, the spot which in
real is in cytoplasm is counted to be in nucleus.
Ring width – parameter determines the ring width in pixels where spots are counted.
Spot kernel radius – parameter separates the background signal from spots measured
from circ/ring-region.

58
Ring average intensity and Circ average intensity – parameters determines the average
intensity of the ring or circ, its maximum and minimum. Circ average intensity was
used to measure the intensity in the circ area, as a marker of leaked cytochrome c from
cytosol to circ area.
Circ/ring average intensity difference and Circ/ring average intensity ratio - parameters
are used to define the minimum and maximum intensity differences (circ intensity –
ring intensity) and ratios (circ intensity / ring intensity). Maximum values were used to
get rid of the dead cells with primary rat hepatocytes in channel 2 that might have
bothered the analysis when having too high intensities.
Ring spot total area and Ring spot average intensity - parameters are used to define the
maximum area and intensity of the ring.
Circ spot total area and Circ spot average area - parameters are used to define the total
and average area of circ spots.
Average intensity and Total intensity- parameters are used in defining maximum and
minimum intensities of the circ / ring –region.
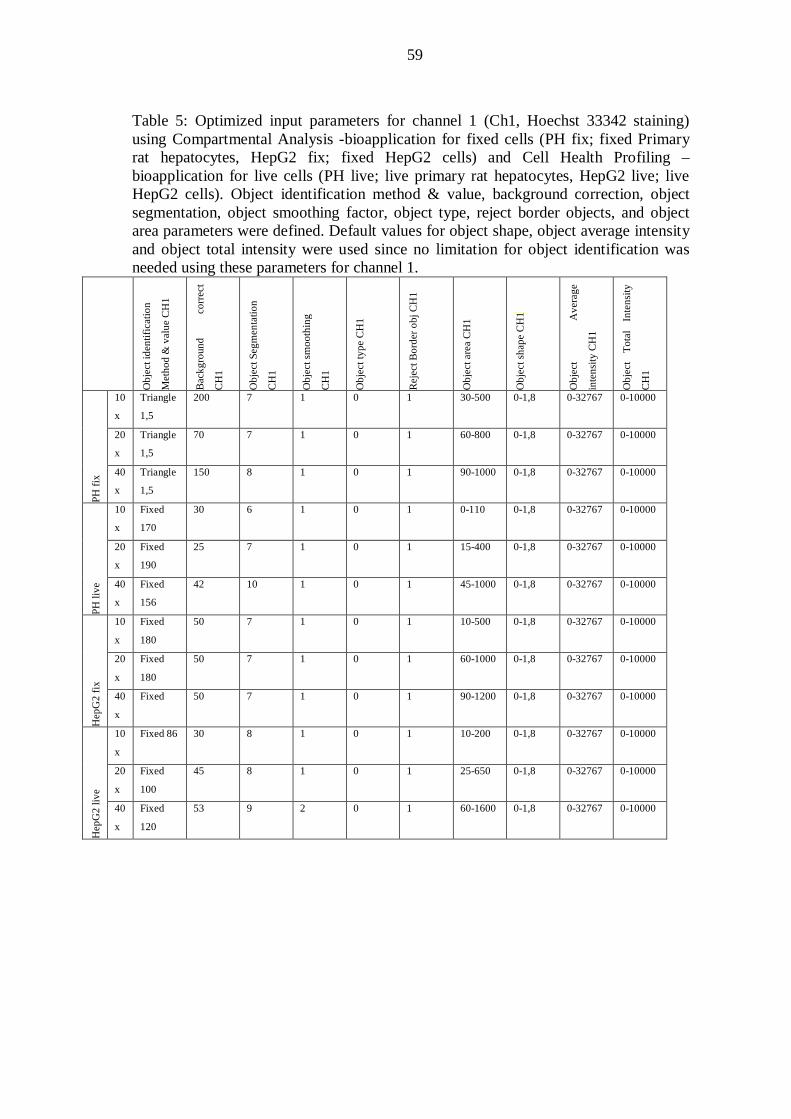
59
Table 5: Optimized input parameters for channel 1 (Ch1, Hoechst 33342 staining) using Compartmental Analysis -bioapplication for fixed cells (PH fix; fixed Primary rat hepatocytes, HepG2 fix; fixed HepG2 cells) and Cell Health Profiling –bioapplication for live cells (PH live; live primary rat hepatocytes, HepG2 live; live HepG2 cells). Object identification method & value, background correction, object segmentation, object smoothing factor, object type, reject border objects, and object area parameters were defined. Default values for object shape, object average intensity and object total intensity were used since no limitation for object identification was needed using these parameters for channel 1.
Obj
ect i
dent
ifica
tion
Met
hod
& v
alue
CH
1
Bac
kgro
und
corr
ect
CH
1
Obj
ect S
egm
enta
tion
CH
1
Obj
ect s
moo
thin
g
CH
1
Obj
ect t
ype
CH
1
Rej
ect B
orde
r obj
CH
1
Obj
ect a
rea
CH
1
Obj
ect s
hape
CH
1
Obj
ect
Ave
rage
inte
nsity
CH
1
Obj
ect
Tota
l In
tens
ity
CH
1
PH fi
x
10
x
Triangle
1,5
200 7 1 0 1 30-500 0-1,8 0-32767 0-10000
20
x
Triangle
1,5
70 7 1 0 1 60-800 0-1,8 0-32767 0-10000
40
x
Triangle
1,5
150 8 1 0 1 90-1000 0-1,8 0-32767 0-10000
PH li
ve
10
x
Fixed
170
30 6 1 0 1 0-110 0-1,8 0-32767 0-10000
20
x
Fixed
190
25 7 1 0 1 15-400 0-1,8 0-32767 0-10000
40
x
Fixed
156
42 10 1 0 1 45-1000 0-1,8 0-32767 0-10000
Hep
G2
fix
10
x
Fixed
180
50 7 1 0 1 10-500 0-1,8 0-32767 0-10000
20
x
Fixed
180
50 7 1 0 1 60-1000 0-1,8 0-32767 0-10000
40
x
Fixed 50 7 1 0 1 90-1200 0-1,8 0-32767 0-10000
Hep
G2
live
10
x
Fixed 86 30 8 1 0 1 10-200 0-1,8 0-32767 0-10000
20
x
Fixed
100
45 8 1 0 1 25-650 0-1,8 0-32767 0-10000
40
x
Fixed
120
53 9 2 0 1 60-1600 0-1,8 0-32767 0-10000
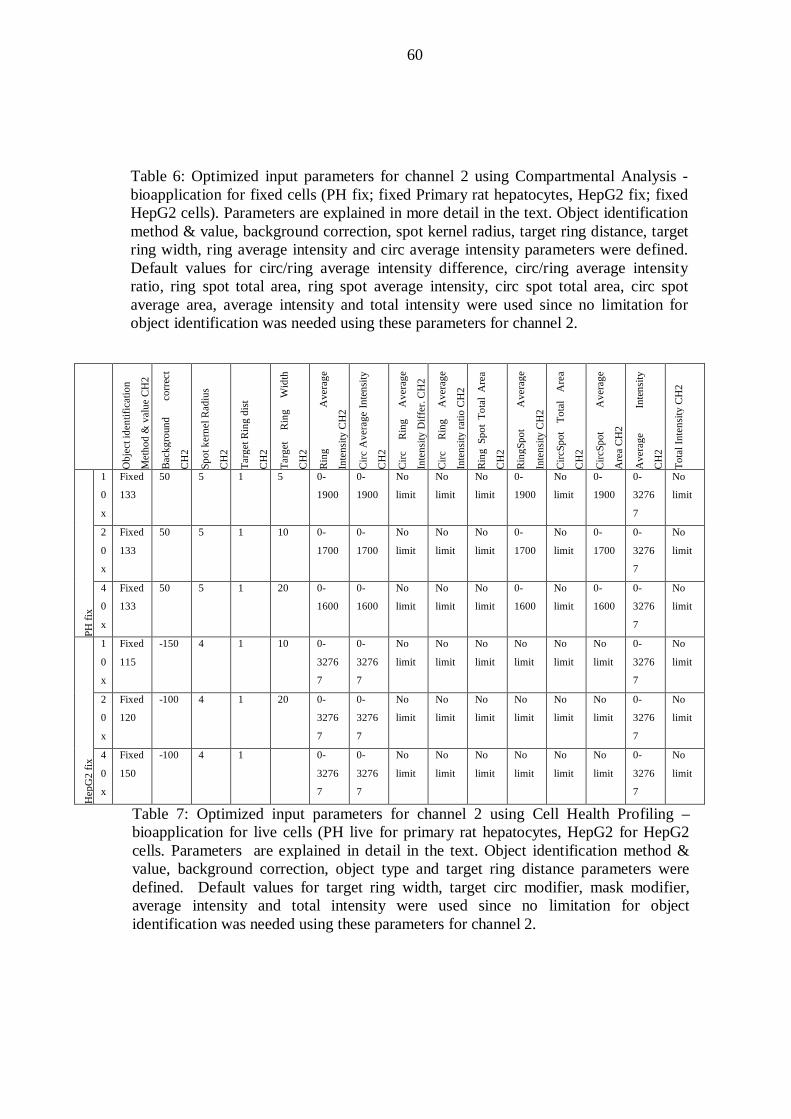
60
Table 7: Optimized input parameters for channel 2 using Cell Health Profiling –bioapplication for live cells (PH live for primary rat hepatocytes, HepG2 for HepG2 cells. Parameters are explained in detail in the text. Object identification method & value, background correction, object type and target ring distance parameters were defined. Default values for target ring width, target circ modifier, mask modifier, average intensity and total intensity were used since no limitation for object identification was needed using these parameters for channel 2.
Table 6: Optimized input parameters for channel 2 using Compartmental Analysis -bioapplication for fixed cells (PH fix; fixed Primary rat hepatocytes, HepG2 fix; fixed HepG2 cells). Parameters are explained in more detail in the text. Object identification method & value, background correction, spot kernel radius, target ring distance, target ring width, ring average intensity and circ average intensity parameters were defined. Default values for circ/ring average intensity difference, circ/ring average intensity ratio, ring spot total area, ring spot average intensity, circ spot total area, circ spot average area, average intensity and total intensity were used since no limitation for object identification was needed using these parameters for channel 2.
Obj
ect i
dent
ifica
tion
Met
hod
& v
alue
CH
2
Bac
kgro
und
corr
ect
CH
2
Spot
ker
nel R
adiu
s
CH
2
Targ
et R
ing
dist
CH
2
Targ
et
Rin
g W
idth
CH
2
Rin
g A
vera
ge
Inte
nsity
CH
2
Circ
Ave
rage
Inte
nsity
CH
2
Circ
R
ing
Ave
rage
Inte
nsity
Diff
er. C
H2
Circ
R
ing
Ave
rage
Inte
nsity
ratio
CH
2
Rin
g Sp
ot T
otal
Are
a
CH
2
Rin
gSpo
t A
vera
ge
Inte
nsity
CH
2
Circ
Spot
To
tal
Are
a
CH
2
Circ
Spot
A
vera
ge
Are
a C
H2
Ave
rage
In
tens
ity
CH
2
Tota
l Int
ensi
ty C
H2
PH fi
x
1
0
x
Fixed
133
50 5 1 5 0-
1900
0-
1900
No
limit
No
limit
No
limit
0-
1900
No
limit
0-
1900
0-
3276
7
No
limit
2
0
x
Fixed
133
50 5 1 10 0-
1700
0-
1700
No
limit
No
limit
No
limit
0-
1700
No
limit
0-
1700
0-
3276
7
No
limit
4
0
x
Fixed
133
50 5 1 20 0-
1600
0-
1600
No
limit
No
limit
No
limit
0-
1600
No
limit
0-
1600
0-
3276
7
No
limit
Hep
G2
fix
1
0
x
Fixed
115
-150 4 1 10 0-
3276
7
0-
3276
7
No
limit
No
limit
No
limit
No
limit
No
limit
No
limit
0-
3276
7
No
limit
2
0
x
Fixed
120
-100 4 1 20 0-
3276
7
0-
3276
7
No
limit
No
limit
No
limit
No
limit
No
limit
No
limit
0-
3276
7
No
limit
4
0
x
Fixed
150
-100 4 1 0-
3276
7
0-
3276
7
No
limit
No
limit
No
limit
No
limit
No
limit
No
limit
0-
3276
7
No
limit

61
Obj
ect i
dent
ifica
tion
Met
hod
& v
alue
CH
2
Bac
kgro
und
corr
ect C
H2
Obj
ect t
ype
CH
2
Targ
et R
ing
dist
CH
2
Targ
et R
ing
wid
th C
H2
Targ
et
Circ
m
odifi
er
CH
2
Mas
k M
odifi
er C
H2
Ave
rage
Inte
nsity
CH
2
Tota
l Int
ensi
ty C
H2
PH li
ve
10x Fixed 115 -150 1 0 0-127 0 0 0-32767 0-10^8
20x Fixed 120 -100 1 0 0-127 0 0 0-32767 0-10^8
40x Fixed 150 -100 1 0 0-127 0 0 0-32767 0-10^8
Hep
G2
live
10x Fixed 120 -100 1 0 0-127 0 0 0-32767 0-10^8
20x Fixed 127 -100 1 0 0-127 0 0 0-32767 0-10^8
40x Fixed 130 -100 1 0 0-127 0 0 0-32767 0-10^8
Figure 17: Figures from Cellomics ArrayScan and how objects are identified at Cellomics ArrayScan. Cells are untreated primary rat hepatocytes, nucleus on the left are stained with 0.8 µM Hoechst 33342 and mitochondria on the right stained with 20nM TMRM. Figures have been taken two days after plating with Cellomics ArrayScan and 20x objective with values defined in tables 5 and 7. The example of the effect of the defined parameter is on the left, the yellow ring around one nucleus represents the nucleus that is too big to be included into the analysis. This excludion is done with object area-parameter on channel 1.

62
10.4.2 Cellomics ArrayScan scanning results and output parameters
After input parameters were selected, the required objective and the optimal output
parameters for each assay were chosen. The amount of the fields used in the scans was
decided to be 5 fields in each well since more fields would have caused too long
scanning times. In HCS time is one of the most important things that matter. HCS is
made to quicken toxicity screening and also because of the probes used in the
experiments are good to carry out as quickly as possible. In this experiment different
Cellomics ArrayScan objectives were tested to find out the most rapid way to perform
experiment without losing the sensitivity of the protocol. Scanning live cells with
Cellomics Arrayscan VTI took less time than scanning fixed cells. Since the more
channels used the more time it takes to scan. Of the three objectives available the 10x
objective was selected since it measured more cells per field and therefore the standard
deviations were smaller than with the 20x or 40x objective (examples of the
comparisons between different objectives are shown in figures 18 and 19: examples
with 2h rotenone treated live cells and 24h staurosporine treated fixed cells).

63
Figure 18: Comparison of Cellomics ArrayScan Scan results with 10x, 20x and 40x objectives using live cell method and 2h rotenone treated rat primary hepatocytes (experiment 20091111). The parameter measured is the average intensity of the channel 2, which measures the intensity of the mitochondrial membrane potential probe (TMRM) and correlates to the condition of mitochondria. Results are shown as % of control ±SD, control being 100%.
Figure 19: Comparison of Cellomics ArrayScan Scan results with 10x, 20x and 40x objectives using fixed cell method and 24h staurosporine treated primary rat hepatocytes (experiment 20091204). This parameter (circ/ring average intensity difference) detects the leaking of cytochrome c from damaged mitochondria by measuring its translocation from cell cytoplasm (ring) to nucleus (circ) area. Results are shown as % of control ±SD, control being 100%.
The sensitivity of the 10x objective was very close to the objectives with higher
resolution. In addition, scanning with 10x objective took less time than scanning with
20x objective, which in turn took less time than scanning the cells with 40x objective.
This is because the focusing time is longer with bigger objectives when there are more
details and higher possibility to try to focus on an empty spot. The approximate
scanning times for live cells were 10 – 20 minutes / a full 96 well plate using 10x

64
objective. The scanning times for fixed cells were at least the double the time than with
live cells because more channels were used with fixed cells.
After choosing the objective, the output parameters for each assay were chosen. With
live cells object average intensity and target area parameters were compared (example
of the comparisons is shown in figure 20: example using 2h rotenone treated cells). Also
the nucleus parameters (nucleus average intensity and nucleus count) were compared to
these mitochondrial parameters to see the correlation between nucleus and mitochondria
(data not shown). The main focus was still to find the proper mitochondria parameter.
For live cells, object average intensity was chosen to use. With fixed cells circ average
or total intensity and circ/ring average intensity difference and ratio were compared
(examples of the comparisons are shown in figures 21 and 22: examples using 2h
rotenone treated cells).
Figure 20: Comparison of the output parameters for the live cell method in 2h rotenone treated primary rat hepatocytes using 10x objective (experiment 20091111). Parameters that were compared were target area and target average intensity of channel 2 which measures the intensity of the mitochondrial membrane potential probe (TMRM) and
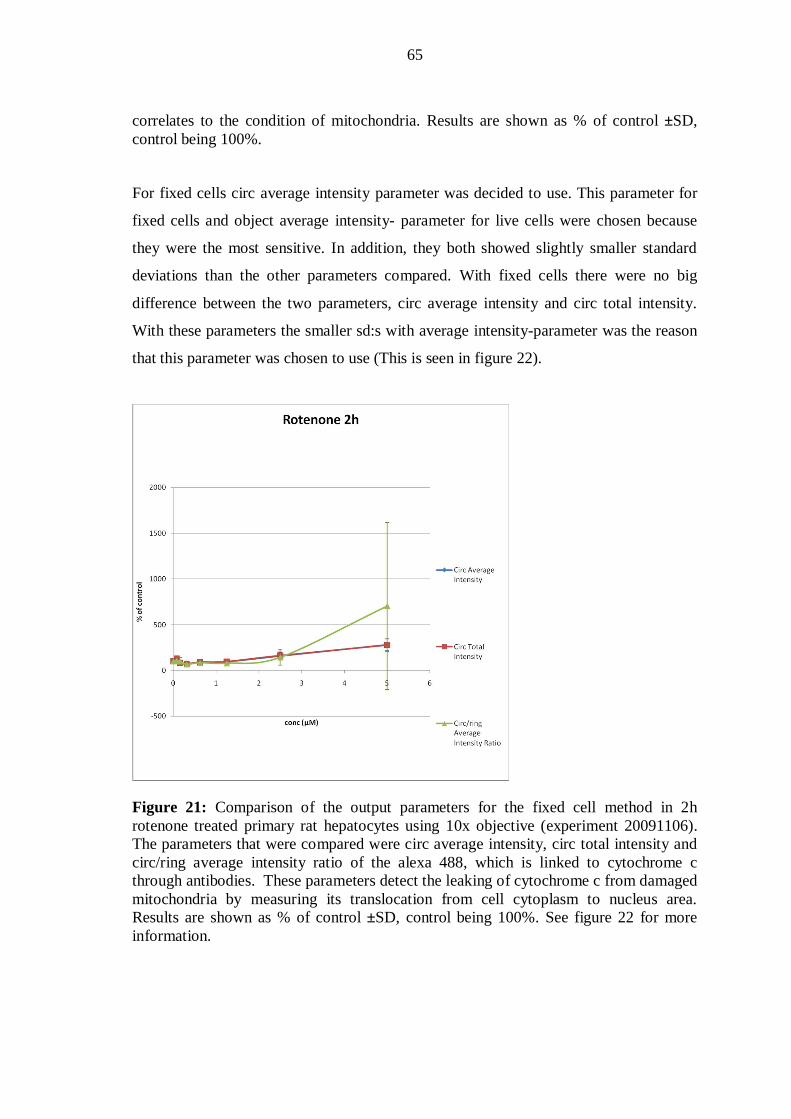
65
correlates to the condition of mitochondria. Results are shown as % of control ±SD, control being 100%.
For fixed cells circ average intensity parameter was decided to use. This parameter for
fixed cells and object average intensity- parameter for live cells were chosen because
they were the most sensitive. In addition, they both showed slightly smaller standard
deviations than the other parameters compared. With fixed cells there were no big
difference between the two parameters, circ average intensity and circ total intensity.
With these parameters the smaller sd:s with average intensity-parameter was the reason
that this parameter was chosen to use (This is seen in figure 22).
Figure 21: Comparison of the output parameters for the fixed cell method in 2h rotenone treated primary rat hepatocytes using 10x objective (experiment 20091106). The parameters that were compared were circ average intensity, circ total intensity and circ/ring average intensity ratio of the alexa 488, which is linked to cytochrome c through antibodies. These parameters detect the leaking of cytochrome c from damaged mitochondria by measuring its translocation from cell cytoplasm to nucleus area. Results are shown as % of control ±SD, control being 100%. See figure 22 for more information.

66
Figure 22: Comparison of the output parameters for the fixed cell method in 2h rotenone treated primary rat hepatocytes using 10x objective (experiment 20091106). This is the same figure as figure 21 but without Circ/Ring ratio – parameter. The parameters that were compared were circ average intensity and circ total intensity of the alexa 488, which is linked to cytochrome c through antibodies. These parameters detect the leaking of cytochrome c from damaged mitochondria by measuring its translocation from cell cytoplasm to nucleus area. Results are shown as % of control ±SD, control being 100%.
From the two cell models compared primary rat hepatocytes were chosen to use in the
final comparisons. This was because they were more sensitive to the test substances
used than did HepG2-cells (example of the comparisons in figure 23: example using 2h
rotenone treated cells). In addition, HepG2 cells lack most xenobiotic metabolism
activity compared to the primary cells as discussed in more detail in section 8.1.1: Cell
Models (Westerink and Schoonen 2007a and 2007b). Further, the confluences between
analyses vary with HepG2-cells and the amount of cytosol is smaller compared to the
primary hepatocytes. Thus the setting of the input parameters was more difficult using
HepG2 cells.
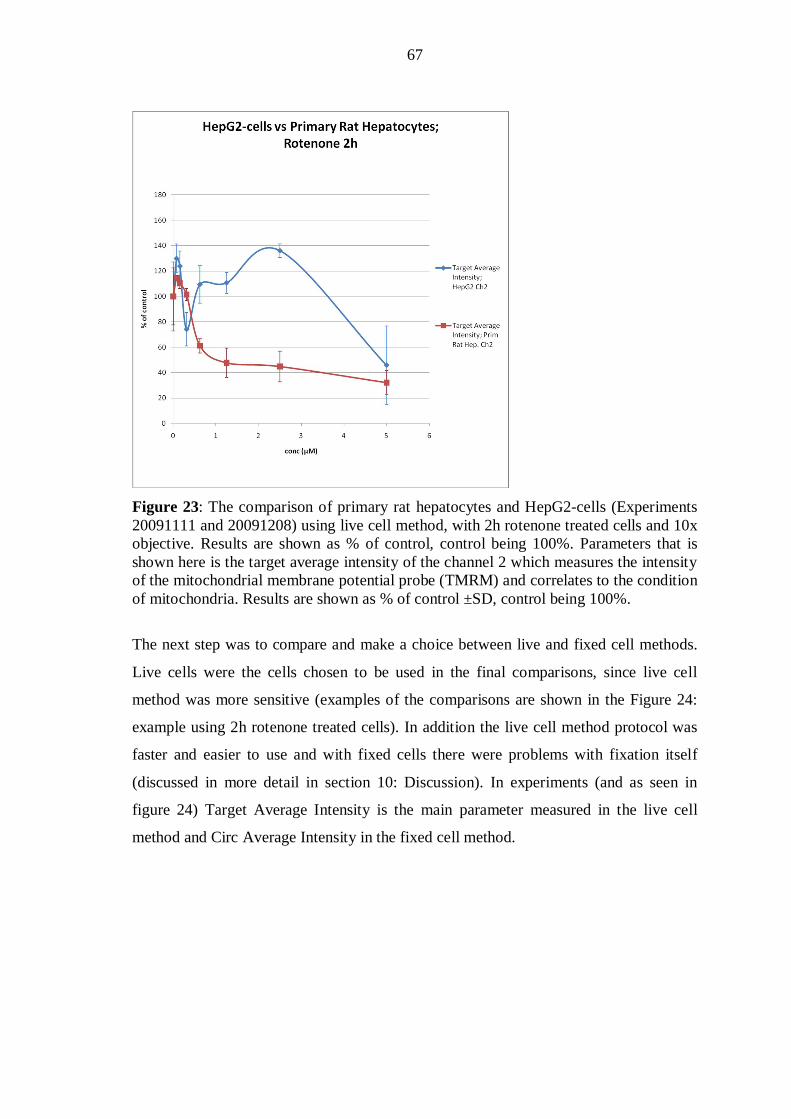
67
Figure 23: The comparison of primary rat hepatocytes and HepG2-cells (Experiments 20091111 and 20091208) using live cell method, with 2h rotenone treated cells and 10x objective. Results are shown as % of control, control being 100%. Parameters that is shown here is the target average intensity of the channel 2 which measures the intensity of the mitochondrial membrane potential probe (TMRM) and correlates to the condition of mitochondria. Results are shown as % of control ±SD, control being 100%.
The next step was to compare and make a choice between live and fixed cell methods.
Live cells were the cells chosen to be used in the final comparisons, since live cell
method was more sensitive (examples of the comparisons are shown in the Figure 24:
example using 2h rotenone treated cells). In addition the live cell method protocol was
faster and easier to use and with fixed cells there were problems with fixation itself
(discussed in more detail in section 10: Discussion). In experiments (and as seen in
figure 24) Target Average Intensity is the main parameter measured in the live cell
method and Circ Average Intensity in the fixed cell method.
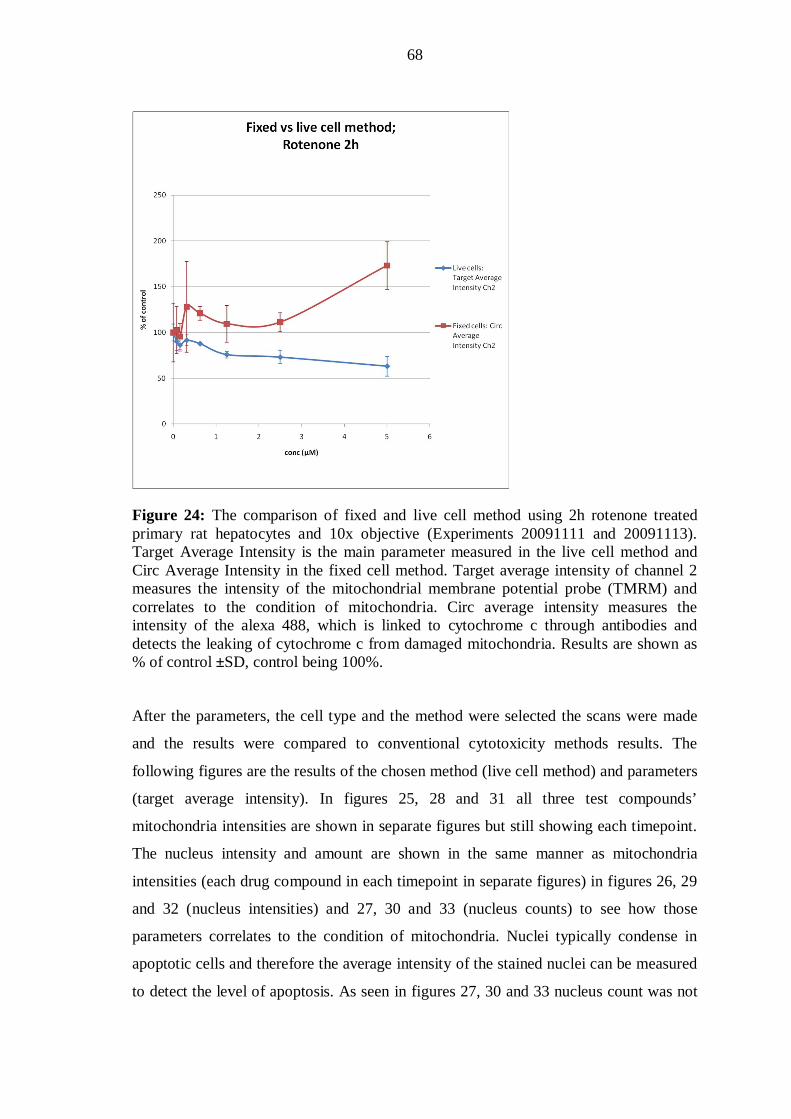
68
Figure 24: The comparison of fixed and live cell method using 2h rotenone treated primary rat hepatocytes and 10x objective (Experiments 20091111 and 20091113). Target Average Intensity is the main parameter measured in the live cell method and Circ Average Intensity in the fixed cell method. Target average intensity of channel 2 measures the intensity of the mitochondrial membrane potential probe (TMRM) and correlates to the condition of mitochondria. Circ average intensity measures the intensity of the alexa 488, which is linked to cytochrome c through antibodies and detects the leaking of cytochrome c from damaged mitochondria. Results are shown as % of control ±SD, control being 100%.
After the parameters, the cell type and the method were selected the scans were made
and the results were compared to conventional cytotoxicity methods results. The
following figures are the results of the chosen method (live cell method) and parameters
(target average intensity). In figures 25, 28 and 31 all three test compounds’
mitochondria intensities are shown in separate figures but still showing each timepoint.
The nucleus intensity and amount are shown in the same manner as mitochondria
intensities (each drug compound in each timepoint in separate figures) in figures 26, 29
and 32 (nucleus intensities) and 27, 30 and 33 (nucleus counts) to see how those
parameters correlates to the condition of mitochondria. Nuclei typically condense in
apoptotic cells and therefore the average intensity of the stained nuclei can be measured
to detect the level of apoptosis. As seen in figures 27, 30 and 33 nucleus count was not

69
the best possible parameter to measure cytotoxicity. The increase in the amount of
nucleus correlates maybe with the improper object identification. In each timepoint
there were three concurrent samples and three concurrent experiments.
With three test compounds the toxic effects were seen already after 2h incubation: this
was the situation especially with staurosporine and rotenone. The effects were seen
especially when looking the pictures from Cellomics ArrayScan: the effects are not that
clearly seen in output data (will be discussed in more detail in discussion-part). The
toxic effects evaluated by eye were usually seen as the cells were either detached from
the bottom of the well, nuclei were tiny sized and really condensed (measured with
average area / average intensity of channel 1: the intensity was growing and area was
reducing) or the mitochondrial membrane potential in the channel 2 was reducing
(parameter measured average intensity of the channel 2).
Staurosporine showed toxicity with even smallest concentrations after 2h incubation.
The intensity of the mitochondria often increased with lower drug concentrations but
drop down with higher concentrations, e.g. with 2.5µM (63% of control). After 24h
incubation cells were usually totally dead (according to brightfield images) with three
(sometimes four) highest concentrations: 5, 2.5 and 1.25µM. The toxic effect of
staurosporine was seen both in nuclei and mitochondria, and the condensation of the
nucleus was visually detectable even with 0.0078µM (107% of control) concentration
and after 2h incubation, sometimes even more clearly than the mitochondrial effects.
The intensity of the mitochondria with staurosporine is shown in figure 26. Also the
effect of staurosporine to mitochondria intensity was surprising after 24h exposuring.
Intensity should be decreasing as it is after 2h and 6h incubation, but after 24h
incubation the intensity is controversially growing. This was most likely because the
cells were dead after that long incubation and the input parameters were not optimal to
detect the dead cells. This is also supported by the high variation of the results.
The toxic effect to nucleus was measured by nucleus average intensity-parameter, the
results are shown in figure 26 where the intensity of the nucleus is being measured. As
seen in figure 26, intensities of the nuclei were so intense after 24h incubation that they
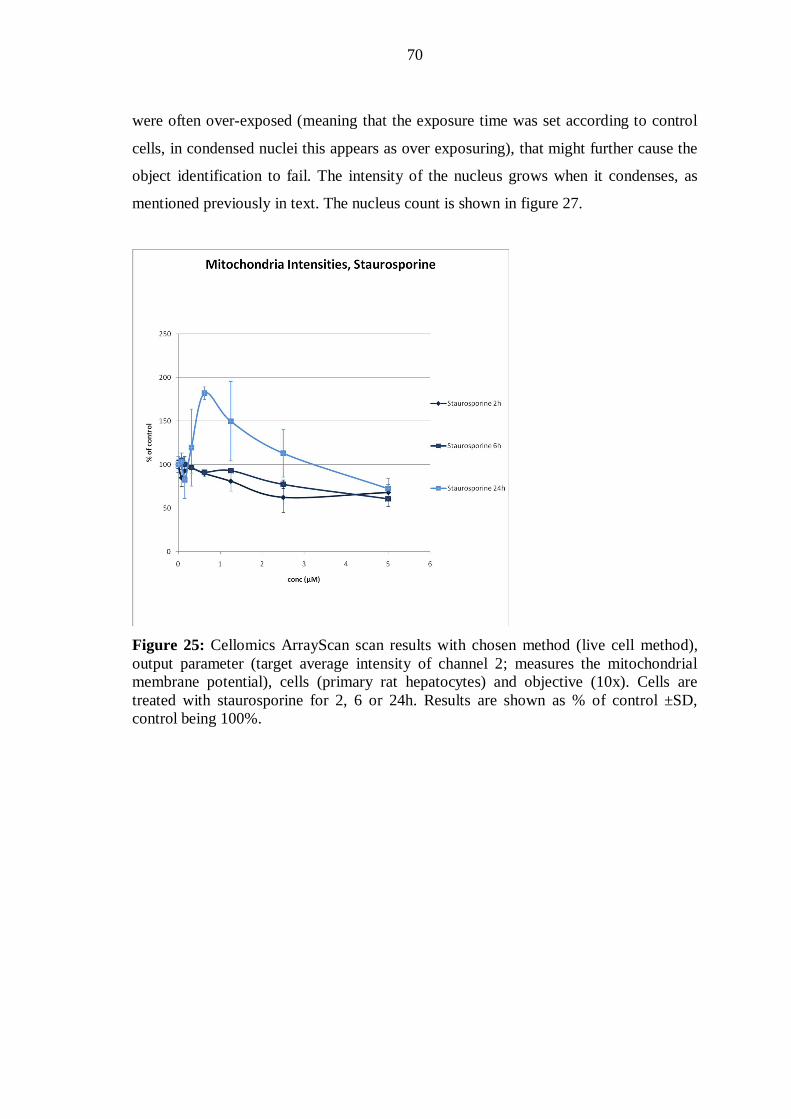
70
were often over-exposed (meaning that the exposure time was set according to control
cells, in condensed nuclei this appears as over exposuring), that might further cause the
object identification to fail. The intensity of the nucleus grows when it condenses, as
mentioned previously in text. The nucleus count is shown in figure 27.
Figure 25: Cellomics ArrayScan scan results with chosen method (live cell method), output parameter (target average intensity of channel 2; measures the mitochondrial membrane potential), cells (primary rat hepatocytes) and objective (10x). Cells are treated with staurosporine for 2, 6 or 24h. Results are shown as % of control ±SD, control being 100%.
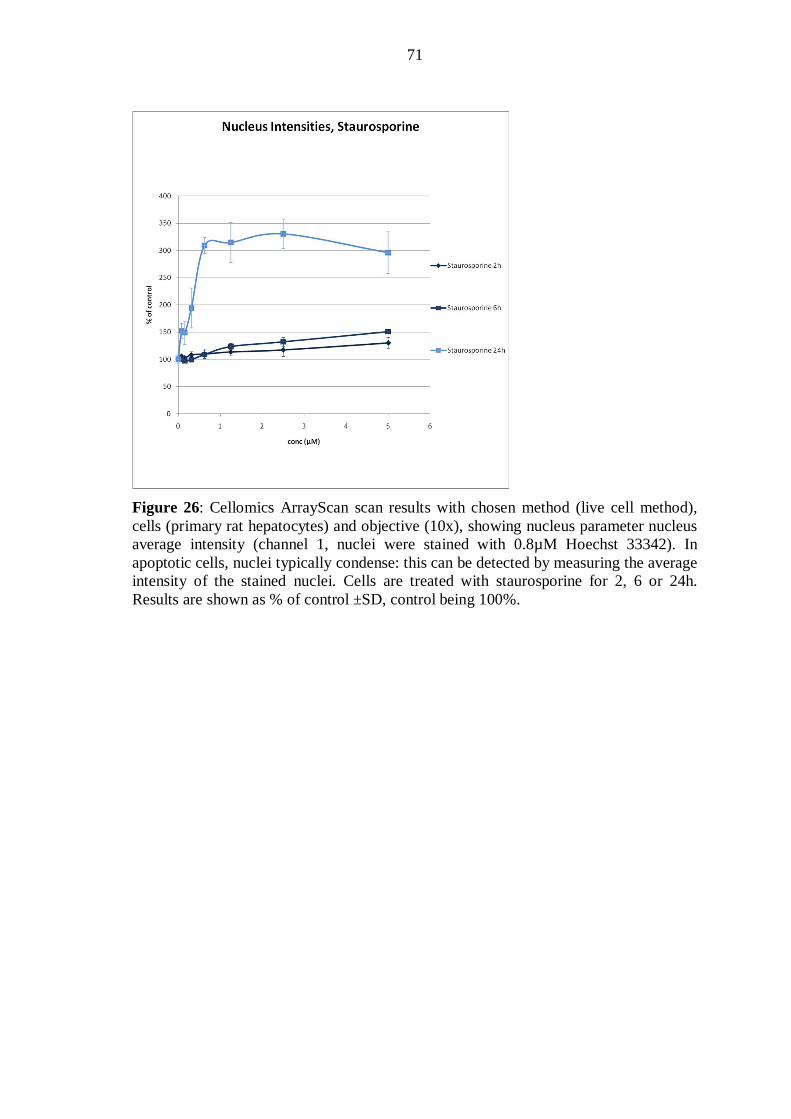
71
Figure 26: Cellomics ArrayScan scan results with chosen method (live cell method), cells (primary rat hepatocytes) and objective (10x), showing nucleus parameter nucleus average intensity (channel 1, nuclei were stained with 0.8µM Hoechst 33342). In apoptotic cells, nuclei typically condense: this can be detected by measuring the average intensity of the stained nuclei. Cells are treated with staurosporine for 2, 6 or 24h. Results are shown as % of control ±SD, control being 100%.
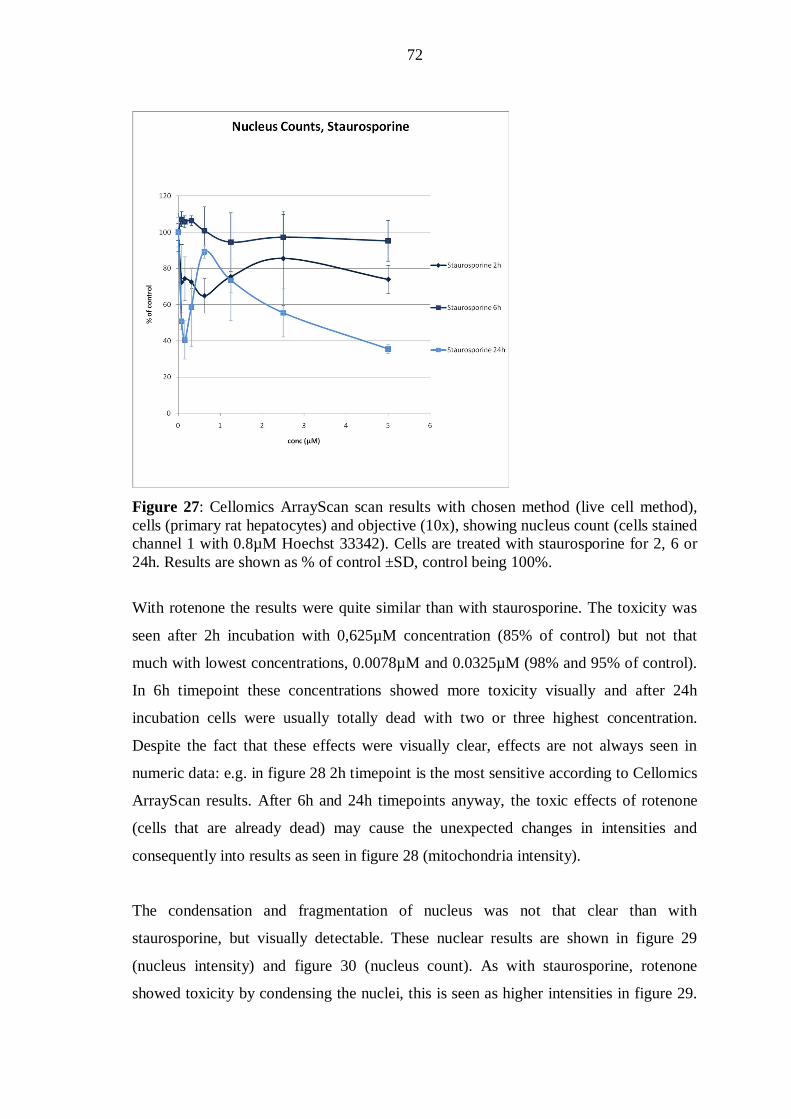
72
Figure 27: Cellomics ArrayScan scan results with chosen method (live cell method), cells (primary rat hepatocytes) and objective (10x), showing nucleus count (cells stained channel 1 with 0.8µM Hoechst 33342). Cells are treated with staurosporine for 2, 6 or 24h. Results are shown as % of control ±SD, control being 100%.
With rotenone the results were quite similar than with staurosporine. The toxicity was
seen after 2h incubation with 0,625µM concentration (85% of control) but not that
much with lowest concentrations, 0.0078µM and 0.0325µM (98% and 95% of control).
In 6h timepoint these concentrations showed more toxicity visually and after 24h
incubation cells were usually totally dead with two or three highest concentration.
Despite the fact that these effects were visually clear, effects are not always seen in
numeric data: e.g. in figure 28 2h timepoint is the most sensitive according to Cellomics
ArrayScan results. After 6h and 24h timepoints anyway, the toxic effects of rotenone
(cells that are already dead) may cause the unexpected changes in intensities and
consequently into results as seen in figure 28 (mitochondria intensity).
The condensation and fragmentation of nucleus was not that clear than with
staurosporine, but visually detectable. These nuclear results are shown in figure 29
(nucleus intensity) and figure 30 (nucleus count). As with staurosporine, rotenone
showed toxicity by condensing the nuclei, this is seen as higher intensities in figure 29.
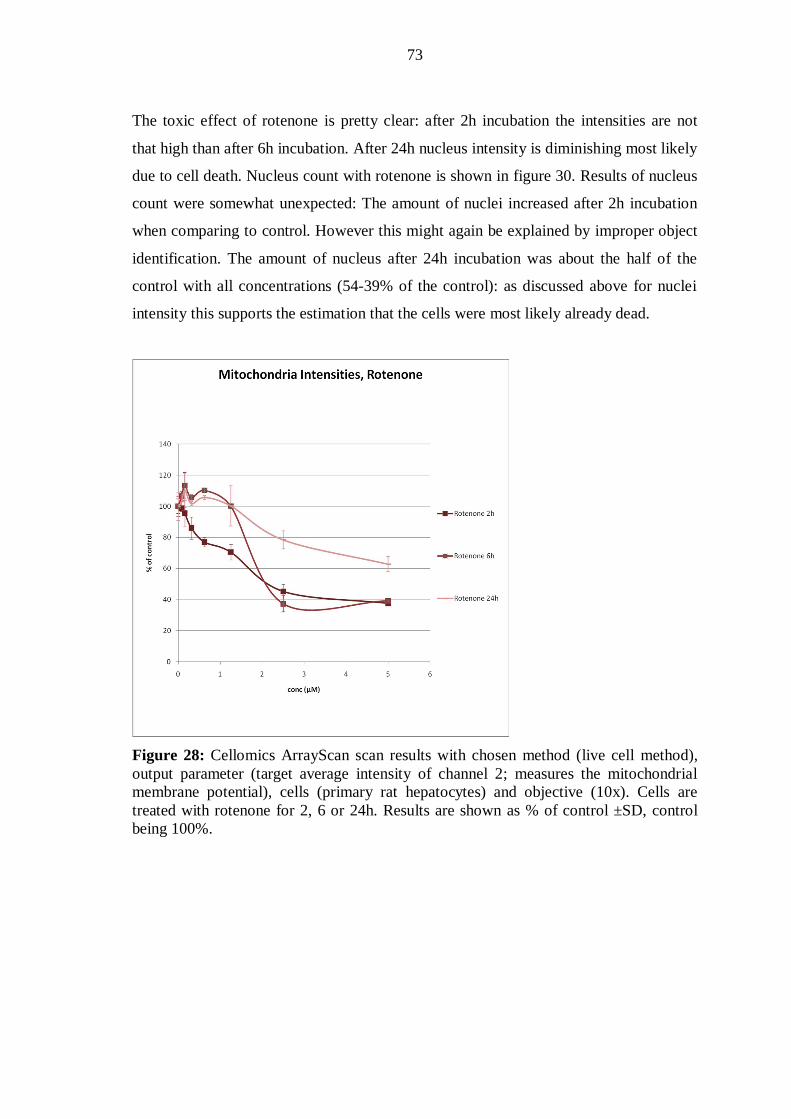
73
The toxic effect of rotenone is pretty clear: after 2h incubation the intensities are not
that high than after 6h incubation. After 24h nucleus intensity is diminishing most likely
due to cell death. Nucleus count with rotenone is shown in figure 30. Results of nucleus
count were somewhat unexpected: The amount of nuclei increased after 2h incubation
when comparing to control. However this might again be explained by improper object
identification. The amount of nucleus after 24h incubation was about the half of the
control with all concentrations (54-39% of the control): as discussed above for nuclei
intensity this supports the estimation that the cells were most likely already dead.
Figure 28: Cellomics ArrayScan scan results with chosen method (live cell method), output parameter (target average intensity of channel 2; measures the mitochondrial membrane potential), cells (primary rat hepatocytes) and objective (10x). Cells are treated with rotenone for 2, 6 or 24h. Results are shown as % of control ±SD, control being 100%.
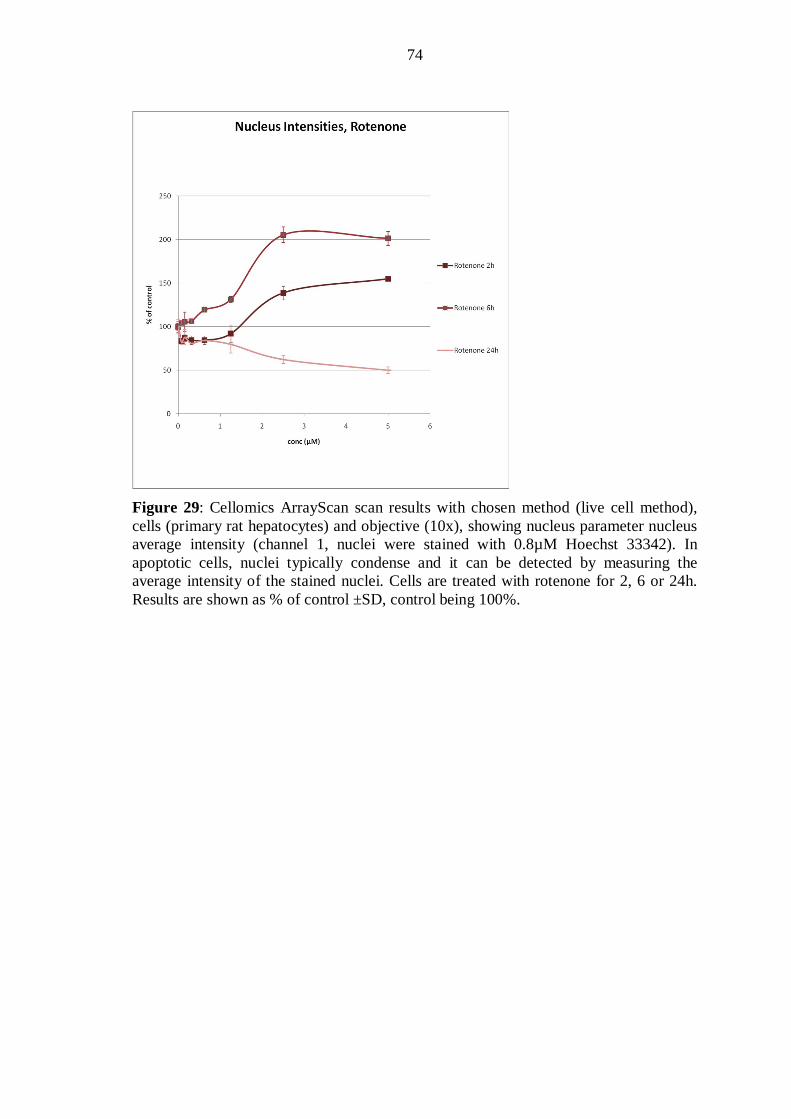
74
Figure 29: Cellomics ArrayScan scan results with chosen method (live cell method), cells (primary rat hepatocytes) and objective (10x), showing nucleus parameter nucleus average intensity (channel 1, nuclei were stained with 0.8µM Hoechst 33342). In apoptotic cells, nuclei typically condense and it can be detected by measuring the average intensity of the stained nuclei. Cells are treated with rotenone for 2, 6 or 24h. Results are shown as % of control ±SD, control being 100%.

75
Figure 30: Cellomics ArrayScan scan results with chosen method (live cell method), cells (primary rat hepatocytes) and objective (10x), showing nucleus count (cells stained channel 1 with 0.8µM Hoechst 33342). Cells are treated with rotenone for 2, 6 or 24h. Results are shown as % of control ±SD, control being 100%.
Tolcapone was the drug not showing that clear toxicity after 2h and 6h incubation. After
24h incubation the toxic effects were already seen with lowest drug concentrations
(0.078, 0.325 and 0.65µM: 103%, 98% and 97 % of control, respectively). The intensity
of the mitochondria (channel 2) after 2, 6 or 24h incubation with tolcapone is shown in
figure 31. With tolcapone the mitochondrial effects were more clear marks of toxicity
than nucleus fragmentation or condensation. The intensities of the nuclei after 2h
incubation was mildly increasing with all drug concentrations: this was the situation
also after 6h incubation. After 24h incubation the intensities of the nuclei decreased
surprisingly, reason for this is unknown since the intensity didn’t seem to decrease
visually. Also the nucleus count was weird: the amount of nucleus (and cells) decreased
after 2h incubation with all concentrations. After 6h incubation the amount of nucleus
increased and after 24h did not show any clear effects: these results were maybe due
inappropriate method optimization and object identification. Figure 32 shows the
intensity of the nucleus and 33 shows nucleus count.

76
Figure 31: Cellomics ArrayScan scan results with chosen method (live cell method), output parameter (target average intensity of channel 2; measures the mitochondrial membrane potential which should reduce as cells go through apoptosis), cells (primary rat hepatocytes) and objective (10x). Cells are treated with tolcapone for 2, 6 or 24h. Results are shown as % of control ±SD, control being 100%.

77
Figure 32: Cellomics ArrayScan scan results with chosen method (live cell method), cells (primary rat hepatocytes) and objective (10x), showing nucleus parameter nucleus average intensity (channel 1, nuclei were stained with 0.8µM Hoechst 33342). In apoptotic cells, nuclei typically condense and it can be detected by measuring the average intensity of the stained nuclei. Cells are treated with tolcapone for 2, 6 or 24h. Results are shown as % of control ±SD, control being 100%.
Figure 33: Cellomics ArrayScan scan results with chosen method (live cell method), cells (primary rat hepatocytes) and objective (10x), showing nucleus count (cells stained channel 1 with 0.8µM Hoechst 33342). Cells are treated with tolcapone for 2, 6 or 24h. Results are shown as % of control ±SD, control being 100%.
10.4 Conventional analysis of cytotoxicity
Primary rat hepatocytes showed slight cytotoxicity using ATP and LDH measurements
already after 2 hours incubation with all three test compounds.
Cytotoxic effect of staurosporine was moderate after 2 hours of incubation (Figure 34).
The ATP levels rose with lower concentrations (from 0.078µM to 1.25µM: from 100 to
110% of control) but drop down with 5µM (62% of control). The rose in ATP levels
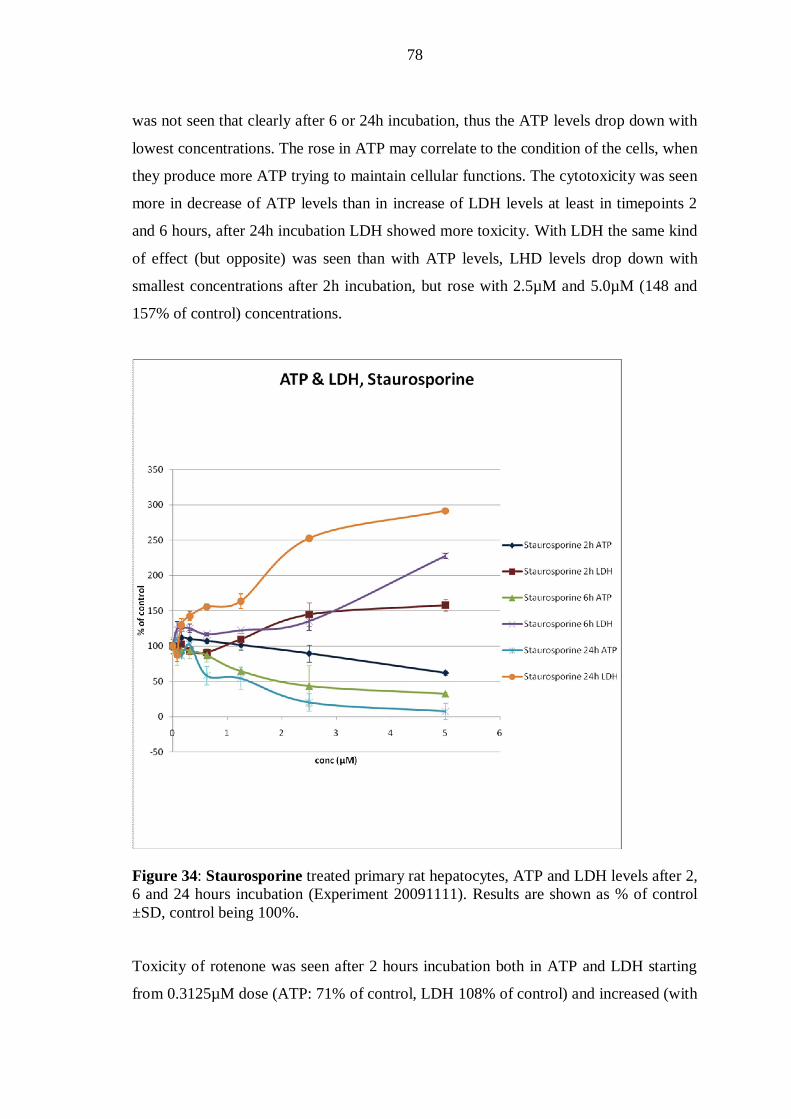
78
was not seen that clearly after 6 or 24h incubation, thus the ATP levels drop down with
lowest concentrations. The rose in ATP may correlate to the condition of the cells, when
they produce more ATP trying to maintain cellular functions. The cytotoxicity was seen
more in decrease of ATP levels than in increase of LDH levels at least in timepoints 2
and 6 hours, after 24h incubation LDH showed more toxicity. With LDH the same kind
of effect (but opposite) was seen than with ATP levels, LHD levels drop down with
smallest concentrations after 2h incubation, but rose with 2.5µM and 5.0µM (148 and
157% of control) concentrations.
Figure 34: Staurosporine treated primary rat hepatocytes, ATP and LDH levels after 2, 6 and 24 hours incubation (Experiment 20091111). Results are shown as % of control ±SD, control being 100%.
Toxicity of rotenone was seen after 2 hours incubation both in ATP and LDH starting
from 0.3125µM dose (ATP: 71% of control, LDH 108% of control) and increased (with

79
LDH) or reduced (with ATP) with higher doses, 0,625µM, 0,125µM, 1,25µM and
2.5µM (Figure 35; ATP: 57, 27, 11 and 3% of control, LDH 108, 110, 165 and 225% of
control). Results were the same with longer incubation times (seen in figure 35). From
the three drug compounds tested rotenone showed the most clear toxicity effects in each
timepoint.
Figure 35: Rotenone treated primary rat hepatocytes, ATP and LDH levels after 2, 6 or 24 hours incubation. Results are shown as % of control ±SD, control being 100%.
The effect on ATP and LDH levels was seen with 12.5µM concentration of tolcapone
and increased after it with 25µM (ATP 33% of control; LDH 123% of control) and
50µM (ATP 2% of control; LDH 165% of control) doses at 2h timepoint as seen in
figure 36. After 6 hours and 24 hours incubation tolcapone showed the same kind of
dose-response effects: The decrease in ATP levels as well as the increase in LDH levels

80
were seen the starting from 12.5µM dose: the smaller doses did not show remarkable
cytotoxicity.
Figure 36: Tolcapone treated primary rat hepatocytes, ATP and LDH levels after 2, 6 or 24 hours incubation. Results are shown as % of control ±SD, control being 100%.
10.5 Evaluation of phototoxicity
To evaluate phototoxicity in live cell method the untreated primary rat hepatocytes were
stained with Hoechst 33342 and TMRM, with 4 different concentrations of Hoechst
33342 µM/TMRM nM: 0.2/5, 0.4/10, 0.8/20 and 1.6/40 and control without dyes. Three
concurrent wells were done for each concentration. In one plate two concurrent “sets” of

81
concentrations existed: The left side of the plate was exposured using Cellomics
Arrayscan and the right side of the plate was not. Exposure times were as follows:
Channel 1 (Hoechst 33342) 0.1 seconds, Channel 2 (TMRM) 0.8 seconds. After
exposing ATP and LDH levels were measured from each well and values of exposed
wells were compared to non-exposed ones. The experiment was done twice. No
phototoxicity was seen, the results are shown in figure 37.
Figure 37: Phototoxicity testing. Cells were untreated primary rat hepatocytes, probes used were Hoechst 33342 and TMRM, with 4 different concentrations (Hoechst 33342 µM/TMRM nM): 0.2/5, 0.4/10, 0.8/20 and 1.6/40 and control without dyes. Three concurrent wells were done for each concentration. The left side of the plate was exposured using Cellomics ArrayScan and the right side of the plate was not. Exposure times were as followings: Channel 1 (Hoechst 33342) 0.1 seconds, Channel 2 (TMRM) 0.8 seconds. After exposuring ATP and LDH levels were measured from each well and values of exposed wells were compared to non-exposed ones. In figure results are shown as % of control ±SD, control being 100%.

82
11. DISCUSSION
The aim of this study was to set up and optimize new high content screening- methods
for early drug toxicity testing. HCS instrument is basically a user-friendly automated
fluorescence microscope situated in a box and equipped with image analysis software.
In the study two protocols were set up and optimized to examine mitochondrial damage
caused by different mitochondria toxic compounds. Both live cells (mitochondria probe
TMRM) and fixed cells (cytochrome c antibody together with Alexa 488 conjugated
secondary antibody) were used. The sensitivity and the results as dose responses of
these methods were compared to each other and to conventional analyse of cytotoxicity
(ATP and LDH measurement). In addition, two different cell types, primary rat
hepatocytes and Hep G2 cells were used and compared. Staurosporine, rotenone and
tolcapone were chosen as test compounds because they are known to be hepatotoxic,
and they all are known to have an effect for mitochondria and its function.
After optimizing the subculturing procedure for HepG2 cells both live cell method and
fixed cell method were optimized to find the optimal probe concentrations, overall
experimental conditions and input parameters for both methods and cell types used.
Both cell types showed a response for drug treatments. However, rat primary
hepatocytes were selected to be used since they showed more response for drug
treatments and the results were more reproducible. This was seen both visually and in
numeric results (output parameters). The cytotoxic effects of the test compounds were
seen earlier and with lower drug concentrations. In addition, tolcapone showed only
very slight toxicity with HepG2-cells whereas primary hepatocytes showed much more
effect. The difference between cell models is due to the better metabolism capacity with
primary rat hepatocytes.
Hoechst 33342 and TMRM probes were used in the live cell method. In damaged cells
apoptosis causes the condensation and fragmentation of the nucleus and when nuclei are
stained with Hoechst 33342 the apoptotic effect is seen when the area of the nucleus is
smaller and the intensity of the fluorescence is increased. In mitochondria toxic
compounds can reduce membrane potential through several mechanisms, for example
83
uncoupling and complex I inhibition. When using TMRM probe both the area and the
intensity of the fluorescence are decreased. The probes used in live cell method worked
well together since their excitation/emission spectras separated so that the signal
identification was possible to do using Cellomics ArrayScan, as well as the incubation
times that were possible to combine. The concentrations of the probes and the exposure
times was tried to keep as low as possible in order not to cause phototoxicity to the
cells. No phototoxicity was detected with concentrations used. At the same time the
quality of the image and the identification of the cells were tried to get as good as
possible. The most sensitive output parameters measured in the live cell method were
nucleus intensity and average intensity of mitochondria area.
With fixed cell method the purpose was to measure Cytochrome C release from
mitochondria as a response to cytotoxic compounds. The aim was to stain the
mitochondria of the cells with Mitotracker Red CMXRos and Cytochrome C using
cytochrome c antibody and Alexa 488-conjugated secondary antibody to see the
colocalization of these signals. However, with the experimental conditions used, the
Mitotracker Red CMXRos probe was leaking from the mitochondria during fixation
procedure and therefore could not be used in these studies. Other probes, the nucleus
probe Hoechst 33342, and cytochrome c antibody together with Alexa 488 conjugated
secondary antibody worked out well.
After the methods were optimized they were tested and the results were compared to
each other and to conventional analysis of cytotoxicity, ATP and LDH measurement.
As mentioned before, the primary aim with fixed cells (to do the colocalization with
cytochrome c and mitochondria) did not work out and only the leakage of the
cytochrome c to nucleus area was measured. With live cells the membrane potential of
mitochondria was measured using TMRM. Membrane potential correlates to the
intensity of the probe fluorescence, examples are seen in figure 17 (figure from
cellomics) and 20. All three examined drugs showed response in experiments which
was seen as reduced intensity of fluorescence of TMRM in mitochondria in drug treated
cells, the highest concentrations affecting the most. With fixed cells the dose response
84
was not that clearly seen and for this reason among the others (discussed in more detail
below) live cell method was the one used in experiments.
The live cell method was more sensitive and reliable than fixed cell method: this was
seen in every experiment (three concurrent were done) both visually and numerically
(output parameters). Live cell method showed smaller sd:s and the results were more
similar between experiments. Also the probe leaking with fixed cell method (the
inadequate optimization of fixation protocol) affected negatively to the results of fixed
cell method. In addition, the handling of the cells was easier with live cell method. Live
cell method was faster to perform because there were no immunocytochemistry part that
had to be done as was with fixed cell method: this made live cell method also the
cheaper one when there were no expensive antibodies that were used. The costs that
immunocytochemistry protocol caused by increasing the working hours must also take
into account. However, the advantages of the fixed cell method are that with multiple
plates in a screen a robotic arm could be used and that the plates can be scanned again
and even stained with another probe again. Also when screening multiple plates the use
of the live cells is more challenging and requires automated pipetting and an incubator
connected to the Cellomics ArrayScan instrument, since the steps must be graded so
that the scans etc. do not overlap.
Of the three timepoints 2h timepoint was the best one used, it was most sensitive and
dose responses were most clear: after 24h incubation cells were usually dead which
affected negatively to the results. 6h timepoint was also good, but the timepoint itself
caused that the working hours at the laboratory growed significantly over 8h (this was
the supposed working hours per day at the laboratory). In addition, after 6h and 24h
incubation cells may have fixed the smallest injuries caused by test compounds.
The test compound that showed most reproducible results and worked best both with
live cell and fixed cell method as well as showed clear nuclear and mitochondrial
cytotoxic effects was rotenone. Rotenone showed toxicity already after 2h incubation
and made this in every experiment: also the sd:s with rotenone were the smallest ones
when comparing to staurosporine and tolcapone. Staurosporine showed most toxicity in

85
each assay, but the reproducibility of the staurosporine results was poor since the cells
were dead particularly after 24h incubation. In this situation the measuring of the
mitochondrial or nuclear intensity was challenging, not only for the optimization of the
input parameters but also due to the over-exposure and the detachment of the dead cells
from the bottom of the well. Tolcapone did not show that much toxicity than
staurosporine and rotenone even after 24h incubation, and according to these
observations it was the least toxic drug of the three model substances used to the
hepatocytes. For these reasons, rotenone would serve best as a positive control in the
screening assays.
One of the biggest problems in using Cellomics ArrayScan was that the toxic effects
were seen by eye, but it was very difficult to set the input parameters so that the same
would have been seen as numeric results. This is most likely caused by poor
identification of the objects and therefore the input parameters must be optimized more.
To improve the sensitivity of the experiments one additional option that could be done
is to determine if the cell is dying either apoptotic or necrotic way. A bioapplication
which measures spots in nucleus area could be used and the cells would be scanned with
20x or 40x objective so that the spots are visible in nucleus. This is because only
apoptotic cell death causes fragmentation of the DNA in nucleus. In necrotic cell death
DNA is just falling apart and in necrotic nucleus DNA spots are not seen. Anyway, this
was not included in this thesis, but might be one possible improvement in method
optimization. In addition, in further experiments it is useful to measure and combine
more Cellomics ArrayScan output parameters: this could make the method more
sensitive and improve the assay results. Also ways to measure easily possible compound
precipitation and to detect if the cells are still alive would be needed for a reliable assay.
In these assays the brightfield images were used to determine the condition of the cells
and to see if they are still alive: this is not possible to do with single fluorescent probe.
Measuring of the fluorescence is not reasonable if the cells are not even alive and dead
cells cause errors to the results.
86
For screening purposes it would be useful to have a clear threshold value for toxicity so
that the comparison of the results would be as easy as it is with conventional
cytotoxicity measuring methods using EC50-value (Effective Concentration: this refers
to the concentration of a drug or antibody that causes the effect that is in a halfway
between the baseline and maximum after certain exposure time). However, measuring
EC50- value is difficult with Cellomics ArrayScan where the dose responses are not
always very clear due to microscopical examination where the measured difference
between minimum and maximum concentration can be small and the sd:s are big. In
addition, the difference in the HCS and conventional cytotoxicity analysis methods
must be taken into account: when Cellomics ArrayScan measures the certain amount of
fields in each well, the conventional analysis of cytotoxicity measure the effect in whole
well and in whole cell population. To do the same measurement with Cellomics
ArrayScan all the fields should have been scanned, which is not reasonable, since it
would take too much time to scan all the fields. The main point in HCS is to reduce time
needed in experiments and to find more sensitive ways to measure toxicity. However,
further method development would be needed to find a valid threshold value for
Cellomics ArrayScan assays.
12. CONCLUSIONS
In this Pro Gradu the aim of the study was to implement and optimize new HCS-
methods for researching mitochondrial toxicity. After optimizing cell culture conditions
for the hepatoma cell line HepG2s, the optimizations of live cell and fixed cell methods
were done for both cell models used, the HepG2s and primary rat hepatocytes. The
probe concentrations used as well as the test compound concentrations were optimized.
Also all the Cellomics ArrayScan parameters were defined. The most sensitive
parameters expressing the toxicity were selected and compared to see the possible
difference between new methods and the conventional cytotoxicity analysis method,
meaning the measure of ATP and LDH.
87
As a conclusion, conventional analysis of cytotoxicity show clearer dose responses and
are as sensitive to cytotoxic effects as HCS methods so far. More optimization and
method improvement must be done to get the methods work; this was not possible in
this thesis due to time limits. Attention must be paid to the probes used, to see if better
probe combinations work better together and optimize fixation protocol to get the
mitochondrial probes work also with fixed protocols: with live cell method there were
no problem. The problem with probe leakage from channel to channel would be needed
to solve, to see if the problem is in method used or in Cellomics ArrayScan itself.
Especially the input parameters require more optimization to get the object
identification adequate. When comparing the methods with each other the live cell
method was more sensitive in predicting toxicity than the fixed cell method. Maybe this
was because of the problems that were confronted with the fixed cell method. Also the
variations in the results of the fixed cell method were bigger than variations in the live
cell method and the dose-response were not that good as with live cells. On the other
hand, as told before, it is much easier to work with fixed cells when there is no need to
take that much care to the conditions cells are kept. Also the robot hand helped working
with fixed cells.
Of the three test compounds used staurosporine was the most toxic to the cells
according to test results. Toxicity was clearly seen already after 2h incubation and the
cells were all dead after 24h incubation. However, rotenone, that was not that toxic to
the hepatocytes but more toxic than tolcapone, was the most reliable drug to show
toxicity: it effects were reproducible and the dose-responses were clear. Tolcapone was
the least toxic and no clear toxic effects were seen with tolcapone after 2h incubation:
after 24h incubation some effects were detectable.
The major challenge with HCS is the variation of the results which, however, is typical
in microscopical examination. On the whole Cellomics ArrayScan is a useful and
powerful device in toxicity screening. Possibility for multiplexing and combining
different parameters makes HCS methods sensitive when many different cellular
functions can be measured simultaneously. This spares money, time and resources. In
addition, the mechanisms that cause toxicity are possible to specify with HCA. There

88
are lots of different bioapplications available and many helpful tools (reference wells
etc) in Cellomics ArrayScan which makes it a powerful tool for early stage toxicity
screening.

89
LITERATURE
Alberts, B, Johnson A, Lewis J, Raff M, Roberts K, Walter P: The molecular biology of the cell. New York, Garland Science, 2002 Armstrong JS, Steinauer KK, Hornung B, Irish JM, Lecane P, Birrell GW, Peehl DM, Know SJ : Role of glutathione depletion and reactive oxygen species generation in apoptotic signaling in a human B lymphoma cell line. Cell Death Differ, 9: 252-263, 2002 Bd Bioscienses: Bioimaging technologies. Received from internet 11.1.2010: http://www.bdbiosciences.com/eu/research/bioimaging/ Bellance N, Lestienne P, Rossignol R (2009). Mitochondria: from bioenergetics to the metabolic regulation of carcinogenesis. Front Biosci 14: 4015-34, 2009 Bertrandt R, Solary E, O´Connor P, Kohn KW, Pommier Y: Induction of a common pathway of apoptosis by staurosporine. Exp Cell Res 211: 314-321, 1994 BioTheman: Luminescence analysis. Received from internet 20.9.2010: http://www.biothema.com/index.do Boelsterli UA and Lim PLK: Mitochondrial abnormalities – A link to idiosyncratic drug hepatotoxicity? Toxicol Appl Pharm 220: 92-107, 2007 Brookes PS: Mitochondrial H+-leak and ROS generation: and odd couple. Free Radic Biol Med 38:12-23, 2005 Carafoli E.: Plasma membrane Ca2+ transport, and Ca2+ handling by intracellular stores: an integrated picture with emphasis on regulation. Kroc Found Ser 17: 121-34, 1984 Danial NN and Korsmeyer SJ: Cell death: Critical control points. Cell 23: 205-219, 2004 Denton RM, McCormack JG, Edgell NJ: Role of calcium ions in the regulation of intramitochondrial metabolism. Effects of Na+, Mg2+ and ruthenium red on the Ca2+ stimulated oxidation of oxoglutarate and on pyruvate dehydrogenase activity in intact rat heart mitochondria. Biochem J 190: 107-17, 1980 Deveraux QL and Reed JC: IAP family proteins – suppressors of apoptosis. Gene Dev 13: 239-252, 1999 Dykens JA and Will Y: The significance of mitochondrial toxicity testing in drug development. Drug Discov Today. 12: 17/18, 2007 Edinger AL and Thompson BC: Death by design: apoptosis, necrosis and autophagy.

90
Curr Opin Cell Biol, 16: 663-9, 2004 Ehrenberg, B, Montana V, Wei MD, Wuskell JP, Loew LM: "Membrane potential can be determined in individual cells from the nernstian distribution of cationic dyes." Biophys J 53: 785-794, 1988 Feng G. and Kaplowitz N: Mechanism of staurosporine-induced apoptosis in murine hepatocytes. Am J Physiol Gastrointest Liver Physiol 282: 825-834, 2002 Fiers W, Beyaert R, Declercq W, Vandenabeele P: More than one way to die: apoptosis, necrosis and reactive oxygen damage. Oncogene 18: 7719-7730, 1999 Fallon, R J.: Staurosporine inhibits a tyrosine protein kinase in human hepatoma cell membranes. Biochem Bioph Res Co 170(3): 1191-1196, 1990 Frey, TG and Mannella CA: The internal structure of mitochondria. Trends Biochem Sci 25: 319-24, 2000 Gasparri F, Sola F, Bandiera T, Moll J, Galvani A: High-content analysis of kinase activity in cells. Comb Chem High Throughput Screen 11:523-536, 2008 Gerets HH, Hanon E, Cornet M, Dhalluin S, Depelchin O, Canning M, Atienzar FA: Selection of cytotoxicity markers for the screening of new chemical entities in a pharmaceutical context: A preliminary study using a multiplexing approach. Toxicol In Vitro 23: 319-332, 2009 Gilmore K, Wilson M: The use of chloromethyl-X-rosamine (Mitotracker Red CMXRos) to measure loss of mitochondrial membrane potential in apoptotic cells is incompatible with cell fixation. Cytometry 25: 333-340 Gómez-Lechón MJ, Ponsoda X, Bort R, Castell JV: Sensitive markers used to identify compounds that trigger apoptosis in sultured hepatocytes. Toxicol Sci 65: 299-308, 2001 Gunter TE, Pfeiffer DR: Mechanisms by which mitochondria transport calcium. Am J Physiol 258: 755-768, 1990 Haasio K, Koponen A, Penttilä KE, Nissinen E: Effects of entacapone and tolcapone on mitochondrial membrane potential. Eur J Pharmacol 453:21-26, 2002 Hewitt NJ, Gómez Léchon MJ, Houston JB, Hallifax D, Brown S, Maurel P, Kenna JG, Gustavsson L, Lohmann C, Skonberg C, Guillouzo A, Tuschl G, Li AP, LeCluyse E: Primary hepatocytes: Current understanding of the regulation of metabolic enzymes and transporter proteins and pharmaceutical practice for the use of hepatocytes in metabolism, enzyme induction, transporters, clearance and hepatotoxicity studies. Drug Met Rew 39: 159-234. 2007

91
Invitrogen: Mitochondrial dyes. received from internet 20.10.2009: http://products.invitrogen.com/ivgn/product/M7512?ICID=search-product Irwin WA, Jelic D, Antolovic R: Biomarkers for drug discovery: Important aspects of in vitro assay design for HTS and HCS bioassays. Croat Chem Acta 81: 23-30, 2008 Jaeschke H, Gores GJ, Cederbaum AI, Hinson JA, Pessayre D, Lemasters JJ: Mechanisms of hepatotoxicity. Toxicol Sci, 65: 166-176, 2002 Johnson I: Fluorescent probes for living cells. Histochem J 30:123-140, 1998 Kass GE, Price SH: Role of mitochondria in drug-induced cholestatic injury. Clin Liver Dis 12: 27-51, 2008 Kohen R and Nyska A: Oxidation of biological systems: Oxidative stress phenomena, antioxidants, redox reactions and methods for their quantification. Toxicol Pathol, 30: 620-650, 2002 Korsmeyer SJ, Wei MC, Saito M, Weiler S, Oh KJ, Schlesinger PH. Pro-apoptotic cascade activates BID, which oligomerizes BAK or BAX into pores that result in the release of cytochrome c. Cell Death Differ 7: 1166-73, 2000 Kowaltowski, AJ: Alternative mitochondrial functions in cell physiopathology: beyond ATP production. Braz J Med Biol Res 33: 241-50, 2000 Kwong JQ, Henning MS, Starkov AA, Manfredi G: The mitochondrial respiratory chain is a modulator of apoptosis. J Cell Biol 179: 1163-77, 2007 Labbe G, Pessayre D, Fromently B: (2008). Drug-induced liver injury through mitochondrial dysfunction: mechanisms and detection during preclinical safety studies. Fundam Clin Pharmacol 22: 335-53, 2008 Lee WM: Drug-induced hepatotoxicity. New Engl J Med 349: 474-485, 2003 Li N, Ragheb K, Lawler G, Sturgis J, Rajwa B, Melendez JA, Robinson JP: Mitochondrial complex I inhibitor rotenone induces apoptosis through enhancing mitochondrial reactive oxygen species production. J Biol Chem 278: 8516-8525, 2003 Malhi H and Gores GJ: Cellular and molecular mechanisms of liver injury. Gastroenterology 134: 1641-1654, 2008 Mannella CA: Structural diversity of mitochondria: functional implications. Ann N Y Acad Sci 1147:171-179, 2008 Neustadt, J and Pieczenik SR: Medication-induced mitochondrial damage and disease. Mol Nutr Food Res 52: 780-288, 2008

92
O'Brien PJ, Irwin W, Diaz ., Howard-Cofield E, Krejsa CM, Slaughter MR, Gao B, Kaludercic N. Angeline A, Bernardi P, Brain P, Hougham C: High concordance of drug-induced human hepatotoxicity with in vitro cytotoxicity measured in a novel cell based model using high content screening. Arch Toxicol 80: 580-604, 2006 Parone PA, James DI, Da Cruz S, Mattenberger Y, Donzé O, Barja F, Martinou JC : inhibiting the mitochondrial fission machinery does not prevent Bax/Bak-dependent apoptosis. Mol Cell Biol 26: 7397-7408, 2006 Pereira SP, Pereira GC, Moreno A, Oliveira PJ: Can drug safety be predicted and animal experiments reduced by using isolated mitochondrial fractions? Altern Lab Anim 37:355-365, 2009 Pieczenik SR, Neustadt J: Mitochondrial dysfunction and molecular pathways of disease. Exp Mol Pathol 83: 84-92, 2007 Proskuryakov SY, Konoplyannikov AG, Gabai VL: Necrosis: A specific form of programmed cell death? Exp Cell Res 283: 1-16, 2003 Rasmussen H: The calcium messenger system. N Engl J Med 314: 1094-2101, 1986 Rasmussen H, Barrett P, Smallwood J, Bollag W, Isales C: Calcium ion as intracellular messenger and cellular toxin. Environ Health Perspect 84: 17-25, 1990 Roche: Cytotoxicity Detection Kit. Received from internet 10.6.2009: http://www.roche-applied-science.com/pack-insert/1644793a.pdf Roma MG and Pozzi EJS: Oxidative stress: A radical way to stop making bile. Ann Hepatol 7:16-33, 2008 Sas K, Robotka H, Toldi J, Véscei L: Mitochondria, metabolic disturbances, oxidative stress and the kynurenine system, with focus on neurodegenerative disorders. J Neurol Sci, 257: 221-239, 2007 Scheffler I: Mitochondria. New Jersey, John Wiley & Sons, 2008 Scheffler IE: A century of mitochondrial research: achievements and perspectives. Mitochondrion 1: 3-31, 2001 Smith KS, Smith PL, Heady TN, Trugman JM, Harman WD, Macdonald TL. In Vitro Metabolism of Tolcapone to Reactive Intermediates: Relevance to Tolcapone Liver Toxicity." Chem Rese Toxicol 16: 123-128, 2003 Suen DF, Norris KL, Youle RJ.: Mitochondrial dynamics and apoptosis. Genes Dev 22: 1577-1590, 2008 Szewczyk A, Wojtcak L: Mitochondria as a pharmacological target. Pharmacol Rev. 54: 101-27, 2002

93
Tafazoli S, Spehar DD, O'Brien PJ: Oxidative stress mediated idiosyncratic drug toxicity. Drug Metab Rev 37: 311-25, 2005 Terai T and Nagano T: Fluorescent probes for bioimaging applications. Curr Opin Chem Biol 12:515-521, 2008 Thermo Scientific: Cellomics Compartmental Analysis V3, bioapplication Guide. Searched from internet 20.10.2009: http://www.cellomics.com/ Thermo Scientific: Multiplexing of antibody and GFP-based translocation assays: A Pathway to better profiling of cellular sigalling. Received from internet 16.11.2010: www.cellomics.com/component/option,com_docman/task.../target= Toogood PL: Mitochondrial drugs. Curr Opin Chem Biol 12:457-63. 2008 Turrens JF: Mitochondrial formation of reactive oxygen species. J Physiol 552: 335-344, 2003 Wang Y, Zhang B, Peng X, Perpetua M, Harbrecht BG: Bcl-xL prevents staurosporine induced hepatocyte apoptosis by restoring protein kinase B/mitogen-activated protein kinase activity and mitochondria integrity. J Cell Physiol 215: 676-83, 2008 Westerink, W and Schoonen J: Cytochrome P450 enzyme levels in HepG2 cells and cryopreserved primary human hepatocytes and their induction in HepG2 cells. Toxicol in Vitro 21: 1581-1591, 2007a Westerink, W and Schoonen J: Phase II enzyme levels in HepG2 cells and cryopreserved primary human hepatocytes and their induction in HepG2 cells. Toxicol in Vitro 21: 1592-1602, 2007b Wojtczak, LZK: Basic mitochondrial physiology in cell viability and death: Drug induced mitochondrial dysfunction. J. Dykens & Y Will, New Jersey, John Wiley & Sons: 1-35, 2008 Xu JJ, Diaz D, O'Brien PJ. Applications of cytotoxicity assays and pre-lethal mechanistic assays for assessment of human hepatotoxicity potential. Chem Biol Interact 150: 115-28, 2004


