
Introduction to Interpretation:
Statistical Approaches
and Assumptions
John M. Butler
October 15, 2012
Nashville, TN
2012 Mixture Interpretation Workshop:
Mixtures Using SOUND Statistics, Interpretation, & Conclusions

2/3 want more information
on these topics

Planned Presentation Outline
• Overview/thoughts on interpretation & statistics
• SWGDAM 2010 interpretation guidelines
• Thoughts on setting thresholds
• Problems with CPI/CPE statistics
• Take home messages
• Workshop goals: we are not spending a lot of time on
good 2-person mixtures; we are trying to help define
challenges and uncertainty with more complex mixtures
and ways to address them

Steps Involved in Process
of Forensic DNA Typing
Gathering the Data
Extraction/
Quantitation
Amplification/
Marker Sets
Separation/
Detection
Collection/Storage/
Characterization
1) Data Interpretation
2) Statistical Interpretation
Advanced Topics: Methodology
Interpretation
Understanding the Data
Report
Advanced Topics: Interpretation
INTERPRETATION
John M. Butler

Purpose in Writing a Book on Interpretation
• Each of us thinks our own way is correct – but
misinterpretations have given rise to a variety of
approaches being undertaken today, some of
which are not correct…
• I believe that a better understanding of
general principles will aid consistency and
quality of work being performed
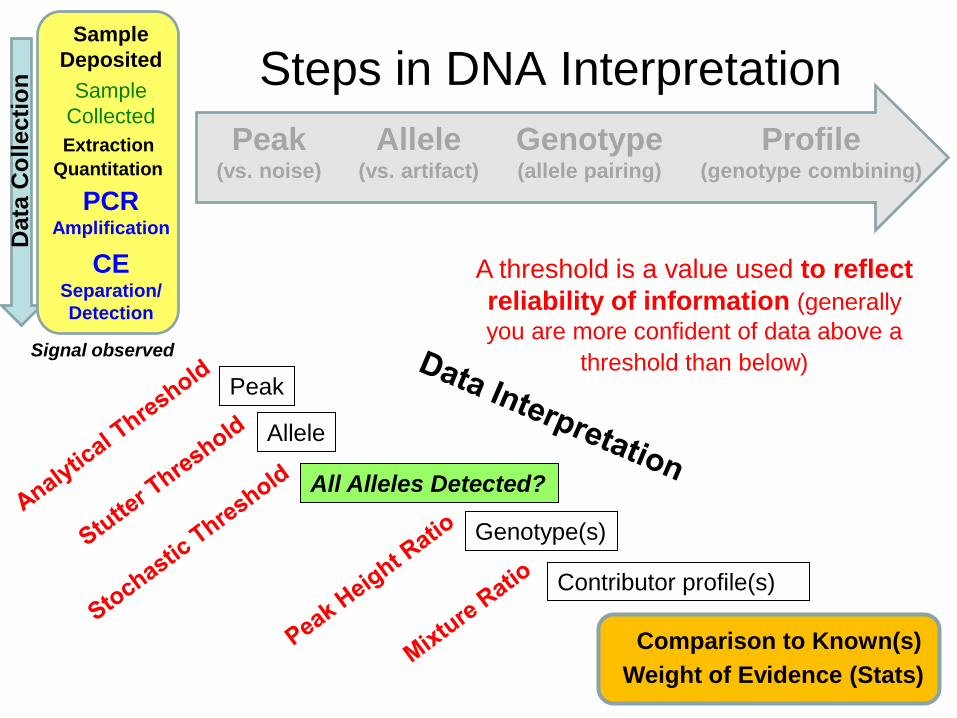
Steps in DNA Interpretation
Peak (vs. noise)
Allele (vs. artifact)
Genotype (allele pairing)
Profile (genotype combining)
Sample
Deposited
Extraction
Quantitation
PCR Amplification
CE Separation/
Detection
Sample
Collected
Data
Co
llecti
on
Signal observed
Comparison to Known(s)
Weight of Evidence (Stats)
Peak
Allele
All Alleles Detected?
Genotype(s)
Contributor profile(s)
A threshold is a value used to reflect
reliability of information (generally
you are more confident of data above a
threshold than below)

Overview of the SWGDAM 2010 Interp Guidelines
1. Preliminary evaluation of data – is something a peak
and is the analysis method working properly?
2. Allele designation – calling peaks as alleles
3. Interpretation of DNA typing results – using the allele
information to make a determination about the
sample
1. Non-allelic peaks
2. Application of peak height thresholds to allelic peaks
3. Peak height ratio
4. Number of contributors to a DNA profile
5. Interpretation of DNA typing results for mixed samples
6. Comparison of DNA typing results
4. Statistical analysis of DNA typing results – assessing
the meaning (rarity) of a match
Other supportive material: statistical formulae, references, and glossary

D.N.A. Approach to Understanding
• Doctrine or Dogma (why?) – A fundamental law of genetics, physics, or chemistry
• Offspring receive one allele from each parent
• Stochastic variation leads to uneven selection of alleles during PCR amplification from low amounts of DNA templates
• Signal from fluorescent dyes is based on …
• Notable Principles (what?) – The amount of signal from heterozygous alleles
should be similar
• Applications (how?) – Peak height ratio measurements

Using Ideal Data to Discuss Principles
0
500
1000
1500
2000
2500
1 2 3 4 5 6 7 8 9 10 11 12 13 14 15 16 17 18 19 20 21 22 23 24 25 26 27 28 29 30 31 32 33 34 35 36 37 38 39 40 41 42 43 44 45 46 47 48 49 50 51 52 53 54 55 56 57 58 59 60 61 62 63 64
13 14
8,8
31 29 10 13
Locus 1 Locus 2 Locus 3 Locus 4
(1) 100% PHR between heterozygous alleles
(2) Homozygotes are exactly twice heterozygotes due to allele sharing
(3) No peak height differences exist due to size spread in alleles (any combination
of resolvable alleles produces 100% PHR)
(4) No stutter artifacts enabling mixture detection at low contributor amounts
(5) Perfect inter-locus balance
(6) Completely repeatable peak heights from injection to injection on the same or
other CE instruments in the lab or other labs
(7) Genetic markers that are so polymorphic all profiles are fully heterozygous with
distinguishable alleles enabling better mixture detection and interpretation
(1)
(2)
(3)
(4)
(5)
(6)
(1) (1)
(7)

Challenges in real-world data
• Stochastic (random) variation in sampling each allele
during the PCR amplification process
– This is highly affected by DNA quantity and quality
– Imbalance in allele sampling gets worse with low amounts of
DNA template and higher numbers of contributors
• Degraded DNA template may make some allele targets
unavailable
• PCR inhibitors present in the sample may reduce PCR
amplification efficiency for some alleles and/or loci
• Overlap of alleles from contributors in DNA mixtures
– Stutter products can mask true alleles from a minor contributor
– Allele stacking may not be fully proportional to contributor
contribution

Do You Have Uncertainty
in Your Data?
• If allele dropout is a possibility
(e.g., in a partial profile), then there is
uncertainty in whether or not an allele
is present in the sample…and
therefore what genotype combinations
are possible
• If different allele combinations are
possible in a mixture, then there is
uncertainty in the genotype
combinations that are possible…
Possible allele pairing
with the 11

It is the Uncertainty that Matters…
It’s the
Uncertainty
Stupid!
http://w
ww
.thedaily
bea
st.
com
/art
icle
s/2
012
/07/0
9/jam
es-c
arv
ille-o
n-h
is-n
ew
-book-i
t-s-t
he-m
iddle
-cla
ss-s
tupid
.htm
l

Uncertainty and Probability
• “Contrary to what many people think,
uncertainty is present throughout any
scientific procedure.” – Dennis V. Lindley, in his foreword to Aitken & Taroni (2004)
Statistics and the Evaluation of Evidence for Forensic
Scientists, Second Edition
• “It is now recognized that the only tool for
handling uncertainty is probability.” – Dennis V. Lindley, in his foreword to Aitken & Taroni (2004)
Statistics and the Evaluation of Evidence for Forensic
Scientists, Second Edition

Results Depend on Assumptions
• “Although courts expect one simple answer,
statisticians know that the result depends on
how questions are framed and on
assumptions tucked into the analysis.” – Mark Buchanan, Conviction by numbers. Nature (18 Jan 2007) 445: 254-255

Is your lab in the process of
changing your protocols?
Perhaps lowering
your expected PHR
70% down to 55%?

Has your lab implemented changes to your
SOPs based on the new guidelines?
32
6 2 6
11
3 2 2
21
14
37
1
10
0
20
40
60
80
100
120
1 2 3 4
Pa
rtic
ipa
nts
Answer
Workshop 1 Workshop 2 Workshop 3 Workshop 4
1. Yes
2. No
3. Reviewed SOPs
but no changes
needed
4. Working on it
From ISHI 2011 poster “Impact of the SWGDAM Mixture Interpretation Guidelines: Successes, Issues and Suggested Future Directions”
N=147 Regional mixture workshops
(Apr – June 2011)
90% have undergone
recent changes or are
in the midst of
changing SOPs for
mixture interpretation

Stats Required for Inclusions
SWGDAM Interpretation Guideline 4.1:
“The laboratory must perform statistical analysis in
support of any inclusion that is determined to be
relevant in the context of a case, irrespective of the
number of alleles detected and the quantitative value of
the statistical analysis.”
Buckleton & Curran (2008): “There is a considerable aura
to DNA evidence. Because of this aura it is vital that weak
evidence is correctly represented as weak or not
presented at all.”
Buckleton, J. and Curran, J. (2008) A discussion of the merits of random man not excluded and
likelihood ratios. Forensic Sci. Int. Genet. 2: 343-348.

Last Year’s Response

CPE/CPI (RMNE) Limitations
• A CPE/CPI approach assumes that all alleles are
present (i.e., cannot handle allele drop-out)
• Thus, statistical analysis of low-level DNA CANNOT be
correctly performed with a CPE/CPI approach because
some alleles may be missing
• Charles Brenner in his AAFS 2011 talk addressed this
issue
• Research is on-going to develop allele drop-out models
and software to enable appropriate calculations
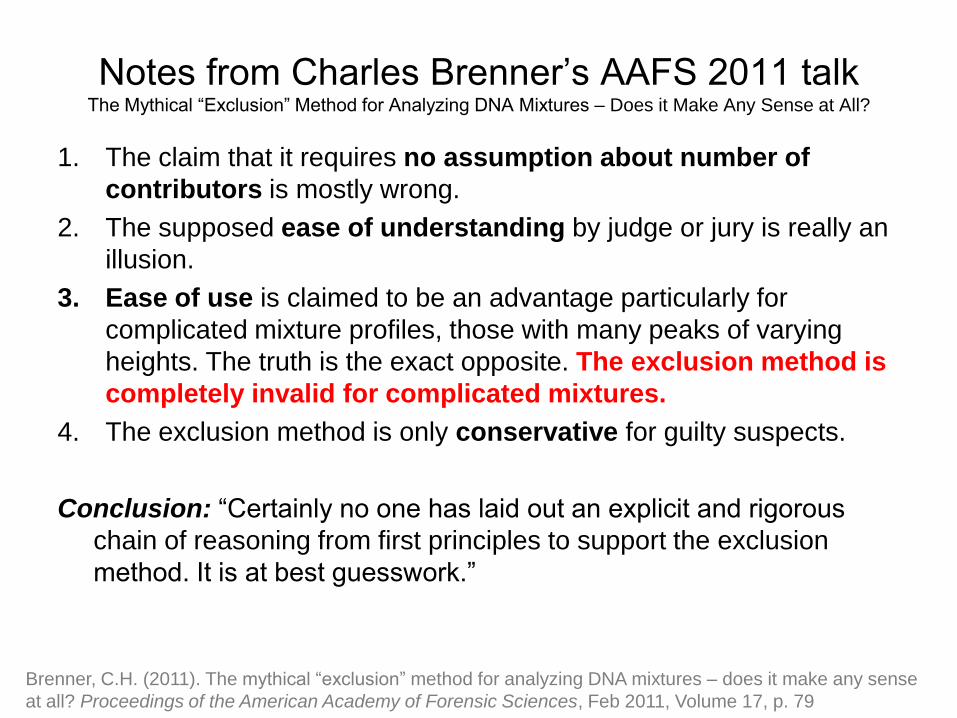
Notes from Charles Brenner’s AAFS 2011 talk The Mythical “Exclusion” Method for Analyzing DNA Mixtures – Does it Make Any Sense at All?
1. The claim that it requires no assumption about number of
contributors is mostly wrong.
2. The supposed ease of understanding by judge or jury is really an
illusion.
3. Ease of use is claimed to be an advantage particularly for
complicated mixture profiles, those with many peaks of varying
heights. The truth is the exact opposite. The exclusion method is
completely invalid for complicated mixtures.
4. The exclusion method is only conservative for guilty suspects.
Conclusion: “Certainly no one has laid out an explicit and rigorous
chain of reasoning from first principles to support the exclusion
method. It is at best guesswork.”
Brenner, C.H. (2011). The mythical “exclusion” method for analyzing DNA mixtures – does it make any sense
at all? Proceedings of the American Academy of Forensic Sciences, Feb 2011, Volume 17, p. 79

DAB Recommendations on Statistics February 23, 2000
Forensic Sci. Comm. 2(3); available on-line at
http://www.fbi.gov/hq/lab/fsc/backissu/july2000/dnastat.htm
“The DAB finds either one or both PE or LR
calculations acceptable and strongly
recommends that one or both calculations be
carried out whenever feasible and a mixture
is indicated”
– Probability of exclusion (PE)
• Devlin, B. (1993) Forensic inference from genetic markers.
Statistical Methods in Medical Research 2: 241–262.
– Likelihood ratios (LR)
• Evett, I. W. and Weir, B. S. (1998) Interpreting DNA Evidence.
Sinauer, Sunderland, Massachusetts.

Section 5.1 Exclusion probability
- Discussion about exclusion probabilities in Paternity cases.
Two types:
(1) Conditional Exclusion Probability - excluding a random man as
a possible father, given the mother-child genotypes for a
particular case.
(2) Average Exclusion Probability – excluding a random man as a
possible father, given a randomly chosen mother-child pair.

Section 5.1 Exclusion probability
“The theoretical concept of exclusion probabilities, however,
makes no sense within the framework of normal mixture models.”
“The interpretation of conditional exclusion probability is obvious,
which accounts for its value in the legal arena. Unlike [LR],
however, it is not fully efficient.”

Problem with
CPI Approach Peak
Allele
Potential
allele loss?
Genotype (allele
pairing)
Contributor
profile(s)
Statistical
Rarity
Q K
Comparison
Report Issued
with conclusions (inclusion, exclusion,
inconclusive)
Artifacts
Stutter
Pull-up
Dye blob
Spike
-A
# of potential
contributors
(if ≥ 2)
Mixture ratio (if ≥ 4:1)
Deconvolution
CPI
Throwing out
information
by not
including
allele pairing
or genotype
combinations
into specific
contributors
Analytical
threshold
Stochastic
threshold
Peak height
ratio threshold
Stutter
threshold
Off-scale data
threshold
CPI deals with
alleles NOT
specific genotype
combinations

It’s the
Genotypes NOT
the Alleles that
matter in mixtures!
J
u
s
t
R
e
m
e
m
b
e
r

What is the meaning of a threshold?
AT
Barely below Barely above Well above
Do these two peaks
have similar levels of
reliability?
These two peaks may differ
by only a few RFUs. Why is
one considered “fine” and
the other “unusable”?

Keep in Mind…
“The use of bounds applied to data that show
continuous variation is common in forensic
science and is often a pragmatic decision.
However it should be borne in mind that
applying such bounds has arbitrary elements to
it and that there will be cases where the data
lie outside these bounds.”
Bright, J.A., et al. (2010). Examination of the variability in mixed DNA profile parameters for the Identifiler
multiplex. Forensic Science International: Genetics, 4, 111-114.

Approaches to Data Interpretation: Binary vs Probabilistic
0
1
Genotype absent
Genotype present
We want our
results to be
black and white
probability
Binary Approach
0
1
Whereas our
reality is 50
shades of grey
(a continuum of
possibilities)
probability
Probabilistic Approach
Adapted from a slide by Peter Gill, Rome meeting, April 27-28, 2012: The hidden side of DNA profiles: artifacts, errors and uncertain evidence

Conference Held in Rome Earlier This Year
htt
p://w
ww
.oic
.it/F
ore
nsic
Ge
ne
tics/im
mag
ini/im
g-h
om
e.jp
g
http://www.oic.it/ForensicGenetics/scientific-programme.php

Bruce Budowle University of North Texas Health Science Center
• “We put thresholds in place to help protect
us from risk of making wrong decisions.
They have value.”
• Compares thresholds to speed limits,
which are set for safety reasons
Rome meeting, April 27-28, 2012: The hidden side of DNA profiles: artifacts, errors and uncertain evidence

Do you leave thresholds and protocols
up to “analysts’ discretion”?
Typical speed limit sign that one
would see at the Montana state line
from December 1995 to June 1999
htt
p:/
/en
.wik
ipe
dia
.org
/wik
i/F
ile:M
ON
TA
NA
-PR
.svg
http://1.bp.blogspot.com/-5gagI4xZbT0/TdvMBGODBZI/AAAAAAAAJYo/Pj9MRqANvvs/s400/speed-limit-change-sign-537.jpg
A Potential Outcome!
http://korsgaardscommentary.blogspot.com/2011/10/its-time-to-put-brakes-on-speed-limit.html

Do you carefully try to regulate everything
with specific protocols?
htt
p:/
/ww
w.lo
str
ep
ub
lic.u
s/a
rch
ive
s/c
ate
go
ry/m
on
eta
ry-p
olicy/p
riva
tize
d-r
oa
ds
Truly a protocol with
specificity…. we even
have an auditor, the
local chief of police!

A variety of approaches exist for how
protocols and thresholds are set…
htt
p:/
/en
.wik
ipe
dia
.org
/wik
i/F
ile
:US
_sp
ee
d_
lim
its.s
vg
http://en.wikipedia.org/wiki/Speed_limits_in_the_United_States

How Speed Limits Are Set? http://www.crab.wa.gov/LibraryData/REPORTS/EngineerAnswers/Article03-04SpeedLimits.pdf
The posted speed limit for a road is set in slightly different
ways in different counties. The most common way though,
is to use the “85th percentile” speed. 85 out of 100
drivers will choose this speed no matter what the signs
say. Many studies have shown this method to be safe,
practical and enforceable. It also doesn’t depend on the
opinion of one person.
The 85th percentile speed is easily determined with special traffic counters that check
the traffic on the roadway. The speed limit can then be set at the next lower 5 miles
per hour. For example, if the traffic counters show 38 mph, the limit would be set at
35 mph. The speed limit may be set another 5 mph lower if there are features not
obvious to the driver. These may include unusual roadside or traffic conditions
including a high number of accidents.

How were the RFU levels set for your
laboratory stochastic threshold? (select only one)
1 2 3 4 5
12%
36%
14%15%
22%
1. +2 SD
2. +3 SD
3. Above all dropout
data
4. My TL established; I
have no idea how
5. We do not use a
stochastic threshold
Data from 121 responses ISHI Mixture Workshop (Oct 2012)

Different approaches to determining
a stochastic threshold
Sonja Klein (CA DOJ) presentation at the CAC meeting (Sacramento, CA), October 25, 2011:
“Approaches to estimating a stochastic threshold”
Results from CA DOJ Identifiler Plus validation experiments
Method 1: tallest false homozygote
Method 2: false homo. ave. +3SD
- 2a: using most relevant input amount
- 2b: using all observed false homo.
Method 3: average PH het. +3 SD
Method 4: ave. PHR -3 SD vs. signal
Method 5: AT divided by minimum
observed PHR
Method 6: partial profile at ~150 pg and
3x AT
Method 7: where majority of PHRs fall
below 60%
Blue bars: 3500 ST
Red bars: 3130 ST
Studied 3 DNA samples with serial dilutions
(1, 0.5, 0.25, 0.125, 0.062, 0.031, 0.016 ng),
multiple amps of each template quantity

PowerPlex 16 HS Stochastic Threshold (ABI 3500 Data)
PowerPlex 16 HS
AVG 365
AVG + 1SD 515
AVG + 2SD 665
AVG + 3SD 810
MAX 935
PCR = 30 cycles
Correct type
= 6,9
AT = 215 RFU
Data from Erica Butts (NIST), ISHI 2011 poster

Limitations of Stochastic Thresholds
• The possibility of allele sharing with a complex mixture
containing many contributors may make a stochastic
threshold meaningless
• “Enhanced interrogation techniques” to increase
sensitivity (e.g., increased PCR cycles) may yield false
homozygotes with >1000 RFU
• New turbo-charged kits with higher sensitivity will
need to be carefully evaluated to avoid allele drop-
out and false homozygotes

If your laboratory uses a stochastic
threshold (ST), it is:
1 2 3 4 5
15%19%
9%
53%
3%
1. Same value as our
analytical threshold
(we don’t use a ST)
2. About twice as high
as our AT (e.g., AT =
50 and ST = 100 RFU)
3. Less than twice as
high as our AT
4. Greater than twice as
high as our AT
5. I don’t know!
Data from 120 responses ISHI Mixture Workshop (Oct 2012)

Last Year’s Response

Stochastic and Analytical Thresholds Impact Lowest Expected Peak Height Ratio
A
T
S
T
The lower you go trying to
analyze low-level data… (i.e.,
more sensitive STR kits)
the worse your expected
peak height ratios for single-
source samples
Therefore, there is greater
uncertainty with associating
genotypes of contributors in
mixtures (or even determining
that you have a mixture)

Drop Out Probability as a Function of
Surviving Sister Allele Peak Height
Setting a Stochastic Threshold is
Essentially Establishing a Risk Assessment
Gill, P., et al. (2009). The low-template (stochastic) threshold-Its determination
relative to risk analysis for national DNA databases. FSI Genetics, 3, 104-111.
With a single peak at 100 RFU, there is
approximately a 7% chance of a sister
heterozygous allele having dropped out
(being below the analytical threshold)
With a single peak at 75 RFU, there is
approximately a 22% chance of a sister
heterozygous allele having dropped out
(being below the analytical threshold)
The position and shape of
this curve may change based
on anything that can impact
peak detection (e.g., CE
injection time, PCR cycle
number, post-PCR cleanup).
“Currently, most laboratories use
an arbitrary stochastic threshold.
When a protocol is changed,
especially if it is made more
sensitive to low-level DNA, then
the stochastic threshold must
also change.” Puch-Solis R, et al. (2011). Practical
determination of the low template DNA threshold.
Forensic Sci. Int. Genet. 5(5): 422-427.
How much error are you willing to accept?

Stochastic Threshold Summary
• A stochastic threshold (ST) may be established for a
specific set of conditions to reflect possibility of allele
drop-out, which is essential for a CPE/CPI stats approach
• ST should be re-examined with different conditions (e.g.,
higher injection, sample desalting, increase in PCR
cycles)
• ST will be dependent on the analytical threshold set with
a method and impacts the lowest expected peak height
ratio
• Assumptions of the number of contributors is key to
correct application of ST

Coupling of Statistics and Interpretation
• The CPE/CPI approach for reporting an inclusionary
statistic requires that all alleles be observed in the
evidence sample
• If allele drop-out is suspected at a locus, then any allele
is possible and the probability of inclusion goes to 100%
-- in other words, the locus is effectively dropped from
consideration for statistical purposes
• If alleles are seen below the established stochastic
threshold, then the locus is typically eliminated (“INC” –
declared inconclusive) in many current lab SOPs

Impact of Dropping Loci
• The less data available for comparison
purposes, the greater the chance of falsely
including someone who is truly innocent
• Are you then being “conservative” (i.e., erring in
favor of the defendant)?

Can This Locus Be Used
for Statistical Calculations?
AT
ST It depends on your assumption
as to the number of contributors!
If you assume a single-source sample,
then you can assume that the detection
of two alleles fully represents the
heterozygous genotype present at this
locus.
If you assume (from examining other loci in
the profile as a whole) that the sample is a
mixture of two or more contributors, then
there may be allele drop-out and all alleles
may not be fully represented.

Likelihood Ratio (LR)
• Provides ability to express and evaluate both the prosecution
hypothesis, Hp (the suspect is the perpetrator) and the defense
hypothesis, Hd (an unknown individual with a matching profile is the
perpetrator)
• The numerator, Hp, is usually 1 – since in theory the prosecution
would only prosecute the suspect if they are 100% certain he/she is
the perpetrator
• The denominator, Hd, is typically the profile frequency in a particular
population (based on individual allele frequencies and assuming
HWE) – i.e., the random match probability
)|Pr(
)|Pr(
d
p
HE
HELR

Take Home Messages
• Inclusionary statements (including “cannot exclude”)
need statistical support to reflect the relevant weight-of-
evidence
• Stochastic thresholds are necessary if using CPI
statistics to help identify possible allele dropout
• CPI is only conservative for guilty suspects as this
approach does a poor job of excluding the innocent
• Uncertainty exists in scientific measurements and
increases with complex mixtures (low level DNA and/or
>2 contributors)
• An increasing number of poor samples are being
submitted to labs – labs may benefit from developing a
complexity threshold

President John F. Kennedy Yale University commencement address (June 11, 1962)
“For the greatest enemy of truth is very often not the lie – deliberate, contrived and dishonest – but the myth – persistent, persuasive, and unrealistic. Too often we hold fast to the clichés of our forebears. We subject all facts to a prefabricated set of interpretations. We enjoy the comfort of opinion without the discomfort of thought.”
http://www.jfklibrary.org/Research/Ready-Reference/Kennedy-Library-Miscellaneous-Information/Yale-University-Commencement-Address.aspx

Thanks to NIJ for Support of BU and NIST
• NIJ Forensic Science Training Development and
Delivery Program Grant # 2008-DN-BX-K158, awarded to Biomedical Forensic Science Program at
Boston University School of Medicine
• NIJ has an Interagency Agreement (IAA) with
the NIST Office of Law Enforcement Standards
(OLES)
Applied Genetics


