
1
Dietary patterns and the risk of cardiovascular disease and all-cause mortality in older
British men
Janice L Atkins12, Peter H Whincup3, Richard W Morris4, Lucy T Lennon1, Olia Papacosta1, S
Goya Wannamethee1
1Department of Primary Care and Population Health, University College London, UK2Epidemiology and Public Health Group, University of Exeter Medical School, RILD
Building, Barrack Road, Exeter, EX2 5DW, UK3Population Health Research Centre, Division of Population Health Sciences and Education,
St George’s, University of London, UK 4School of Social and Community Medicine, University of Bristol, UK
Correspondence: JL Atkins, Epidemiology and Public Health Group, University of Exeter
Medical School, RILD Building, Barrack Road, Exeter, EX2 5DW, UK . E-mail:
Running head: Diet patterns, CVD and mortality in older men
Key words: a posteriori dietary patterns; Cardiovascular disease; Mortality; Older adults;
Principal component analysis
1
2
3
4
5
6
7
8
9
10
11
12
13
14
15
16
17
18
19
20
21
2
ABSTRACT
Dietary patterns are a major risk factor for cardiovascular morbidity and mortality, but few
studies have examined this relationship in older adults. We examined prospective
associations between dietary patterns and the risk of CVD and all-cause mortality in 3226
older British men, aged 60-79 years and free from CVD at baseline, from the British
Regional Heart Study. Baseline food frequency questionnaire data were used to generate 34
food groups. Principal component analysis identified dietary patterns which were categorised
into quartiles, with higher quartiles representing higher adherence to the dietary pattern. Cox
proportional hazards examined associations between dietary patterns and risk of all-cause
mortality and cardiovascular outcomes. Three interpretable dietary patterns were identified:
‘high fat/low fibre’ (high in red meat, meat products, white bread, fried potato, eggs),
‘prudent’ (high in poultry, fish, fruit, vegetables, legumes, pasta, rice, wholemeal bread, eggs,
olive oil) and ‘high sugar’ (high in biscuits, puddings, chocolate, sweets, sweet spreads,
breakfast cereal). During 11 years of follow-up, 899 deaths, 316 CVD deaths, 569 CVD
events and 301 coronary heart disease (CHD) events occurred. The ‘high fat/low fibre’
dietary pattern was associated with an increased risk of all-cause mortality only, after
adjustment for confounders (highest vs. lowest quartile; HR:1.44, 95% CI:1.13-1.84).
Adherence to a ‘high sugar’ diet was associated with a borderline significant trend for an
increased risk of CVD and CHD events. The ‘prudent’ diet did not show a significant trend
with cardiovascular outcomes or mortality. Avoiding ‘high fat/low fibre’ and ‘high sugar’
dietary components may reduce the risk of cardiovascular events and all-cause mortality in
older adults.
22
23
24
25
26
27
28
29
30
31
32
33
34
35
36
37
38
39
40
41
42
43

3
INTRODUCTION
Diet is a well-established major modifiable risk factor for cardiovascular morbidity and
mortality and may be particularly important in older adults, who are at higher risk of chronic
disease1-4. Historically, studies investigating the associations between diet and risk of CVD or
mortality have focused on single foods items or specific dietary nutrients3-5 but more recently
research has tended to focus on overall dietary patterns to reflect the complex
multidimensional nature of diets consumed in the population and to examine the combined
effects of the consumption of various foods/nutrients6-8. Two main approaches have been
developed to assess dietary patterns: (1) A priori approaches, which are hypothesis oriented
or theoretically defined, since they use available scientific evidence to generate predefined
dietary scores or indexes based on dietary recommendations or guidelines; and (2) A
posteriori approaches, which are data-driven or exploratory, since dietary patterns are derived
from the available data based on methods such as principal component analysis or cluster
analysis7,9. However, few studies have examined the relationships between dietary patterns
and morbidity or mortality in older adults specifically10,11.
We have previously applied a priori diet quality scores to the British Regional Heart Study
(BRHS), showing that older men with higher adherence to the Elderly Dietary Index (a
modified Mediterranean diet score) were at lower risk of CVD and all-cause mortality12.
However, compared to a priori dietary patterns, a posteriori methods of defining dietary
patterns have the advantage of not making any prior assumptions or hypotheses but use the
existing data to characterize total diet, so that patterns describe the eating behavior of a
population9. Principal component analysis is one common method of deriving a posteriori
dietary patterns and is a data-reduction technique, which identifies foods that are frequently
consumed together and aggregates food items or groups on the basis of the degree of
correlation with one another7,9. It has been suggested that principal component analysis may
generate more meaningful and interpretable dietary patterns than cluster analysis (an
alternative a posteriori method which separates individuals into mutually exclusive groups
based on differences in dietary intake) as it has higher statistical power, and is less influenced
by extreme values8,13.
Defining dietary patterns a posteriori has typically identified two major types of patterns –
healthy (`prudent’) and unhealthy (`Western’) diets13-15. Healthy/prudent dietary patterns have
44
45
46
47
48
49
50
51
52
53
54
55
56
57
58
59
60
61
62
63
64
65
66
67
68
69
70
71
72
73
74
75
76

4
tended to show inverse associations with CVD and mortality risk13-15, whereas
unhealthy/Western patterns have either shown positive associations or no significant
association at all13-16. Although the relationship between a posteriori defined dietary patterns
and the risk of CVD and mortality has been examined in middle-aged populations, few
studies have been in older adults in particular17, with a particular paucity of studies in older
British populations16. The aim of this study was therefore to examine the prospective
associations between a posteriori dietary patterns, defined using principal component
analysis, and the risk of CVD and mortality in a cohort of older British men.
METHODS
Subjects and methods of data collection
The British Regional Heart Study (BRHS) is a prospective study of cardiovascular disease, in
a socioeconomically and geographically representative sample of 7735 British men, selected
from 24 towns across Great Britain18,19. The cohort was initially examined in 1978-80 and is
predominantly of white European ethnic origin (> 99%). This study used data from the 20
year re-examination of BRHS participants in 1998-2000, aged 60-79 years20. 4252 men (77%
of survivors) completed a questionnaire answering questions on their lifestyle and medical
history, completed a food frequency questionnaire (FFQ), attended a physical examination
and provided a fasting blood sample. Of the 4252 men attending the physical examination,
723 men with prevalent heart failure, myocardial infarction (MI) or stroke at baseline were
excluded (based on a previous diagnosis, according to self-report), leaving 3529 participants
for inclusion in this study. Participants were followed-up for morbidity and mortality until
2010. All participants provided written informed consent, in accordance with the Declaration
of Helsinki, and ethical approval was also obtained from relevant local research ethics
committees.
Dietary assessment
Baseline dietary intake was measured in 1998-2000 with a self-administered postal food
frequency questionnaire (FFQ), which was developed for use in the World Health
Organization’s Monitoring Trends and Determinants in Cardiovascular Disease Survey21. The
77
78
79
80
81
82
83
84
85
86
87
88
89
90
91
92
93
94
95
96
97
98
99
100
101
102
103
104
105
106
107

5
FFQ has been validated against weighed food intake in British populations and statistically
significant correlation coefficients were observed between methods for all main nutrients of
between 0.27 (total carbohydrate) and 0.75 (alcohol)22,23. Participants reported they usually
consumed 86 different food and drink items per week, which were reported in nine
categories: 1, 2, 3, 4, 5, 6, or 7 days per week, monthly, or rarely/never. A validated
computer program was used to calculate the total macronutrient and micronutrient intakes of
all foods reported as consumed in the FFQ, and hence the total energy intake24. This computer
program multiplied the food frequency by the standard portion sizes for each food, and by the
nutrient composition of the food obtained from the UK food composition tables25. The
distribution of total energy intakes was checked for any extreme values. However, all were
within a range compatible with a normal lifestyle (500-8000 kcal/day in men26) so no
exclusions were made on this basis.
The 86 food items in the FFQ were aggregated into 34 mutually exclusive food groups, on
the basis of the similarity of food types and nutrient composition; these were comparable to
food groups used previously for a national representative dietary survey of British adults27.
Individual food items were summed to generate a total score for each of the 34 food groups.
The food groups were generated if at least one of the food items within the group was not
missing. A list of these 34 food groups generated from the FFQ, together with their units of
measurement and range, is shown in Supplementary Table 1. Of the 3529 participants who
attended the twenty year re-examination and were free from prevalent heart failure, MI or
stroke, 303 participants with missing data on any of the 34 food groups were excluded.
However, the 303 participants with missing food group data were not significantly different
from the 3226 included participants in respect to diet quality (age-adjusted OR: 0.82, 95% CI:
0.56-1.22, p=0.34; for difference in the proportion consuming fruit and vegetable daily) or
CVD event risk (age-adjusted HR: 1.00, 95% CI: 0.77-1.31, p=0.98).
Principal component analysis
Principal component analysis was conducted using orthogonal varimax rotation on the 34
food groups generated from the FFQ, in order to identify dietary patterns. Principal
component analysis was performed in Stata 13.1 (Stata Corp., College Station, Texas), using
a correlation matrix which transformed the input variables (food groups) to z scores28, to
108
109
110
111
112
113
114
115
116
117
118
119
120
121
122
123
124
125
126
127
128
129
130
131
132
133
134
135
136
137
138
139

6
account for the different scales of measurement of the food groups used. Three principal
components were retained based on having an eigenvalue greater than one, the scree plot of
eigenvalues and the interpretability of the rotated factors29. Food groups with factor loading
of more than 0.20 or less than -0.20 were considered to be important contributors to the
dietary pattern, based on cut-offs used in previous research30. The factors scores for each
dietary pattern were calculated for each participant by summing the intakes of the food
groups weighted by their factor loadings. The higher the score, the closer the diet to the
dietary pattern and the lower the score, the further the diet from the dietary pattern.
Participants were then classified into quartiles of adherence to each of the three major dietary
patterns, with higher quartiles representing higher adherence to the dietary pattern.
Covariates
Measures of cigarette smoking, physical activity and alcohol intake were self-reported via
questionnaire at the twenty year examination in 1998-200, as described31-33. Participants were
classified into four cigarette smoking groups (never smoked; long-term ex-smokers, > 15
years; recent ex-smokers, ≤ 15 years; current smokers)31. Current physical activity was
classified into six groups based on intensity and frequency of exercise (inactive; occasional;
light; moderate; moderately vigorous; vigorous)32. Alcohol intake was classified into five
groups based on the number and frequency of alcoholic drinks consumed per week (none;
occasional; light; moderate; heavy)33. Social class was measured using the baseline
questionnaire in 1978-80, based on the longest held occupation coded using the Registrar
General’s occupational classification34. Participants were classified as manual, non-manual or
armed forces. Systolic blood pressure (SBP), height and weight were assessed at the physical
examination in 1998-2000. BMI was calculated and participants were classified into four
categories using WHO cut-points (underweight, <18.5 kg/m2; normal weight, 18.5-24.99
kg/m2; overweight, 25-29.99 kg/m2; obese, ≥30 kg/m2)35. Blood samples were taken at the
twenty year re-examination in 1998-2000 which allowed measurement of the plasma
concentration of high density lipoprotein (HDL) and glucose, and two emerging
cardiovascular risk factors: C-reactive protein (CRP), a marker of inflammation, was assayed
by ultrasensitive nephelometry and von Willebrand factor (vWF), a marker of endothelial
dysfunction, was measured with enzyme linked immunosorbent assays32. In addition, at the
twenty year examination, participants were classified as having prevalent diabetes if they had
140
141
142
143
144
145
146
147
148
149
150
151
152
153
154
155
156
157
158
159
160
161
162
163
164
165
166
167
168
169
170
171

7
a previous diagnosis, according to self-report. Complete case analysis was used to deal with
any missing covariates.
Follow-up and outcome ascertainment
Participants were prospectively followed for cardiovascular mortality and morbidity from re-
examination in 1998-2000 through to June 2010 and follow-up was achieved for 98% of the
cohort36. Information on deaths was collected through National Health Service Central
Register (death certificates coded using International Classification of Diseases, ninth
revision [ICD-9]). Evidence regarding nonfatal events was obtained by on-going reports from
general practitioners and by biennial reviews of the patients’ medical records20. The four
outcomes examined in this study were: CHD events (diagnosis of fatal or nonfatal myocardial
infarction, MI [ICD-9 codes 410-414]); CVD events (diagnosis of nonfatal MI [ICD-9 codes
410-414], nonfatal stroke [ICD-9 codes 430-438] or fatal CVD [ICD-9 codes 390-459]);
CVD mortality (ICD-9 codes 390-459) and all-cause mortality. Participants were censored at
date of death or at the end of the study period (June 2010).
Statistical analysis
Baseline characteristics of participants were presented by quartiles of the distribution of the
three dietary patterns. The distribution of CRP was highly skewed and was log transformed.
Cox proportional hazards regression models were fitted to assess the association between
quartiles of adherence to dietary patterns and the risk of all-cause mortality, CVD mortality,
CVD events and CHD events. Tests for trend of risk of outcomes across quartiles of dietary
patterns were performed. All Cox models were tested for the proportional-hazards
assumption, on the basis of Schoenfeld residuals, which was not found to be violated.
Multivariable models were adjusted for potential confounders in a sequential manner,
including age (model 1), energy intake, smoking status, alcohol intake, physical activity,
social class and BMI (model 2), HDL, SBP and diabetes (model 3) and CRP and vWF (model
4). Age, energy intake, HDL-C, SBP, CRP and vWF were fitted as continuous variables.
Smoking status, alcohol intake, physical activity, social class, BMI and diabetes were fitted
as categorical variables. All statistical analyses were performed in Stata 13.1 (Stata Corp.,
College Station, Texas).
172
173
174
175
176
177
178
179
180
181
182
183
184
185
186
187
188
189
190
191
192
193
194
195
196
197
198
199
200
201
202
203
8
RESULTS
Analyses are based on 3226 men, aged 60-79 years, who attended the 20 year re-examination,
were free from prevalent heart failure, MI and stroke at baseline, and provided information on
the 34 food groups. Three interpretable a posteriori dietary patterns identified by principal
component analysis explained 20.8% of the total variance in diet. Supplementary Table 2
shows the food group factor loadings for each of the three dietary patterns. The dietary
pattern defined by the first principal component was labeled ‘high fat/low fibre’ and
explained 7.9% of the total variance. This dietary pattern was characterised by a high
consumption of red meat, meat products, fried potato, white bread, eggs and beer (positive
scoring coefficients) and a low intake of wholemeal bread (negative scoring coefficients).
The second principal component reflected a ‘prudent’ diet, explaining 7.1% of the variance,
and was characterised by a high consumption of poultry, fish, vegetables, legumes, fruit,
pasta and rice, wholemeal bread, eggs, sauces, soups and olive oil (positive scoring
coefficients). The third principal component reflected a ‘high sugar’ diet, and explained 5.8%
of the total variance. This dietary pattern was characterised by a high consumption of
breakfast cereal, full-fat cheese, biscuits, puddings, chocolate, sweets and sweet spreads
(positive scoring coefficients) and a low consumption of beer (negative scoring coefficients).
Adherence to the ‘high fat/low fibre’ dietary pattern showed a strong positive association
with current smoking, heavy drinking, physical inactivity, manual social class, obesity, total
energy intake, CRP and vWF and an inverse associations with HDL. The prevalence of
diabetes was also inversely associated with the ‘high fat/low fibre’ dietary pattern, which was
an unexpected finding and may be an example of dietary change, secondary to the
development of illness (Table 1). Adherence to the ‘prudent’ pattern was strongly inversely
associated with age, current smoking, physical inactivity, manual social class, CRP and vWF,
and positively associated with HDL and diabetes (Table 2).
Contrary to expectations, in unadjusted analyses several behavioural variables (current
smoking, heavy drinking and physical inactivity) and obesity were inversely associated with
adherence to a ‘high sugar’ dietary pattern (Table 3). To test whether the observed inverse
204
205
206
207
208
209
210
211
212
213
214
215
216
217
218
219
220
221
222
223
224
225
226
227
228
229
230
231
232
233
234

9
association between manual social class and a ‘high sugar’ diet could explain this, analyses
were stratified into manual and non-manual occupational social class but the inverse
associations between a ‘high sugar’ diet and adverse behavioural risk factors and obesity
were still apparent within both groups (data not presented). Men in the highest quartile of the
‘high sugar’ diet also had the lowest proportion of obese individuals and it is therefore
possible that obese men had made changes to their diet to reduce sugar intake. However,
when analyses were stratified into obese and non-obese participants, inverse associations
between a ‘high sugar’ diet and adverse behavioural risk factors remained in both groups.
Adherence to the ‘high sugar’ diet was also significantly associated with age and intake of
total energy and inversely associated with prevalent diabetes, glucose, HDL and CRP but not
significantly associated with SBP or vWF.
There were a total of 899 deaths, 316 CVD deaths, 569 CVD events and 301 CHD events
during a mean period of 11.3 years of follow-up. A ‘high fat/low fibre’ dietary pattern was
associated with a graded increase in all-cause mortality risk. Although attenuated slightly,
this association remained after adjustment for socio-demographic, behavioural and
cardiovascular risk factors, with a 44% increase in risk in the highest compared to the lowest
quartile of adherence to the ‘high fat/low fibre’ pattern (HR: 1.44, 95% CI: 1.13-1.84, p-
trend: 0.007). In age-adjusted analysis, participants in the highest quartile of the ‘high fat/low
fibre’ dietary pattern had an increased risk of CVD mortality with a significant trend (p =
0.002) and incident CVD events with a borderline significant trend (p = 0.06). However,
these trends disappeared after adjustment for energy intake, smoking, alcohol, physical
activity, social class and BMI. No significant trends were seen between the ‘high fat/low
fibre’ dietary pattern and risk of incident CHD events (Table 4).
Adherence to the ‘prudent’ dietary pattern was associated with a significant graded decrease
in risk of all-cause mortality across quartiles (p trend = 0.001). However, after adjustment for
socio-demographic, behavioural and cardiovascular risk factors (model 4) HRs was
attenuated slightly but men in the second quartile of the ‘prudent’ diet still had a significantly
decreased risk of all-cause mortality (second vs. first quartile; HR: 0.77, 95% CI: 0.63-0.95),
although the trend across quartiles was not significant (p-trend = 0.28). Similar associations
were observed with CVD mortality; in the fully adjusted model, men in second quartile of
235
236
237
238
239
240
241
242
243
244
245
246
247
248
249
250
251
252
253
254
255
256
257
258
259
260
261
262
263
264
265
266

10
adherence to a ‘prudent’ diet had a lower risk but the trend across quartiles was not
significant (second vs. first quartile; HR: 0.68, 95% CI: 0.47-0.98, p-trend: 0.74). No
significant associations were seen between quartiles of a ‘prudent’ diet and the risk of either
incident CVD events or incident CHD events (Table 5).
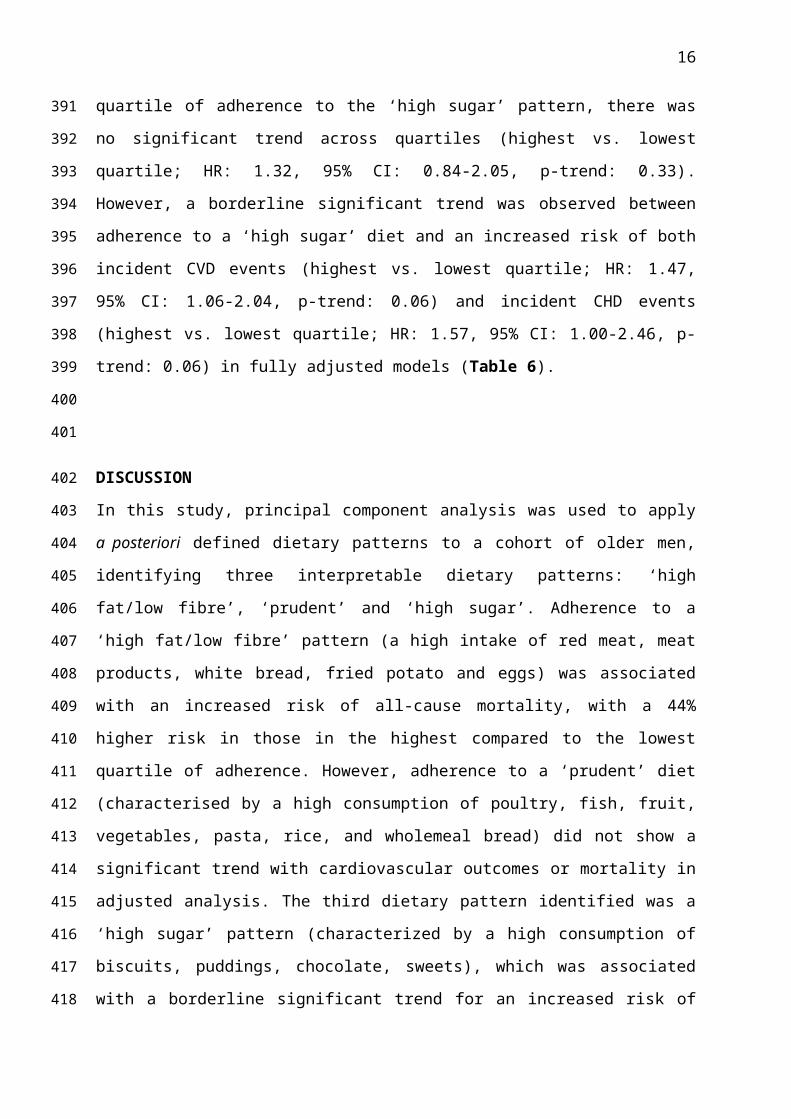
Adherence to a ‘high sugar’ dietary pattern was not significantly associated with all-cause-
mortality (highest vs. lowest quartile; HR: 1.00, 95% CI: 0.77-1.29, p-trend: 0.71) in models
adjusted for cardiovascular risk factors (model 4). Although risk of CVD mortality was
increased in men in the top quartile of adherence to the ‘high sugar’ pattern, there was no
significant trend across quartiles (highest vs. lowest quartile; HR: 1.32, 95% CI: 0.84-2.05, p-
trend: 0.33). However, a borderline significant trend was observed between adherence to a
‘high sugar’ diet and an increased risk of both incident CVD events (highest vs. lowest
quartile; HR: 1.47, 95% CI: 1.06-2.04, p-trend: 0.06) and incident CHD events (highest vs.
lowest quartile; HR: 1.57, 95% CI: 1.00-2.46, p-trend: 0.06) in fully adjusted models (Table
6).
DISCUSSION
In this study, principal component analysis was used to apply a posteriori defined dietary
patterns to a cohort of older men, identifying three interpretable dietary patterns: ‘high
fat/low fibre’, ‘prudent’ and ‘high sugar’. Adherence to a ‘high fat/low fibre’ pattern (a high
intake of red meat, meat products, white bread, fried potato and eggs) was associated with an
increased risk of all-cause mortality, with a 44% higher risk in those in the highest compared
to the lowest quartile of adherence. However, adherence to a ‘prudent’ diet (characterised by
a high consumption of poultry, fish, fruit, vegetables, pasta, rice, and wholemeal bread) did
not show a significant trend with cardiovascular outcomes or mortality in adjusted analysis.
The third dietary pattern identified was a ‘high sugar’ pattern (characterized by a high
consumption of biscuits, puddings, chocolate, sweets), which was associated with a
borderline significant trend for an increased risk of CVD events and CHD events in fully
adjusted models. This study adds to the limited literature describing a posteriori dietary
patterns and assessing associations with the risk of CVD and mortality in older British adults.
267
268
269
270
271
272
273
274
275
276
277
278
279
280
281
282
283
284
285
286
287
288
289
290
291
292
293
294
295
296
297
298

11
The dietary patterns which emerged in this study are consistent with those reported in
previous studies using principal component analysis, which have typically identified two
major types of dietary patterns, an unhealthy/Western diet and a healthy/prudent diet13-15. The
Hertfordshire Cohort Study, comprising older British adults aged 59 to 73 years, identified
very similar dietary patterns (prudent and traditional)37 to those identified in this study. In this
previous study, the prudent diet (high in consumption of fruit, vegetables, oily fish and
wholemeal cereals) is comparable to the ‘prudent’ diet observed in this cohort and adherence
was also associated with non-manual social class and being a non-smoker. The traditional
diet (high in consumption of vegetables, processed and red meat, fish and puddings) had
similarities with the ‘high fat/low fibre’ diet in this cohort and was also associated with
higher alcohol consumption. The three dietary patterns identified in this study together
explained ~21% of the total variance in the dietary data. Although this proportion of variance
seems low, this is actually greater than the variance explained by a comparable study in older
British adults, aged 65 years and over, which identified four interpretable principal
components from the National Diet and Nutrition Survey data, explaining 9.8% of the total
variance16.
Results in this study showed a significant graded association between adherence to a ‘high
fat/low fibre’ dietary pattern and an increased risk of all-cause mortality. These results are
consistent with studies showing that fibre intake and all-cause mortality are inversely
associated38 and that the consumption of red meat and processed meat (two components of
the ‘high fat/low fibre’ dietary patterns with high factor loadings) is associated with an
increased risk of all-cause and cancer mortality39,40. Adherence to a ‘prudent’ diet was
associated with a non-significantly reduced risk of all-cause mortality; there was also no
significant trend between a ‘high sugar’ diet and the risk of all-cause mortality. None of the
three dietary patterns described here were associated with CVD mortality. A comparable
study of an older British population, aged 65 years and older, from the National Diet and
Nutrition Survey, identified four interpretable diet patterns using principal component
analysis: ‘Mediterranean–style’, ‘health aware’, ‘traditional’ and ‘sweet and fat’. Only the
Mediterranean–style dietary pattern was associated with a reduced risk of all-cause mortality,
with an 18% reduction in risk in those in the highest compared to the lowest tertile16.
However, in men only, the traditional diet was also a risk factor for mortality, similar to the
‘high fat/low fibre’ results observed in this cohort.
299
300
301
302
303
304
305
306
307
308
309
310
311
312
313
314
315
316
317
318
319
320
321
322
323
324
325
326
327
328
329
330
331
12
A recent meta-analysis of 13 prospective studies involving 338,787 participants examined the
association between dietary patterns defined by principal component analysis and risk of all-
cause and CVD mortality14. Summary relative risk estimates (SRREs) showed a significant
inverse association between a prudent/healthy dietary pattern and all-cause mortality (highest
vs. lowest category of dietary pattern score; SRRE: 0.76, 95% CI: 0.68-0.86) and CVD
mortality (SRRE: 0.81, 95% CI: 0.75-0.87) but non-significant associations between the
Western/unhealthy dietary pattern and all-cause mortality (SRRE: 1.07, 95% CI: 0.96-1.20)
and CVD mortality (SRRE: 0.99, 95% CI: 0.91-1.08). The risk estimates observed in the
present study for the association between a prudent diet and a lower risk of all-cause
mortality and CVD mortality were in the same direction, and of similar magnitudes, as those
in the meta-analysis but statistically non-significant. Also, a significant association was
observed in the present study between higher adherence to an unhealthy diet (the ‘high
fat/low fibre’ diet) and a higher risk of all-cause mortality which was not seen in the meta-
analysis. These discrepancies may have been due to the much bigger sample size in the meta-
analysis giving greater power to detect smaller effects or due to the differences in confounder
adjustments; few studies included in this meta-analysis had such a comprehensive adjustment
for established and emerging cardiovascular risk factors as were included in this study.
This study found no significant association between a ‘high fat/low fibre’ diet or a ‘prudent’
diet and the risk of CVD events or CHD events, but adherence to a ‘high sugar’ diet was
associated with a borderline significant trend for an increased risk of CVD events and CHD
events in fully adjusted models. These results are in keeping with the American Heart
Association recommendation of reducing dietary intake of added sugars in order to lower the
risk of cardiovascular disease41 and the recent suggestion that sugar may be a more important
risk factor than fat for cardiovascular disease42,43. A meta-analysis of 12 prospective studies
involving 409,780 participants examined the association between principal component
analysis defined dietary patterns and CHD risk. Summary relative risks showed an inverse
association between the prudent/healthy diet and CHD risk, but no association with the
Western/unhealthy diet15. The observed association between a healthy diet and CHD events in
this meta-analysis but not in the current study may again possibly be explained by the much
larger sample size in the meta-analysis giving greater power to detect smaller effects. This
332
333
334
335
336
337
338
339
340
341
342
343
344
345
346
347
348
349
350
351
352
353
354
355
356
357
358
359
360
361
362
363

13
meta-analysis did not identify any studies from the UK specifically and did not mention high
sugar/sweet dietary patterns, as observed in this cohort. Results from this study may therefore
be the first study of principal component analysis defined dietary patterns and CHD risk in
the UK, and this study has shown that a high sugar dietary pattern may increase CHD and
CVD risk in older British men. These analyses should therefore be replicated in other older
adult cohorts.
A major strength of this study is that data are from a moderately large prospective
population-based study, with negligible loss to follow-up and objective ascertainment of
CVD and mortality outcomes20,36. However, the study comprised predominately white
European older male participants so the applicability of findings to women and non-white
ethnic groups is uncertain. Dietary intake was assessed using an FFQ, which has previously
been validated against weighed food intakes in British populations 22,23 and the dietary intake
of participants was broadly comparable with those from the National Diet and Nutrition
Survey44. However, FFQs are more prone to measurement error compared to some other
dietary measures and in older populations non-response to FFQ questions could have
increased the chance of dietary under-reporting45,46. However, no significance difference was
seen in participants with and without complete food group data in terms of diet quality,
assessed by daily fruit and vegetable intake, or the risk of CVD events. Another consideration
in this study is that the FFQ measured dietary intake at baseline only, so whether dietary
patterns of participants changed throughout follow-up was unknown. It is possible reverse
causation may have existed in this study; for example diabetics may have changed their
dietary patterns following diagnosis and this may explain the unexpected inverse association
observed between prevalent diabetes at baseline and the high fat/low fibre dietary pattern.
However, such effects are only likely to have biased prospective associations between dietary
patterns and outcomes towards the null.
A posteriori methods of defining dietary patterns have the advantage over using a priori
methods, of making no prior assumptions about dietary patterns, instead using an empirical,
data-driven approach to derive typical patterns of dietary intake9. However, data on the
reproducibility and validity of principal component method is limited47-49 and subjectivity
was introduced at various points in the analysis, such as the grouping of dietary variables and
364
365
366
367
368
369
370
371
372
373
374
375
376
377
378
379
380
381
382
383
384
385
386
387
388
389
390
391
392
393
394
395
14
the choice of how many components to retain, which may have influenced the observed
associations with disease risk9,29,30. However the food groups used here were comparable to
those used previously for a national representative dietary survey of British adults 27 and
criteria for deciding how many components to retain was decided in advance of the analysis,
both of which helped to reduce this bias.
Dietary patterns persist as an important risk factor for CVD and all-cause mortality in the
elderly, with higher adherence to a ‘high fat/low fibre’ dietary pattern being associated with
an increased risk of all-cause mortality, and higher adherence to a ‘high sugar’ diet being
associated with a modest increase in risk of CVD events and CHD events, which could not be
explained by adjustment for cardiovascular risk factors. The ‘prudent’ diet was not
significantly associated with cardiovascular outcomes or mortality. Adopting a diet which
avoids ‘high fat/low fibre’ and ‘high sugar’ components may reduce the risk of
cardiovascular events and all-cause mortality in older adults.
FINANCIAL SUPPORT
The British Regional Heart Study is a British Heart Foundation Research Group. This work
was carried out by JLA whilst at University College London, funded by a PhD studentship
from the National Institute for Health Research School for Primary Care Research (NIHR
SPCR). The views expressed in this study are those of the authors and not necessarily those
of the funding bodies.
CONFLICT OF INTEREST
None.
AUTHORSHIP
JLA and SGW conceived the study concept and design; JLA performed statistical analysis
and drafted the manuscript; PHW and LTL planned the data collection and OP contributed to
the analysis of the data; PHW, RWM and SGW contributed to the interpretation of the data
396
397
398
399
400
401
402
403
404
405
406
407
408
409
410
411
412
413
414
415
416
417
418
419
420
421
422
423
424
425
426
427

15
and writing the manuscript; PHW, RWM, LTL, OP and SGW critically reviewed and agreed the final content of the manuscript.
428
429
16
REFERENCES
1. World Health Organization. Global Atlas on cardiovascular disease prevention and control. Geneva: World Health Organization, 2011.
2. World Health Organization. Diet, nutrition and the prevention of chronic disease. Joint WHO/FAO Expert Consultation. WHO Technical Report Series, No 916. Geneva: WHO, 2003.
3. Bhupathiraju SN, Tucker KL. Coronary heart disease prevention: nutrients, foods, and dietary patterns. Clin Chim Acta 2011;412(17-18):1493-514.
4. Mente A, de Koning L, Shannon HS, et al. A systematic review of the evidence supporting a causal link between dietary factors and coronary heart disease. Arch Intern Med 2009;169(7):659-69.
5. Verschuren WM. Diet and cardiovascular disease. Curr Cardiol Rep 2012;14(6):701-8.
6. Hu FB. Dietary pattern analysis: a new direction in nutritional epidemiology. Curr Opin Lipidol 2002;13(1):3-9.
7. Schulze MB, Hoffmann K. Methodological approaches to study dietary patterns in relation to risk of coronary heart disease and stroke. Br J Nutr 2006;95(5):860-9.
8. Kant AK. Dietary patterns and health outcomes. J Am Diet Assoc 2004;104(4):615-35.
9. Moeller SM, Reedy J, Millen AE, et al. Dietary patterns: Challenges and opportunities in dietary patterns research: An Experimental Biology workshop, April 1, 2006. J Am Diet Assoc 2007;107(7):1233-9.
10. Tourlouki E, Matalas AL, Panagiotakos DB. Dietary habits and cardiovascular disease risk in middle-aged and elderly populations: a review of evidence. Clin Interv Aging 2009;4:319-30.
11. Roman B, Carta L, Martinez-Gonzalez MA, et al. Effectiveness of the Mediterranean diet in the elderly. Clin Interv Aging 2008;3(1):97-109.
12. Atkins JL, Whincup PH, Morris RW, et al. High diet quality is associated with a lower risk of cardiovascular disease and all-cause mortality in older men. J Nutr 2014;144(5):673-80.
13. Newby PK, Tucker KL. Empirically derived eating patterns using factor or cluster analysis: a review. Nutr Rev 2004;62(5):177-203.
14. Li F, Hou LN, Chen W, et al. Associations of dietary patterns with the risk of all-cause, CVD and stroke mortality: a meta-analysis of prospective cohort studies. Br J Nutr 2014;113(1):16-24.
15. Hou L, Li F, Wang Y, et al. Association between dietary patterns and coronary heart disease: a meta-analysis of prospective cohort studies. Int J Clin Exp Med 2015;8(1):781-90.
16. Hamer M, McNaughton SA, Bates CJ, et al. Dietary patterns, assessed from a weighed food record, and survival among elderly participants from the United Kingdom. Eur J Clin Nutr 2010;64(8):853-61.
17. Bamia C, Orfanos P, Ferrari P, et al. Dietary patterns among older Europeans: the EPIC-Elderly study. Br J Nutr 2005;94(1):100-13.
18. Shaper AG, Pocock SJ, Walker M, et al. British Regional Heart Study: cardiovascular risk factors in middle-aged men in 24 towns. Br Med J (Clin Res Ed) 1981;283(6285):179-86.
430
431432433434435436437438439440441442443444445446447448449450451452453454455456457458459460461462463464465466467468469470471472473474475476

17
19. Lennon LT, Ramsay SE, Papacosta O, et al. Cohort Profile Update: The British Regional Heart Study 1978-2014: 35 years follow-up of cardiovascular disease and ageing. Int J Epidemiol 2015;44(3):826-26g.
20. Walker M, Whincup PH, Shaper AG. The British Regional Heart Study 1975-2004. Int J Epidemiol 2004;33(6):1185-92.
21. World Health Organization. The World Health Organization MONICA Project (monitoring trends and determinants in cardiovascular disease): a major international collaboration. WHO MONICA Project Principal Investigators. J Clin Epidemiol 1988;41(2):105-14.
22. Yarnell JW, Fehily AM, Milbank JE, et al. A short dietary questionnaire for use in an epidemiological survey: comparison with weighed dietary records. Hum Nutr Appl Nutr 1983;37(2):103-12.
23. Bolton-Smith C, Milne AC. Food frequency v. weighed intake data in Scottish men. Proc Nutr Soc 1991;50:35A (abstr).
24. Wannamethee SG, Lowe GD, Rumley A, et al. Associations of vitamin C status, fruit and vegetable intakes, and markers of inflammation and hemostasis. Am J Clin Nutr 2006;83(3):567-74.
25. Holland B, Welch AA, Unwin ID, et al. McCance and Widdowson’s the composition of foods. 5th ed. London: Royal Society of Chemistry and Ministry of Agriculture, Fisheries and Food, 1991.
26. Goldberg GR, Black AE, Jebb SA, et al. Critical evaluation of energy intake data using fundamental principles of energy physiology: 1. Derivation of cut-off limits to identify under-recording. Eur J Clin Nutr 1991;45(12):569-81.
27. Pryer JA, Nichols R, Elliott P, et al. Dietary patterns among a national random sample of British adults. J Epidemiol Community Health 2001;55(1):29-37.
28. Vyas S, Kumaranayake L. Constructing socio-economic status indices: how to use principal components analysis. Health Policy Plan 2006;21(6):459-68.
29. Fransen HP, May AM, Stricker MD, et al. A posteriori dietary patterns: how many patterns to retain? J Nutr 2014;144(8):1274-82.
30. Smith AD, Emmett PM, Newby PK, et al. Dietary patterns obtained through principal components analysis: the effect of input variable quantification. Br J Nutr 2013;109(10):1881-91.
31. Wannamethee SG, Lowe GD, Shaper AG, et al. Associations between cigarette smoking, pipe/cigar smoking, and smoking cessation, and haemostatic and inflammatory markers for cardiovascular disease. Eur Heart J 2005;26(17):1765-73.
32. Wannamethee SG, Lowe GD, Whincup PH, et al. Physical activity and hemostatic and inflammatory variables in elderly men. Circulation 2002;105(15):1785-90.
33. Wannamethee SG, Shaper AG, Whincup PH. Alcohol and adiposity: effects of quantity and type of drink and time relation with meals. Int J Obes (Lond) 2005;29(12):1436-44.
34. Surveys OoPCa. Classification of Occupations, 1970. London: H.M. Stationary Office, 1970.
35. World Health Organization. Obesity: preventing and managing the global epidemic. Report of a WHO Consultation. WHO Technical Report Series, No 894. Geneva, WHO, 2000.
36. Walker M, Shaper AG, Lennon L, et al. Twenty year follow-up of a cohort based in general practices in 24 British towns. J Public Health Med 2000;22(4):479-85.
477478479480481482483484485486487488489490491492493494495496497498499500501502503504505506507508509510511512513514515516517518519520521522523524525526

18
37. Robinson S, Syddall H, Jameson K, et al. Current patterns of diet in community-dwelling older men and women: results from the Hertfordshire Cohort Study. Age Ageing 2009;38(5):594-9.
38. Yang Y, Zhao LG, Wu QJ, et al. Association between dietary fiber and lower risk of all-cause mortality: a meta-analysis of cohort studies. Am J Epidemiol 2015;181(2):83-91.
39. Rohrmann S, Overvad K, Bueno-de-Mesquita HB, et al. Meat consumption and mortality - results from the European Prospective Investigation into Cancer and Nutrition. BMC Med 2013;11(63):1-12.
40. Larsson SC, Orsini N. Red Meat and Processed Meat Consumption and All-Cause Mortality: A Meta-Analysis. Am J Epidemiol 2014;179(3):282-9.
41. Johnson RK, Appel LJ, Brands M, et al. Dietary sugars intake and cardiovascular health: a scientific statement from the American Heart Association. Circulation 2009;120(11):1011-20.
42. Lim DC. Sugar, not fat, is the culprit. BMJ 2013;347:f6846.43. Malhotra A. Saturated fat is not the major issue. BMJ 2013;347:f6340.44. Henderson L, Gregory J, Irving K, et al. The National Diet & Nutrition Survey:
adults aged 19 to 64 years. Volume 2: Energy, protein, carbohydrate, fat and alcohol intake. . London, 2003.
45. Maynard MJ, Blane D. Dietary assessment in early old age: experience from the Boyd Orr cohort. Eur J Clin Nutr 2009;63 Suppl 1:S58-63.
46. Willett W. Anthropometric measures and body composition. In: Willett W, ed. Nutritional Epidemiology. 2nd ed. New York: Oxford Univeristy Press, 1998:244-72.
47. Khani BR, Ye W, Terry P, et al. Reproducibility and validity of major dietary patterns among Swedish women assessed with a food-frequency questionnaire. J Nutr 2004;134(6):1541-5.
48. Hu FB, Rimm E, Smith-Warner SA, et al. Reproducibility and validity of dietary patterns assessed with a food-frequency questionnaire. Am J Clin Nutr 1999;69(2):243-9.
49. Nanri A, Shimazu T, Ishihara J, et al. Reproducibility and validity of dietary patterns assessed by a food frequency questionnaire used in the 5-year follow-up survey of the Japan Public Health Center-Based Prospective Study. J Epidemiol 2012;22(3):205-15.
527528529530531532533534535536537538539540541542543544545546547548549550551552553554555556557558559560
19
Table 1 Baseline characteristics of British Regional Heart Study Participants by quartiles of a ‘high fat/low fibre’ dietary pattern, in 1998-2000a
‘High fat/low fibre’ dietary pattern (quartiles)P (trend)
Q1 Q2 Q3 Q4n 807 806 807 806Age (years) 68.0 ± 5.4 68.5 ± 5.3 68.4 ± 5.5 68.1 ± 5.4 0.81Energy intake (kcal) 1861.8 ± 385.3 2004.7 ± 420.2 2175.2 ± 445.5 2548.4 ± 591.3 < 0.001Current smokers (%) 4.3 7.6 13.7 24.7 <0.001Heavy drinkers (%) 1.3 1.3 3.0 5.8 <0.001Physically inactive (%) 7.9 9.6 8.2 11.9 0.02Manual social class (%) 32.5 41.8 53.4 69.4 <0.001Obese (BMI ≥ 30 kg/m2) (%) 14.5 15.4 15.9 18.8 0.02SBP (mm/hg) 149.9 ± 24.5 149.5 ± 23.7 150.7 ± 23.0 150.5 ± 24.3 0.40HDL (mmol/L) 1.4 ± 0.4 1.3 ± 0.3 1.3 ± 0.3 1.3 ± 0.4 0.02Glucose (mmol/L) 6.0 ± 1.9 5.9 ± 1.6 6.0 ± 1.9 6.0 ± 1.8 0.98Diabetes (%) 8.2 6.9 5.2 5.4 0.01CRP (mg/L)* 1.3 (0.6-2.7) 1.5 (0.7-2.7) 1.9 (0.9-3.8) 2.0 (1.0-4.0) <0.001vWF (IU/dL) 132.7 ± 45.2 135.5 ± 44.0 139.2 ± 44.8 139.3 ± 46.3 0.001
SBP, systolic blood pressure; HDL, high density lipoprotein; CRP, C-reactive protein; vWF, von Willebrand factor.aValues presented as mean ± SD unless otherwise stated.*Log transformed - geometric mean and interquartile range presented.
561562
563564565566

20
Table 2 Baseline characteristics of British Regional Heart Study Participants by quartiles of a ‘prudent’ dietary pattern, in 1998-2000a
‘Prudent’ dietary pattern (quartiles)P (trend)
Q1 Q2 Q3 Q4n 807 806 807 806Age (years) 68.8 ± 5.4 68.4 ± 5.5 67.9 ± 5.2 68.0 ± 5.5 0.001Energy intake (kcal) 1944.4 ± 461.7 2132.3 ± 495.9 2174.9 ± 514.8 2335.7 ± 578.5 < 0.001Current smokers (%) 21.4 13.0 9.5 6.4 <0.001Heavy drinkers (%) 3.0 3.0 1.8 3.5 0.85Physically inactive (%) 14.4 9.5 7.0 6.8 <0.001Manual social class (%) 62.3 52.7 46.7 35.4 <0.001Obesity (BMI ≥ 30 kg/m2) (%) 15.5 16.5 16.9 15.8 0.82SBP (mm/hg) 149.7 ± 23.9 150.5 ± 23.9 149.4 ± 23.8 150.9 ± 23.9 0.50HDL (mmol/L) 1.3 ± 0.3 1.3 ± 0.3 1.3 ± 0.3 1.4 ± 0.3 <0.001Glucose (mmol/L) 5.9 ± 1.9 6.0 ± 1.7 6.0 ± 1.7 6.1 ± 2.0 0.20Diabetes (%) 5.2 5.0 7.7 7.8 0.007CRP (mg/L)* 2.0 (0.9-4.0) 1.7 (0.8-3.6) 1.5 (0.7-3.0) 1.4 (0.7-2.6) <0.001vWF (IU/dL) 140.7 ± 45.8 140.2 ± 46.7 134.7 ± 43.3 131.0 ± 44.0 <0.001
SBP, systolic blood pressure; HDL, high density lipoprotein; CRP, C-reactive protein; vWF, von Willebrand factor.aValues presented as mean ± SD unless otherwise stated. *Log transformed - geometric mean and interquartile range presented.
567568
569
570571572

21
Table 3 Baseline characteristics of British Regional Heart Study Participants by quartiles of a ‘high sugar’ dietary pattern, in 1998-2000a
‘High sugar’ dietary pattern (quartiles)P (trend)
Q1 Q2 Q3 Q4n 807 806 807 806Age (years) 67.1 ± 5.1 68.0 ± 5.2 68.6 ± 5.4 69.3 ± 5.7 <0.001Energy intake (kcal) 1855.3 ± 461.8 1995.1 ± 434.2 2200.2 ± 456.4 2535.1 ± 514.3 < 0.001Current smokers (%) 17.6 12.2 10.4 10.1 <0.001Heavy drinkers (%) 7.3 2.7 1.0 0.4 <0.001Physically inactive (%) 10.5 10.6 9.7 6.8 0.01Manual social class (%) 56.4 51.6 47.2 42.0 <0.001Obesity (BMI ≥ 30 kg/m2) (%) 21.2 17.2 15.4 10.8 <0.001SBP (mm/hg) 151.3 ± 22.8 150.1 ± 23.9 149.6 ± 24.3 149.6 ± 24.6 0.13HDL (mmol/L) 1.4 ± 0.4 1.3 ± 0.3 1.3 ± 0.3 1.3 ± 0.3 0.004Glucose (mmol/L) 6.1 ± 1.9 6.0 ± 1.8 5.9 ± 1.6 5.9 ± 1.9 0.04Diabetes (%) 9.5 6.7 5.4 4.0 <0.001CRP (mg/L)* 1.8 (0.9-3.7) 1.7 (0.9-3.4) 1.6 (0.7-3.2) 1.5 (0.7-2.9) <0.001vWF (IU/dL) 135.9 ± 47.2 137.9 ± 42.7 136.0 ± 44.7 136.8 ± 45.8 0.91
SBP, systolic blood pressure; HDL, high density lipoprotein; CRP, C-reactive protein; vWF, von Willebrand factor.aValues presented as mean ± SD unless otherwise stated. *Log transformed - geometric mean and interquartile range presented.
573574
575
576
577578579

22
Table 4 Hazard ratios (95% CI) for CHD events, CVD events, CVD mortality and all-cause mortality by quartiles of a ‘high fat/low fibre’ dietary pattern in British Regional Heart Study participants from baseline (1998-2000) to 2010a
‘High fat/low fibre’ diet quartiles
Cases (n) Rate (per 1,000 person years) Model 1 Model 2 Model 3 Model 4
All-cause mortality Q1 187 22.65 1.00 1.00 1.00 1.00Q2 199 24.62 1.06 (0.87-1.30) 1.01 (0.82-1.25) 1.07 (0.85-1.33) 1.10 (0.88-1.38)Q3 239 30.59 1.32 (1.09-1.60)* 1.16 (0.94-1.43) 1.12 (0.90-1.40) 1.11 (0.88-1.39)Q4 274 35.69 1.63 (1.36-1.97)* 1.40 (1.11-1.76)* 1.43 (1.12-1.82)* 1.44 (1.13-1.84)*
P-trend <0.001 0.002 0.005 0.007CVD mortality Q1 62 7.51 1.00 1.00 1.00 1.00
Q2 80 9.90 1.27 (0.91-1.78) 1.28 (0.89-1.83) 1.38 (0.94-2.01) 1.45 (0.99-2.12)Q3 81 10.37 1.32 (0.95-1.84) 1.11 (0.76-1.61) 1.10 (0.74-1.63) 1.10 (0.74-1.64)Q4 93 12.11 1.67 (1.21-2.30)* 1.40 (0.94-2.10) 1.36 (0.89-2.09) 1.39 (0.90-2.14)
P-trend 0.002 0.19 0.34 0.35CVD events Q1 133 16.95 1.00 1.00 1.00 1.00
Q2 139 17.84 1.02 (0.81-1.30) 1.00 (0.78-1.30) 1.00 (0.76-1.30) 1.02 (0.78-1.33)Q3 146 19.51 1.12 (0.88-1.42) 1.01 (0.77-1.31) 0.95 (0.72-1.25) 0.95 (0.72-1.25)Q4 151 20.55 1.23 (0.97-1.55) 1.04 (0.78-1.40) 0.95 (0.70-1.29) 0.95 (0.69-1.30)
P-trend 0.06 0.80 0.69 0.64CHD events Q1 70 8.66 1.00 1.00 1.00 1.00
Q2 72 9.05 1.02 (0.73-1.41) 1.00 (0.70-1.42) 1.00 (0.69-1.44) 1.02 (0.71-1.48)Q3 77 10.04 1.13 (0.82-1.56) 1.01 (0.70-1.44) 0.94 (0.64-1.36) 0.92 (0.63-1.35)Q4 82 10.97 1.28 (0.93-1.76) 1.09 (0.73-1.62) 0.97 (0.63-1.47) 0.95 (0.62-1.46)
P-trend 0.10 0.69 0.80 0.72CVD, cardiovascular disease. CHD, coronary heart disease.aModel 1: Age adjusted. Model 2: Adjusted for model 1 + energy intake, smoking, alcohol, physical activity, social class and BMI. Model 3: Adjusted for model 2 + HDL, SBP and diabetes. Model 4. Adjusted for model 3 + CRP and vWF. *P < 0.05
580581582
583584585586
23
Table 5 Hazard ratios (95% CI) for CHD events, CVD events, CVD mortality and all-cause mortality by quartiles of a ‘prudent’ dietary pattern in British Regional Heart Study participants from baseline (1998-2000) to 2010a
‘Prudent’ diet quartiles Cases (n) Rate (per 1,000
person years) Model 1 Model 2 Model 3 Model 4
All-cause mortality Q1 280 36.66 1.00 1.00 1.00 1.00Q2 214 26.64 0.72 (0.60-0.86)* 0.76 (0.63-0.93)* 0.76 (0.62-0.93)* 0.77 (0.63-0.95)*Q3 202 25.15 0.76 (0.63-0.91)* 0.88 (0.72-1.07) 0.89 (0.72-1.10) 0.93 (0.75-1.14)Q4 203 24.97 0.72 (0.60-0.86)* 0.81 (0.66-1.00)* 0.78 (0.62-0.98)* 0.83 (0.66-1.04)
P-trend 0.001 0.13 0.11 0.28CVD mortality Q1 95 12.44 1.00 1.00 1.00 1.00
Q2 66 8.22 0.66 (0.48-0.90)* 0.68 (0.48-0.95)* 0.66 (0.46-0.94)* 0.68 (0.47-0.98)*Q3 78 9.71 0.91 (0.67-1.23) 0.99 (0.71-1.37) 0.98 (0.69-1.39) 1.03 (0.72-1.47)Q4 77 9.47 0.81 (0.60-1.10) 0.92 (0.64-1.30) 0.87 (0.60-1.27) 0.94 (0.64-1.37)
P-trend 0.47 0.89 0.96 0.74CVD events Q1 158 21.64 1.00 1.00 1.00 1.00
Q2 140 18.39 0.85 (0.68-1.07) 0.92 (0.72-1.17) 0.90 (0.70-1.16) 0.93 (0.72-1.21)Q3 133 17.21 0.87 (0.69-1.10) 0.92 (0.71-1.18) 0.91 (0.70-1.19) 0.93 (0.71-1.21)Q4 138 17.63 0.85 (0.68-1.07) 0.93 (0.72-1.22) 0.90 (0.68-1.19) 0.94 (0.71-1.25)
P-trend 0.22 0.63 0.50 0.68CHD events Q1 87 11.65 1.00 1.00 1.00 1.00
Q2 79 10.12 0.87 (0.64-1.18) 0.97 (0.70-1.34) 0.95 (0.68-1.34) 0.99 (0.70-1.40)Q3 70 8.87 0.83 (0.61-1.14) 0.90 (0.64-1.27) 0.89 (0.61-1.28) 0.92 (0.64-1.34)Q4 65 8.10 0.73 (0.53-1.01) 0.82 (0.56-1.18) 0.81 (0.55-1.20) 0.86 (0.58-1.27)
P-trend 0.06 0.26 0.27 0.40CVD, cardiovascular disease. CHD, coronary heart disease.aModel 1: Age adjusted. Model 2: Adjusted for model 1 + energy intake, smoking, alcohol, physical activity, social class and BMI. Model 3: Adjusted for model 2 + HDL, SBP and diabetes. Model 4. Adjusted for model 3 + CRP and vWF. *P < 0.05
587588589
590591592593

24
Table 6 Hazard ratios (95% CI) for CHD events, CVD events, CVD mortality and all-cause mortality by quartiles of a ‘high sugar’ dietary pattern in British Regional Heart Study participants from baseline (1998-2000) to 2010a
‘High sugar’ diet quartiles Cases (n) Rate (per 1,000
person years) Model 1 Model 2 Model 3 Model 4
All-cause mortality Q1 219 27.32 1.00 1.00 1.00 1.00Q2 222 28.00 0.94 (0.78-1.14) 1.00 (0.82-1.23) 1.04 (0.84-1.29) 1.06 (0.85-1.31)Q3 214 26.56 0.81 (0.67-0.98)* 0.85 (0.68-1.05) 0.89 (0.71-1.12) 0.91 (0.72-1.15)Q4 244 31.18 0.88 (0.73-1.05) 0.89 (0.70-1.13) 0.96 (0.75-1.24) 1.00 (0.77-1.29)
P-trend 0.08 0.18 0.53 0.71CVD mortality Q1 64 7.98 1.00 1.00 1.00 1.00
Q2 73 9.21 1.04 (0.74-1.45) 1.07 (0.75-1.53) 1.10 (0.75-1.63) 1.13 (0.76-1.66)Q3 75 9.31 0.91 (0.66-1.29) 0.91 (0.62-1.33) 0.95 (0.63-1.43) 0.97 (0.64-1.47)Q4 104 13.29 1.18 (0.86-1.61) 1.07 (0.71-1.61) 1.27 (0.82-1.96) 1.32 (0.84-2.05)
P-trend 0.39 0.94 0.40 0.33CVD events Q1 112 14.50 1.00 1.00 1.00 1.00
Q2 139 18.34 1.17 (0.91-1.50) 1.26 (0.97-1.65) 1.22 (0.92-1.62) 1.27 (0.95-1.68)Q3 139 18.00 1.07 (0.83-1.37) 1.10 (0.83-1.46) 1.08 (0.80-1.46) 1.10 (0.81-1.50)Q4 179 24.04 1.32 (1.04-1.67)* 1.33 (0.98-1.81) 1.40 (1.01-1.93)* 1.47 (1.06-2.04)*
P-trend 0.05 0.16 0.09 0.06CHD events Q1 59 7.48 1.00 1.00 1.00 1.00
Q2 67 8.61 1.08 (0.76-1.53) 1.11 (0.76-1.61) 1.13 (0.76-1.68) 1.15 (0.77-1.72)Q3 79 10.00 1.18 (0.84-1.65) 1.24 (0.85-1.82) 1.21 (0.80-1.83) 1.20 (0.79-1.83)Q4 96 12.60 1.40 (1.01-1.94)* 1.42 (0.93-2.16) 1.52 (0.97-2.38) 1.57 (1.00-2.46)
P-trend 0.04 0.09 0.07 0.06
CVD, cardiovascular disease. CHD, coronary heart disease.aModel 1: Age adjusted. Model 2: Adjusted for model 1 + energy intake, smoking, alcohol, physical activity, social class and BMI. Model 3: Adjusted for model 2 + HDL, SBP and diabetes. Model 4. Adjusted for model 3 + CRP and vWF. *P < 0.05
594595596
597598599600601
25
ONLINE SUPPLEMENTARY MATERIAL
SUPPLEMENTAL TABLE 1 List of 34 food groups derived from items in the food frequency questionnaire, used in British Regional Heart Study participants in1998-2000
Food group Food items Units* RangeRed meat Beef (including minced beef, beef burgers); lamb; pork, bacon, ham, salami days/week 0-7Poultry Chicken, turkey, other poultry days/week 0-7Meat products Tinned meat (all types, corned beef, etc.); pork sausages; beef sausages; meat
pies, pasties; liver, kidney, heartdays/week 0-7
Fish White fish (cod, haddock, hake, plaice, fish fingers, etc.); kippers, herrings, pilchards, tuna, sardines, salmon, mackerel (including tinned); shellfish
days/week 0-7
Potatoes Boiled, baked, mashed days/week 0-7Fried potatoes Chips or fried (from shop); chips or fried (cooked at home); roast potatoes days/week 0-7Vegetables Green vegetables, salad; carrots; parsnips, swedes, turnips, beetroot, other
root vegetables; onions; tomatoesdays/week 0-7
Legumes Baked or butter beans, lentils, peas, chickpeas, sweetcorn days/week 0-7Fruit Apples; pears; oranges; bananas; other fruits pieces/week 0-60Pasta and rice Spaghetti and other pasta; rice (all types except pudding rice) days/week 0-7Breakfast cereal Grapenuts, porridge Ready Brek, Special K, Sugar Puffs, Rice Crispies;
Cornflakes, muesli, Shredded Wheat, Sultana Bran, Weetabix; Bran Flakes, Puffed Wheat; All Bran, Wheat Bran; other cereal
days/week0-7
White bread White bread days/week 0-7Wholemeal bread Brown bread; wholemeal bread days/week 0-7Full-fat cheese e.g. cheddar, Leicester, stilton, brie, soft cheeses days/week 0-7Low-fat cheese e.g. edam, cottage cheese, reduced fat cheeses days/week 0-7Full-fat milk Full-fat milk None; ≤0.5 pint; 0.5-1 pint; >1 pint/day
None; ≤0.5 pint; 0.5-1 pint; >1 pint/dayNone; ≤0.5 pint; 0.5-1 pint; >1 pint/dayNone; ≤0.5 pint; 0.5-1 pint; >1 pint/day
1-4Semi-skimmed milk Semi-skimmed milk 1-4Skimmed milk Skimmed milk 1-4Other milk Condensed milk, evaporated milk etc 1-4Biscuits and puddings Digestive biscuits, plain biscuits; sweet biscuits, sponge cakes, scones, buns;
ice-cream, sweet yoghurts, trifle; fruit cake, fruit bread, plum pudding; fruit tart, jam tart, fruit crumble; milk puddings (rice, tapioca); tinned fruit, jellies; sweet sauces (chocolate, custard)
days/week
0-7
Chocolate and sweets Chocolate, chocolate bars, sweets (all types) days/week 0-7
602
603604605

26
Eggs Eggs (boiled, poached, fried, scrambled); eggs in baked dishes (e.g. flans, quiches, soufflés, egg custard etc.)
days/week 0-7
Fruit juice Natural fruit juices (including tomato juice) days/week 0-7Soft drinks Fizzy drinks, non-diet squashes; low calorie (diet) squashes and fizzy drinks days/week 0-7Tea and coffee Tea; coffee; other hot drinks (hot chocolate, malted milk, Horlicks) cups/day 0-34Nuts Nuts (e.g. salted or unsalted peanuts), nut butter days/week 0-7Savoury snacks Potato crisps, corn chips, crackers days/week 0-7Sweet spreads Jam, honey, marmalade, chocolate spread days/week 0-7Sauces and soups Chutney, brown sauce, tomato sauce; soups (all kinds, home-made, tinned,
packet)days/week 0-7
Wine Wine single glasses/week 0-44Beer Beer, Lager, Shandy pints/week 0-70Spirits Spirits single glasses/week 0-84Olive oil Olive oil mls/week 0-500Butter Butter grams/week 0-1134*Units of measurements based on the available frequency measures from the food frequency questionnaire.606
607

27
SUPPLEMENTAL TABLE 2 Food group factor loadings for ‘high fat/low fibre’, ‘prudent’ and ‘high sugar’ dietary patterns, in British Regional Heart Study participants in 1998-2000a
Food groups ‘High fat/low fibre’ dietary pattern
‘Prudent’ dietary pattern
‘High sugar’ dietary pattern
Variance explained (%) 7.9 7.1 5.8
Red meat 0.33 0.12 0.03Poultry 0.03 0.29 -0.09Meat products 0.42 0.08 -0.04Fish 0.07 0.38 -0.08Potatoes 0.05 0.12 0.12Fried potatoes 0.36 0.01 0.02Vegetables -0.01 0.26 0.09Legumes 0.14 0.26 0.01Fruit -0.13 0.23 0.04Pasta and rice 0.00 0.34 -0.06Breakfast cereal -0.19 0.06 0.28White bread 0.34 -0.19 0.04Wholemeal bread -0.30 0.25 0.07Full-fat cheese 0.04 0.05 0.25Low-fat cheese -0.03 0.17 -0.03Full-fat milk 0.04 -0.07 0.13Semi-skimmed milk 0.03 -0.01 0.13Skimmed milk -0.13 0.10 -0.17Other milk 0.07 0.03 -0.12Biscuits and puddings 0.06 -0.03 0.46Chocolate and sweets 0.06 -0.04 0.41Eggs 0.26 0.23 0.09Fruit juice -0.13 0.17 0.12Soft drinks 0.08 0.05 0.09Tea and coffee 0.09 -0.06 0.12Nuts 0.01 0.14 0.10Savoury snacks 0.16 0.03 0.15Sweet spreads -0.12 0.06 0.36Sauces and soups 0.17 0.26 0.18Wine -0.18 0.19 -0.04Beer 0.23 0.09 -0.31Spirits 0.01 0.10 -0.11Olive oil -0.08 0.23 -0.05Butter 0.09 0.02 0.04
aFactor loadings ≥ 0.20 / ≤ -0.20 are indicated in bold.
608609610
611
612
613
614


