0May Investor Meetings | aep.com
Investor MeetingsMay 2019

1May Investor Meetings | aep.com
Bette Jo RozsaManaging DirectorInvestor [email protected]
Darcy ReeseDirectorInvestor [email protected]
INVESTOR RELATIONS
This presentation contains forward-looking statements within the meaning of Section 21E of the Securities Exchange Act of 1934. Although AEP andeach of its Registrant Subsidiaries believe that their expectations are based on reasonable assumptions, any such statements may be influenced byfactors that could cause actual outcomes and results to be materially different from those projected. Among the factors that could cause actualresults to differ materially from those in the forward-looking statements are: changes in economic conditions, electric market demand anddemographic patterns in AEP service territories, inflationary or deflationary interest rate trends, volatility in the financial markets, particularlydevelopments affecting the availability or cost of capital to finance new capital projects and refinance existing debt, the availability and cost of fundsto finance working capital and capital needs, particularly during periods when the time lag between incurring costs and recovery is long and the costsare material, electric load and customer growth, weather conditions, including storms and drought conditions, and the ability to recover significantstorm restoration costs, the cost of fuel and its transportation, the creditworthiness and performance of fuel suppliers and transporters and the costof storing and disposing of used fuel, including coal ash and spent nuclear fuel, availability of necessary generation capacity, the performance ofgeneration plants and the availability of fuel, the ability to recover fuel and other energy costs through regulated or competitive electric rates, theability to build or acquire renewable generation, transmission lines and facilities (including the ability to obtain any necessary regulatory approvalsand permits) when needed at acceptable prices and terms and to recover those costs, new legislation, litigation and government regulation, includingoversight of nuclear generation, energy commodity trading and new or heightened requirements for reduced emissions of sulfur, nitrogen, mercury,carbon, soot or particulate matter and other substances that could impact the continued operation, cost recovery and/or profitability of generationplants and related assets, evolving public perception of the risks associated with fuels used before, during and after the generation of electricity,including nuclear fuel, timing and resolution of pending and future rate cases, negotiations and other regulatory decisions, including rate or otherrecovery of new investments in generation, distribution and transmission service and environmental compliance, resolution of litigation, the ability toconstrain operation and maintenance costs, prices and demand for power generated and sold at wholesale, changes in technology, particularly withrespect to energy storage and new, developing, alternative or distributed sources of generation, the ability to recover through rates any remainingunrecovered investment in generation units that may be retired before the end of their previously projected useful lives, volatility and changes inmarkets for capacity and electricity, coal and other energy-related commodities, particularly changes in the price of natural gas, changes in utilityregulation and the allocation of costs within regional transmission organizations, including ERCOT, PJM and SPP, changes in the creditworthiness ofthe counterparties with contractual arrangements, including participants in the energy trading market, actions of rating agencies, including changes inthe ratings of debt, the impact of volatility in the capital markets on the value of the investments held by the pension, other postretirement benefitplans, captive insurance entity and nuclear decommissioning trust and the impact of such volatility on future funding requirements, accountingpronouncements periodically issued by accounting standard-setting bodies, and other risks and unforeseen events, including wars, the effects ofterrorism (including increased security costs), embargoes, naturally occurring and human-caused fires, cyber security threats and other catastrophicevents.
“Safe Harbor” Statement under the Private Securities Litigation Reform Act of 1995

2May Investor Meetings | aep.com
Statistics as of December 31, 2018 except for market capitalization as of May 10, 2019
$69B Total Assets
5.4MCustomers in 11 States
26GWOwned Generation $42B
Current Market Capitalization
40,000Miles of Transmission
18,000Employees
$42BRate Base
The Premier Regulated Energy Company

3May Investor Meetings | aep.com
Delivered Earnings & Dividend Growth
Successful Regulatory Outcomes
Superior Capital
Allocation
Balance Sheet
Strength
Sale ofNon-Core
Assets
Confidence in Steady and
Predictable Earnings Growth Rate of
5-7%
Commitment to Growing Dividend
Consistent with Earnings
Well Positionedas a Sustainable
Regulated Business
Compelling Portfolio of Premium Investment
Opportunities
Strong Execution Track Record
AEP Leading the Way Forward
Leading the Way

4May Investor Meetings | aep.com
We are focused on executing our strategy while improvingthe customer experience
Invest in transmission and distribution networks
Invest in regulated and contracted renewables
Improve customer experience
Mitigate fossil and nuclear generation risk and optimize operations
Relentless O&M optimization/Future of work
Mitigate generation exposure
Manage customer bills
Grow load
Pilot technologies and business models
Improve operations
Exec
ute
Str
ateg
yInitiative Themes
Invest in infrastructure and renewables
Strategic Vision 2023

5May Investor Meetings | aep.com
$3.50
$3.75
$4.00
$4.25
$4.50
$4.75
$5.00
2018 2019 2020 Future
$3.85
$4.00 - $4.20Operating Earnings Guidance
$3.75 - $3.95Actual $3.95
$4.25 - $4.45
Organic Investment Opportunity + Manageable Execution Risk = Growth
Operating Earnings Guidance
6May Investor Meetings | aep.com
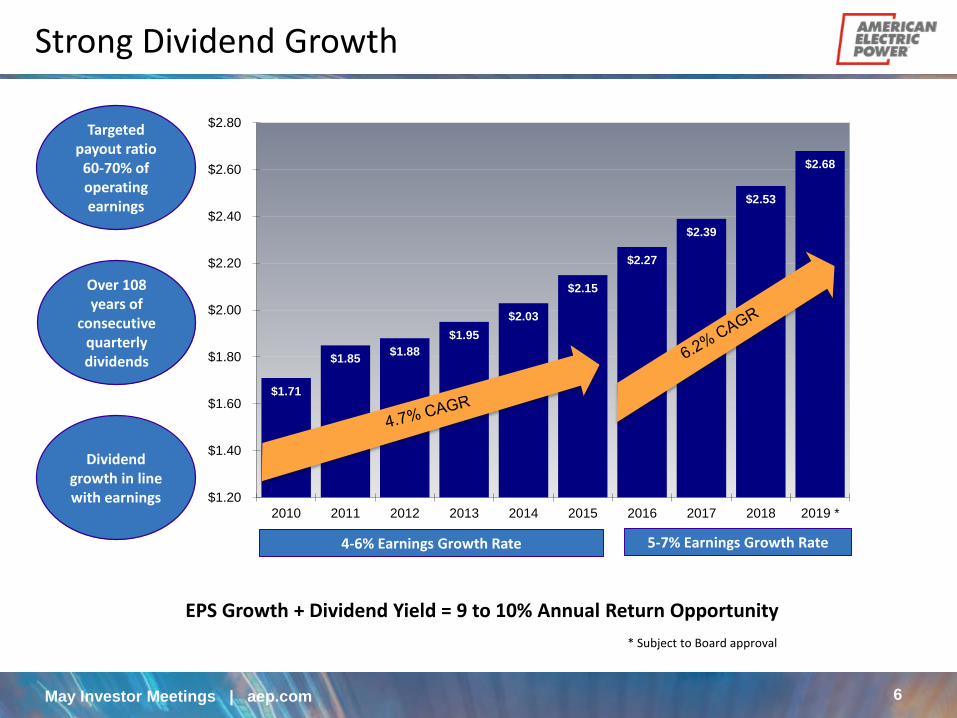
$1.71
$1.85$1.88
$1.95
$2.03
$2.15
$2.27
$2.39
$2.53
$2.68
$1.20
$1.40
$1.60
$1.80
$2.00
$2.20
$2.40
$2.60
$2.80
2010 2011 2012 2013 2014 2015 2016 2017 2018 2019 *
4-6% Earnings Growth Rate 5-7% Earnings Growth Rate
* Subject to Board approval
Targeted payout ratio
60-70% of operating earnings
EPS Growth + Dividend Yield = 9 to 10% Annual Return Opportunity
Over 108 years of
consecutive quarterly dividends
Dividend growth in line with earnings
Strong Dividend Growth

7May Investor Meetings | aep.com
POSITIONING FOR THE FUTURE
CAPITAL INVESTMENT OPPORTUNITIES
8May Investor Meetings | aep.com
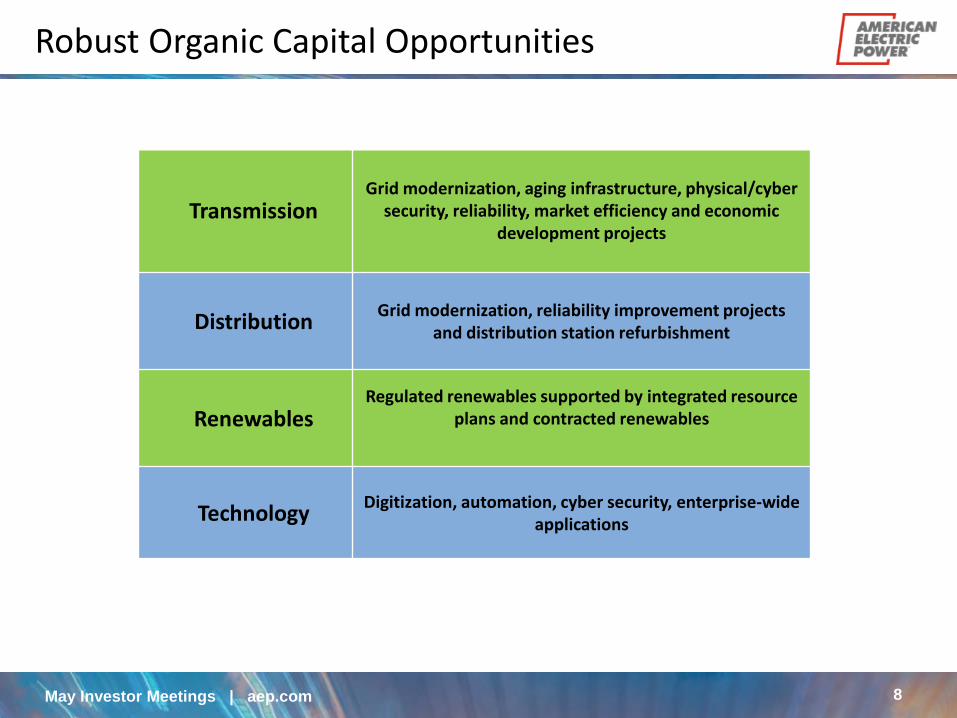
TransmissionGrid modernization, aging infrastructure, physical/cyber
security, reliability, market efficiency and economic development projects
DistributionGrid modernization, reliability improvement projects
and distribution station refurbishment
RenewablesRegulated renewables supported by integrated resource
plans and contracted renewables
TechnologyDigitization, automation, cyber security, enterprise-wide
applications
Robust Organic Capital Opportunities

9May Investor Meetings | aep.com
100%of capital allocated to regulated businesses and contracted renewables
75%allocated to wires
Focus on wires and renewables
Transmission$8.3B | 25%
Distribution$8.3B | 25%
Corporate$2.8B | 9%
Nuclear Generation$0.5B | 2%
Regulated Fossil/Hydro Generation$1.0B | 3%
Regulated Environmental
Generation$1.1B | 3%
Regulated Renewables$0.5B | 1%
Contracted Renewables$2.2B | 7%
AEP Transmission Holdco $8.3B | 25%
2019-2023 Capital Forecast of $33B and Net Plant
Historical Net Plant Profiles2019-2023 Capital Forecast
10May Investor Meetings | aep.com
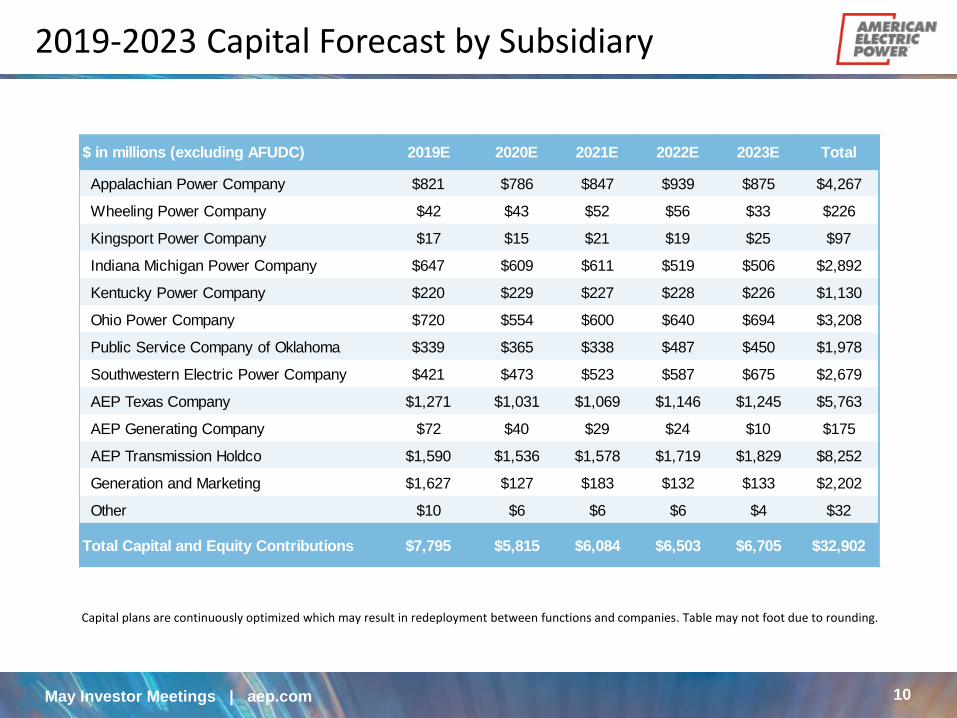
2019-2023 Capital Forecast by Subsidiary
Capital plans are continuously optimized which may result in redeployment between functions and companies. Table may not foot due to rounding.
$ in millions (excluding AFUDC) 2019E 2020E 2021E 2022E 2023E Total
Appalachian Power Company $821 $786 $847 $939 $875 $4,267
Wheeling Power Company $42 $43 $52 $56 $33 $226
Kingsport Power Company $17 $15 $21 $19 $25 $97
Indiana Michigan Power Company $647 $609 $611 $519 $506 $2,892
Kentucky Power Company $220 $229 $227 $228 $226 $1,130
Ohio Power Company $720 $554 $600 $640 $694 $3,208
Public Service Company of Oklahoma $339 $365 $338 $487 $450 $1,978
Southwestern Electric Power Company $421 $473 $523 $587 $675 $2,679
AEP Texas Company $1,271 $1,031 $1,069 $1,146 $1,245 $5,763
AEP Generating Company $72 $40 $29 $24 $10 $175
AEP Transmission Holdco $1,590 $1,536 $1,578 $1,719 $1,829 $8,252
Generation and Marketing $1,627 $127 $183 $132 $133 $2,202
Other $10 $6 $6 $6 $4 $32
Total Capital and Equity Contributions $7,795 $5,815 $6,084 $6,503 $6,705 $32,902

11May Investor Meetings | aep.com
Cash Flows and Financial Metrics
$ in millions 2019E 2020E 2021E 2022E
Cash from Operations 4,700$ 4,900$ 5,300$ 5,800$
Capital & JV Equity Contributions * (7,300) (5,800) (6,100) (6,500)
Other Investing Activities (300) (400) (100) (100)
Common Dividends ** (1,300) (1,300) (1,300) (1,400)
Excess (Required) Capital (4,200)$ (2,600)$ (2,200)$ (2,200)$
Financing
Excess (Required) Capital (4,200)$ (2,600)$ (2,200)$ (2,200)$
Debt Maturities (Senior Notes, PCRBs) (1,100) (900) (1,500) (1,600)
Securitization Amortizations (300) (200) (100) (100)
Equity Units *** 800 - - -
Equity Units Conversion - - - 800
Equity Issuances - Includes DRP/401(k) 100 100 100 500
Debt Capital Market Needs (New) (4,700)$ (3,600)$ (3,700)$ (2,600)$
Financial Metrics
Debt to Capitalization (GAAP)
FFO/Total Debt (Moody's)
*** $700M offering and exercise of over-a l lotment.
55% - 60%
Mid Teens
* Estimates are based on current capita l expenditure program. 2019 capita l expenditures reflect $551M purchase price and
excludes recently announced contracted renewables transaction minori ty interest and JV project debt.
** Common dividends $2.68/share 2019-2022. Dividends evaluated by Board of Directors each quarter; s tated target payout
range is 60%-70%.
12May Investor Meetings | aep.com
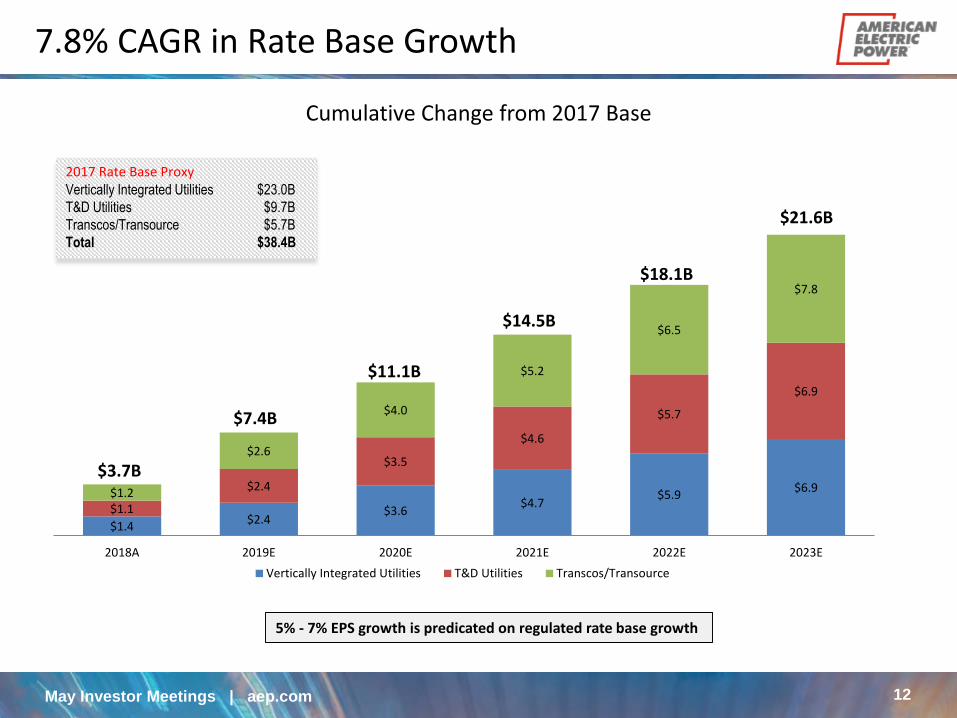
5% - 7% EPS growth is predicated on regulated rate base growth
Cumulative Change from 2017 Base
$1.4$2.4
$3.6$4.7
$5.9$6.9
$1.1
$2.4
$3.5
$4.6
$5.7
$6.9
$1.2
$2.6
$4.0
$5.2
$6.5
$7.8
2018A 2019E 2020E 2021E 2022E 2023E
Vertically Integrated Utilities T&D Utilities Transcos/Transource
$14.5B
$3.7B
$7.4B
$11.1B
$18.1B
$21.6B
2017 Rate Base ProxyVertically Integrated Utilities $23.0B
T&D Utilities $9.7B
Transcos/Transource $5.7B
Total $38.4B
7.8% CAGR in Rate Base Growth
13May Investor Meetings | aep.com
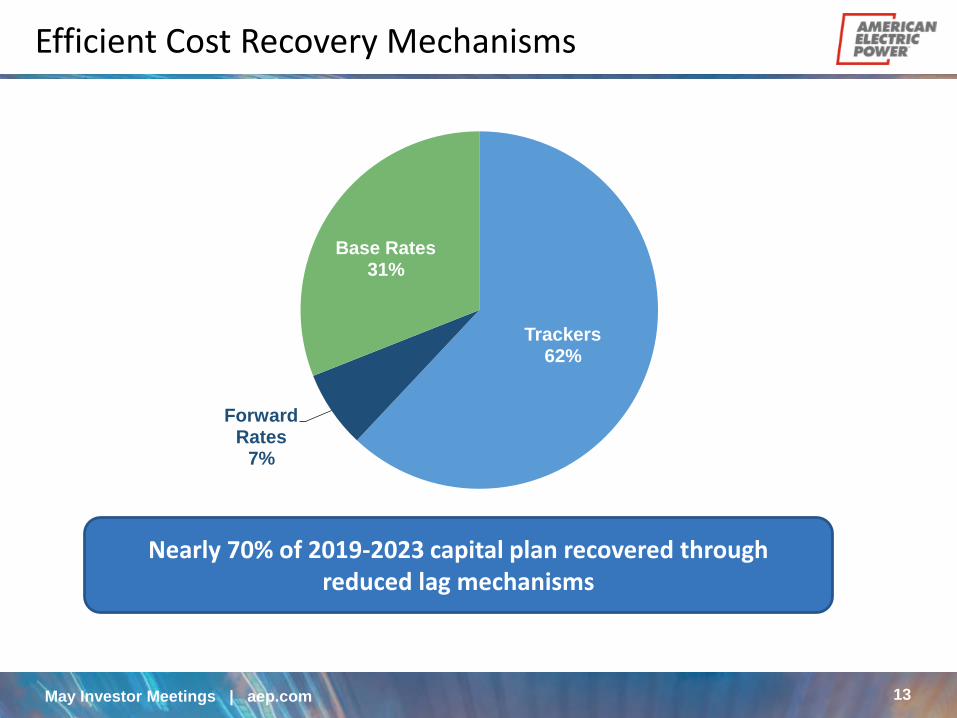
Nearly 70% of 2019-2023 capital plan recovered throughreduced lag mechanisms
Efficient Cost Recovery Mechanisms
Trackers62%
ForwardRates
7%
Base Rates31%
14May Investor Meetings | aep.com
INVESTING IN TRANSMISSION
15May Investor Meetings | aep.com
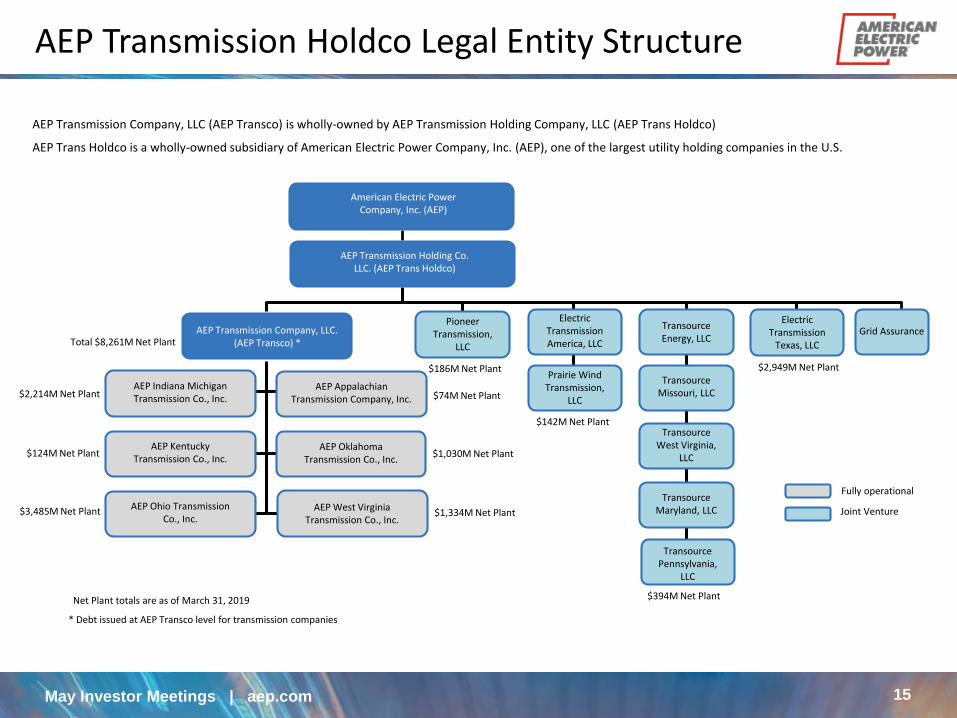
Fully operational
Joint Venture
AEP Transmission Company, LLC (AEP Transco) is wholly-owned by AEP Transmission Holding Company, LLC (AEP Trans Holdco)
AEP Trans Holdco is a wholly-owned subsidiary of American Electric Power Company, Inc. (AEP), one of the largest utility holding companies in the U.S.
$2,949M Net Plant
$394M Net PlantNet Plant totals are as of March 31, 2019
* Debt issued at AEP Transco level for transmission companies
$142M Net Plant
$186M Net Plant
$2,214M Net Plant
$124M Net Plant
$3,485M Net Plant
$1,030M Net Plant
$1,334M Net Plant
$74M Net Plant
Grid AssuranceElectric
Transmission Texas, LLC
Transource Energy, LLC
Transource Missouri, LLC
Transource West Virginia,
LLC
Transource Pennsylvania,
LLC
Transource Maryland, LLC
AEP Appalachian Transmission Company, Inc.
Electric Transmission America, LLC
Prairie Wind Transmission,
LLC
Pioneer Transmission,
LLC
AEP Transmission Company, LLC. (AEP Transco) *
American Electric Power Company, Inc. (AEP)
AEP Transmission Holding Co. LLC. (AEP Trans Holdco)
AEP Indiana Michigan Transmission Co., Inc.
AEP Kentucky Transmission Co., Inc.
AEP Ohio Transmission Co., Inc.
AEP Oklahoma Transmission Co., Inc.
AEP West Virginia Transmission Co., Inc.
Total $8,261M Net Plant
AEP Transmission Holdco Legal Entity Structure

16May Investor Meetings | aep.com
Customer Experience
Strategy Execution Results
Improved Reliability/ResiliencyEarnings Growth
Efficient Cost Recovery
Modernize grid reducing equipment failures/outages,
community impact, customer relations
Industry Leadership Customer Solutions
Investment & Customer Diversity
Non-TraditionalGrowth
G&T Integrated Solutions
Public Power Solutions
InfrastructureInvestment
Targeted Capital Investments
Local Reliability, Telecom modernization, Asset Health
Improve Reliability, SCADA technology, security across the transmission system, Economic Development
InnovativeTechnologies/Solution
The nation’s largest transmission services provider is focused on delivering its $3 billion annual capital plan to improve customer reliability and grid resiliency while meeting earnings growth targets through diversified investments.
Transmission Priorities

17May Investor Meetings | aep.com
Significant Investment
Healthy ROEs
& Capital Structure
Portfolio Diversification
Industry & Technology
Leader
Over $13B projected by
2021 (AEP Transcos and
the ownership percentage
of Transource)
Affiliate authorized ROEs
ranging from 9.6% to 12.8%
Authorized capital structure
40-60% equity
Five Transcos and ETT
contributed 95% of total
2018 earnings (81% and
13% respectively)
Bringing innovation and
collaboration to the industry
through Grid Assurance,
BOLD and Asset Health
EPS Contribution$/Share
EPS Contribution w/o 205 $/Share
AEPTHC’s 2015 – 2021 EPS growth projected at a CAGR of 17.5%
AEPTHC EPS contribution grows from $0.31 in 2014 to $1.19-$1.22 in 2021
* Capital investment excludes Transource unapproved projects, JV equity contributions, BOLD and Grid Assurance.** In addition to forward looking rates, 2017 includes a historical true up for East Transcos. Having both in one year is a one time occurrence.
AEPTHC Target Earnings 2018 - 2021
18May Investor Meetings | aep.com
$2.3 billion of annual on-system, organic capital investment is required to maintain current asset age profile.
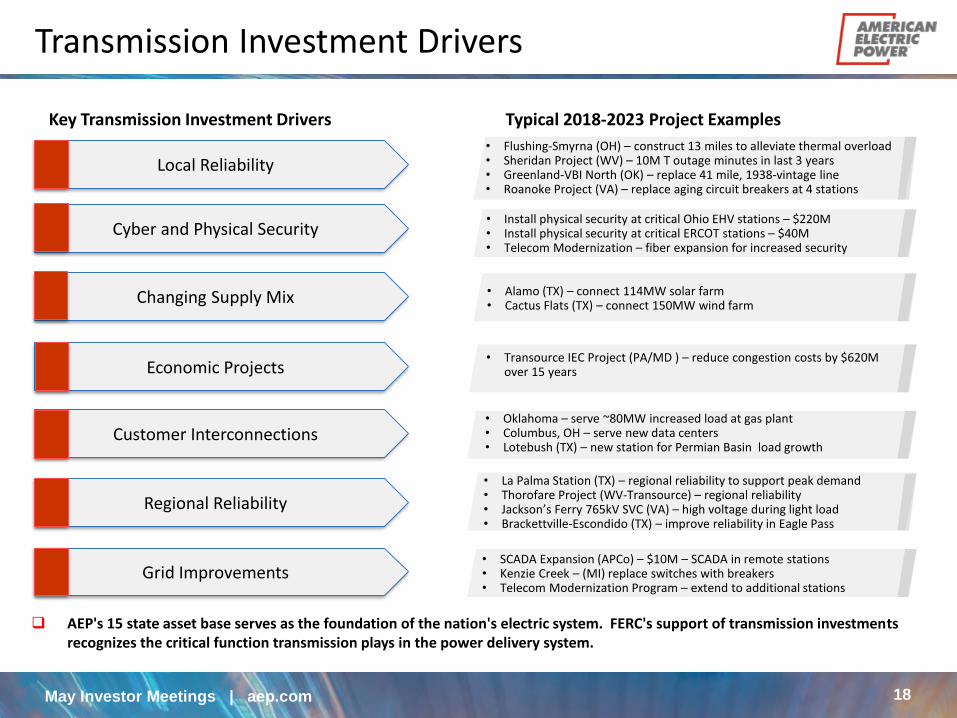
• Flushing-Smyrna (OH) – construct 13 miles to alleviate thermal overload• Sheridan Project (WV) – 10M T outage minutes in last 3 years• Greenland-VBI North (OK) – replace 41 mile, 1938-vintage line• Roanoke Project (VA) – replace aging circuit breakers at 4 stations
• Install physical security at critical Ohio EHV stations – $220M• Install physical security at critical ERCOT stations – $40M• Telecom Modernization – fiber expansion for increased security
• Alamo (TX) – connect 114MW solar farm• Cactus Flats (TX) – connect 150MW wind farm
• Transource IEC Project (PA/MD ) – reduce congestion costs by $620M over 15 years
• Oklahoma – serve ~80MW increased load at gas plant • Columbus, OH – serve new data centers• Lotebush (TX) – new station for Permian Basin load growth
• La Palma Station (TX) – regional reliability to support peak demand• Thorofare Project (WV-Transource) – regional reliability• Jackson’s Ferry 765kV SVC (VA) – high voltage during light load• Brackettville-Escondido (TX) – improve reliability in Eagle Pass
• SCADA Expansion (APCo) – $10M – SCADA in remote stations• Kenzie Creek – (MI) replace switches with breakers• Telecom Modernization Program – extend to additional stations
Local Reliability
Cyber and Physical Security
Changing Supply Mix
Economic Projects
Customer Interconnections
Regional Reliability
Grid Improvements
Key Transmission Investment Drivers Typical 2018-2023 Project Examples
AEP's 15 state asset base serves as the foundation of the nation's electric system. FERC's support of transmission investments recognizes the critical function transmission plays in the power delivery system.
Transmission Investment Drivers

19May Investor Meetings | aep.com
As the foundation of the power system, transmission integrates generation and loads across large regional footprints.
Major Issues Being Addressed
Aging transmission facilities in poor condition
Reduction of radial transmission sources
NERC/RTO requirements
Decrease customer exposure to Transmission outages
Improve response time
Enhance operability of the system
Growing complexity of the integrated power grid: distributed generation, diversity in generation fleet, location and variability of generation
System operations: Systems operating close to feasibility limits are more vulnerable (failures/intelligent adversaries)
Survivability: Systems ability to survive contingencies without customer interruption
2017-2023 Investment = $22.6 Billion
$
$500
$1,000
$1,500
$2,000
$2,500
$3,000
$3,500
$4,000
2017 2018 2019 2020 2021 2022 2023
Resiliency
Local Reliability
Regional
CustomerInterconnections
Transmission Investment Categories

20May Investor Meetings | aep.com
Transmission Line Miles TransformersCircuit
Breakers
Life Expectancy (years) 70 60 50
Current Quantity over Life Expectancy
6,085 234 998
Quantity that will exceed Life Expectancyin next ten years
5,057 133 653
Total RenewalOpportunity over ten years
11,142 367 1,651
$2.3 billion of annual on-system, organic capital investment is required to maintain current asset age profile.
Scope and scale of AEP's Transmission network results in sustainable investment opportunity without risk of over-investment
$2.3 billion of annual investment, addresses the facilities past their estimated life expectancy; the asset age profile changes with actual investment
Area of Focus
Area of Focus Life Expectancy 70 years
Conductor Avg Age 47.6 years
Life Expectancy 50 years
Avg Circuit Breaker Age 22.3 years
Robust Transmission Capital Expenditure Opportunities

21May Investor Meetings | aep.com
INVESTING IN DISTRIBUTION
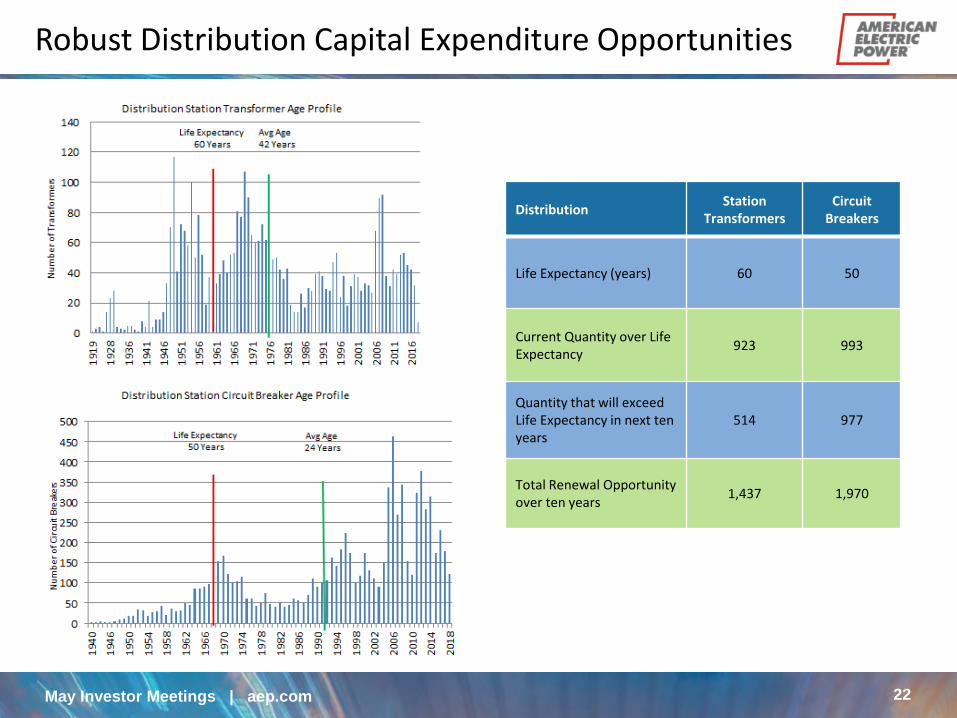
22May Investor Meetings | aep.com
DistributionStation
TransformersCircuit
Breakers
Life Expectancy (years) 60 50
Current Quantity over Life Expectancy
923 993
Quantity that will exceed Life Expectancy in next ten years
514 977
Total Renewal Opportunity over ten years
1,437 1,970
Robust Distribution Capital Expenditure Opportunities
23May Investor Meetings | aep.com
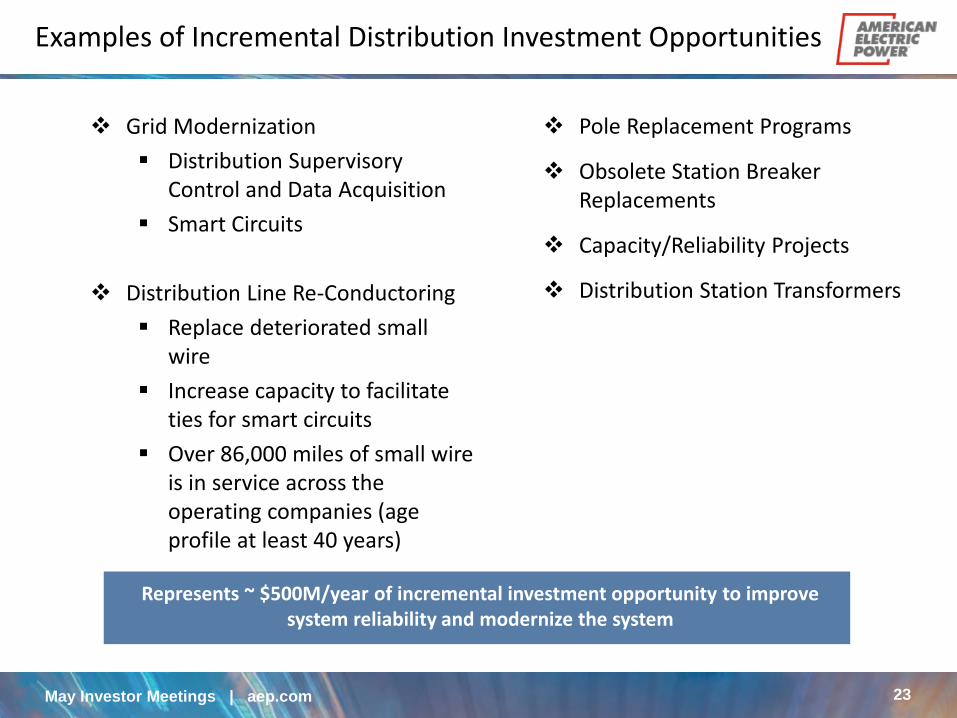
Grid Modernization
Distribution Supervisory Control and Data Acquisition
Smart Circuits
Distribution Line Re-Conductoring
Replace deteriorated small wire
Increase capacity to facilitate ties for smart circuits
Over 86,000 miles of small wire is in service across the operating companies (age profile at least 40 years)
Represents ~ $500M/year of incremental investment opportunity to improve system reliability and modernize the system
Pole Replacement Programs
Obsolete Station Breaker Replacements
Capacity/Reliability Projects
Distribution Station Transformers
Examples of Incremental Distribution Investment Opportunities
24May Investor Meetings | aep.com
INVESTING IN REGULATED RENEWABLES

25May Investor Meetings | aep.com
Wind Procurement * 2021-2023
SWEPCO Up to 1,200 MW
PSO Up to 1,000 MW
Total Up to 2,200 MW
Current IRP Wind Nameplate Forecast
RFP Issuance RFP Evaluation & Purchase Agreement Contracting Regulatory Filings Wind Farm Construction
2022202120202019
SWEPCO and PSO Integrated Resource Plans (IRP) continue to indicate that customers will benefit from additional low-cost wind energy Takes advantage of the federal Production Tax Credit
Opportunity will be scalable to align with regulatory approvals by state
SWEPCO and PSO issued requests for proposals in AR, LA, OK and TX in Q1 2019 RFPs seek to acquire wind assets Potential to acquire up to the full IRP amounts, depending
upon final outcome of IRP processes and RFP results
Key considerations in the RFP evaluation process include cost, performance and long-term deliverability Projects must minimize congestion Approval of any potential future transmission delivery
infrastructure would only be sought at the time its needed Projects must qualify for at least 80% of the federal
Production Tax Credit
* Outcomes pending applicable state IRP processes
SWEPCO and PSO Customer Savings Plan
26May Investor Meetings | aep.com
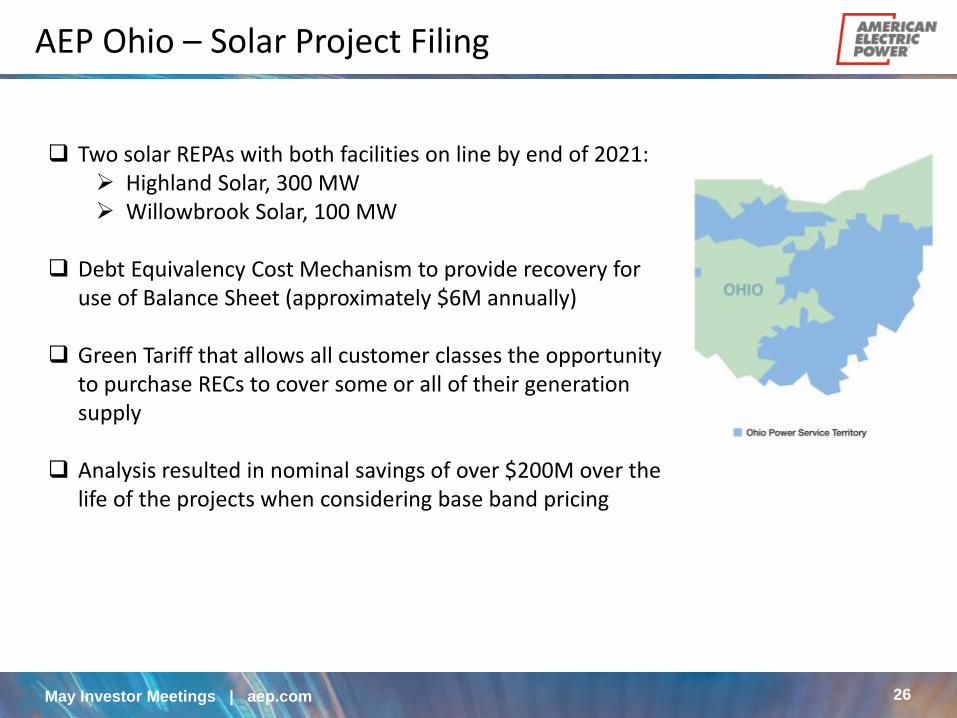
Two solar REPAs with both facilities on line by end of 2021: Highland Solar, 300 MW Willowbrook Solar, 100 MW
Debt Equivalency Cost Mechanism to provide recovery for use of Balance Sheet (approximately $6M annually)
Green Tariff that allows all customer classes the opportunity to purchase RECs to cover some or all of their generation supply
Analysis resulted in nominal savings of over $200M over the life of the projects when considering base band pricing
AEP Ohio – Solar Project Filing
27May Investor Meetings | aep.com
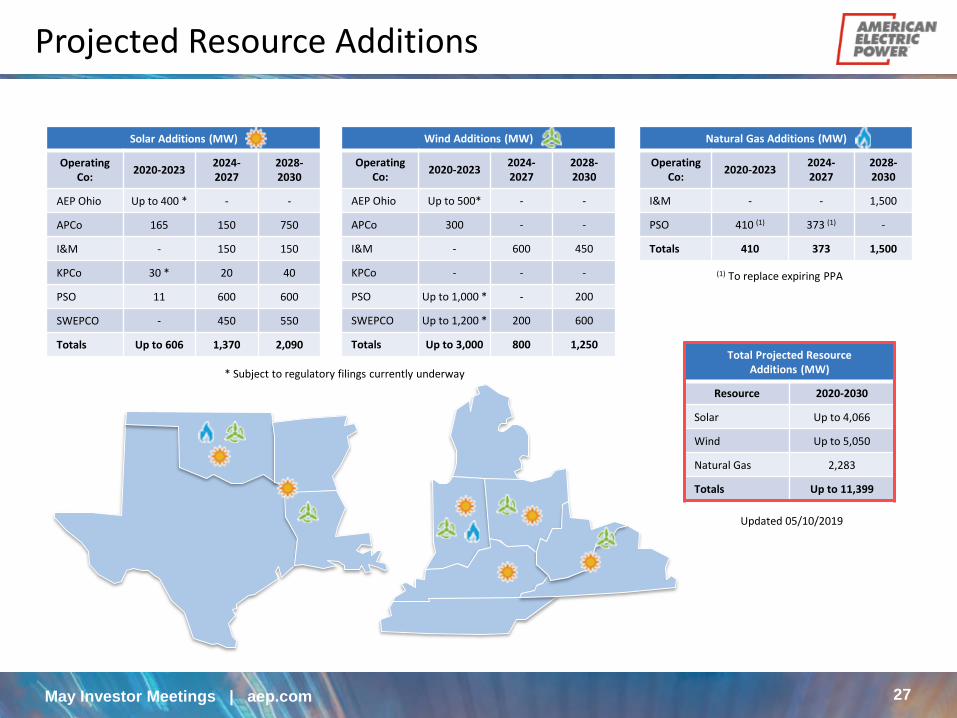
Natural Gas Additions (MW)
OperatingCo:
2020-20232024-2027
2028-2030
I&M - - 1,500
PSO 410 (1) 373 (1) -
Totals 410 373 1,500
Wind Additions (MW)
OperatingCo:
2020-20232024-2027
2028-2030
AEP Ohio Up to 500* - -
APCo 300 - -
I&M - 600 450
KPCo - - -
PSO Up to 1,000 * - 200
SWEPCO Up to 1,200 * 200 600
Totals Up to 3,000 800 1,250
Solar Additions (MW)
OperatingCo:
2020-20232024-2027
2028-2030
AEP Ohio Up to 400 * - -
APCo 165 150 750
I&M - 150 150
KPCo 30 * 20 40
PSO 11 600 600
SWEPCO - 450 550
Totals Up to 606 1,370 2,090
* Subject to regulatory filings currently underway
(1) To replace expiring PPA
Total Projected ResourceAdditions (MW)
Resource 2020-2030
Solar Up to 4,066
Wind Up to 5,050
Natural Gas 2,283
Totals Up to 11,399
Updated 05/10/2019
Projected Resource Additions

28May Investor Meetings | aep.com
IRPs Underway/Planned
PreviouslyApproved
IRPsQ4-18 Q1-19 Q2-19 Q3-19 Q4-19
12/21/18
12/14/18(AR)
July / Aug 2019
5/1/19(VA)
12/20/199/30/19(LA)
Next IRP filing date for APCo (WV) is January 2021
Integrated Resource Plan Status
29May Investor Meetings | aep.com
INVESTING IN COMPETITIVE BUSINESS
30May Investor Meetings | aep.com
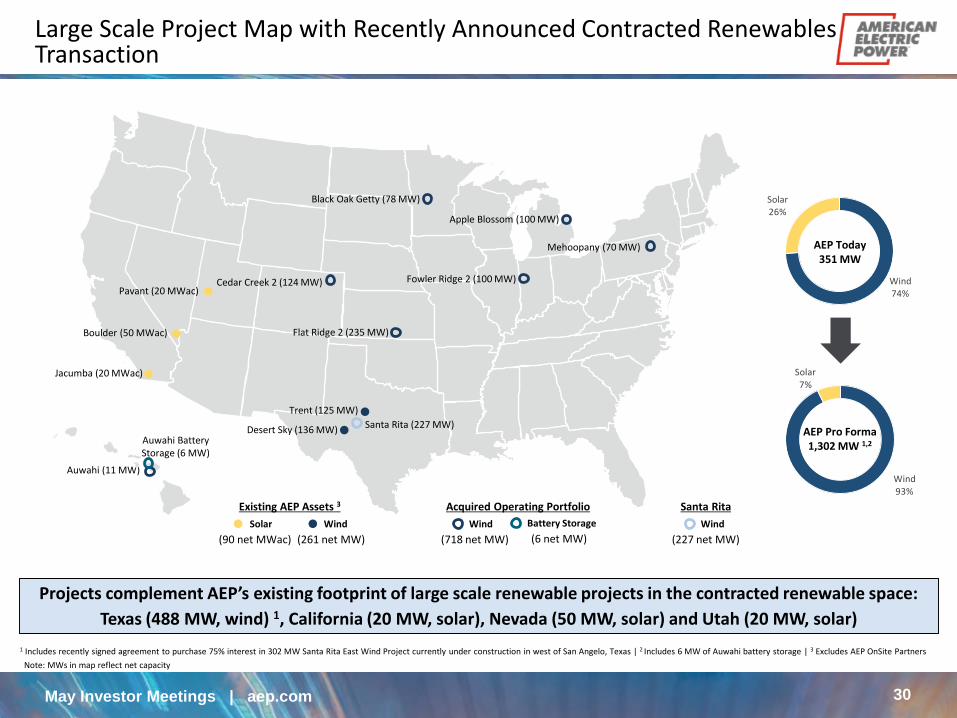
Wind 93%
Solar7%
Wind 74%
Solar26%
1 Includes recently signed agreement to purchase 75% interest in 302 MW Santa Rita East Wind Project currently under construction in west of San Angelo, Texas | 2 Includes 6 MW of Auwahi battery storage | 3 Excludes AEP OnSite Partners
Note: MWs in map reflect net capacity
(718 net MW) (6 net MW)
Projects complement AEP’s existing footprint of large scale renewable projects in the contracted renewable space:
Texas (488 MW, wind) 1, California (20 MW, solar), Nevada (50 MW, solar) and Utah (20 MW, solar)
AEP Today 351 MW
AEP Pro Forma1,302 MW 1,2
Black Oak Getty (78 MW)
Apple Blossom (100 MW)
Mehoopany (70 MW)
Fowler Ridge 2 (100 MW)
Flat Ridge 2 (235 MW)
Cedar Creek 2 (124 MW)
Auwahi (11 MW)
Auwahi Battery Storage (6 MW)
Wind Battery Storage
Trent (125 MW)
Desert Sky (136 MW) Santa Rita (227 MW)
Pavant (20 MWac)
Boulder (50 MWac)
Jacumba (20 MWac)
(261 net MW)
Wind
Acquired Operating Portfolio
(90 net MWac)
Solar
Existing AEP Assets 3
(227 net MW)
Wind
Santa Rita
Large Scale Project Map with Recently Announced Contracted Renewables Transaction

31May Investor Meetings | aep.com
Overview of Recently Announced Contracted Renewables Transaction
Operating Portfolio
724 net MW operating wind portfolio across seven states (CO, HI, IN, KS, MI, MN, PA) 1
Five of seven wind assets owned 50 / 50 with BP Wind Energy
Long-term PPAs with A/A2-rated 2 counterparties & 16 years remaining life 3
21% of PPAs with AEP Ohio, SWEPCO, and Indiana Michigan Power
Transaction Value $1.05B enterprise value including assumption of $470M of existing project debt & tax equity
Approvals & Timing Closed in April 2019 with approvals from the FERC and Hart-Scott-Rodino clearance
1 724 net MW includes 6 MW battery storage at the Auwahi project | 2 Credit ratings as of 10/8/2018. Maui Electric Company is not rated by Moody’s and is rated BBB- by S&P. As such, Maui is shown in the Baa3 category in the pie chart onslide 32 (corresponding Moody’s category) for illustrative purposes | 3 Weighted average remaining contract life and asset age as of 12/31/2018 | | 4 Includes recently signed agreement to purchase 75% interest in 302 MW Santa Rita East Wind Project currently under construction in west of San Angelo, Texas
Transaction Overview
Expands Contracted Renewables
Footprint
Enhances renewable platform scale and diversity, increasing industry participation in a market we expect to continue to grow
The acquisition, in addition to Santa Rita East Wind, will increase AEP’s contracted large scale renewable generation portfolio by 951 MW 4 to 1,302MW
Accelerates and de-risks $2.2B planned renewable investment commitment through 2023
Assets are located in known markets where we already have generation assets or utility operations
Strong Financial Fit
Transaction expected to be immediately accretive to EPS in first full year by a few cents
Further solidifies our long-term EPS growth guidance of 5% - 7%
Tax efficient transaction as our tax appetite allows for monetization of transaction tax attributes, including production tax credits
Growth Platform Development pipeline of the portfolio of up to 1 GW provides potential for incremental growth
opportunities
Strategic Rationale and Investment Highlights

32May Investor Meetings | aep.com
AssetMWNet 1
Off-taker COD PPA Expire Turbine O&M
BP
JV
Pro
ject
s
Fowler Ridge 2 (IN) 100 2009 2029
Cedar Creek 2 (CO) 124 2011 2035
Flat Ridge 2 (KS) 235 2012 2036
Mehoopany (PA) 70 2012 2032
Auwahi (HI) 11 2012 2032
Total 540
10
0%
Ow
ne
d Black Oak Getty (MN) 78 2016 2036
Apple Blossom (MI) 100 2017 2033
Total 178
Overall Total 718 2 16 yrs 3
A85%
Baa9%
Aa4%
Not rated2%
A2 / A Weighted Average Off-taker
Rating
10-15 years39%
>15 years61% ~16 year
weighted average
contract life
Investor Owned Utilities (IOUs)54%
Muni / Co-op46%
Stable Mix of Off-takers
1 Reflects AEP’s share | 2 Excludes 6 MW of Auwahi battery storage | 3 Based on weighted average contract life
Details of Recently Announced Contracted Renewables Transaction

33May Investor Meetings | aep.com
POSITIONING FOR THE FUTURE
FINANCIAL INFORMATION
34May Investor Meetings | aep.com
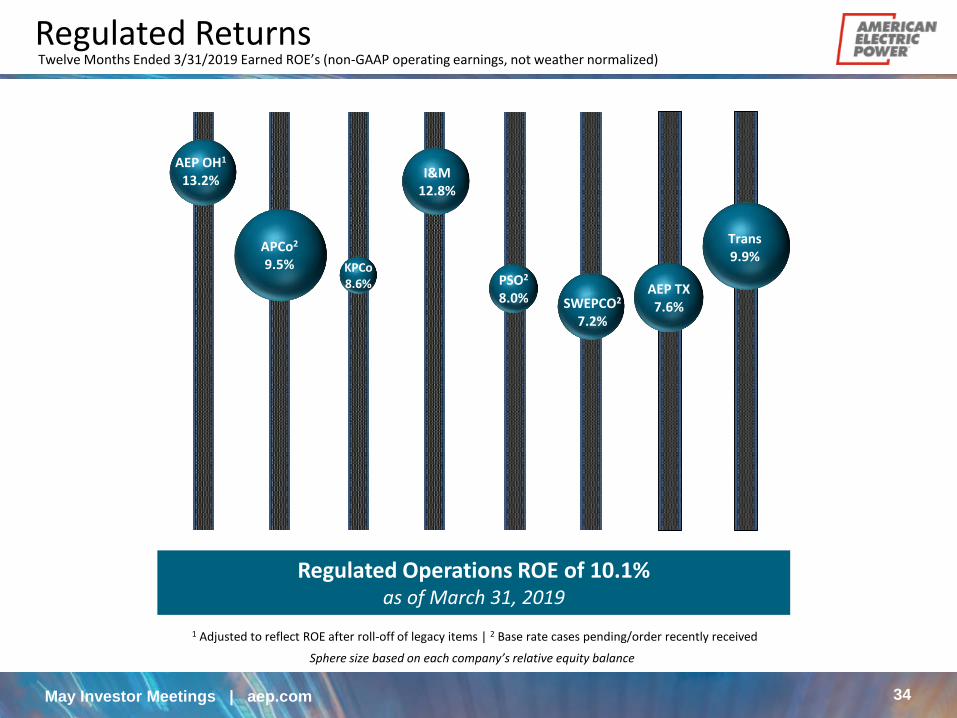
Sphere size based on each company’s relative equity balance
Regulated Operations ROE of 10.1%as of March 31, 2019
1 Adjusted to reflect ROE after roll-off of legacy items | 2 Base rate cases pending/order recently received
AEP OH1
13.2%
APCo2
9.5% KPCo8.6%
I&M12.8%
PSO2
8.0% SWEPCO2
7.2%
AEP TX7.6%
Trans9.9%
Regulated ReturnsTwelve Months Ended 3/31/2019 Earned ROE’s (non-GAAP operating earnings, not weather normalized)

35May Investor Meetings | aep.com
Current Rate Case Activity
SWEPCO – Arkansas1
Docket #: 19-008-UFiling Date: 02/28/2019Requested Rate Base: $1.2BRequested ROE: 10.5%Cap Structure: 49.5%D / 50.5%EGross Revenue Increase: $46M2
(Less $12M D&A)Net Revenue Increase: $34MTest Year: 12/31/2018Procedural Schedule:
Staff/Intervenor Filing 07/16/2019Rebuttal Testimony 08/20/2019Hearing 10/21/2019
1 This filing provides SWEPCO’s notice of election to move to an annual formula rate review mechanism
2 Does not include $29M of current riders moving to base or $12M for the requested Distribution Reliability Rider
AEP Texas
Docket #: 49494Filing Date: 05/01/2019Requested Rate Base: $5.0BRequested ROE: 10.5%Cap Structure: 55%D / 45%ERevenue Increase: $35MTest Year: 12/31/2018Procedural Schedule:
Pre-Hearing Conference 05/15/2019
I&M – Indiana
Docket #: 45235Filing Date: 05/14/2019Requested Rate Base: $4.9BRequested ROE: 10.5%Cap Structure: 53.2%D / 46.8%EGross Revenue Increase: $172M
(Less $78M D&A)Net Revenue Increase: $94MTest Year: 2020 Forecasted
36May Investor Meetings | aep.com
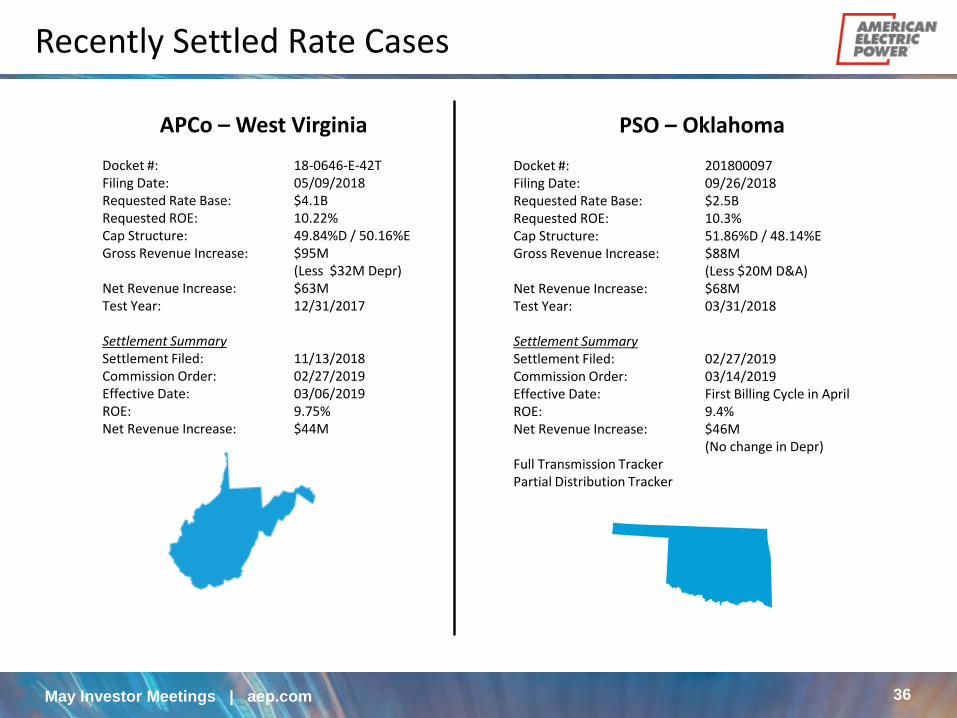
PSO – Oklahoma
Docket #: 201800097Filing Date: 09/26/2018Requested Rate Base: $2.5BRequested ROE: 10.3%Cap Structure: 51.86%D / 48.14%EGross Revenue Increase: $88M
(Less $20M D&A)Net Revenue Increase: $68MTest Year: 03/31/2018
Settlement SummarySettlement Filed: 02/27/2019Commission Order: 03/14/2019Effective Date: First Billing Cycle in AprilROE: 9.4%Net Revenue Increase: $46M
(No change in Depr)Full Transmission TrackerPartial Distribution Tracker
APCo – West Virginia
Docket #: 18-0646-E-42TFiling Date: 05/09/2018Requested Rate Base: $4.1BRequested ROE: 10.22%Cap Structure: 49.84%D / 50.16%EGross Revenue Increase: $95M
(Less $32M Depr)Net Revenue Increase: $63MTest Year: 12/31/2017
Settlement SummarySettlement Filed: 11/13/2018Commission Order: 02/27/2019Effective Date: 03/06/2019ROE: 9.75%Net Revenue Increase: $44M
Recently Settled Rate Cases

37May Investor Meetings | aep.com
3.02.8 2.8
3.1 3.1 3.1
2.8
3.12.9
3.7
2.8
0.0
0.5
1.0
1.5
2.0
2.5
3.0
3.5
4.0
2011A 2012A 2013A 2014A 2015A 2016A 2017A 2018A 2019E 2020E 2021E 2022E
$ B
Actuals / 2019 Plan Inflation @ 2% Bending the Curve Trajectory
O&M targets focus on bending the O&M curve down to create rate headroom
O&M actual spend represents adjusting spend throughout the year as needed (e.g., 2017 unfavorable weather resulted in need to pull-back on spend; 2018 favorable weather has created incremental/shifting opportunities)
Inflation
Customer Experience
Cyber Security
Technology & Innovation
Sale of Competitive Generation
Process Improvement & Standardization of Work
Outsourcing
Automation, Digitization, Data Analytics
Strategic Sourcing
Our initiatives will help reduce the cost of the current ~4,000+ employees retiring or leaving over the next 5 years, therebyreducing O&M and allowing us to focus on more value added activities for our customers
Bending the O&M Curve While Achieving Our Strategic Goals

38May Investor Meetings | aep.com
AEP Transmission Spacer Replacement Capital Program
The replacement program avoids approximately $80M in O&M expenditures over time
~150k spacers that are near or at end of life will be replaced as part of a capital program on nearly 1800 miles of 765kV lines over the next 10 years
AEP Station Check In/Check Out Application
The first true mobile application of its kind saves valuable time for field technicians and dispatchers by eliminating nearly 90% of calls into the TDC from field staff entering or exiting secure facilities
On average since implementation ~$500K in labor savings on this activity have been realized
AEP Asset Health Centers Analytical software platform and fleet-wide asset monitoring device
that provides instantaneous data through a robust communications infrastructure
Real-time data helps in making data-driven operating decisions. Improves safety, reduces unplanned equipment outages, helps in planning and optimizing maintenance, and prioritizes renewal decisions about the condition of assets
In use since 2014, AHC has provided performance data on equipment that has allowed Transmission to avoid $36M and Generation over $25M in costs related to equipment failure
Bending the O&M Curve (Initiatives)
39May Investor Meetings | aep.com
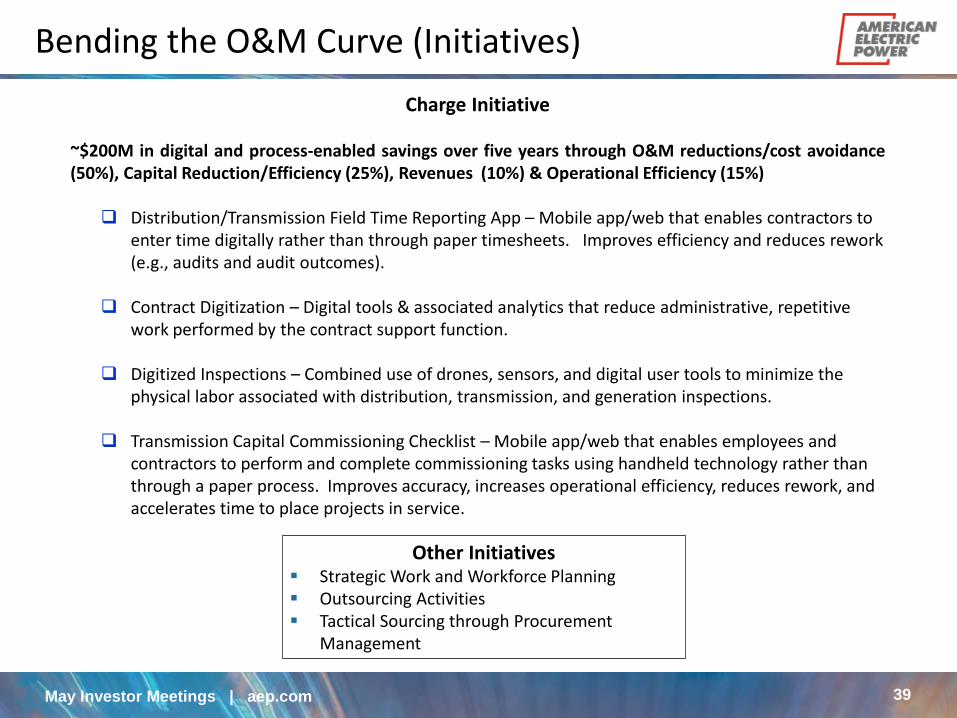
Charge Initiative
~$200M in digital and process-enabled savings over five years through O&M reductions/cost avoidance(50%), Capital Reduction/Efficiency (25%), Revenues (10%) & Operational Efficiency (15%)
Distribution/Transmission Field Time Reporting App – Mobile app/web that enables contractors to enter time digitally rather than through paper timesheets. Improves efficiency and reduces rework (e.g., audits and audit outcomes).
Contract Digitization – Digital tools & associated analytics that reduce administrative, repetitive work performed by the contract support function.
Digitized Inspections – Combined use of drones, sensors, and digital user tools to minimize the physical labor associated with distribution, transmission, and generation inspections.
Transmission Capital Commissioning Checklist – Mobile app/web that enables employees and contractors to perform and complete commissioning tasks using handheld technology rather than through a paper process. Improves accuracy, increases operational efficiency, reduces rework, and accelerates time to place projects in service.
Other Initiatives Strategic Work and Workforce Planning Outsourcing Activities Tactical Sourcing through Procurement
Management
Bending the O&M Curve (Initiatives)

40May Investor Meetings | aep.com
Load figures are provided on a billed basis. Charts reflect connected load and exclude firm wholesale load.
Historical and 2019 data adjusted to reflect reclass of industrial and commercial industry codes for certain customers; no revenue or earnings impact.
Normalized Load Trends
41May Investor Meetings | aep.com
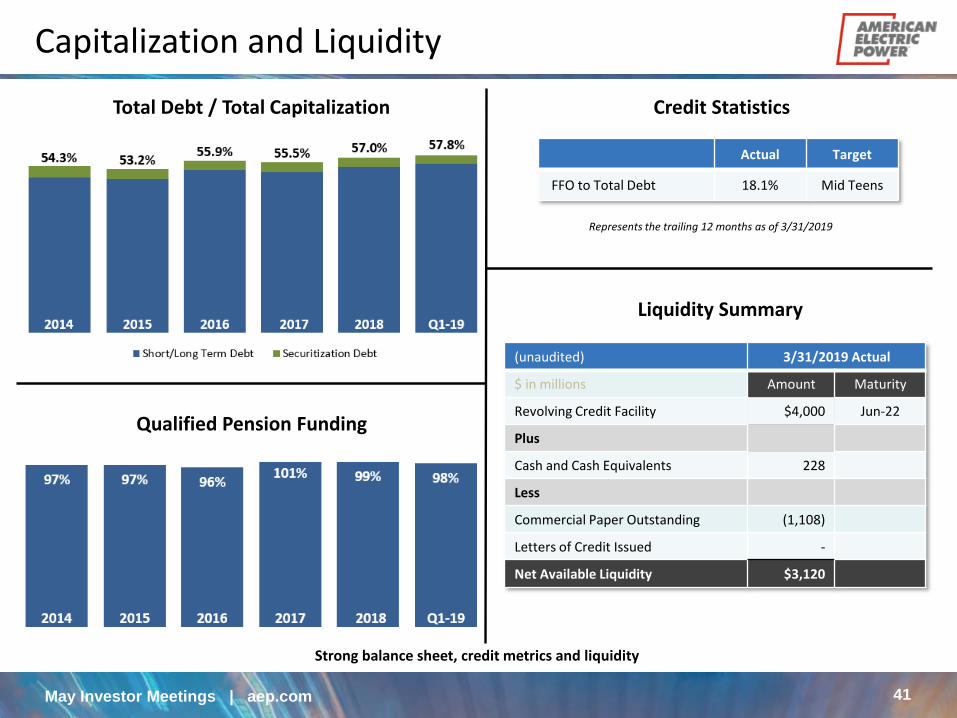
(unaudited) 3/31/2019 Actual
$ in millions Amount Maturity
Revolving Credit Facility $4,000 Jun-22
Plus
Cash and Cash Equivalents 228
Less
Commercial Paper Outstanding (1,108)
Letters of Credit Issued -
Net Available Liquidity $3,120
Liquidity Summary
Credit StatisticsTotal Debt / Total Capitalization
Strong balance sheet, credit metrics and liquidity
Qualified Pension Funding
Actual Target
FFO to Total Debt 18.1% Mid Teens
Represents the trailing 12 months as of 3/31/2019
Capitalization and Liquidity
42May Investor Meetings | aep.com
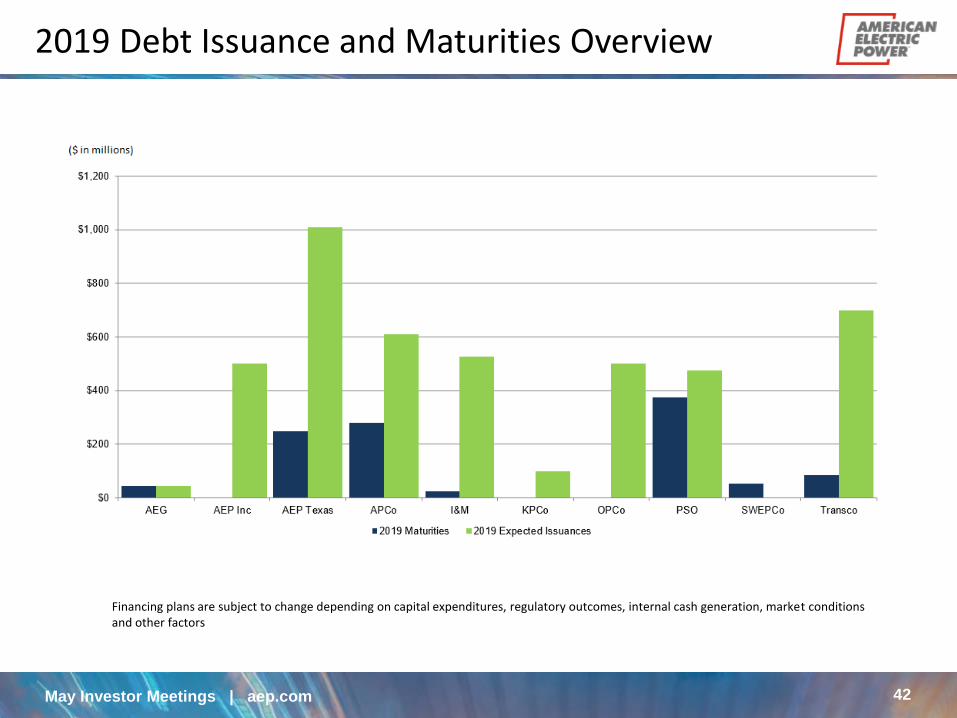
2019 Debt Issuance and Maturities Overview
Financing plans are subject to change depending on capital expenditures, regulatory outcomes, internal cash generation, market conditions and other factors
43May Investor Meetings | aep.com
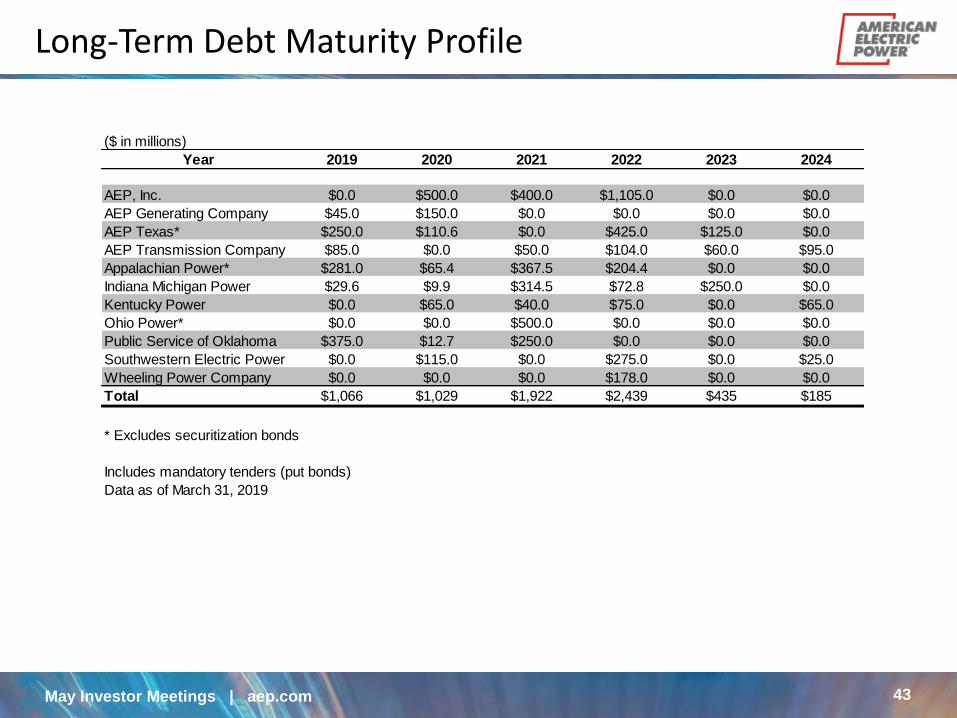
Long-Term Debt Maturity Profile
Year 2019 2020 2021 2022 2023 2024
AEP, Inc. $0.0 $500.0 $400.0 $1,105.0 $0.0 $0.0
AEP Generating Company $45.0 $150.0 $0.0 $0.0 $0.0 $0.0
AEP Texas* $250.0 $110.6 $0.0 $425.0 $125.0 $0.0
AEP Transmission Company $85.0 $0.0 $50.0 $104.0 $60.0 $95.0
Appalachian Power* $281.0 $65.4 $367.5 $204.4 $0.0 $0.0
Indiana Michigan Power $29.6 $9.9 $314.5 $72.8 $250.0 $0.0
Kentucky Power $0.0 $65.0 $40.0 $75.0 $0.0 $65.0
Ohio Power* $0.0 $0.0 $500.0 $0.0 $0.0 $0.0
Public Service of Oklahoma $375.0 $12.7 $250.0 $0.0 $0.0 $0.0
Southwestern Electric Power $0.0 $115.0 $0.0 $275.0 $0.0 $25.0
Wheeling Power Company $0.0 $0.0 $0.0 $178.0 $0.0 $0.0
Total $1,066 $1,029 $1,922 $2,439 $435 $185
* Excludes securitization bonds
Includes mandatory tenders (put bonds)
Data as of March 31, 2019
($ in millions)
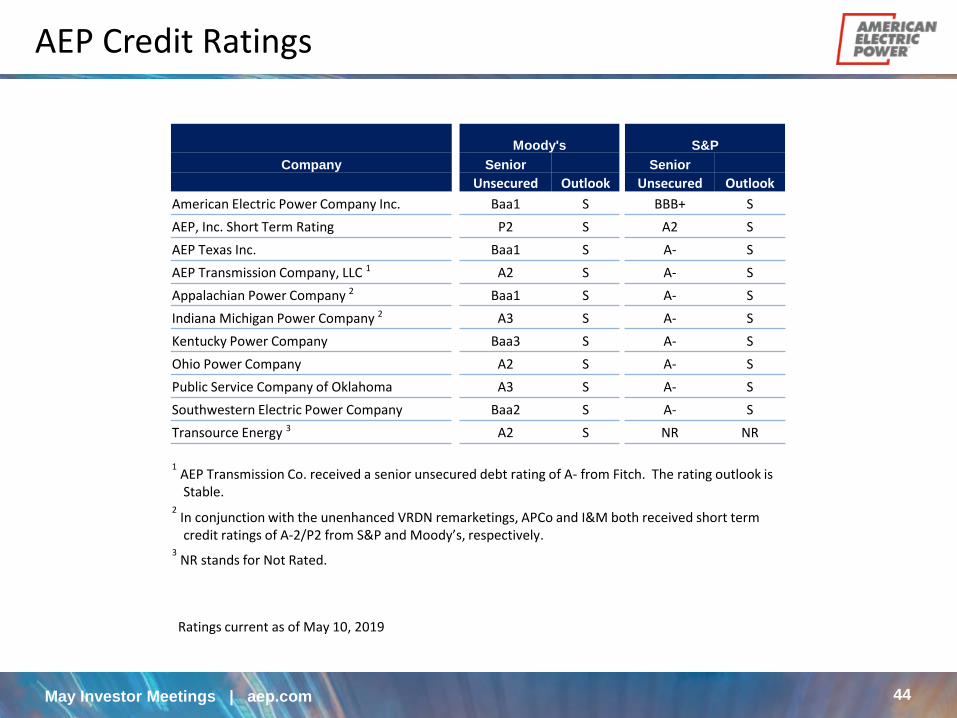
44May Investor Meetings | aep.com
Ratings current as of May 10, 2019
Moody's S&P
Company Senior Senior
Unsecured Outlook Unsecured Outlook
American Electric Power Company Inc. Baa1 S BBB+ S
AEP, Inc. Short Term Rating P2 S A2 S
AEP Texas Inc. Baa1 S A- S
AEP Transmission Company, LLC 1 A2 S A- S
Appalachian Power Company 2 Baa1 S A- S
Indiana Michigan Power Company 2 A3 S A- S
Kentucky Power Company Baa3 S A- S
Ohio Power Company A2 S A- S
Public Service Company of Oklahoma A3 S A- S
Southwestern Electric Power Company Baa2 S A- S
Transource Energy 3 A2 S NR NR
1AEP Transmission Co. received a senior unsecured debt rating of A- from Fitch. The rating outlook is Stable.
2In conjunction with the unenhanced VRDN remarketings, APCo and I&M both received short term credit ratings of A-2/P2 from S&P and Moody’s, respectively.
3NR stands for Not Rated.
AEP Credit Ratings

45May Investor Meetings | aep.com
SUSTAINABLE FUTURE
46May Investor Meetings | aep.com
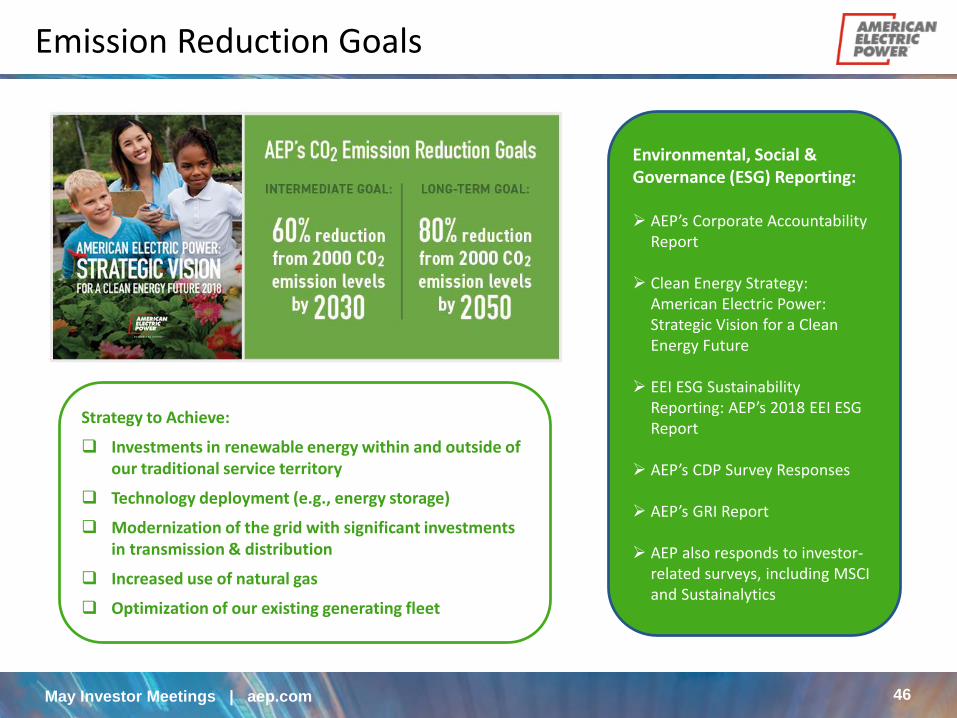
Environmental, Social & Governance (ESG) Reporting:
AEP’s Corporate Accountability Report
Clean Energy Strategy: American Electric Power: Strategic Vision for a Clean Energy Future
EEI ESG Sustainability Reporting: AEP’s 2018 EEI ESG Report
AEP’s CDP Survey Responses
AEP’s GRI Report
AEP also responds to investor-related surveys, including MSCI and Sustainalytics
Strategy to Achieve:
Investments in renewable energy within and outside of our traditional service territory
Technology deployment (e.g., energy storage)
Modernization of the grid with significant investments in transmission & distribution
Increased use of natural gas
Optimization of our existing generating fleet
Emission Reduction Goals

47May Investor Meetings | aep.com
66%
22%
7%4%
1%
70%
19%
6% 4%1%
46%
27%
7%
16%
4%
27%
22%
7%
40%
4%
0%
10%
20%
30%
40%
50%
60%
70%
80%
36% 3%
NuclearNatural GasCoal Hydro, Wind, Solar & Pumped
Energy Efficiency / Demand Response
39%
Cap
acit
y
1999 2005 2019 Future
No ChangeNo Change
Transforming Our Generation Fleet
1999 2005 2019 Future 1999 2005 2019 Future 1999 2005 2019 Future 1999 2005 2019 Future
2019 includes expected capacity as of yearend 2019. Future includes IRP forecasted additions and retirements through 2030. Energy Efficiency / Demand Response represents avoided capacity rather than physical assets.
48May Investor Meetings | aep.com
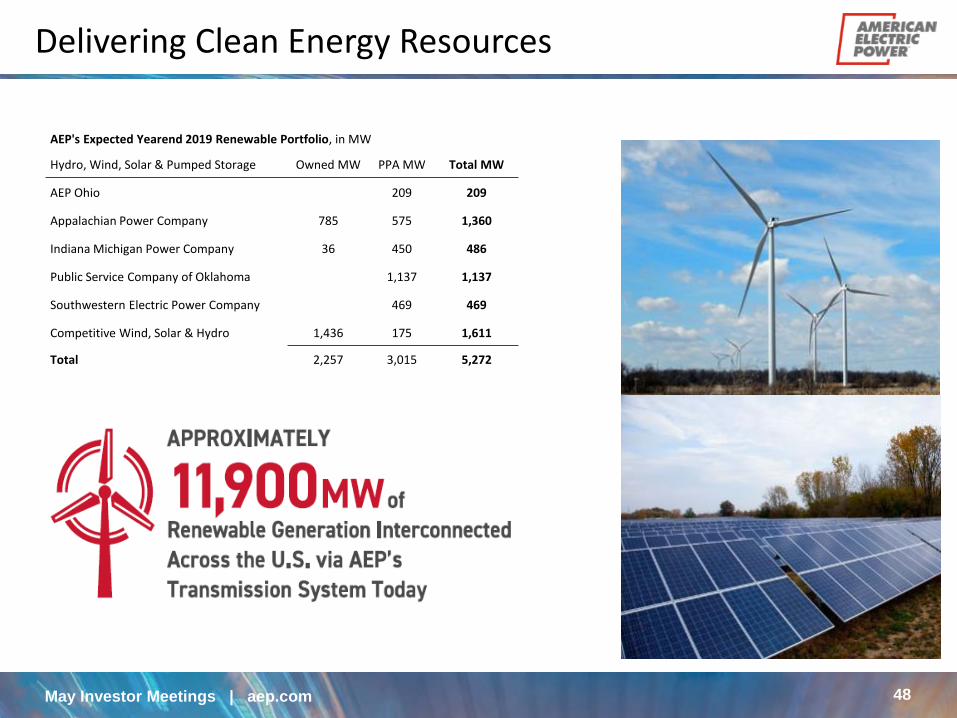
AEP's Expected Yearend 2019 Renewable Portfolio, in MW
Hydro, Wind, Solar & Pumped Storage Owned MW PPA MW Total MW
AEP Ohio 209 209
Appalachian Power Company 785 575 1,360
Indiana Michigan Power Company 36 450 486
Public Service Company of Oklahoma 1,137 1,137
Southwestern Electric Power Company 469 469
Competitive Wind, Solar & Hydro 1,436 175 1,611
Total 2,257 3,015 5,272
Delivering Clean Energy Resources

49May Investor Meetings | aep.com
Largest Investment in Environmental Controls

50May Investor Meetings | aep.com
SO2
92%
96%
1990-2018ACTUAL
NOx
Hg 95%
2001-2018ACTUAL
Dramatic Reductions in Emissions

51May Investor Meetings | aep.com
CO2
2000-2018Actual
59%
Dramatic Reductions in Emissions
52May Investor Meetings | aep.com
HIGHERgrowth
HIGHERdividends
MOREregulated
MOREcertainty
The Premier Regulated Energy Company
Positioned to Deliver Superior RiskAdjusted Returns


