Investor Presentation 2Q21/1H21 Financial Performance
Analyst Meeting July 21, 2021
2
Integration Update
Relief Program Update
2Q21/1H21 Performance & Asset Quality
3
Executive summary - Successful EBT
Thailand kicked start 2Q21 with the resurgence of Covid-19 epidemic that put even more pressure on business environment throughout
the quarter. Nonetheless, with a well-executed integration roadmap, a clear strategic direction to preserve balance sheet quality for
future growth and most importantly our TTB people, 2Q21 top priorities were delivered as plan.
➢ Successful EBT : Fully integrated as one bank under the name TMBThanachart Bank (TTB)
▪ The successful EBT mission in 18-month timeline on 5th July 2021 reflects the readiness and strength of our organization as well as our
harmonized teamwork.
▪ Short-term and quick-win synergies were realized as plan especially from Balance Sheet Synergy and Cost Synergy.
▪ With a unique position built by the complimentary strengths of the 2 Banks, next step is to capture short and medium term synergy value
post-EBT.
4
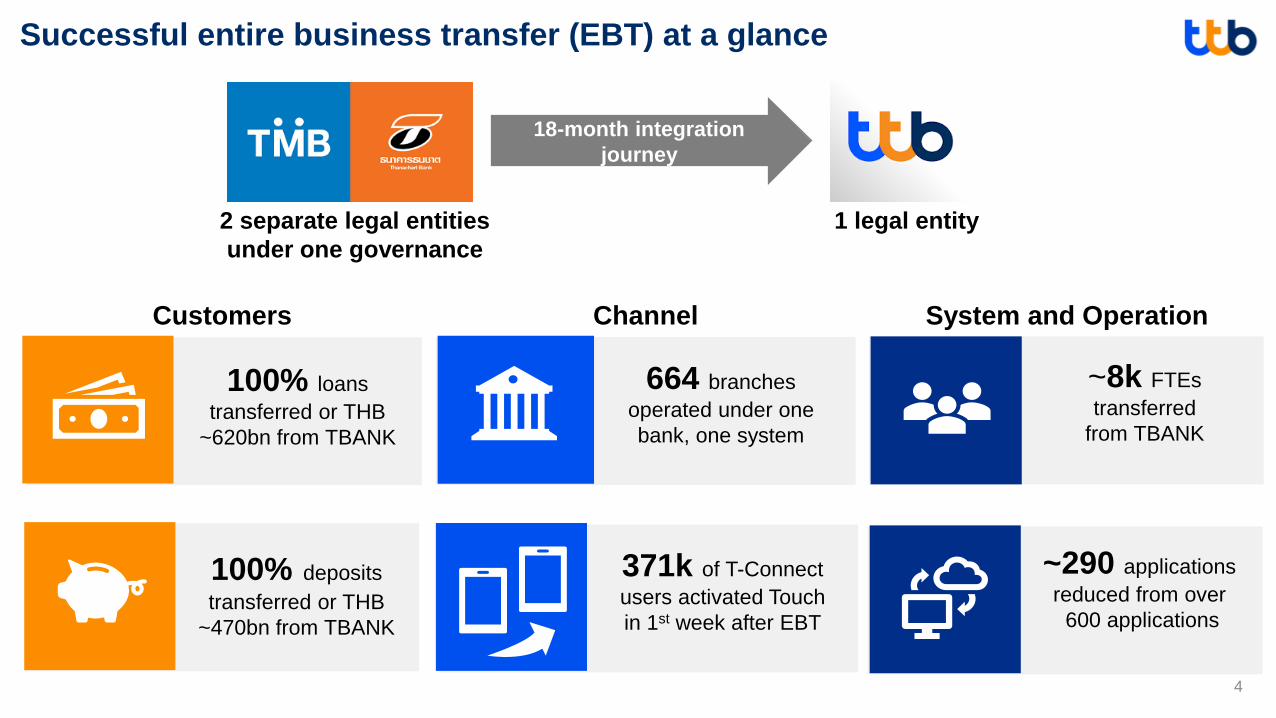
Successful entire business transfer (EBT) at a glance
664 branches
operated under one
bank, one system
~8k FTEs
transferred
from TBANK
100% loans
transferred or THB
~620bn from TBANK
100% deposits
transferred or THB
~470bn from TBANK
371k of T-Connect
users activated Touch
in 1st week after EBT
~290 applications
reduced from over
600 applications
ChannelCustomers System and Operation
1 legal entity2 separate legal entities
under one governance
18-month integration
journey
5
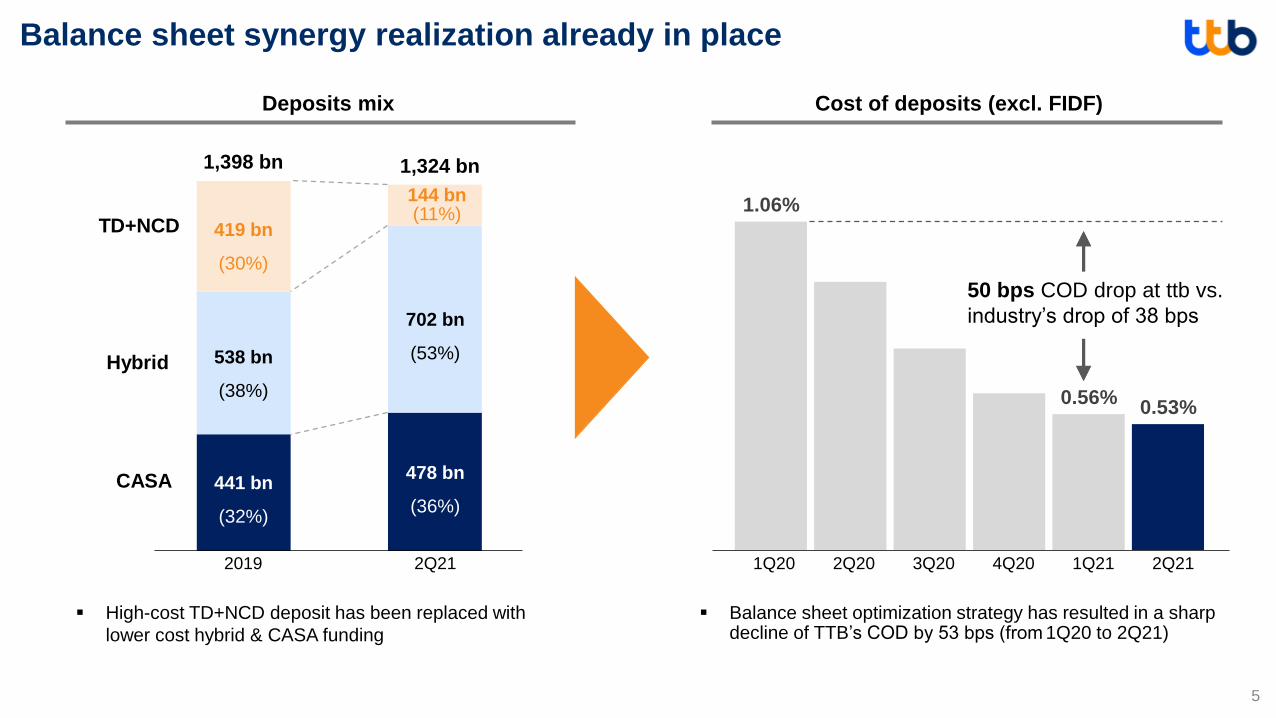
419 bn
(30%)
441 bn
(32%)
538 bn
(38%)
TD+NCD
Hybrid
CASA
2019
1.06%
0.56%0.53%
Cost of deposits (excl. FIDF)Deposits mix
▪ Balance sheet optimization strategy has resulted in a sharp decline of TTB’s COD by 53 bps (from 1Q20 to 2Q21)
1Q20 2Q20 3Q20 4Q20 1Q21 2Q21
144 bn (11%)
478 bn
(36%)
702 bn
(53%)
2Q21
▪ High-cost TD+NCD deposit has been replaced with
lower cost hybrid & CASA funding
1,324 bn1,398 bn
Balance sheet synergy realization already in place
50 bps COD drop at ttb vs.
industry’s drop of 38 bps
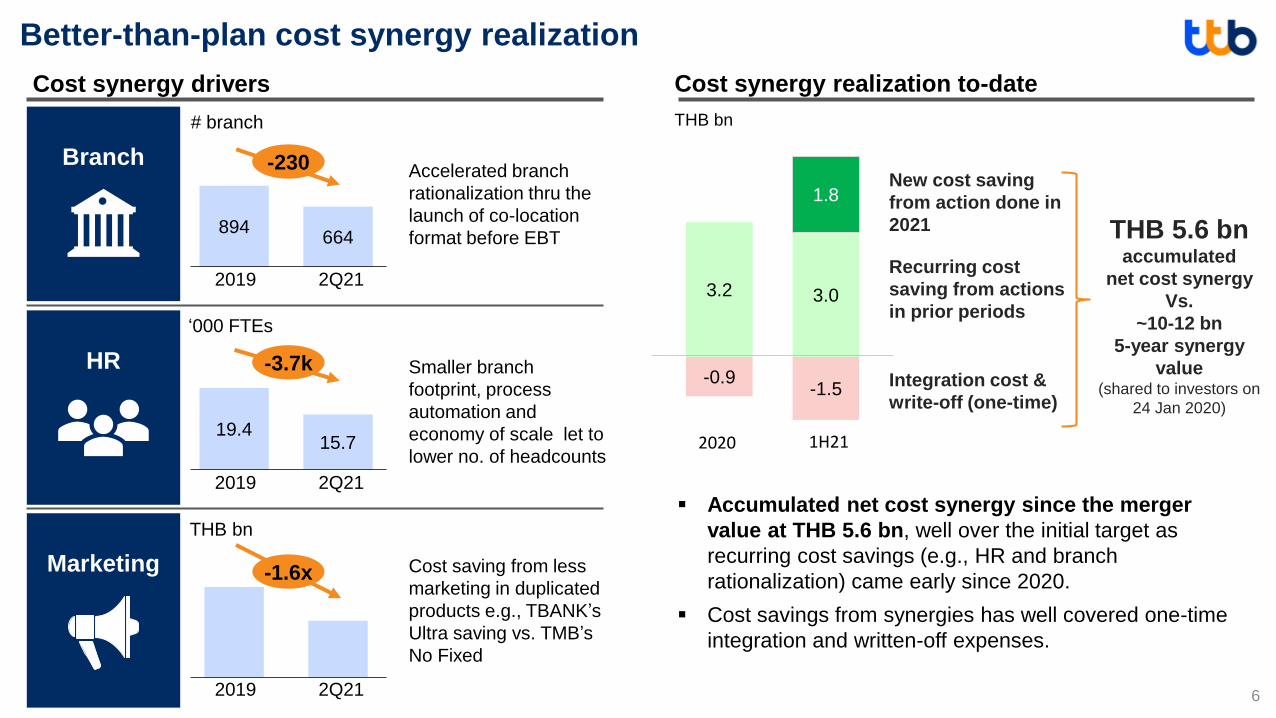
3.2 3.0
1.8
-0.9-1.5
2019 2Q21
-1.6x
THB bn
Cost saving from less
marketing in duplicated
products e.g., TBANK’s
Ultra saving vs. TMB’s
No Fixed
Accelerated branch
rationalization thru the
launch of co-location
format before EBT894
664
2019 2Q21
19.415.7
2019 2Q21
Branch
HR
Marketing
-230
-3.7k
# branch
‘000 FTEs
Smaller branch
footprint, process
automation and
economy of scale let to
lower no. of headcounts
6
▪ Accumulated net cost synergy since the merger
value at THB 5.6 bn, well over the initial target as
recurring cost savings (e.g., HR and branch
rationalization) came early since 2020.
▪ Cost savings from synergies has well covered one-time
integration and written-off expenses.
2020 1H21
Cost synergy realization to-date
THB bn
Integration cost &
write-off (one-time)
Recurring cost
saving from actions
in prior periods
New cost saving
from action done in
2021 THB 5.6 bn accumulated
net cost synergy
Vs.
~10-12 bn
5-year synergy
value(shared to investors on
24 Jan 2020)
Better-than-plan cost synergy realization
Cost synergy drivers
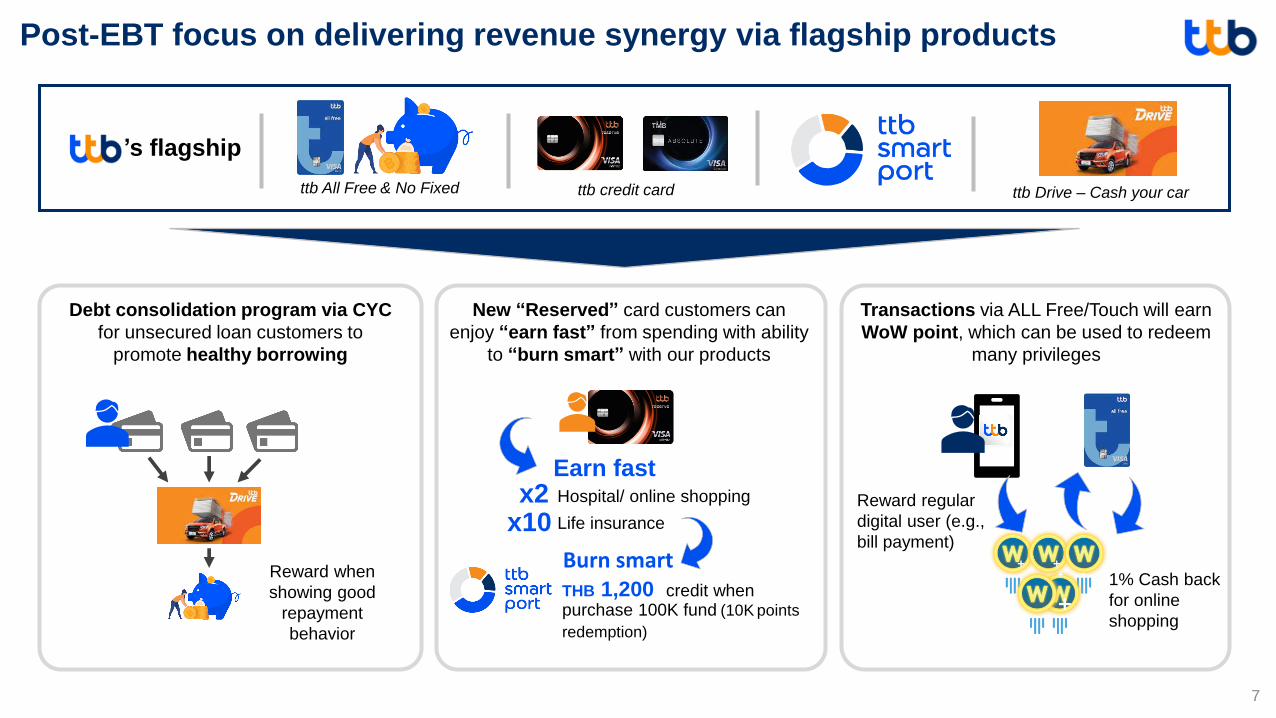
Earn fast
Burn smart
Debt consolidation program via CYC
for unsecured loan customers to
promote healthy borrowing
New “Reserved” card customers can
enjoy “earn fast” from spending with ability
to “burn smart” with our products
Transactions via ALL Free/Touch will earn
WoW point, which can be used to redeem
many privileges
Reward regular
digital user (e.g.,
bill payment)
x2x10
Hospital/ online shopping
Life insurance
THB 1,200 credit when purchase 100K fund (10K points
redemption)
Reward when
showing good
repayment
behavior
1% Cash back
for online
shopping
’s flagship
ttb All Free & No Fixed ttb credit card ttb Drive – Cash your car
7
Post-EBT focus on delivering revenue synergy via flagship products
8
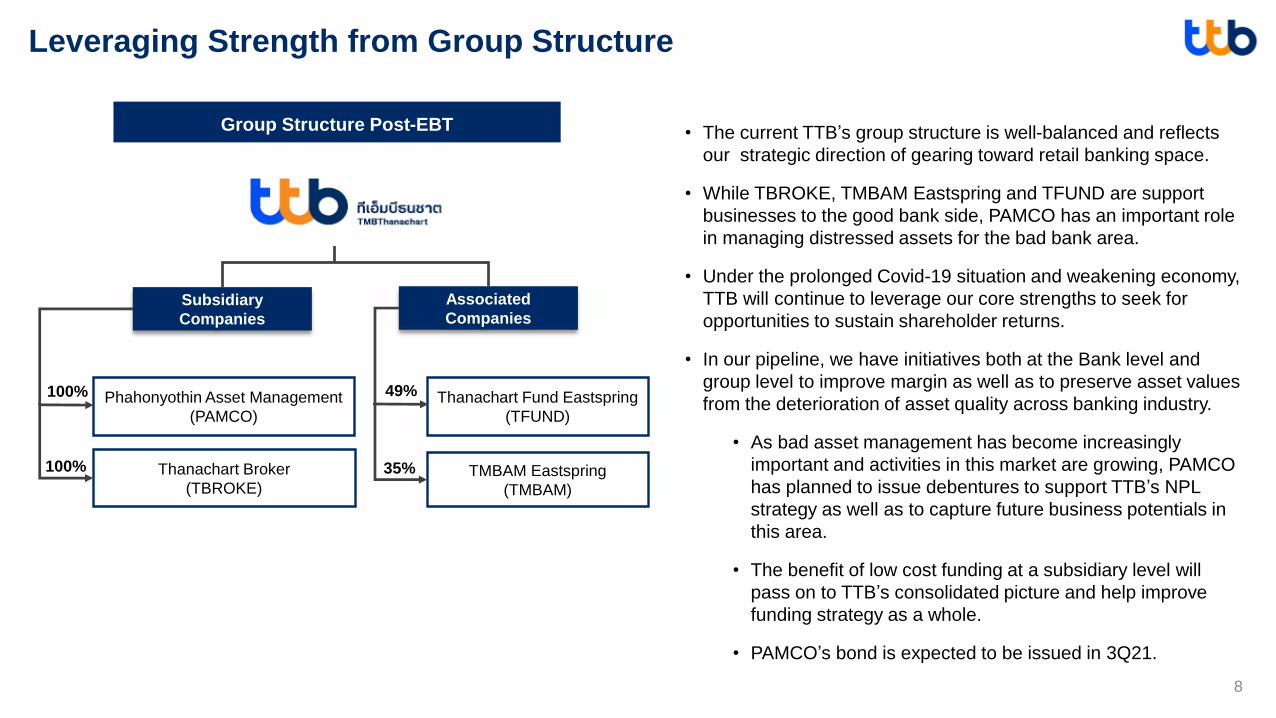
Leveraging Strength from Group Structure
Group Structure Post-EBT
Associated
Companies
Phahonyothin Asset Management
(PAMCO)
Subsidiary
Companies
TMBAM Eastspring
(TMBAM)
Thanachart Broker
(TBROKE)
Thanachart Fund Eastspring
(TFUND)
100% 49%
100% 35%
• The current TTB’s group structure is well-balanced and reflects
our strategic direction of gearing toward retail banking space.
• While TBROKE, TMBAM Eastspring and TFUND are support
businesses to the good bank side, PAMCO has an important role
in managing distressed assets for the bad bank area.
• Under the prolonged Covid-19 situation and weakening economy,
TTB will continue to leverage our core strengths to seek for
opportunities to sustain shareholder returns.
• In our pipeline, we have initiatives both at the Bank level and
group level to improve margin as well as to preserve asset values
from the deterioration of asset quality across banking industry.
• As bad asset management has become increasingly
important and activities in this market are growing, PAMCO
has planned to issue debentures to support TTB’s NPL
strategy as well as to capture future business potentials in
this area.
• The benefit of low cost funding at a subsidiary level will
pass on to TTB’s consolidated picture and help improve
funding strategy as a whole.
• PAMCO’s bond is expected to be issued in 3Q21.
9
Integration Update
Relief Program Update
2Q21/1H21 Performance & Asset Quality
➢ 2Q21 Performance : Focusing on funding optimization and cost discipline against revenue pressure. Asset quality in line with target.
▪ NII and NIM was fairly stabilized QoQ as funding optimization helped reduce pressure from a slowdown in asset growth and yields.
Expecting economic headwinds, our intention is to selectively grow loans to preserve B/S quality and to mitigate risk on NII recognition by
adjusting accounting estimates to be more conservative.
▪ Non-NII was weighted down by Covid-19 situation and partly by our quality growth strategy. Despite short-term hiccup, we continue to
develop our fee-base product and service with an aim to build recurring fee income for the long run.
▪ C/I ratio stayed within target as we have been consistent with cost discipline. In 2H21, there will be remaining EBT expenses such as
rebranding & marketing activities which were postponed due to Covid-19 and subrogation right expenses. In addition, the Bank has set
additional HR expenses related to Covid-19 medical care and health measures such as vaccination, social distancing measures at
branches and operation sites and hospitel for our employees. Therefore, C/I ratio is expected to accelerate in the following quarters but still
in guidance.
▪ Asset quality remained in line with guidance. TTB has emphasized on prudent portfolio management with continued effort to reduce stage
2 and 3 outstanding. We also make sure the ECL model can capture true risk of customers especially those in debt relief program in order
to set aside sufficient and rational ECL.
10
Executive summary - Preserve B/S quality for future growth
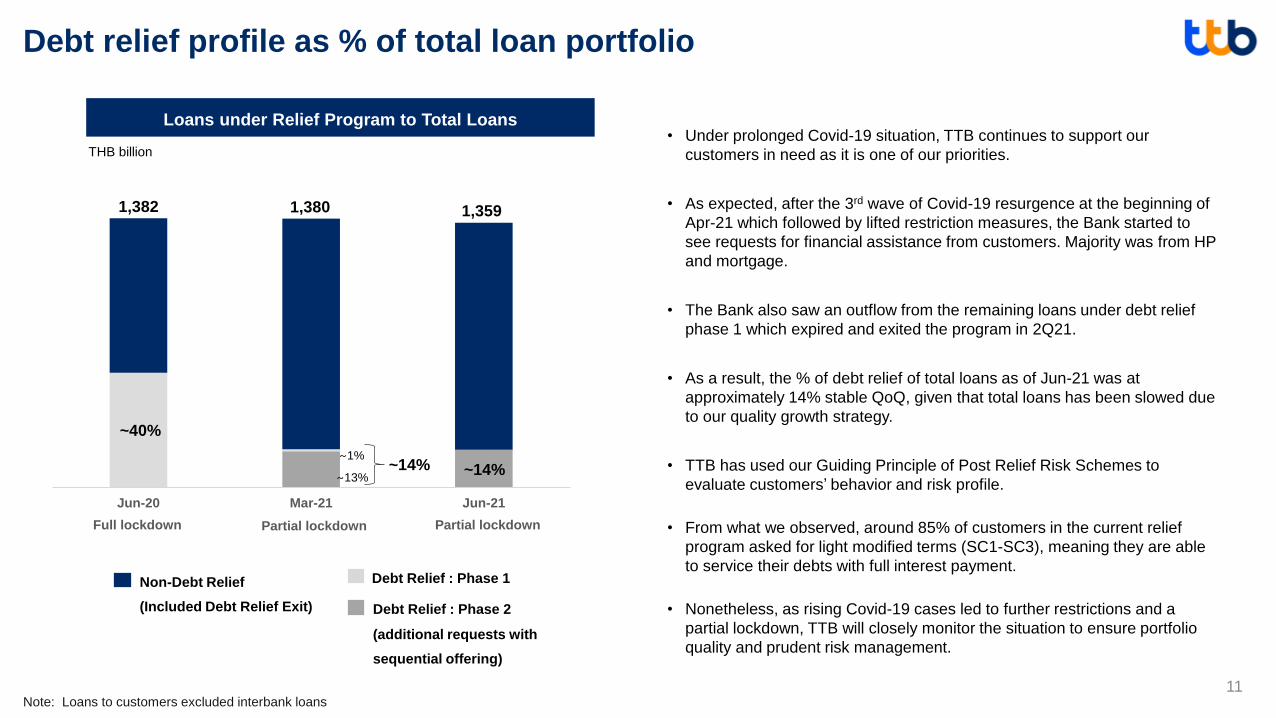
• Under prolonged Covid-19 situation, TTB continues to support our
customers in need as it is one of our priorities.
• As expected, after the 3rd wave of Covid-19 resurgence at the beginning of
Apr-21 which followed by lifted restriction measures, the Bank started to
see requests for financial assistance from customers. Majority was from HP
and mortgage.
• The Bank also saw an outflow from the remaining loans under debt relief
phase 1 which expired and exited the program in 2Q21.
• As a result, the % of debt relief of total loans as of Jun-21 was at
approximately 14% stable QoQ, given that total loans has been slowed due
to our quality growth strategy.
• TTB has used our Guiding Principle of Post Relief Risk Schemes to
evaluate customers’ behavior and risk profile.
• From what we observed, around 85% of customers in the current relief
program asked for light modified terms (SC1-SC3), meaning they are able
to service their debts with full interest payment.
• Nonetheless, as rising Covid-19 cases led to further restrictions and a
partial lockdown, TTB will closely monitor the situation to ensure portfolio
quality and prudent risk management.
Jun-20 Mar-21 Jun-21
11
Debt relief profile as % of total loan portfolio
Non-Debt Relief
(Included Debt Relief Exit)
Debt Relief : Phase 1
Note: Loans to customers excluded interbank loans
Debt Relief : Phase 2
(additional requests with
sequential offering)
1,382 1,359
~40%
~14%~1%
~13%
1,380
~14%
THB billion
Loans under Relief Program to Total Loans
Full lockdown Partial lockdown Partial lockdown
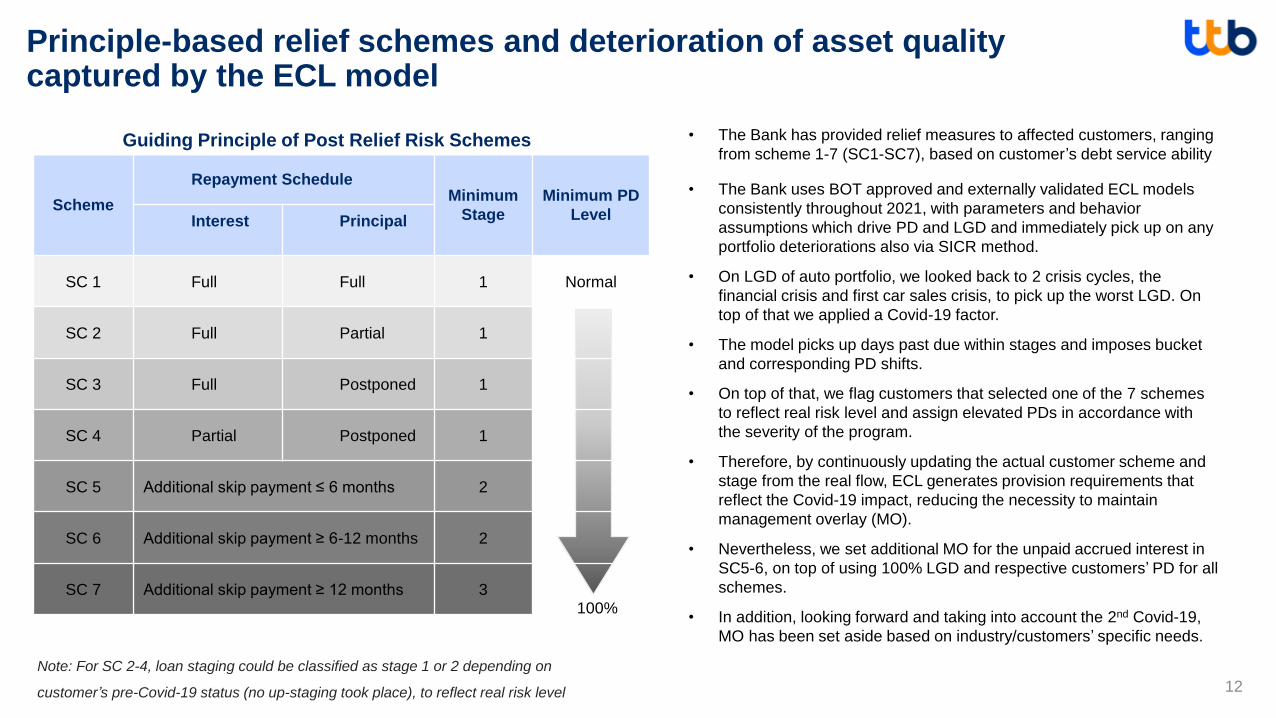
Scheme
Repayment ScheduleMinimum
Stage
Minimum PD
Level Interest Principal
SC 1 Full Full 1 Normal
SC 2 Full Partial 1
SC 3 Full Postponed 1
SC 4 Partial Postponed 1
SC 5 Additional skip payment ≤ 6 months 2
SC 6 Additional skip payment ≥ 6-12 months 2
SC 7 Additional skip payment ≥ 12 months 3
12
Principle-based relief schemes and deterioration of asset quality captured by the ECL model
100%
• The Bank has provided relief measures to affected customers, ranging
from scheme 1-7 (SC1-SC7), based on customer’s debt service ability
• The Bank uses BOT approved and externally validated ECL models
consistently throughout 2021, with parameters and behavior
assumptions which drive PD and LGD and immediately pick up on any
portfolio deteriorations also via SICR method.
• On LGD of auto portfolio, we looked back to 2 crisis cycles, the
financial crisis and first car sales crisis, to pick up the worst LGD. On
top of that we applied a Covid-19 factor.
• The model picks up days past due within stages and imposes bucket
and corresponding PD shifts.
• On top of that, we flag customers that selected one of the 7 schemes
to reflect real risk level and assign elevated PDs in accordance with
the severity of the program.
• Therefore, by continuously updating the actual customer scheme and
stage from the real flow, ECL generates provision requirements that
reflect the Covid-19 impact, reducing the necessity to maintain
management overlay (MO).
• Nevertheless, we set additional MO for the unpaid accrued interest in
SC5-6, on top of using 100% LGD and respective customers’ PD for all
schemes.
• In addition, looking forward and taking into account the 2nd Covid-19,
MO has been set aside based on industry/customers’ specific needs.
Note: For SC 2-4, loan staging could be classified as stage 1 or 2 depending on
customer’s pre-Covid-19 status (no up-staging took place), to reflect real risk level
Guiding Principle of Post Relief Risk Schemes
Jun-20 Mar-21 Jun-21Jun-20 Mar-21 Jun-21Jun-20 Mar-21 Jun-21
Jun-20 Mar-21 Jun-21Jun-20 Mar-21 Jun-21
Jun-20 Mar-21 Jun-21
Jun-20 Mar-21 Jun-21
13
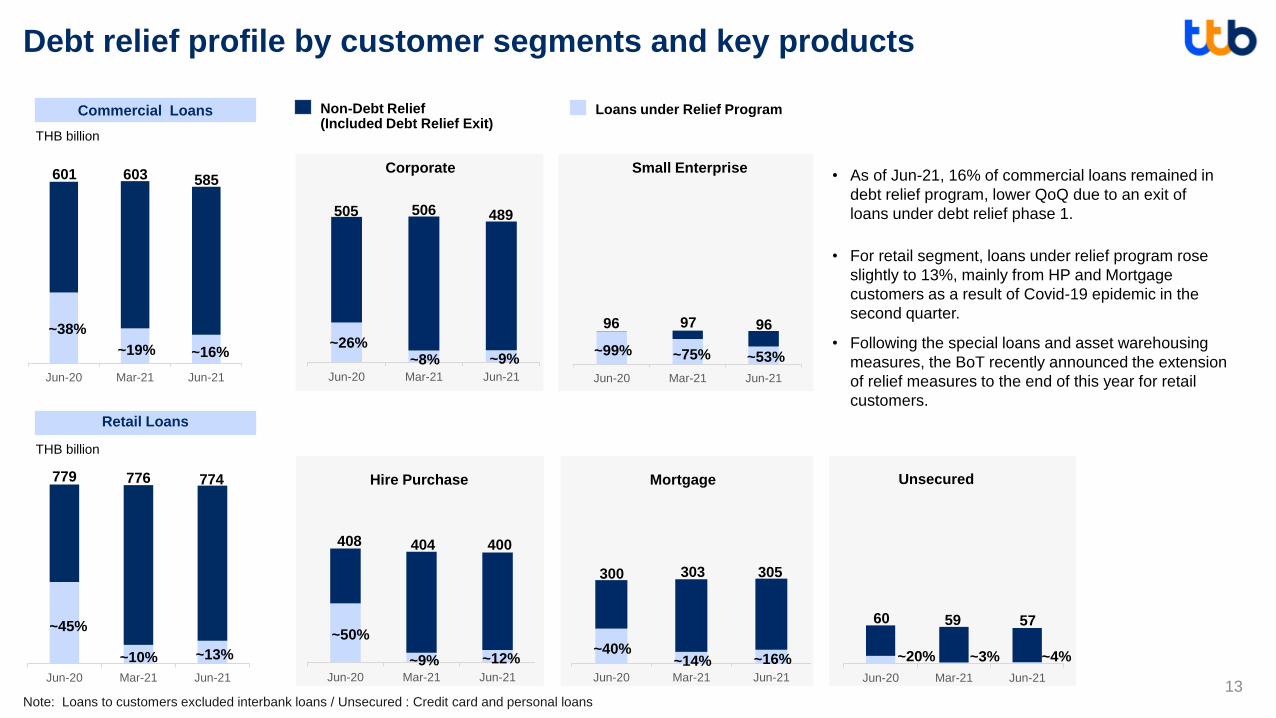
Debt relief profile by customer segments and key products
Commercial Loans
Retail Loans
Hire Purchase Mortgage Unsecured
Corporate Small Enterprise601
~38%
505
~26%
96
~99%
779
~45%~50%
408
~40%
300
~20%
60
Non-Debt Relief (Included Debt Relief Exit)
Loans under Relief Program
Note: Loans to customers excluded interbank loans / Unsecured : Credit card and personal loans
97
• As of Jun-21, 16% of commercial loans remained in
debt relief program, lower QoQ due to an exit of
loans under debt relief phase 1.
• For retail segment, loans under relief program rose
slightly to 13%, mainly from HP and Mortgage
customers as a result of Covid-19 epidemic in the
second quarter.
• Following the special loans and asset warehousing
measures, the BoT recently announced the extension
of relief measures to the end of this year for retail
customers.
603
~19%
THB billion
THB billion
776
~10%
506
~8% ~75%
404
~9%
303
~14%
59
~3%
585
~16%
774
~13%
489
~9% ~53%
96
400
~12%
305
~16%
57
~4%
Mar Apr May Jun Jul Aug Sep Oct Nov Dec Jan Feb Mar Apr May Jun
14
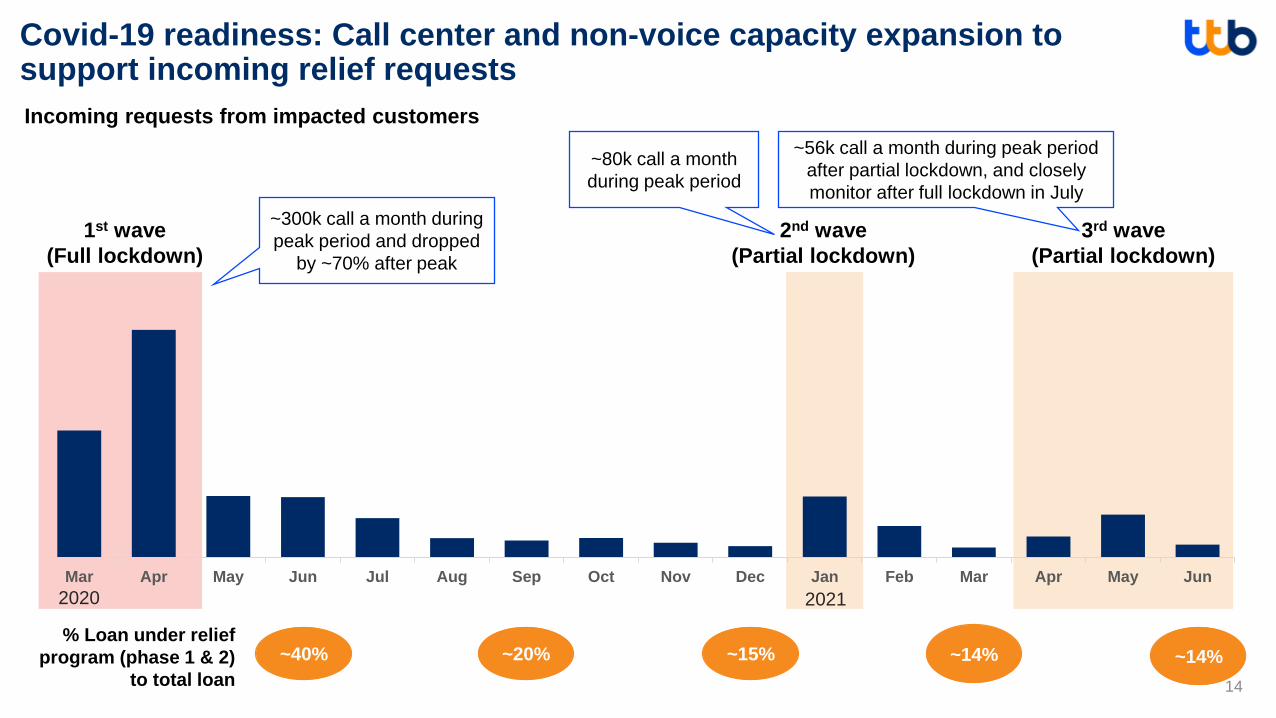
Incoming requests from impacted customers
1st wave
(Full lockdown)
~300k call a month during
peak period and dropped
by ~70% after peak
2nd wave
(Partial lockdown)
~56k call a month during peak period
after partial lockdown, and closely
monitor after full lockdown in July
~40% ~20% ~15% ~14%% Loan under relief
program (phase 1 & 2)
to total loan
~14%
3rd wave
(Partial lockdown)
~80k call a month
during peak period
Covid-19 readiness: Call center and non-voice capacity expansion to support incoming relief requests
2020 2021
15
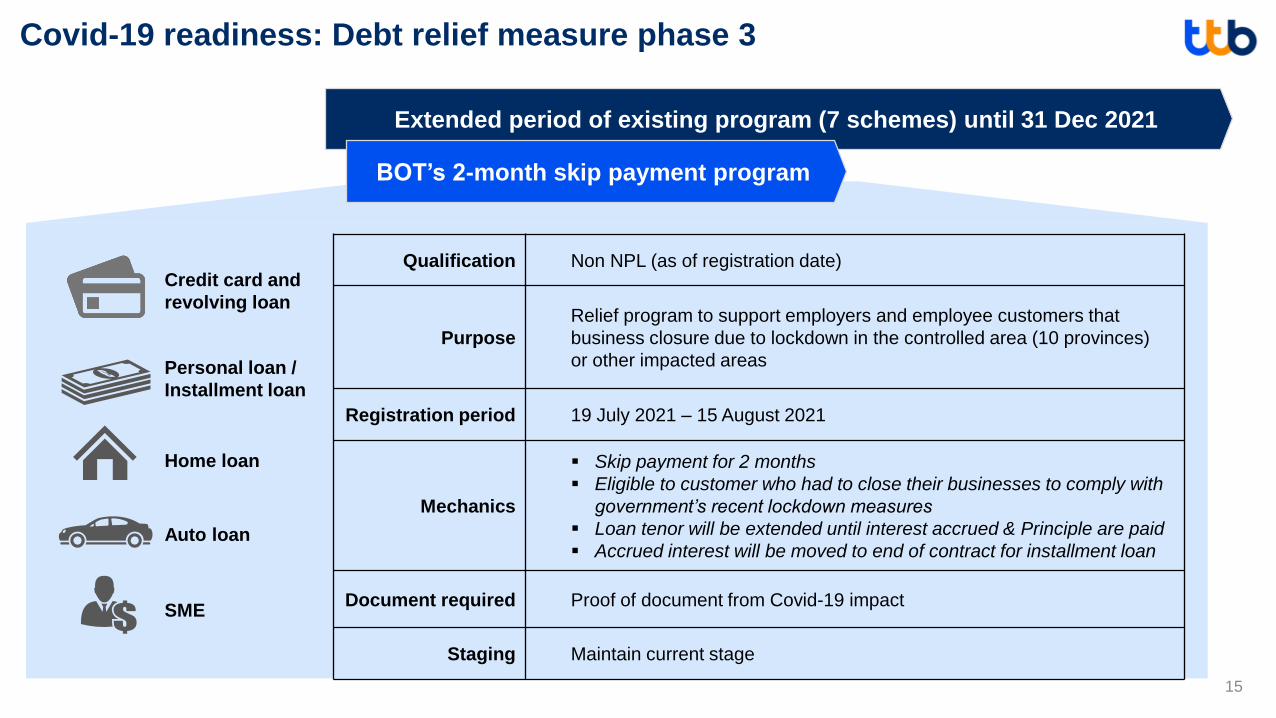
Credit card and
revolving loan
Personal loan /
Installment loan
Home loan
Auto loan
SME
Qualification Non NPL (as of registration date)
Purpose
Relief program to support employers and employee customers that
business closure due to lockdown in the controlled area (10 provinces)
or other impacted areas
Registration period 19 July 2021 – 15 August 2021
Mechanics
▪ Skip payment for 2 months
▪ Eligible to customer who had to close their businesses to comply with
government’s recent lockdown measures
▪ Loan tenor will be extended until interest accrued & Principle are paid
▪ Accrued interest will be moved to end of contract for installment loan
Document required Proof of document from Covid-19 impact
Staging Maintain current stage
Covid-19 readiness: Debt relief measure phase 3
Extended period of existing program (7 schemes) until 31 Dec 2021
BOT’s 2-month skip payment program
16
Integration Update
Relief Program Update
2Q21/1H21 Performance & Asset Quality
Loan
Growth
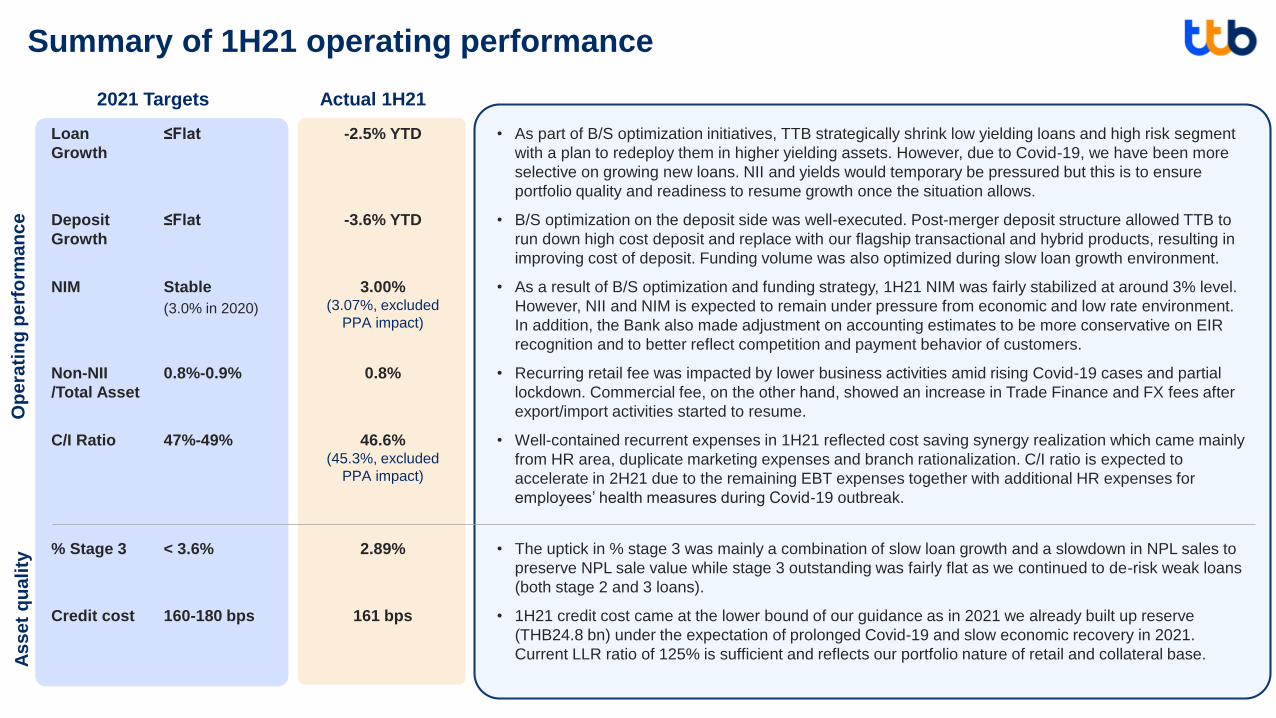
≤Flat -2.5% YTD • As part of B/S optimization initiatives, TTB strategically shrink low yielding loans and high risk segment
with a plan to redeploy them in higher yielding assets. However, due to Covid-19, we have been more
selective on growing new loans. NII and yields would temporary be pressured but this is to ensure
portfolio quality and readiness to resume growth once the situation allows.
Deposit
Growth
≤Flat -3.6% YTD • B/S optimization on the deposit side was well-executed. Post-merger deposit structure allowed TTB to
run down high cost deposit and replace with our flagship transactional and hybrid products, resulting in
improving cost of deposit. Funding volume was also optimized during slow loan growth environment.
NIM Stable
(3.0% in 2020)
3.00%(3.07%, excluded
PPA impact)
• As a result of B/S optimization and funding strategy, 1H21 NIM was fairly stabilized at around 3% level.
However, NII and NIM is expected to remain under pressure from economic and low rate environment.
In addition, the Bank also made adjustment on accounting estimates to be more conservative on EIR
recognition and to better reflect competition and payment behavior of customers.
Non-NII
/Total Asset
0.8%-0.9% 0.8% • Recurring retail fee was impacted by lower business activities amid rising Covid-19 cases and partial
lockdown. Commercial fee, on the other hand, showed an increase in Trade Finance and FX fees after
export/import activities started to resume.
C/I Ratio 47%-49% 46.6% (45.3%, excluded
PPA impact)
• Well-contained recurrent expenses in 1H21 reflected cost saving synergy realization which came mainly
from HR area, duplicate marketing expenses and branch rationalization. C/I ratio is expected to
accelerate in 2H21 due to the remaining EBT expenses together with additional HR expenses for
employees’ health measures during Covid-19 outbreak.
% Stage 3 < 3.6% 2.89% • The uptick in % stage 3 was mainly a combination of slow loan growth and a slowdown in NPL sales to
preserve NPL sale value while stage 3 outstanding was fairly flat as we continued to de-risk weak loans
(both stage 2 and 3 loans).
Credit cost 160-180 bps 161 bps • 1H21 credit cost came at the lower bound of our guidance as in 2021 we already built up reserve
(THB24.8 bn) under the expectation of prolonged Covid-19 and slow economic recovery in 2021.
Current LLR ratio of 125% is sufficient and reflects our portfolio nature of retail and collateral base.
Summary of 1H21 operating performance A
ss
et
qu
ali
tyO
pe
rati
ng
pe
rfo
rma
nc
e
2021 Targets Actual 1H21
Dec-20 Mar-21 Jun-21
18
Maintaining loan quality portfolio against a resurgence of Covid-19
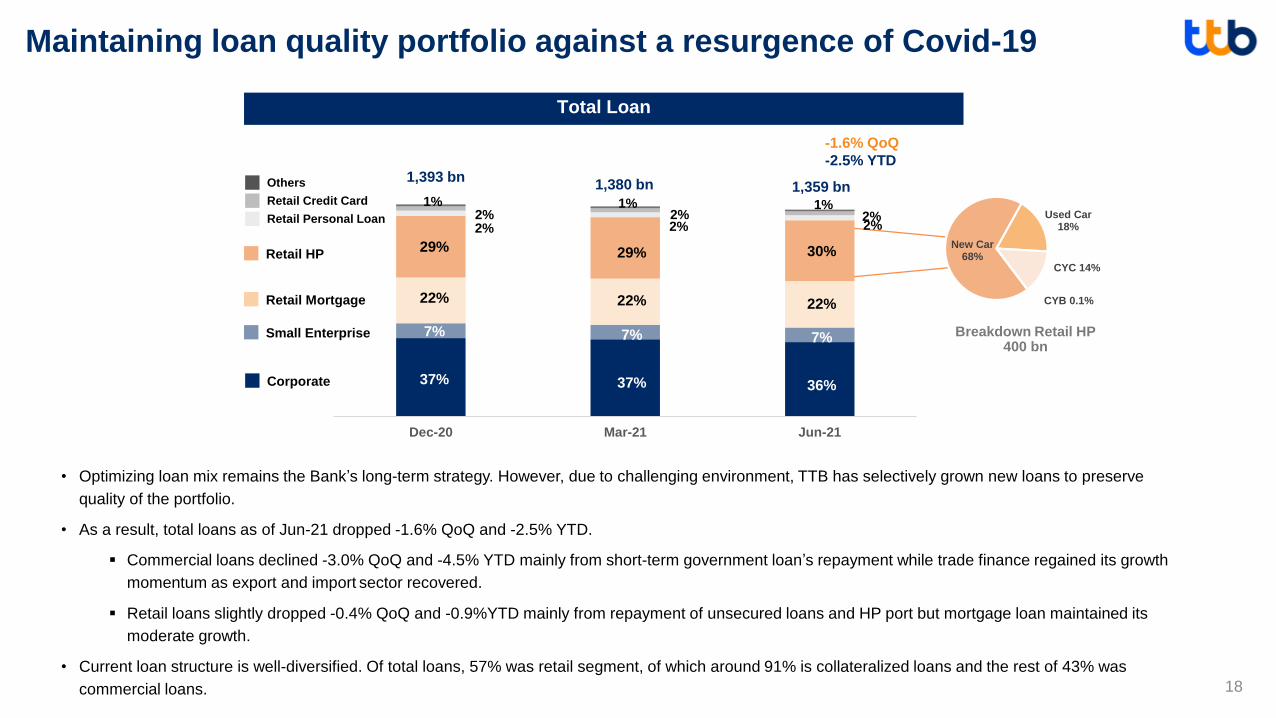
• Optimizing loan mix remains the Bank’s long-term strategy. However, due to challenging environment, TTB has selectively grown new loans to preserve
quality of the portfolio.
• As a result, total loans as of Jun-21 dropped -1.6% QoQ and -2.5% YTD.
▪ Commercial loans declined -3.0% QoQ and -4.5% YTD mainly from short-term government loan’s repayment while trade finance regained its growth
momentum as export and import sector recovered.
▪ Retail loans slightly dropped -0.4% QoQ and -0.9%YTD mainly from repayment of unsecured loans and HP port but mortgage loan maintained its
moderate growth.
• Current loan structure is well-diversified. Of total loans, 57% was retail segment, of which around 91% is collateralized loans and the rest of 43% was
commercial loans.
Total Loan
Corporate
29%
22%
7%
37%
29%
22%
7%
37%
2%2%
1%
1,393 bn
-1.6% QoQ
-2.5% YTD
1,380 bn
2%
1%2%
Small Enterprise
Retail Mortgage
Retail HP
Retail Credit Card
Retail Personal Loan
Others
Breakdown Retail HP 400 bn
1,359 bn
2%
1%2%
30%
22%
7%
36%
New Car68%
Used Car 18%
CYC 14%
CYB 0.1%
Dec-20 Mar-21 Jun-21
19
Deposit strategy and structure improving cost of deposit
Total Deposit
TD+NCD
Hybrid
Saving
Current
1,373 bn
% Retail
deposits
~38%
CASA
76%
~35%
CASA
-4.3% QoQ
-3.6% YTD
32%
6%
29%
51%
14%
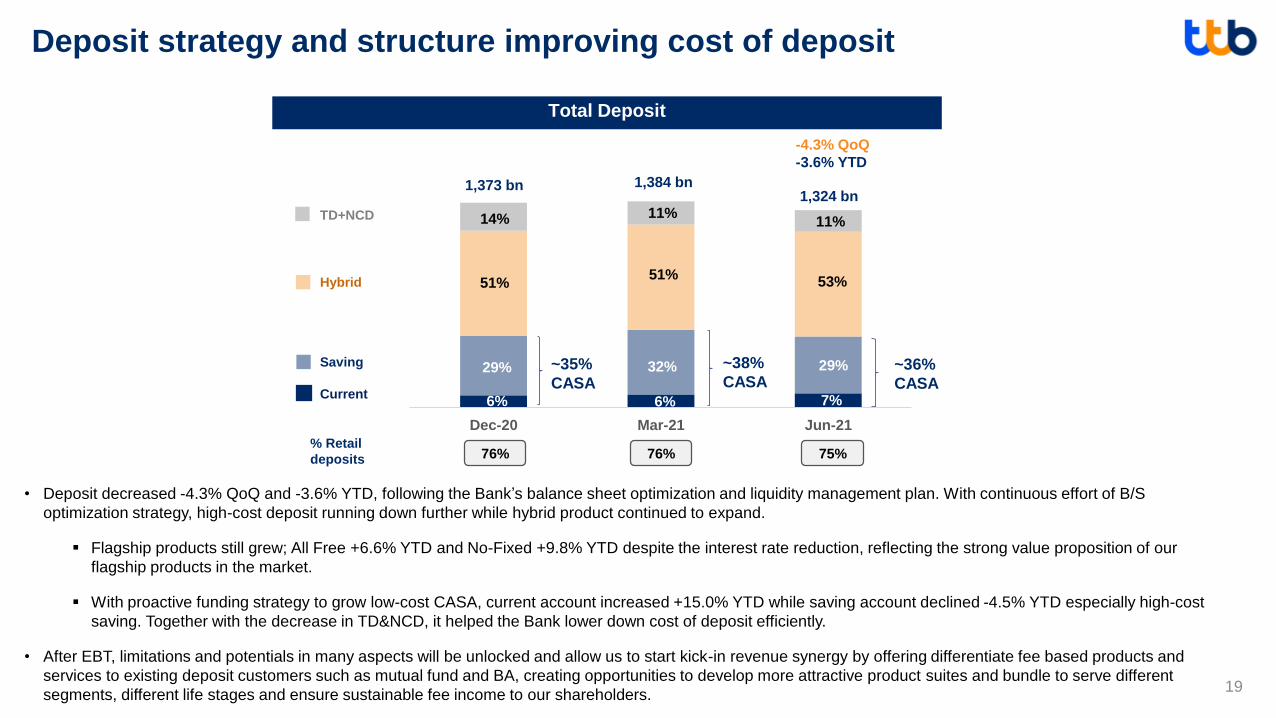
• Deposit decreased -4.3% QoQ and -3.6% YTD, following the Bank’s balance sheet optimization and liquidity management plan. With continuous effort of B/S
optimization strategy, high-cost deposit running down further while hybrid product continued to expand.
▪ Flagship products still grew; All Free +6.6% YTD and No-Fixed +9.8% YTD despite the interest rate reduction, reflecting the strong value proposition of our
flagship products in the market.
▪ With proactive funding strategy to grow low-cost CASA, current account increased +15.0% YTD while saving account declined -4.5% YTD especially high-cost
saving. Together with the decrease in TD&NCD, it helped the Bank lower down cost of deposit efficiently.
• After EBT, limitations and potentials in many aspects will be unlocked and allow us to start kick-in revenue synergy by offering differentiate fee based products and
services to existing deposit customers such as mutual fund and BA, creating opportunities to develop more attractive product suites and bundle to serve different
segments, different life stages and ensure sustainable fee income to our shareholders.
1,384 bn
6%
51%
11%
~36%
CASA29%
53%
7%
11%
76% 75%
1,324 bn
189% 199%219%
179% 183%
0%
100 %
200 %
300 %
Mar-20 Jun-20 Sep-20 Dec-20 Mar-21
BOT Minimum Requirement LCR
295 312 274
101%100%
103%
95% 95%
97%
70.00%
75.00%
80.00%
85.00%
90.00%
95.00%
100.00%
0
200
400
Dec-20 Mar-21 Jun-21
Net Liquid Asset LDR LDR+Borrowing
20
Optimizing balance sheet with healthy liquidity position
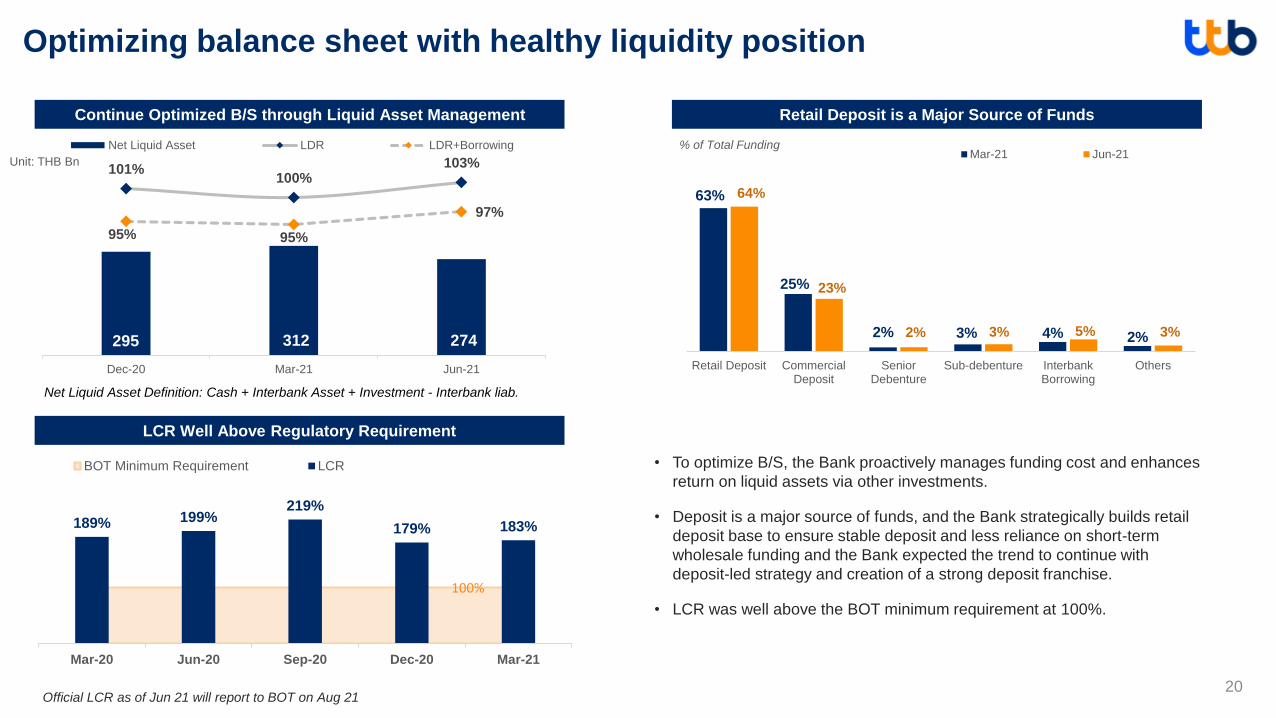
• To optimize B/S, the Bank proactively manages funding cost and enhances
return on liquid assets via other investments.
• Deposit is a major source of funds, and the Bank strategically builds retail
deposit base to ensure stable deposit and less reliance on short-term
wholesale funding and the Bank expected the trend to continue with
deposit-led strategy and creation of a strong deposit franchise.
• LCR was well above the BOT minimum requirement at 100%.
Net Liquid Asset Definition: Cash + Interbank Asset + Investment - Interbank liab.
Continue Optimized B/S through Liquid Asset Management
LCR Well Above Regulatory Requirement
Retail Deposit is a Major Source of Funds
Unit: THB Bn
% of Total Funding
Official LCR as of Jun 21 will report to BOT on Aug 21
100%
63%
25%
2% 3% 4% 2%
64%
23%
2% 3% 5% 3%
Retail Deposit CommercialDeposit
SeniorDebenture
Sub-debenture InterbankBorrowing
Others
Mar-21 Jun-21
21
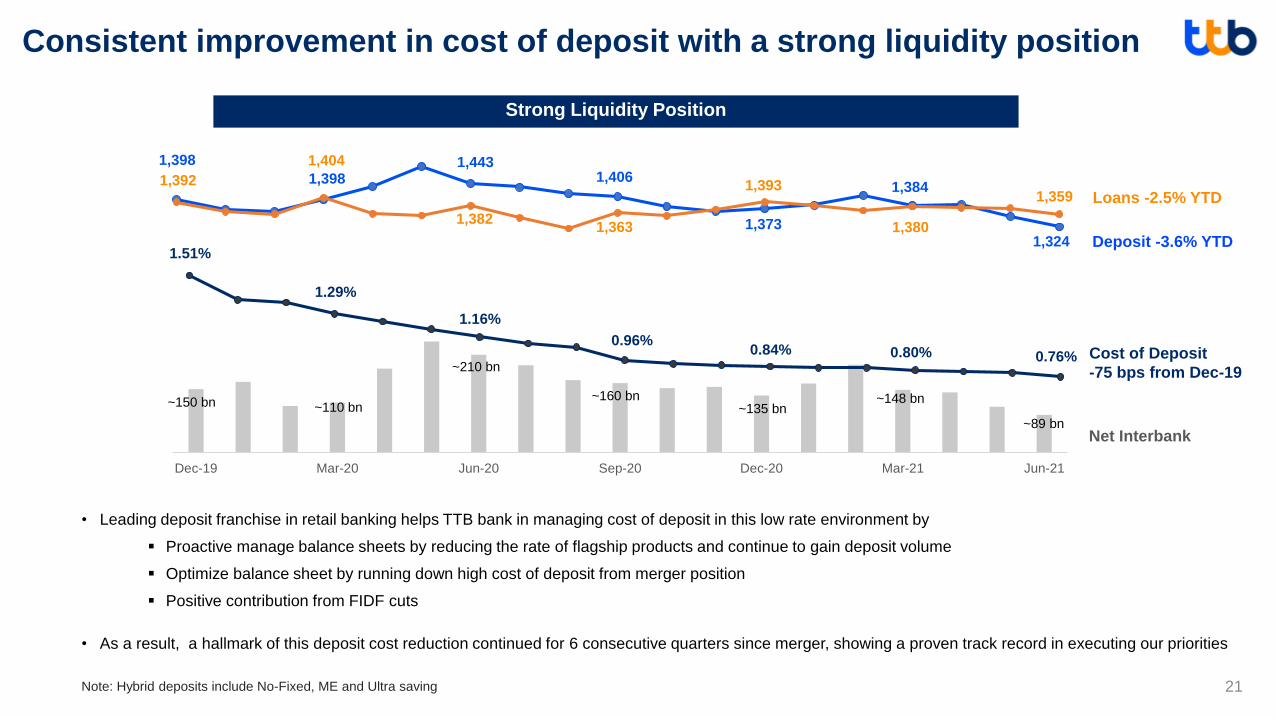
Consistent improvement in cost of deposit with a strong liquidity position
Net Interbank
Strong Liquidity Position
• Leading deposit franchise in retail banking helps TTB bank in managing cost of deposit in this low rate environment by
▪ Proactive manage balance sheets by reducing the rate of flagship products and continue to gain deposit volume
▪ Optimize balance sheet by running down high cost of deposit from merger position
▪ Positive contribution from FIDF cuts
• As a result, a hallmark of this deposit cost reduction continued for 6 consecutive quarters since merger, showing a proven track record in executing our priorities
Cost of Deposit
-75 bps from Dec-19
Note: Hybrid deposits include No-Fixed, ME and Ultra saving
Dec-19 Mar-20 Jun-20 Sep-20 Dec-20 Mar-21 Jun-21
~148 bn~135 bn
~160 bn
~210 bn
~110 bn~150 bn
~89 bn
1.29%
1.16%
1.51%
0.96% 0.84% 0.80% 0.76%
Loans -2.5% YTD
Deposit -3.6% YTD
1,398
1,392 1,3981,4431,404
1,382
1,406
1,363 1,373
1,393 1,384
1,3801,324
1,359
22
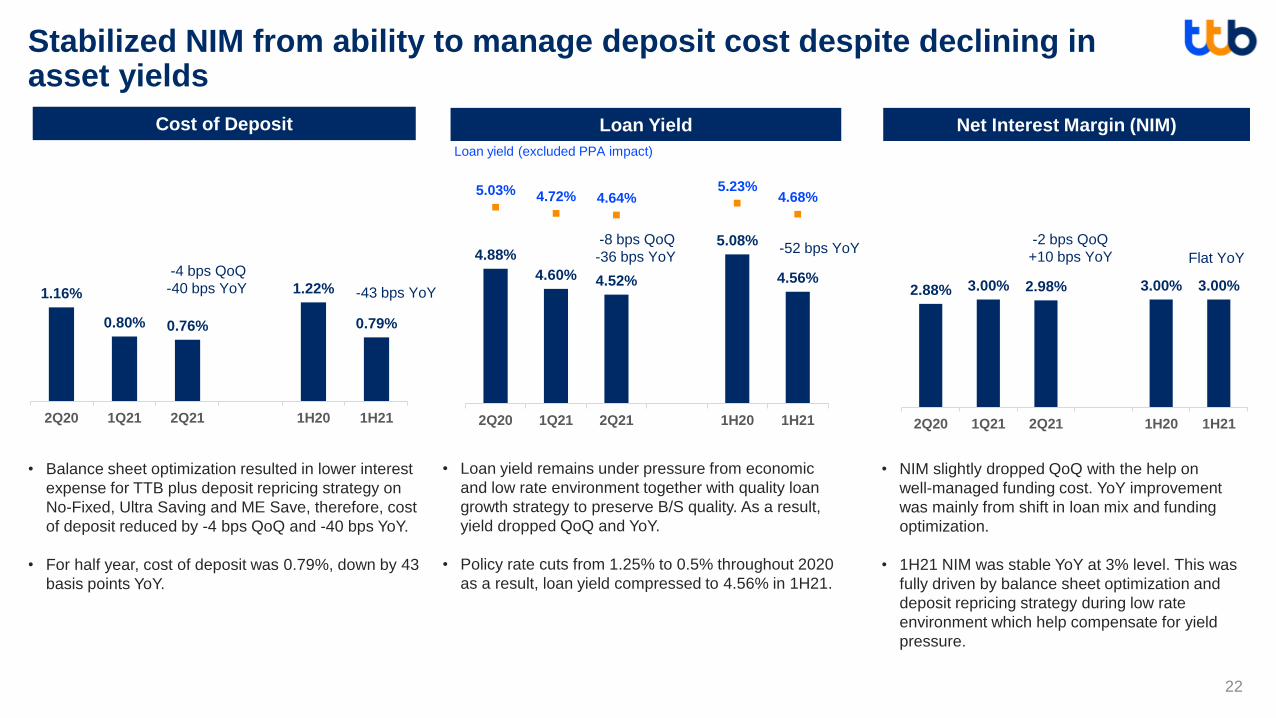
Stabilized NIM from ability to manage deposit cost despite declining in asset yields
• Loan yield remains under pressure from economic
and low rate environment together with quality loan
growth strategy to preserve B/S quality. As a result,
yield dropped QoQ and YoY.
• Policy rate cuts from 1.25% to 0.5% throughout 2020
as a result, loan yield compressed to 4.56% in 1H21.
• Balance sheet optimization resulted in lower interest
expense for TTB plus deposit repricing strategy on
No-Fixed, Ultra Saving and ME Save, therefore, cost
of deposit reduced by -4 bps QoQ and -40 bps YoY.
• For half year, cost of deposit was 0.79%, down by 43
basis points YoY.
Loan YieldCost of Deposit Net Interest Margin (NIM)
• NIM slightly dropped QoQ with the help on
well-managed funding cost. YoY improvement
was mainly from shift in loan mix and funding
optimization.
• 1H21 NIM was stable YoY at 3% level. This was
fully driven by balance sheet optimization and
deposit repricing strategy during low rate
environment which help compensate for yield
pressure.
1.16%
0.80% 0.76%
1.22%
0.79%
0.00%
0.20%
0.40%
0.60%
0.80%
1.00%
1.20%
1.40%
1.60%
1.80%
2Q20 1Q21 2Q21 1H20 1H21
-4 bps QoQ
-40 bps YoY -43 bps YoY
4.88%
4.60% 4.52%
5.08%
4.56%
5.03% 4.72% 4.64%5.23%
4.68%
-5.00%
-3.00%
-1.00%
1.00%
3.00%
5.00%
3.00%
3.50%
4.00%
4.50%
5.00%
5.50%
6.00%
2Q20 1Q21 2Q21 1H20 1H21
Loan yield (excluded PPA impact)
-52 bps YoY-8 bps QoQ
-36 bps YoY
2.88% 3.00% 2.98% 3.00% 3.00%
2Q20 1Q21 2Q21 1H20 1H21
-2 bps QoQ
+10 bps YoY Flat YoY
13,045 12,872 12,782
27,05925,654
3,000
8,000
13,000
18,000
23,000
28,000
33,000
2Q20 1Q21 2Q21 1H20 1H21
THB million
23
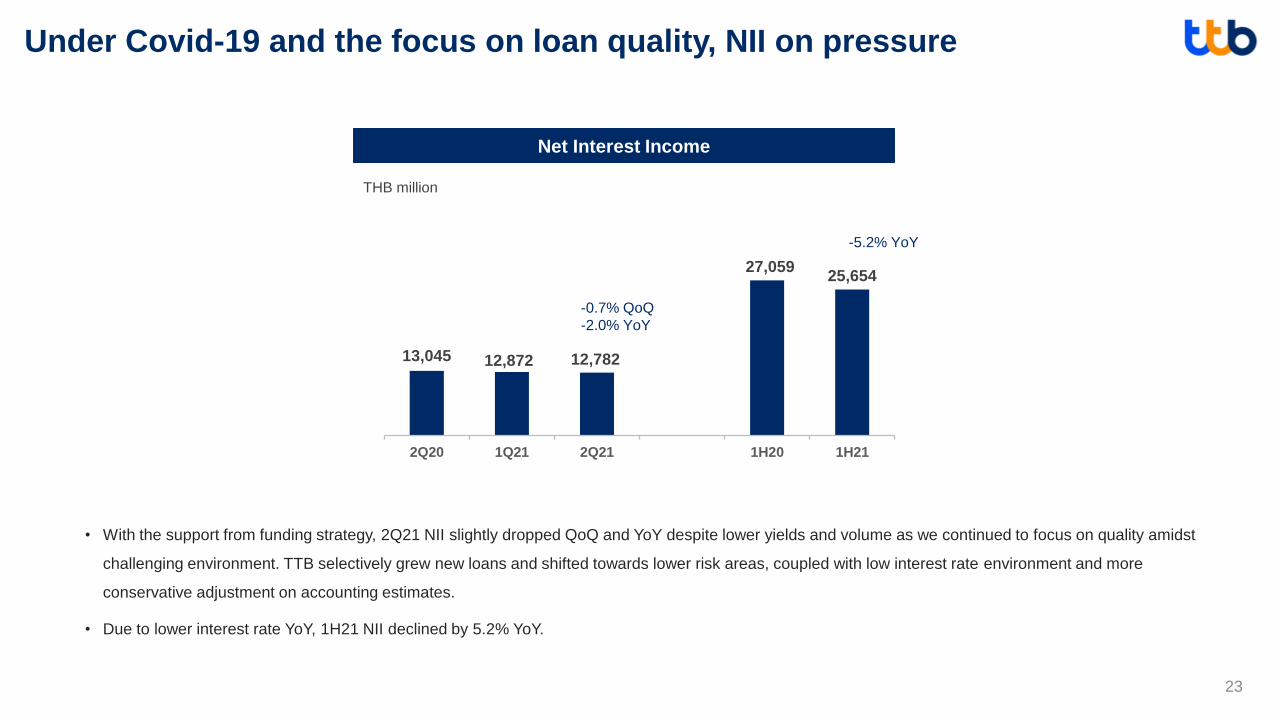
Under Covid-19 and the focus on loan quality, NII on pressure
• With the support from funding strategy, 2Q21 NII slightly dropped QoQ and YoY despite lower yields and volume as we continued to focus on quality amidst
challenging environment. TTB selectively grew new loans and shifted towards lower risk areas, coupled with low interest rate environment and more
conservative adjustment on accounting estimates.
• Due to lower interest rate YoY, 1H21 NII declined by 5.2% YoY.
Net Interest Income
-0.7% QoQ
-2.0% YoY
-5.2% YoY
24
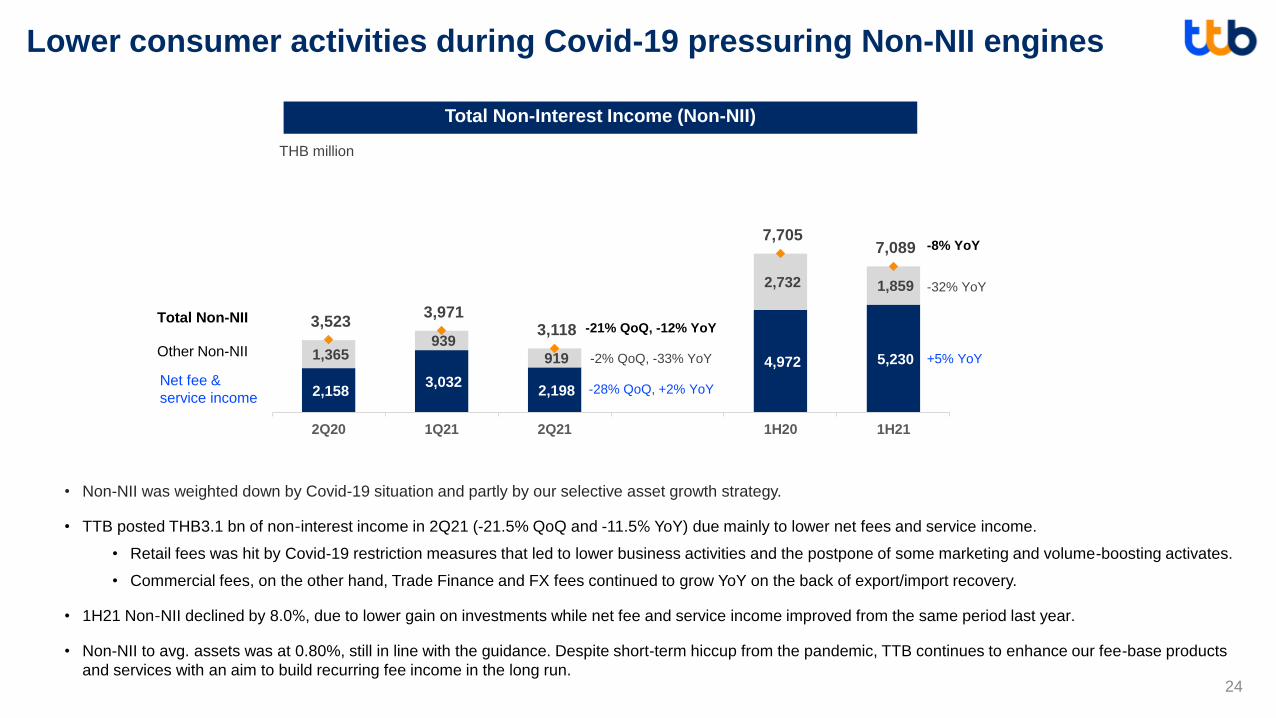
Lower consumer activities during Covid-19 pressuring Non-NII engines
Total Non-Interest Income (Non-NII)
Net fee &
service income
Other Non-NII
Total Non-NII
• Non-NII was weighted down by Covid-19 situation and partly by our selective asset growth strategy.
• TTB posted THB3.1 bn of non-interest income in 2Q21 (-21.5% QoQ and -11.5% YoY) due mainly to lower net fees and service income.
• Retail fees was hit by Covid-19 restriction measures that led to lower business activities and the postpone of some marketing and volume-boosting activates.
• Commercial fees, on the other hand, Trade Finance and FX fees continued to grow YoY on the back of export/import recovery.
• 1H21 Non-NII declined by 8.0%, due to lower gain on investments while net fee and service income improved from the same period last year.
• Non-NII to avg. assets was at 0.80%, still in line with the guidance. Despite short-term hiccup from the pandemic, TTB continues to enhance our fee-base products
and services with an aim to build recurring fee income in the long run.
2,158 3,032
2,198
4,972 5,230 1,365 939
919
2,732 1,859
3,523 3,971
3,118
7,705 7,089
-
1,00 0
2,00 0
3,00 0
4,00 0
5,00 0
6,00 0
7,00 0
8,00 0
9,00 0
2Q20 1Q21 2Q21 1H20 1H21
THB million
-28% QoQ, +2% YoY
-21% QoQ, -12% YoY
-2% QoQ, -33% YoY +5% YoY
-8% YoY
-32% YoY
1,044 1,0831,514 1,388 1,224
2,603 2,612336560
704 1,088
447
9901,536
4453
4355
55
119
110
287280
313
383
420
746
803
132
131
135
132
137
250
270
2Q20 3Q20 4Q20 1Q21 2Q21 1H20 1H21
25
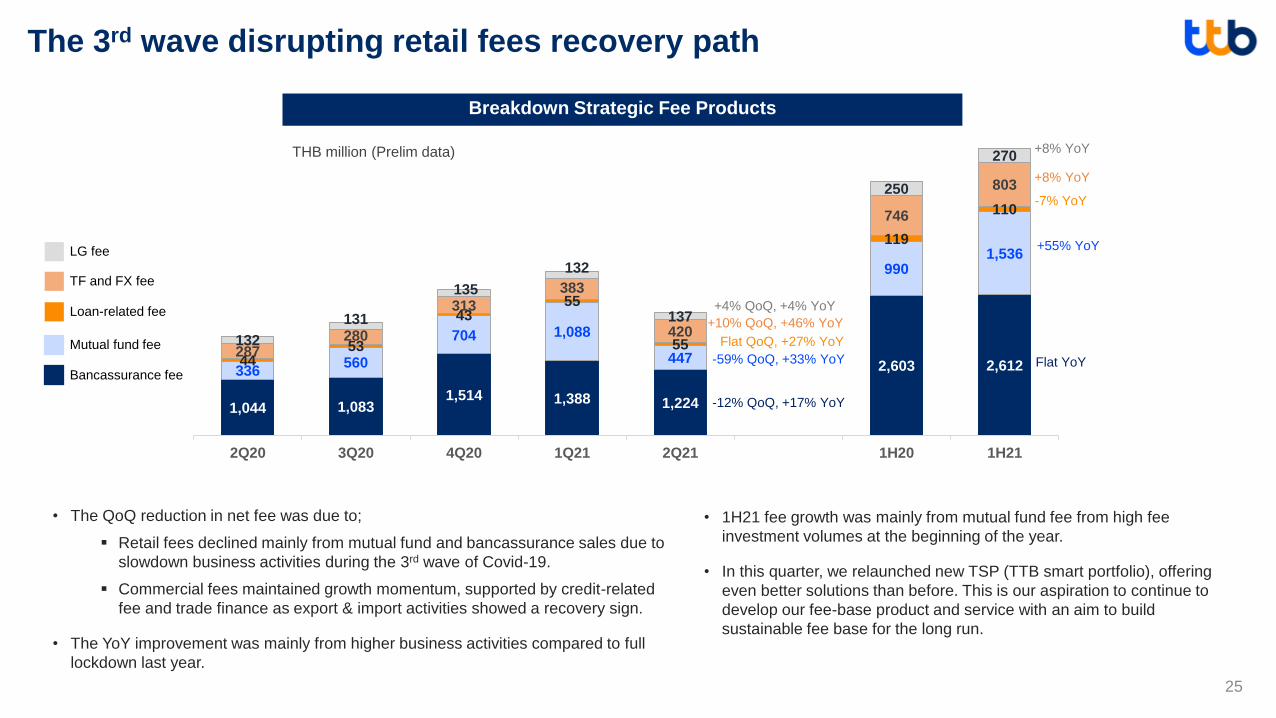
The 3rd wave disrupting retail fees recovery path
Bancassurance fee
Mutual fund fee
Loan-related fee
TF and FX fee
LG fee
Breakdown Strategic Fee Products
THB million (Prelim data)
-12% QoQ, +17% YoY
-59% QoQ, +33% YoY
Flat QoQ, +27% YoY
+10% QoQ, +46% YoY
+4% QoQ, +4% YoY
Flat YoY
+55% YoY
-7% YoY
+8% YoY
+8% YoY
• The QoQ reduction in net fee was due to;
▪ Retail fees declined mainly from mutual fund and bancassurance sales due to
slowdown business activities during the 3rd wave of Covid-19.
▪ Commercial fees maintained growth momentum, supported by credit-related
fee and trade finance as export & import activities showed a recovery sign.
• The YoY improvement was mainly from higher business activities compared to full
lockdown last year.
• 1H21 fee growth was mainly from mutual fund fee from high fee
investment volumes at the beginning of the year.
• In this quarter, we relaunched new TSP (TTB smart portfolio), offering
even better solutions than before. This is our aspiration to continue to
develop our fee-base product and service with an aim to build
sustainable fee base for the long run.
26
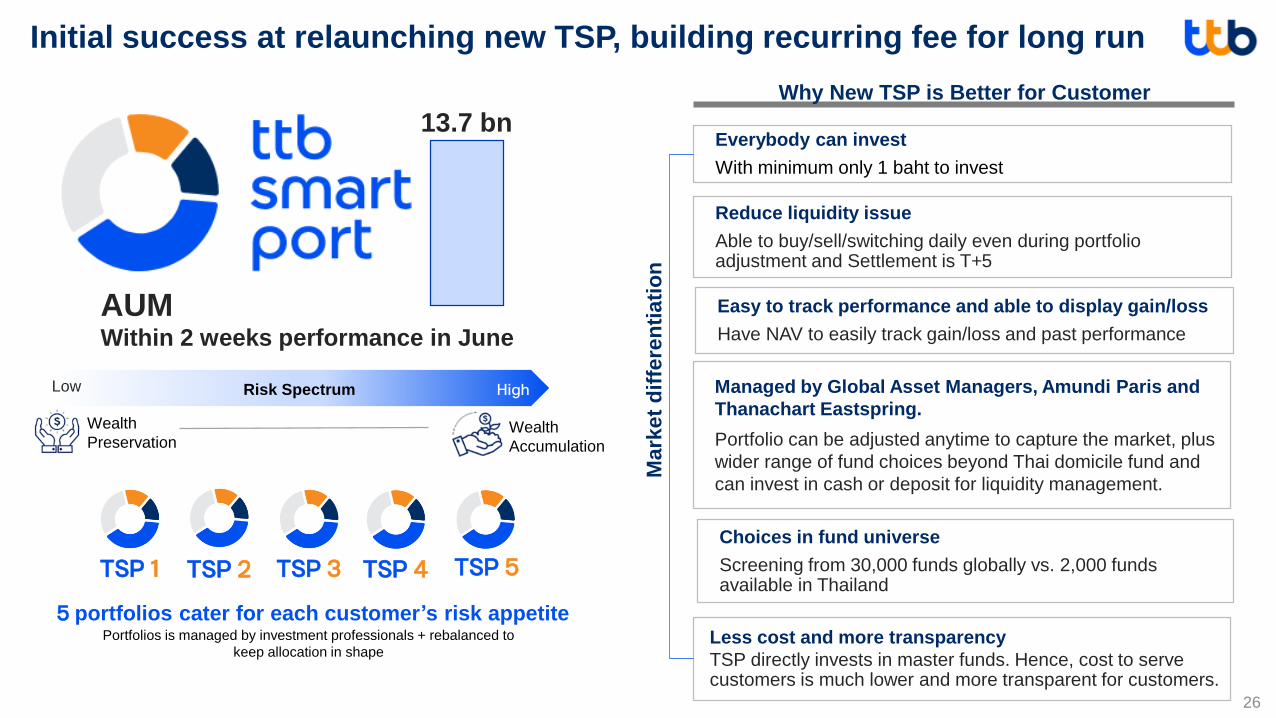
Initial success at relaunching new TSP, building recurring fee for long run
Everybody can invest
With minimum only 1 baht to invest
AUMWithin 2 weeks performance in June
13.7 bn
TSP 1 TSP 2 TSP 3 TSP 4 TSP 5
Risk SpectrumLow High
Wealth
PreservationWealth
Accumulation
5 portfolios cater for each customer’s risk appetite Portfolios is managed by investment professionals + rebalanced to
keep allocation in shape
Why New TSP is Better for Customer
Reduce liquidity issue
Able to buy/sell/switching daily even during portfolio adjustment and Settlement is T+5
Easy to track performance and able to display gain/loss
Have NAV to easily track gain/loss and past performance
Managed by Global Asset Managers, Amundi Paris and
Thanachart Eastspring.
Portfolio can be adjusted anytime to capture the market, plus
wider range of fund choices beyond Thai domicile fund and
can invest in cash or deposit for liquidity management.
Less cost and more transparency
TSP directly invests in master funds. Hence, cost to serve customers is much lower and more transparent for customers.
Mark
et
dif
fere
nti
ati
on
Choices in fund universe
Screening from 30,000 funds globally vs. 2,000 funds available in Thailand
7,776 7,928 7,402
16,10715,330
0
2,000
4,000
6,000
8,000
10,000
12,000
14,000
16,000
18,000
20,000
2Q20 1Q21 2Q21 1H20 1H21
27
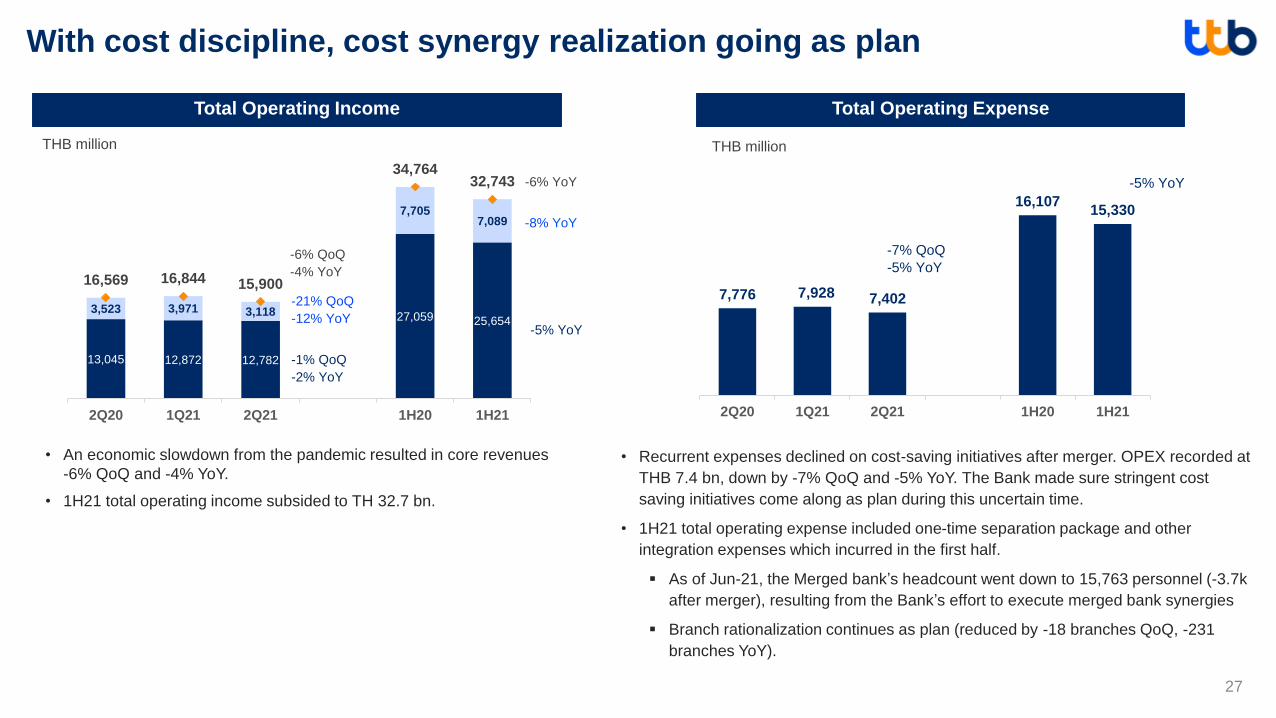
With cost discipline, cost synergy realization going as plan
Total Operating Expense
THB million
• Recurrent expenses declined on cost-saving initiatives after merger. OPEX recorded at
THB 7.4 bn, down by -7% QoQ and -5% YoY. The Bank made sure stringent cost
saving initiatives come along as plan during this uncertain time.
• 1H21 total operating expense included one-time separation package and other
integration expenses which incurred in the first half.
▪ As of Jun-21, the Merged bank’s headcount went down to 15,763 personnel (-3.7k
after merger), resulting from the Bank’s effort to execute merged bank synergies
▪ Branch rationalization continues as plan (reduced by -18 branches QoQ, -231
branches YoY).
Total Operating Income
• An economic slowdown from the pandemic resulted in core revenues
-6% QoQ and -4% YoY.
• 1H21 total operating income subsided to TH 32.7 bn.
-7% QoQ
-5% YoY
-5% YoY
13,045 12,872 12,782
27,059 25,6543,523 3,971 3,118
7,7057,089
16,569 16,844 15,900
34,76432,743
0
5,000
10,000
15,000
20,000
25,000
30,000
35,000
40,000
2Q20 1Q21 2Q21 1H20 1H21
THB million
-1% QoQ
-2% YoY
-21% QoQ
-12% YoY
-6% QoQ
-4% YoY
-5% YoY
-8% YoY
-6% YoY
28
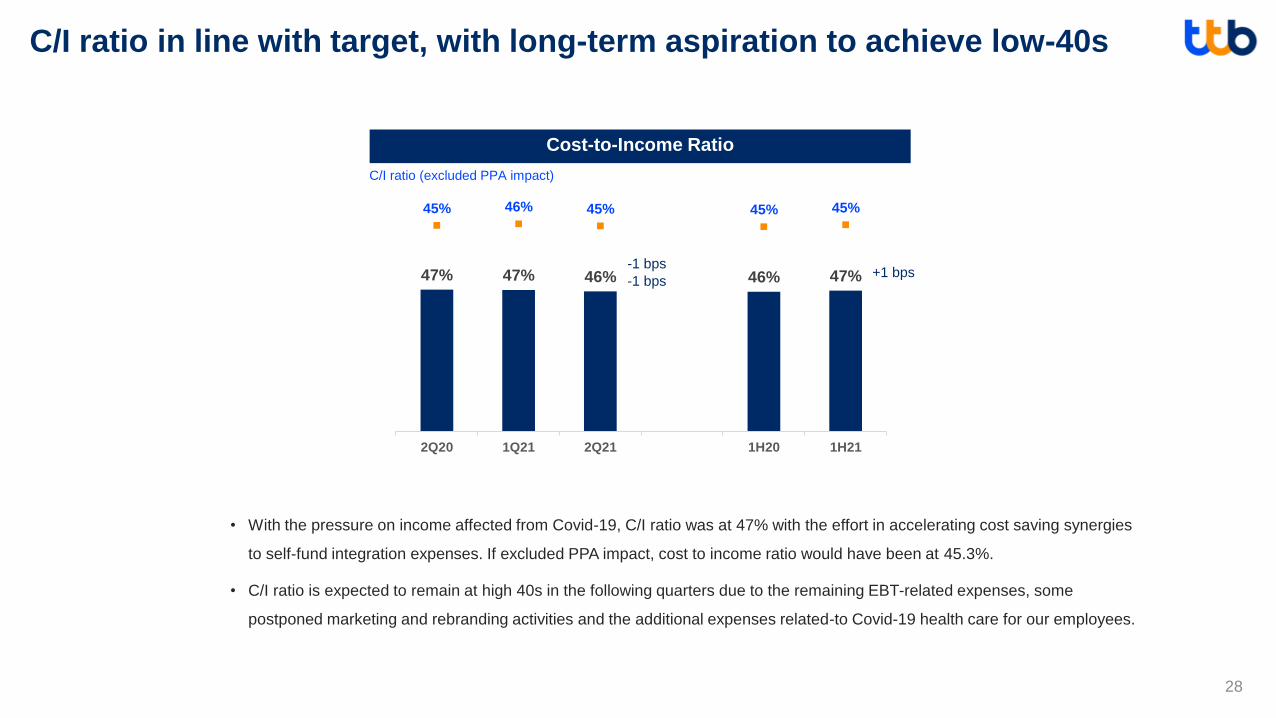
C/I ratio in line with target, with long-term aspiration to achieve low-40s
• With the pressure on income affected from Covid-19, C/I ratio was at 47% with the effort in accelerating cost saving synergies
to self-fund integration expenses. If excluded PPA impact, cost to income ratio would have been at 45.3%.
• C/I ratio is expected to remain at high 40s in the following quarters due to the remaining EBT-related expenses, some
postponed marketing and rebranding activities and the additional expenses related-to Covid-19 health care for our employees.
Cost-to-Income Ratio
47% 47% 46% 46% 47%
45% 46% 45% 45% 45%
-4%
6%
16%
26%
36%
46%
0%
10%
20%
30%
40%
50%
60%
70%
2Q20 1Q21 2Q21 1H20 1H21
+1 bps-1 bps
-1 bps
C/I ratio (excluded PPA impact)
29
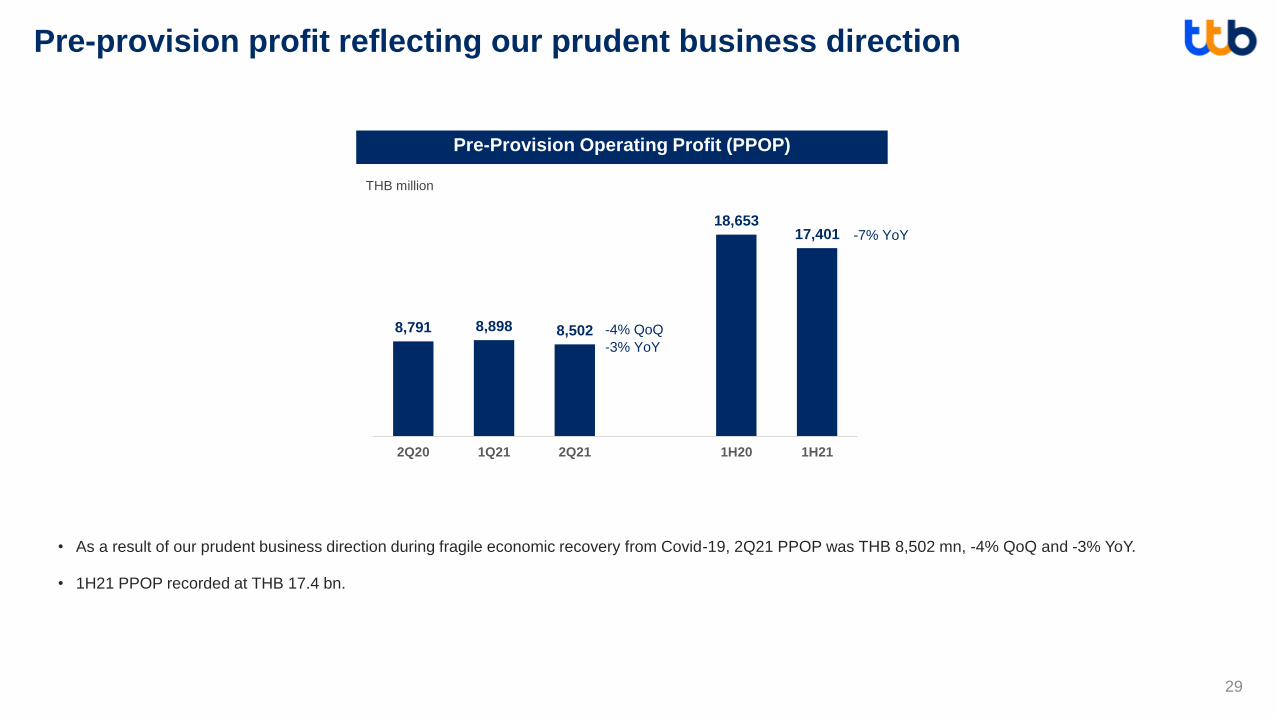
Pre-provision profit reflecting our prudent business direction
Pre-Provision Operating Profit (PPOP)
• As a result of our prudent business direction during fragile economic recovery from Covid-19, 2Q21 PPOP was THB 8,502 mn, -4% QoQ and -3% YoY.
• 1H21 PPOP recorded at THB 17.4 bn.
8,791 8,898 8,502
18,65317,401
0
2,000
4,000
6,000
8,000
10,000
12,000
14,000
16,000
18,000
20,000
2Q20 1Q21 2Q21 1H20 1H21
THB million
-4% QoQ
-3% YoY
-7% YoY
30
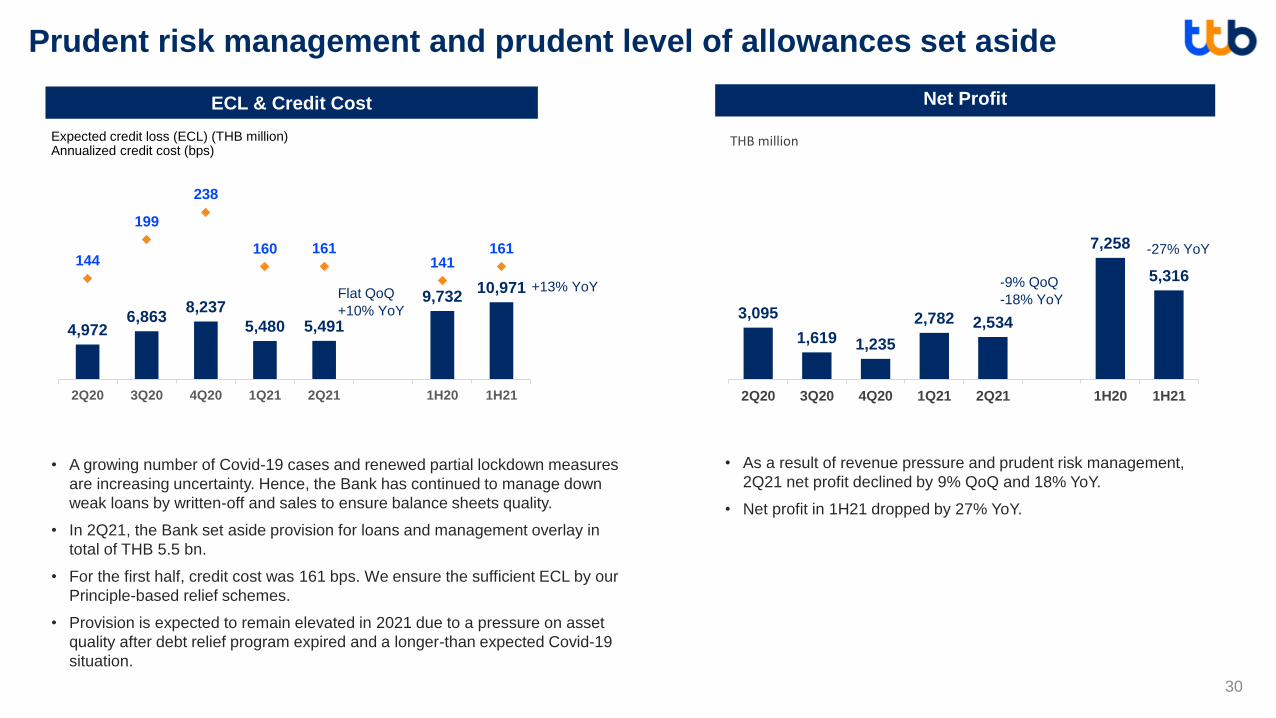
Prudent risk management and prudent level of allowances set aside
ECL & Credit Cost
Expected credit loss (ECL) (THB million)Annualized credit cost (bps)
4,9726,863
8,237
5,480 5,491
9,73210,971
144
199
238
160 161141
161
0
50
100
150
200
250
300
0
5,000
10,000
15,000
20,000
25,000
30,000
2Q20 3Q20 4Q20 1Q21 2Q21 1H20 1H21
• A growing number of Covid-19 cases and renewed partial lockdown measures
are increasing uncertainty. Hence, the Bank has continued to manage down
weak loans by written-off and sales to ensure balance sheets quality.
• In 2Q21, the Bank set aside provision for loans and management overlay in
total of THB 5.5 bn.
• For the first half, credit cost was 161 bps. We ensure the sufficient ECL by our
Principle-based relief schemes.
• Provision is expected to remain elevated in 2021 due to a pressure on asset
quality after debt relief program expired and a longer-than expected Covid-19
situation.
Flat QoQ
+10% YoY
+13% YoY
Net Profit
3,095
1,619 1,235
2,782 2,534
7,258
5,316
2Q20 3Q20 4Q20 1Q21 2Q21 1H20 1H21
THB million
• As a result of revenue pressure and prudent risk management,
2Q21 net profit declined by 9% QoQ and 18% YoY.
• Net profit in 1H21 dropped by 27% YoY.
-9% QoQ
-18% YoY
-27% YoY
17.39 17.43 19.22 21.76 20.83
17.14 19.63 21.62
21.92 21.00
9.85 11.31
11.13 10.12 12.59 44.4
48.452.0 53.8 54.4
Jun-20 Sep-21 20-Dec Mar-21 Jun-21
31
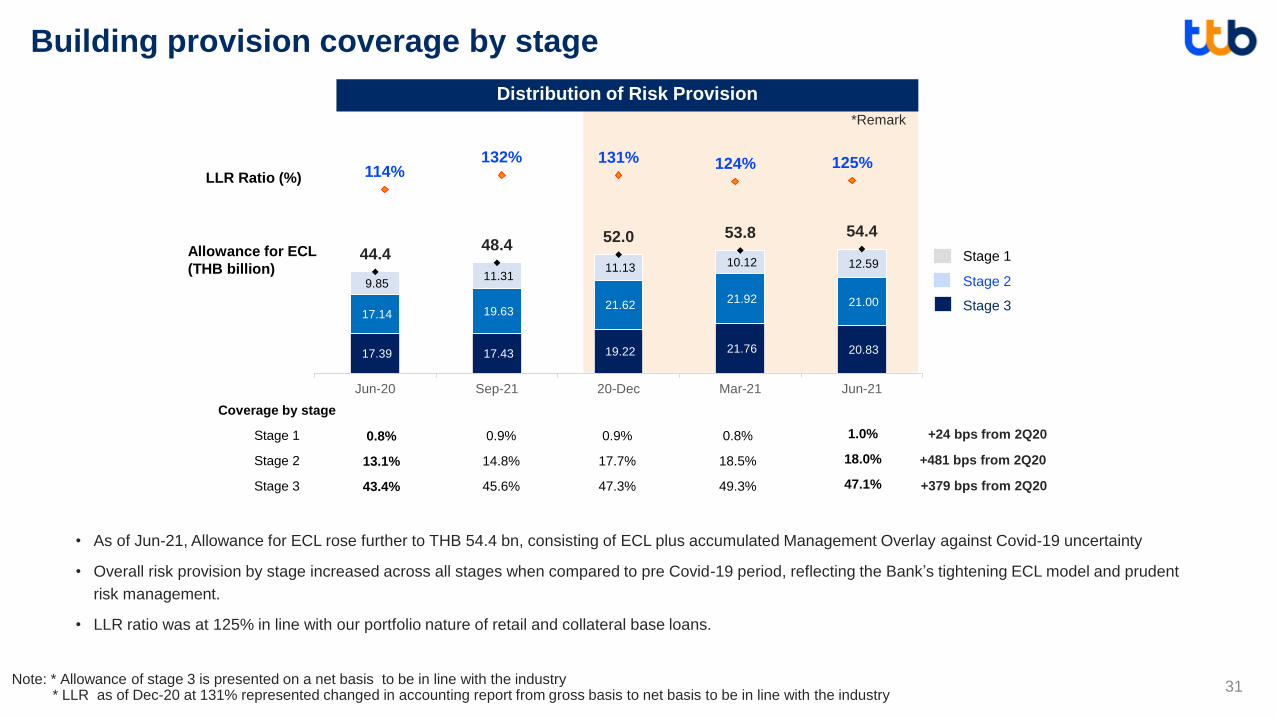
Building provision coverage by stage
Distribution of Risk Provision
Coverage by stage
Stage 1
Stage 2
Stage 3
• As of Jun-21, Allowance for ECL rose further to THB 54.4 bn, consisting of ECL plus accumulated Management Overlay against Covid-19 uncertainty
• Overall risk provision by stage increased across all stages when compared to pre Covid-19 period, reflecting the Bank’s tightening ECL model and prudent
risk management.
• LLR ratio was at 125% in line with our portfolio nature of retail and collateral base loans.
1.0%
18.0%
47.1%
0.8%
13.1%
43.4%
0.9%
14.8%
45.6%
0.9%
17.7%
47.3%
+24 bps from 2Q20
+481 bps from 2Q20
+379 bps from 2Q20
0.8%
18.5%
49.3%
Note: * Allowance of stage 3 is presented on a net basis to be in line with the industry
Stage 1
Stage 2
Stage 3
*Remark
* LLR as of Dec-20 at 131% represented changed in accounting report from gross basis to net basis to be in line with the industry
114%132% 131% 124% 125%
50%
60%
70%
80%
90%
100%
110%
120%
130%
140%
LLR Ratio (%)
Allowance for ECL
(THB billion)
14.3%
2.76%2.3% 2.5%
2.75%2.89%
2010 2020 2021Mar-20 Mar-21 Jun-21
Stage 1 Stage2 Stage 3
32
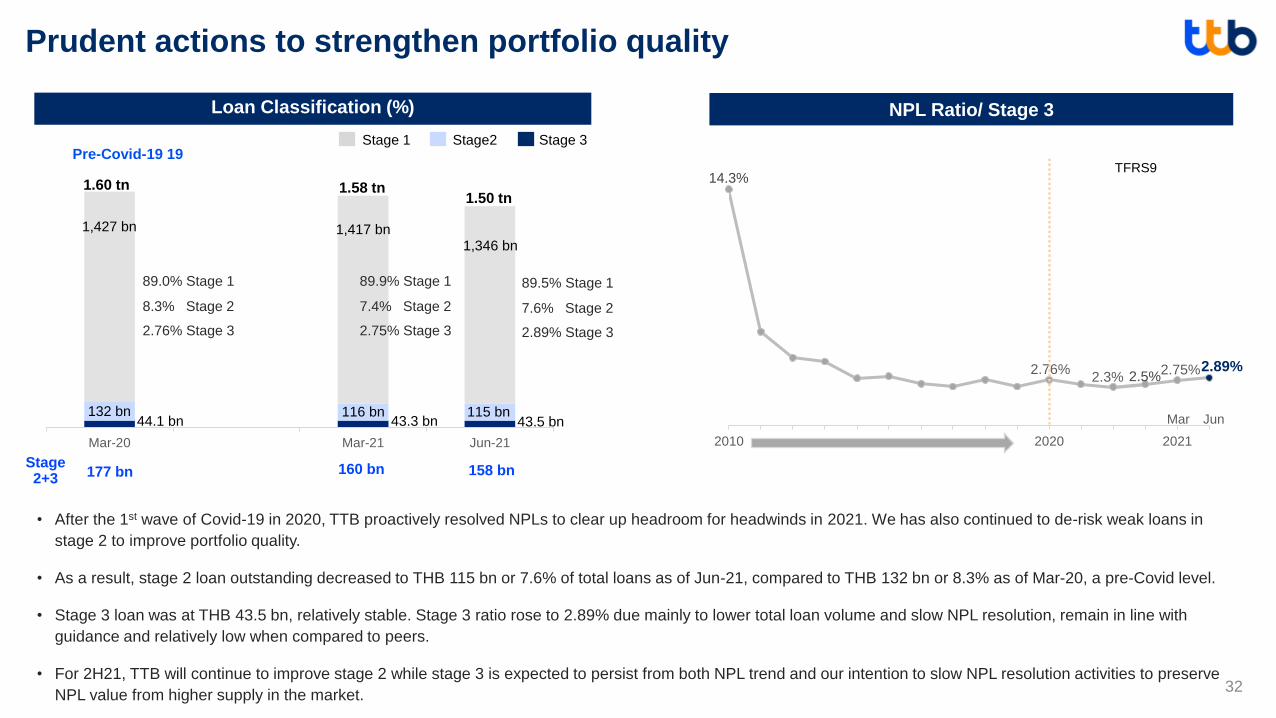
Prudent actions to strengthen portfolio quality
Loan Classification (%)
1.60 tn
1,427 bn
132 bn44.1 bn
89.0% Stage 1
8.3% Stage 2
2.76% Stage 3
NPL Ratio/ Stage 3
TFRS9
89.5% Stage 1
7.6% Stage 2
2.89% Stage 3
Pre-Covid-19 19
1.58 tn
1,417 bn
43.3 bn116 bn
• After the 1st wave of Covid-19 in 2020, TTB proactively resolved NPLs to clear up headroom for headwinds in 2021. We has also continued to de-risk weak loans in
stage 2 to improve portfolio quality.
• As a result, stage 2 loan outstanding decreased to THB 115 bn or 7.6% of total loans as of Jun-21, compared to THB 132 bn or 8.3% as of Mar-20, a pre-Covid level.
• Stage 3 loan was at THB 43.5 bn, relatively stable. Stage 3 ratio rose to 2.89% due mainly to lower total loan volume and slow NPL resolution, remain in line with
guidance and relatively low when compared to peers.
• For 2H21, TTB will continue to improve stage 2 while stage 3 is expected to persist from both NPL trend and our intention to slow NPL resolution activities to preserve
NPL value from higher supply in the market.
1.50 tn
43.5 bn
89.9% Stage 1
7.4% Stage 2
2.75% Stage 3
1,346 bn
115 bnMar Jun
177 bnStage2+3
160 bn 158 bn
33
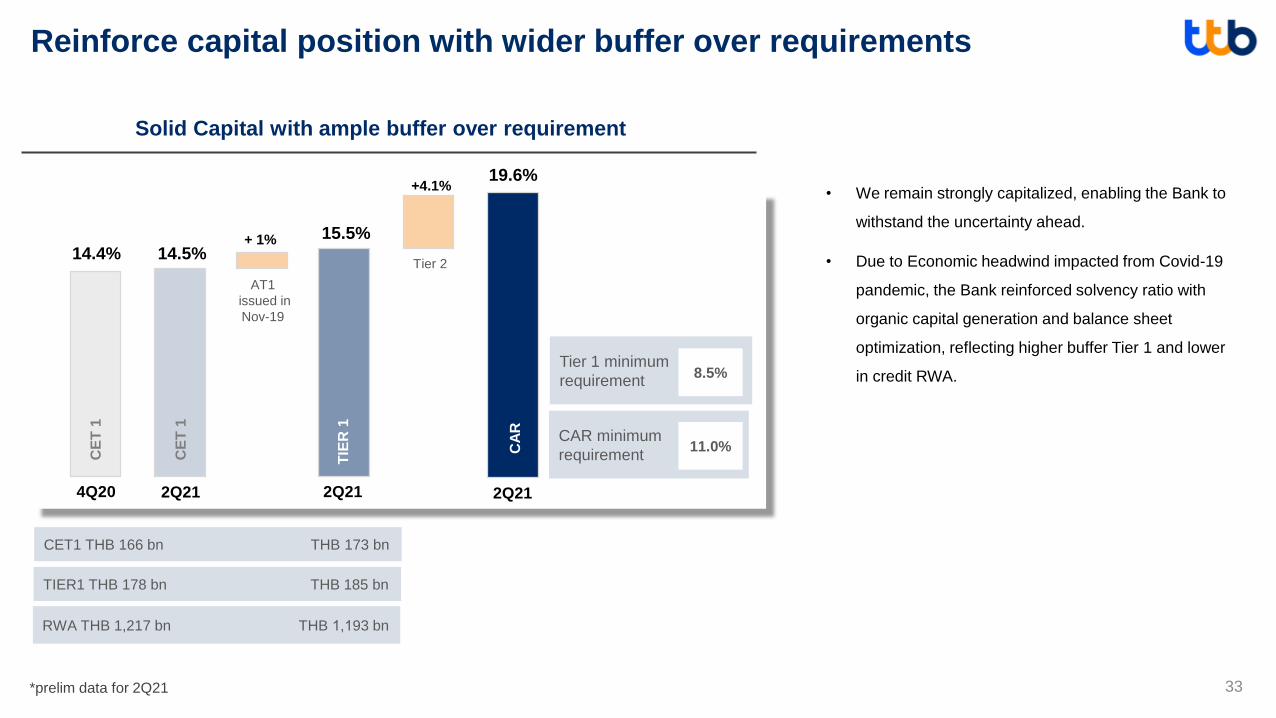
Reinforce capital position with wider buffer over requirements
• We remain strongly capitalized, enabling the Bank to
withstand the uncertainty ahead.
• Due to Economic headwind impacted from Covid-19
pandemic, the Bank reinforced solvency ratio with
organic capital generation and balance sheet
optimization, reflecting higher buffer Tier 1 and lower
in credit RWA.
4Q20
14.4%
CE
T 1
+ 1%
AT1
issued in
Nov-19
CE
T 1
2Q21
14.5%
2Q21
15.5%
TIE
R 1
CET1 THB 166 bn THB 173 bn
RWA THB 1,217 bn THB 1,193 bn
Tier 1 minimum
requirement
CAR minimum
requirement11.0%
+4.1%
Tier 2
2Q21
19.6%
CA
R
8.5%
TIER1 THB 178 bn THB 185 bn
Solid Capital with ample buffer over requirement
*prelim data for 2Q21
Disclaimer: The information in this material is in summary form and does not purport to be complete. No representation or warranty, express or implied, is or should be made
concerning, and no reliance should be place on, the accuracy, fairness, or completeness of this information and liability therefore is disclaimed. TTBThanachart Bank Public
Company Limited (the “Bank” or “ttb” or “TTB”) does not independently verified, approved or endorsed the information contained herein, or undertakes to update or revise any
information, whether as a result of new information, future events or otherwise.
The material to be presented may contain certain forward-looking statements and information regarding the Company that reflect current views and/or expectations of the
Company with respect to its performance, business and future events. Statements relating to achieving certain goals are forward-looking statements. Forward-looking
statements are based on certain assumptions and expectations of future events. The Company cannot guarantee that these assumptions and expectations are accurate or will
be realized. Past performance does not guarantee or predict future performance. A number of important factors could cause actual results or outcomes to differ materially from
those expressed in any forward-looking statement. Representative examples of these factors include (without limitation) general industry and economic conditions, interest rate
trends, cost of capital and capital availability, currency exchange rates, competition from other companies, shifts in customer demands, customers and partners, changes in
operating expenses including employee wages, benefits and training, governmental and public policy changes and the continued availability of financing in the amounts and
the terms necessary to support future business. Actual future performance, outcomes and results may differ materially from those expressed in forward-looking statements as a
result of a number of risks, uncertainties and assumptions. You are cautioned not to place reliance on these forward-looking statements, which are based on current view of the
management on future events. The Company does not assume any responsibility to publicly amend, modify or revise any forward-looking statements, on the basis of any
subsequent developments, information or events, or otherwise.
This presentation does not constitute an offer, or invitation, or solicitation of an offer, to subscribe for, sell or purchase any securities. Neither this material nor anything
contained herein shall form the basis of any contract or commitment whatsoever. The recipients of this presentation should not make any investment or business decision or
take actions in reliance on the information and statements contained in this presentation and must conduct their own investigation and analysis of the contemplated transaction
and the information and data contained herein.
This presentation is being made available on a confidential basis and intended only for the recipients, and may not be copied, reproduced, retransmitted or distributed by a
recipient to any other persons in any manner. By attending this presentation and/or accepting a copy of this document, you agree to be bound by the foregoing limitations and
conditions.


