1 | Q2 Investor Presentation | © 2016 Veeco Instruments Inc.
Investor Presentation
Q4 2016
Veeco Instruments Inc.
2 | Q4 Investor Presentation | © 2016 Veeco Instruments Inc.
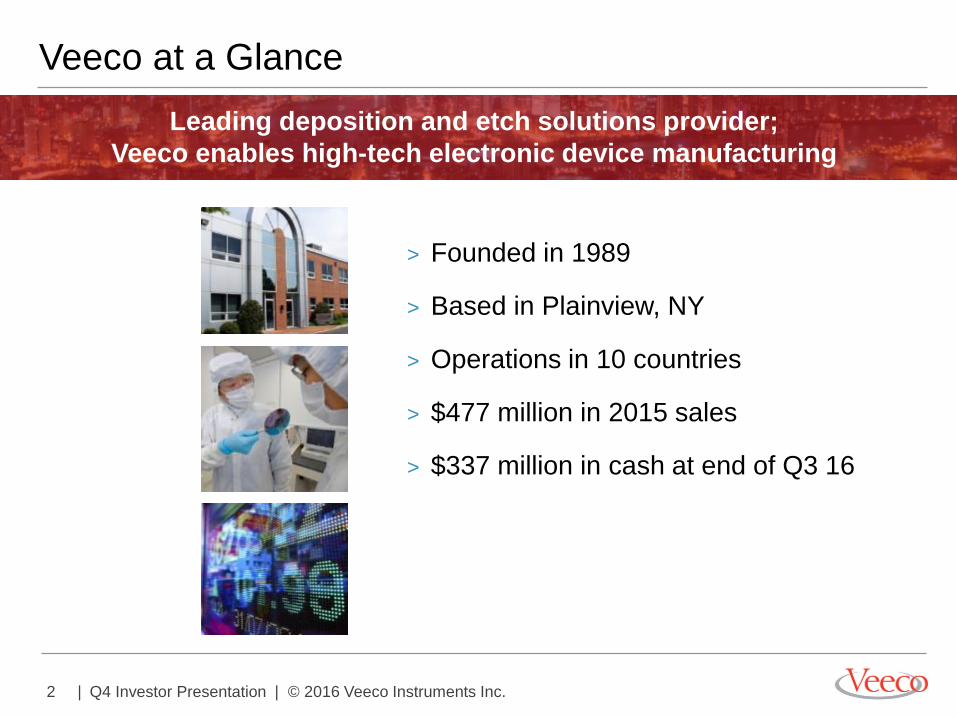
Veeco at a Glance
Leading deposition and etch solutions provider;
Veeco enables high-tech electronic device manufacturing
> Founded in 1989
> Based in Plainview, NY
> Operations in 10 countries
> $477 million in 2015 sales
> $337 million in cash at end of Q3 16
3 | Q4 Investor Presentation | © 2016 Veeco Instruments Inc.
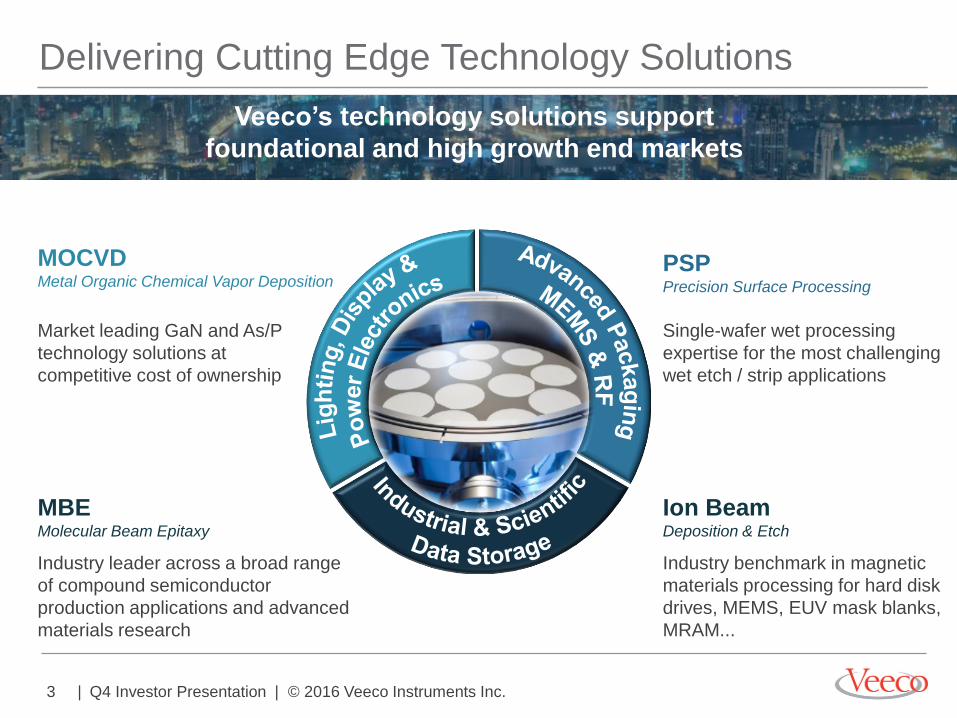
Delivering Cutting Edge Technology Solutions
Metal Organic Chemical
Vapor Deposition
MOCVD Metal Organic Chemical Vapor Deposition
Market leading GaN and As/P
technology solutions at
competitive cost of ownership
PSP Precision Surface Processing
Single-wafer wet processing
expertise for the most challenging
wet etch / strip applications
Metal Organic Chemical
Vapor Deposition
MBE Molecular Beam Epitaxy
Industry leader across a broad range
of compound semiconductor
production applications and advanced
materials research
Industry benchmark in magnetic
materials processing for hard disk
drives, MEMS, EUV mask blanks,
MRAM...
Ion Beam Deposition & Etch
Veeco’s technology solutions support
foundational and high growth end markets
4 | Q4 Investor Presentation | © 2016 Veeco Instruments Inc.
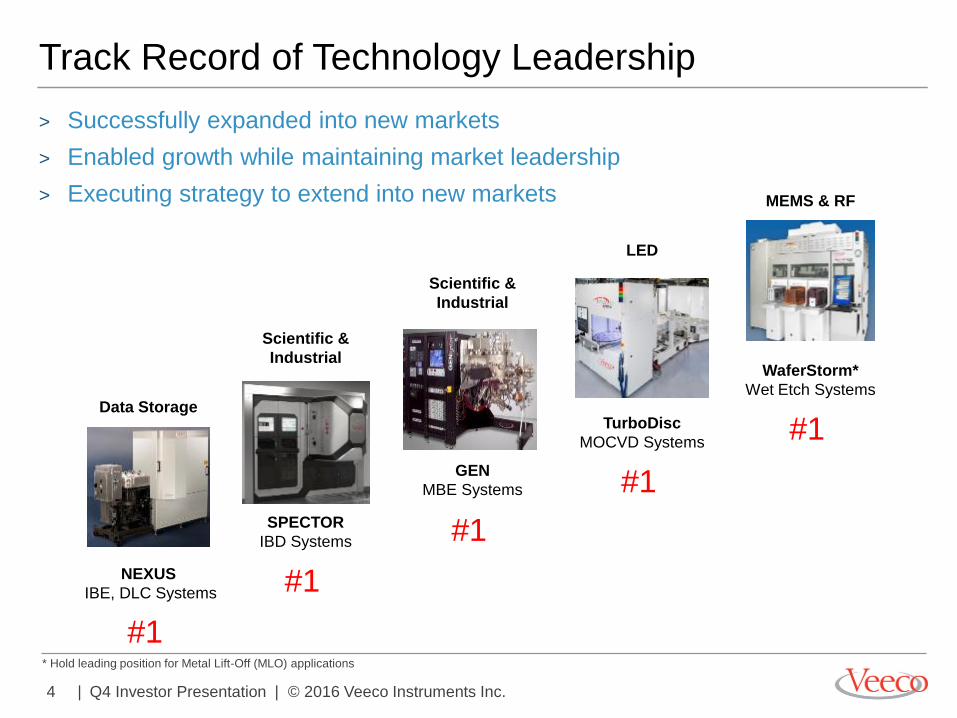
Track Record of Technology Leadership
> Successfully expanded into new markets
> Enabled growth while maintaining market leadership
> Executing strategy to extend into new markets
Data Storage
NEXUS
IBE, DLC Systems
Scientific &
Industrial
Scientific &
Industrial
LED
MEMS & RF
WaferStorm*
Wet Etch Systems
TurboDisc
MOCVD Systems
GEN
MBE Systems
SPECTOR
IBD Systems
#1
#1
#1
#1
#1
* Hold leading position for Metal Lift-Off (MLO) applications
5 | Q4 Investor Presentation | © 2016 Veeco Instruments Inc.
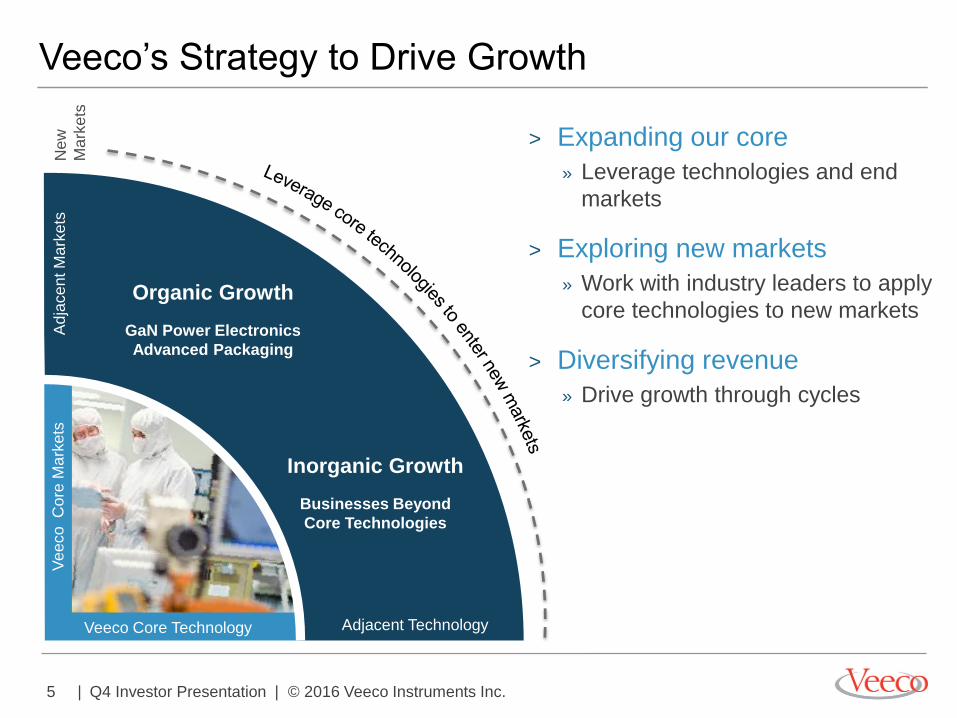
> Expanding our core
» Leverage technologies and end
markets
> Exploring new markets
» Work with industry leaders to apply
core technologies to new markets
> Diversifying revenue
» Drive growth through cycles
Veeco’s Strategy to Drive Growth N
ew
Ma
rkets
Veeco Core Technology V
ee
co C
ore
Ma
rkets
A
dja
ce
nt M
ark
ets
Inorganic Growth
Businesses Beyond
Core Technologies
Adjacent Technology
Organic Growth
GaN Power Electronics
Advanced Packaging
6 | Q4 Investor Presentation | © 2016 Veeco Instruments Inc.
0
50
100
Q2 16 Q3 16
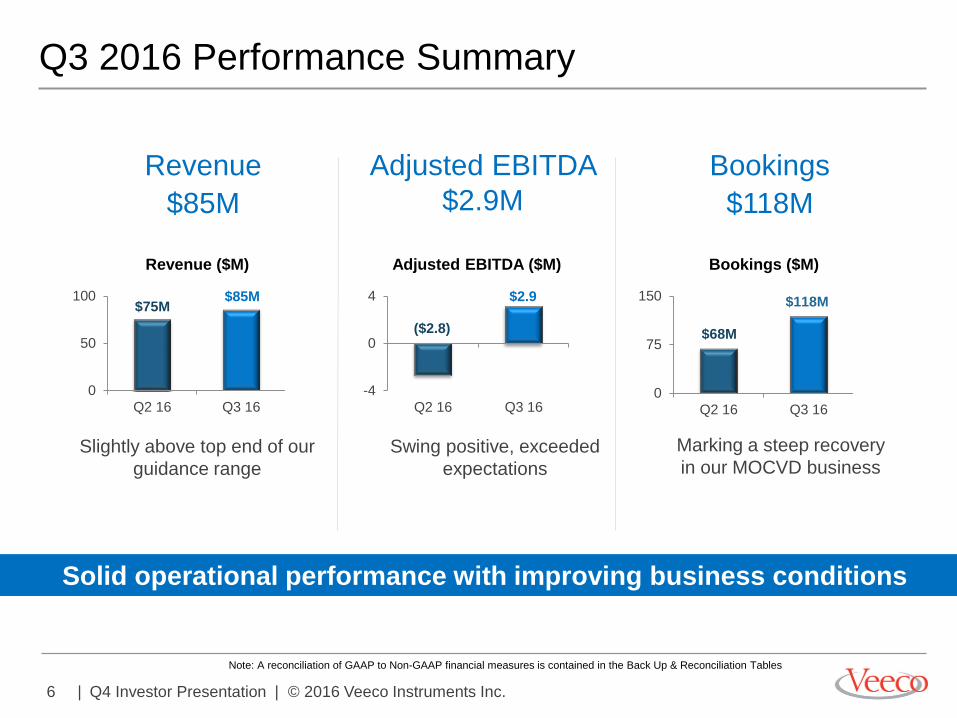
Q3 2016 Performance Summary
$85M
0
75
150
Q2 16 Q3 16
-4
0
4
Q2 16 Q3 16
Revenue ($M) Bookings ($M) Adjusted EBITDA ($M)
$118M $75M $2.9
($2.8) $68M
Bookings
$118M
Revenue
$85M
Adjusted EBITDA
$2.9M
Solid operational performance with improving business conditions
Swing positive, exceeded
expectations
Slightly above top end of our
guidance range
Marking a steep recovery
in our MOCVD business
Note: A reconciliation of GAAP to Non-GAAP financial measures is contained in the Back Up & Reconciliation Tables
7 | Q4 Investor Presentation | © 2016 Veeco Instruments Inc.
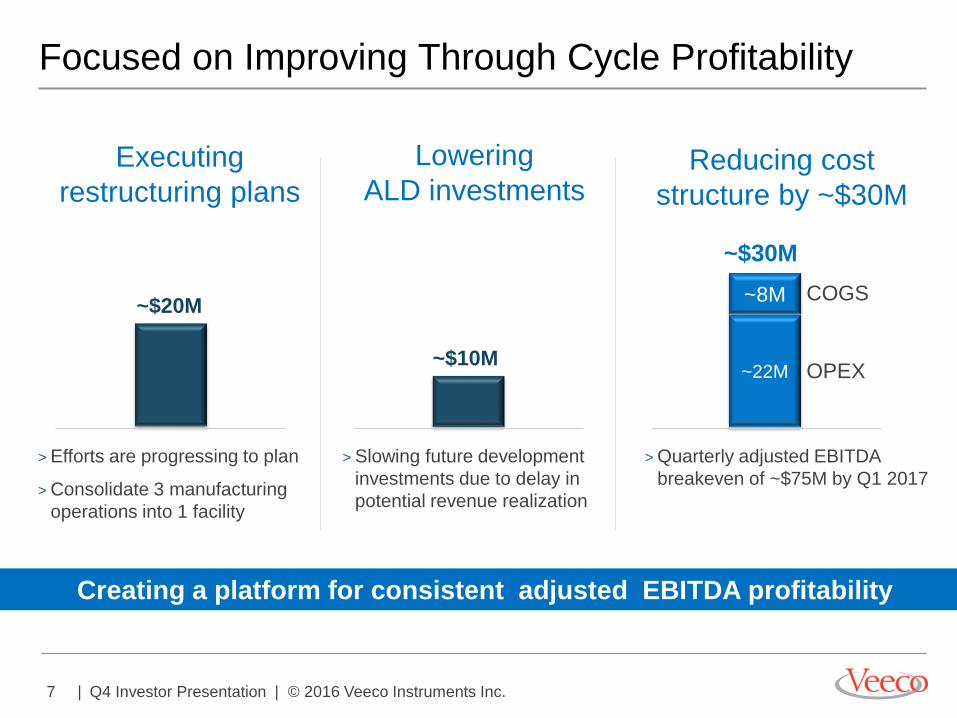
Focused on Improving Through Cycle Profitability
$78M
Reducing cost
structure by ~$30M
Executing
restructuring plans
Lowering
ALD investments
Creating a platform for consistent adjusted EBITDA profitability
~$20M
~$10M
~8M
~$30M
~22M
COGS
OPEX
> Efforts are progressing to plan
> Consolidate 3 manufacturing
operations into 1 facility
> Slowing future development
investments due to delay in
potential revenue realization
> Quarterly adjusted EBITDA
breakeven of ~$75M by Q1 2017
8 | Q4 Investor Presentation | © 2016 Veeco Instruments Inc.
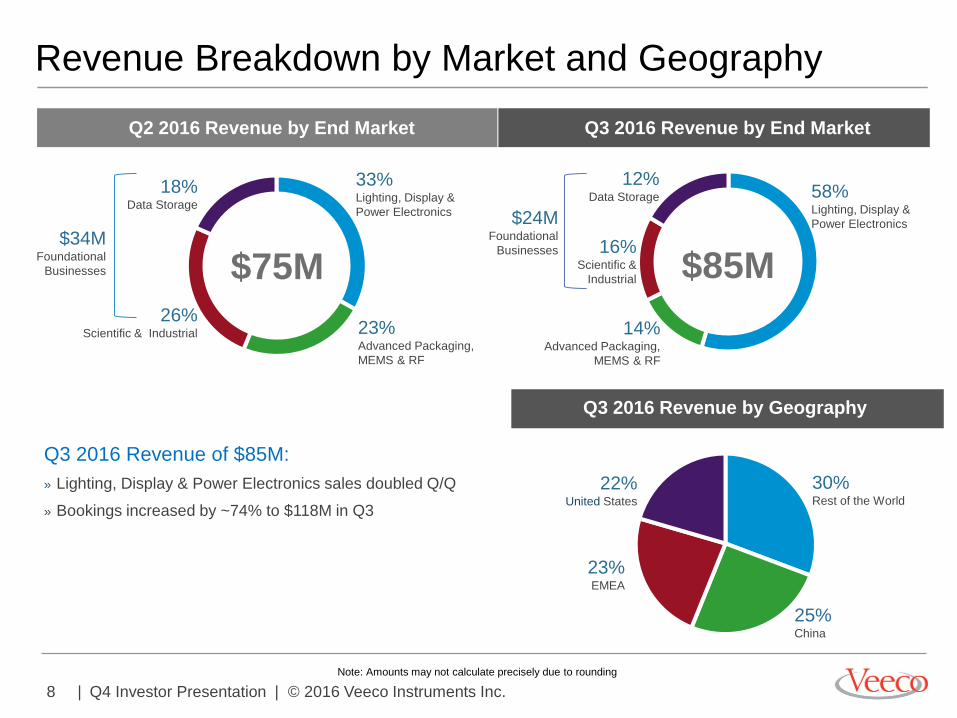
14% Advanced Packaging,
MEMS & RF
Revenue Breakdown by Market and Geography
Note: Amounts may not calculate precisely due to rounding
58% Lighting, Display &
Power Electronics
16% Scientific &
Industrial
12% Data Storage
Q3 2016 Revenue by End Market
$85M
25% China
30% Rest of the World
23% EMEA
22% United States
Q3 2016 Revenue by Geography
Q3 2016 Revenue of $85M:
» Lighting, Display & Power Electronics sales doubled Q/Q
» Bookings increased by ~74% to $118M in Q3
23% Advanced Packaging,
MEMS & RF
18% Data Storage
26% Scientific & Industrial
33% Lighting, Display &
Power Electronics
Q2 2016 Revenue by End Market
$75M
$24M Foundational
Businesses $34M
Foundational
Businesses
9 | Q4 Investor Presentation | © 2016 Veeco Instruments Inc.
P&L Highlights
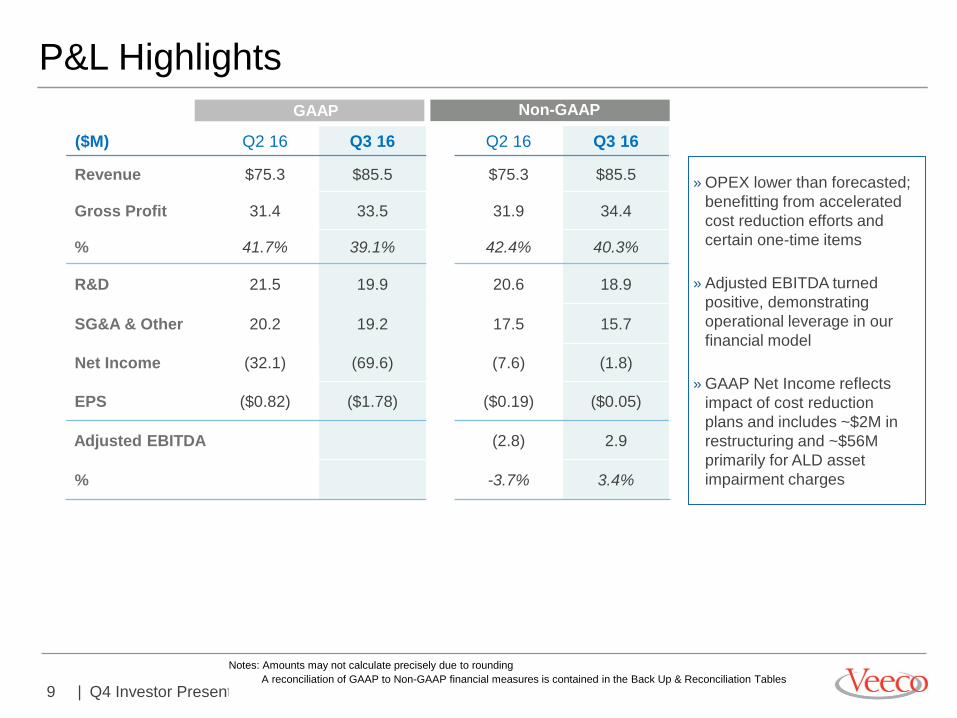
($M) Q2 16 Q3 16 Q2 16 Q3 16
Revenue $75.3 $85.5 $75.3 $85.5
Gross Profit 31.4 33.5 31.9 34.4
% 41.7% 39.1% 42.4% 40.3%
R&D 21.5 19.9 20.6 18.9
SG&A & Other 20.2 19.2 17.5 15.7
Net Income (32.1) (69.6) (7.6) (1.8)
EPS ($0.82) ($1.78) ($0.19) ($0.05)
Adjusted EBITDA (2.8) 2.9
% -3.7% 3.4%
GAAP Non-GAAP
» OPEX lower than forecasted;
benefitting from accelerated
cost reduction efforts and
certain one-time items
» Adjusted EBITDA turned
positive, demonstrating
operational leverage in our
financial model
» GAAP Net Income reflects
impact of cost reduction
plans and includes ~$2M in
restructuring and ~$56M
primarily for ALD asset
impairment charges
Notes: Amounts may not calculate precisely due to rounding
A reconciliation of GAAP to Non-GAAP financial measures is contained in the Back Up & Reconciliation Tables
10 | Q4 Investor Presentation | © 2016 Veeco Instruments Inc.
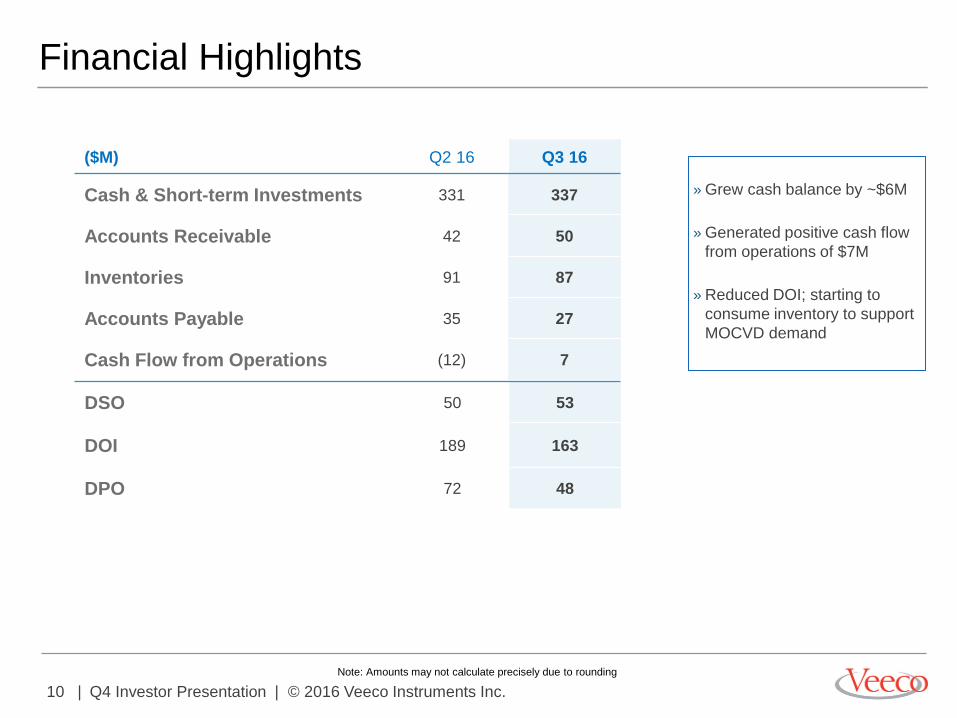
($M) Q2 16 Q3 16
Cash & Short-term Investments 331 337
Accounts Receivable 42 50
Inventories 91 87
Accounts Payable 35 27
Cash Flow from Operations (12) 7
Financial Highlights
DSO 50 53
DOI 189 163
DPO 72 48
Note: Amounts may not calculate precisely due to rounding
» Grew cash balance by ~$6M
» Generated positive cash flow
from operations of $7M
» Reduced DOI; starting to
consume inventory to support
MOCVD demand
11 | Q4 Investor Presentation | © 2016 Veeco Instruments Inc.
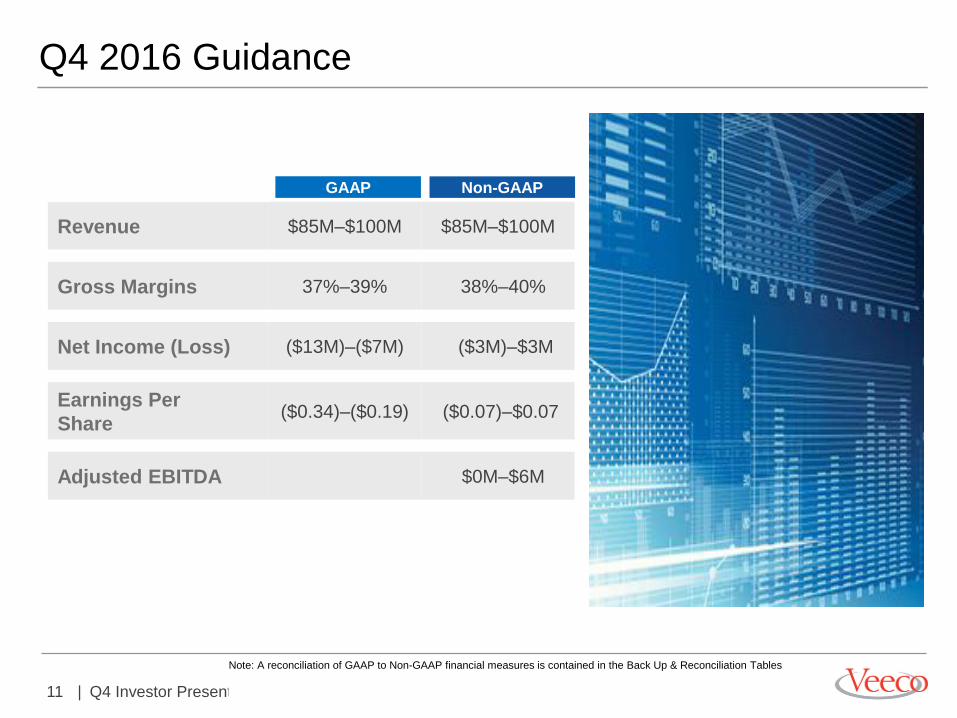
Q4 2016 Guidance
Revenue $85M–$100M $85M–$100M
Gross Margins 37%–39% 38%–40%
Net Income (Loss) ($13M)–($7M) ($3M)–$3M
Earnings Per
Share ($0.34)–($0.19) ($0.07)–$0.07
Adjusted EBITDA $0M–$6M
Non-GAAP GAAP
Note: A reconciliation of GAAP to Non-GAAP financial measures is contained in the Back Up & Reconciliation Tables
12 | Q4 Investor Presentation | © 2016 Veeco Instruments Inc.
Summary
Leverage technology
expertise and
leadership to win
organic growth
opportunities
Continue
actively exploring
M&A opportunities
Drive
operational
leverage to
enhance
shareholder
value
Focus
on positioning
Veeco for
profitable growth
13 | Q4 Investor Presentation | © 2016 Veeco Instruments Inc.
Lighting, Display &
Power Electronics
14 | Q4 Investor Presentation | © 2016 Veeco Instruments Inc.
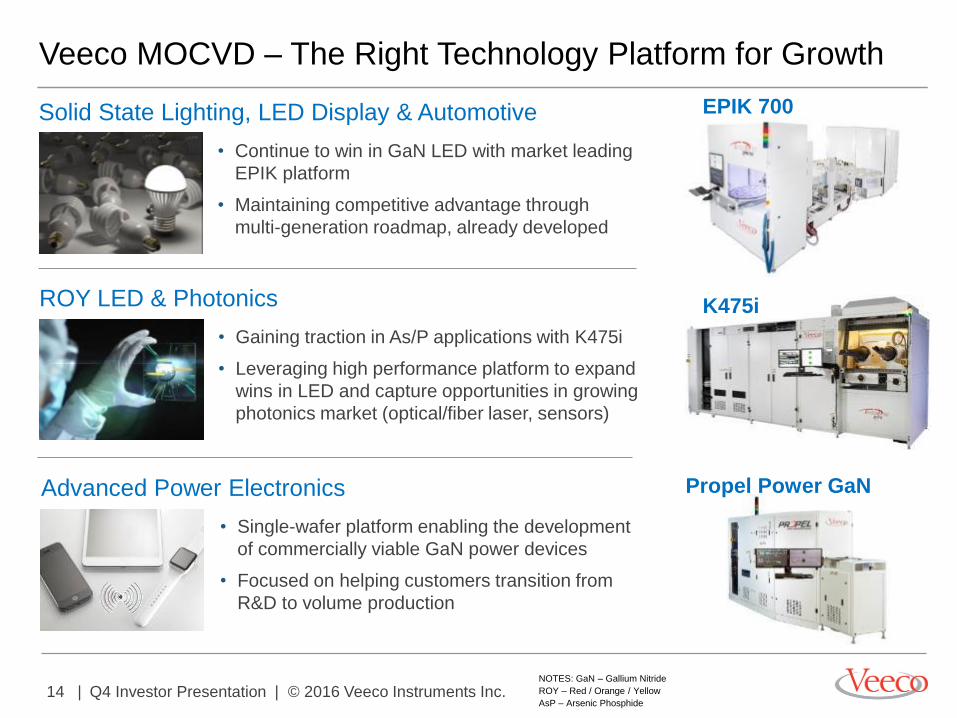
Veeco MOCVD – The Right Technology Platform for Growth
Solid State Lighting, LED Display & Automotive
• Continue to win in GaN LED with market leading
EPIK platform
• Maintaining competitive advantage through
multi-generation roadmap, already developed
ROY LED & Photonics
• Gaining traction in As/P applications with K475i
• Leveraging high performance platform to expand
wins in LED and capture opportunities in growing
photonics market (optical/fiber laser, sensors)
Advanced Power Electronics
• Single-wafer platform enabling the development
of commercially viable GaN power devices
• Focused on helping customers transition from
R&D to volume production
EPIK 700
K475i
Propel Power GaN
NOTES: GaN – Gallium Nitride
ROY – Red / Orange / Yellow
AsP – Arsenic Phosphide
15 | Q4 Investor Presentation | © 2016 Veeco Instruments Inc.
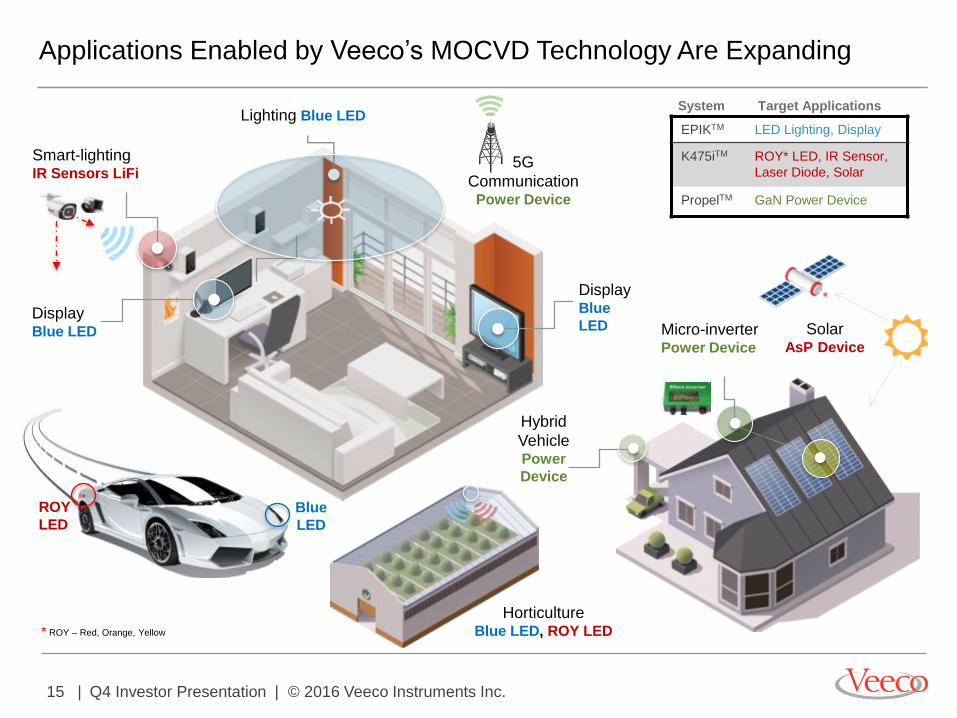
Applications Enabled by Veeco’s MOCVD Technology Are Expanding
EPIKTM LED Lighting, Display
K475iTM ROY* LED, IR Sensor,
Laser Diode, Solar
PropelTM GaN Power Device
System Target Applications
Solar AsP Device
* ROY – Red, Orange, Yellow
Smart-lighting IR Sensors LiFi
Lighting Blue LED
Display Blue LED Micro-inverter
Power Device
Hybrid
Vehicle Power
Device
5G
Communication Power Device
Blue
LED
ROY
LED
Horticulture Blue LED, ROY LED
Display Blue
LED
16 | Q4 Investor Presentation | © 2016 Veeco Instruments Inc.
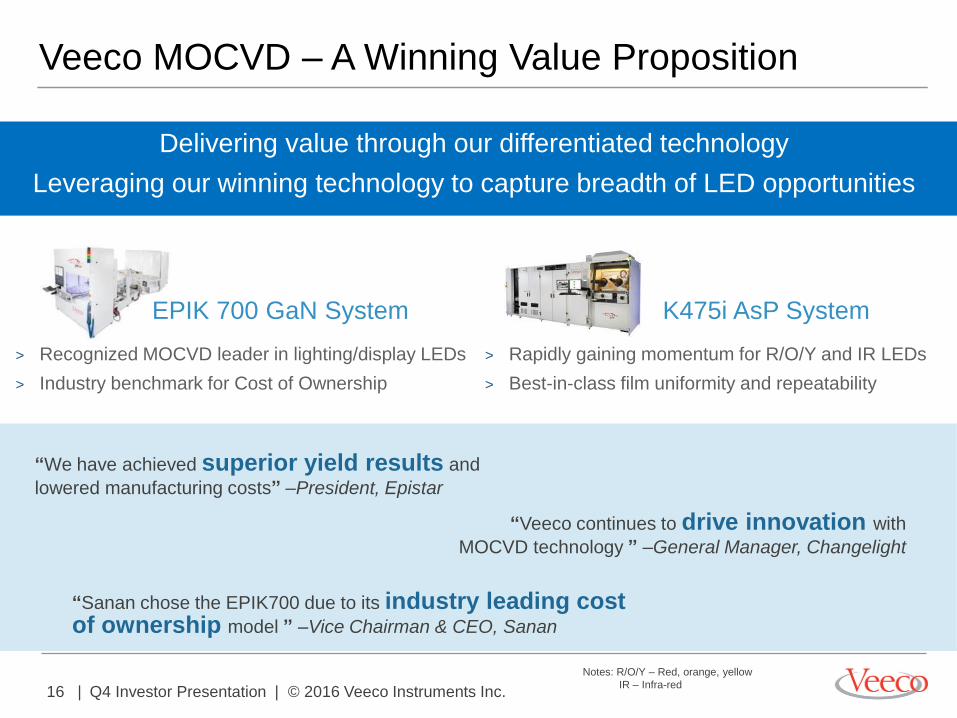
Veeco MOCVD – A Winning Value Proposition
Delivering value through our differentiated technology
Leveraging our winning technology to capture breadth of LED opportunities
> Recognized MOCVD leader in lighting/display LEDs
> Industry benchmark for Cost of Ownership
EPIK 700 GaN System
“We have achieved superior yield results and
lowered manufacturing costs” –President, Epistar
“Veeco continues to drive innovation with
MOCVD technology ” –General Manager, Changelight
“Sanan chose the EPIK700 due to its industry leading cost of ownership model ” –Vice Chairman & CEO, Sanan
K475i AsP System
> Rapidly gaining momentum for R/O/Y and IR LEDs
> Best-in-class film uniformity and repeatability
Notes: R/O/Y – Red, orange, yellow
IR – Infra-red
17 | Q4 Investor Presentation | © 2016 Veeco Instruments Inc.
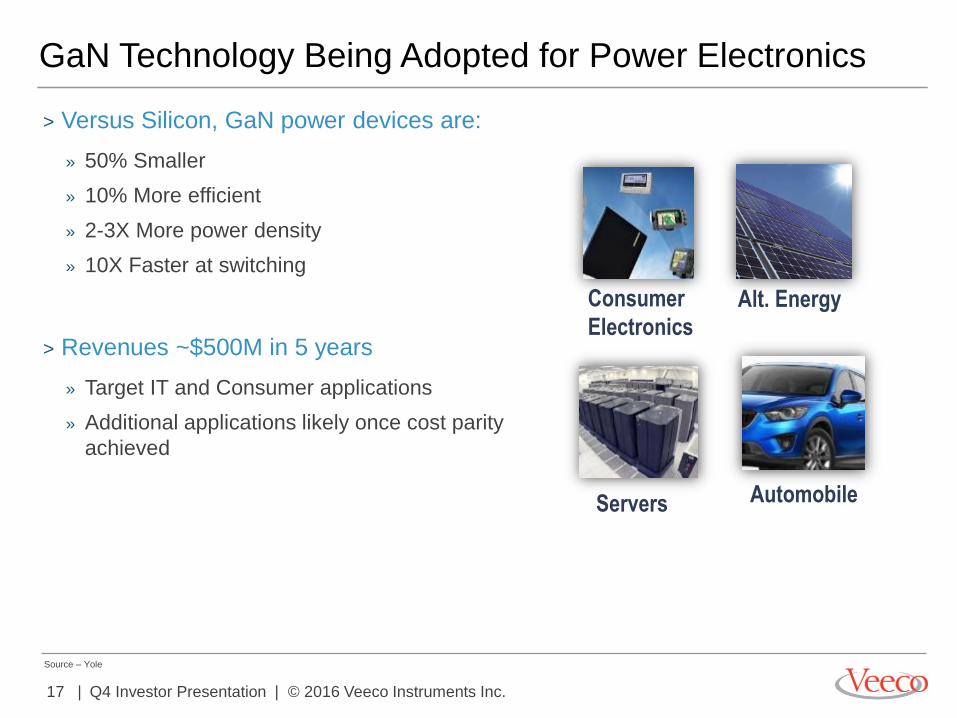
GaN Technology Being Adopted for Power Electronics
Servers
Alt. Energy Consumer
Electronics
Automobile
Source – Yole
> Versus Silicon, GaN power devices are:
» 50% Smaller
» 10% More efficient
» 2-3X More power density
» 10X Faster at switching
> Revenues ~$500M in 5 years
» Target IT and Consumer applications
» Additional applications likely once cost parity
achieved
18 | Q4 Investor Presentation | © 2016 Veeco Instruments Inc.
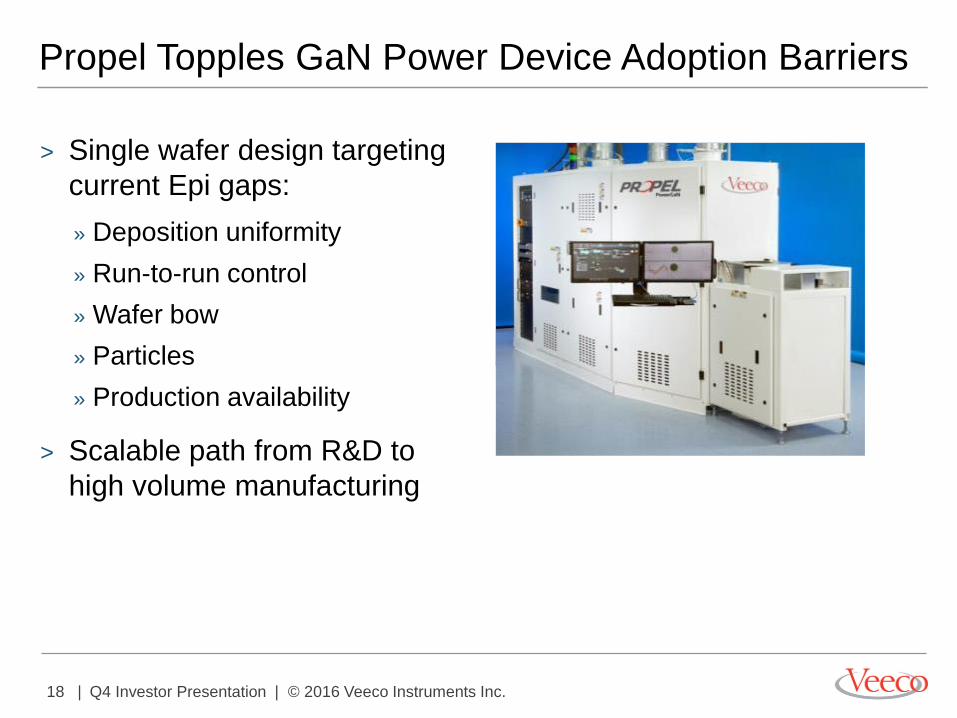
Propel Topples GaN Power Device Adoption Barriers
> Single wafer design targeting
current Epi gaps:
» Deposition uniformity
» Run-to-run control
» Wafer bow
» Particles
» Production availability
> Scalable path from R&D to
high volume manufacturing
19 | Q4 Investor Presentation | © 2016 Veeco Instruments Inc.
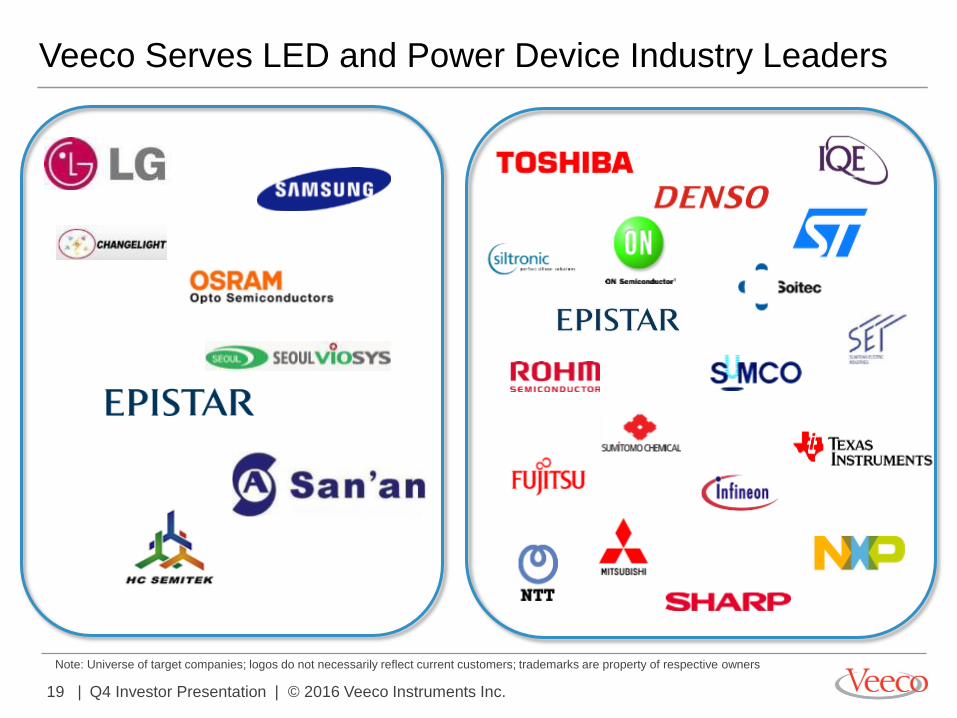
Veeco Serves LED and Power Device Industry Leaders
Note: Universe of target companies; logos do not necessarily reflect current customers; trademarks are property of respective owners
20 | Q4 Investor Presentation | © 2016 Veeco Instruments Inc.
Advanced Packaging,
MEMS, RF
21 | Q4 Investor Presentation | © 2016 Veeco Instruments Inc.
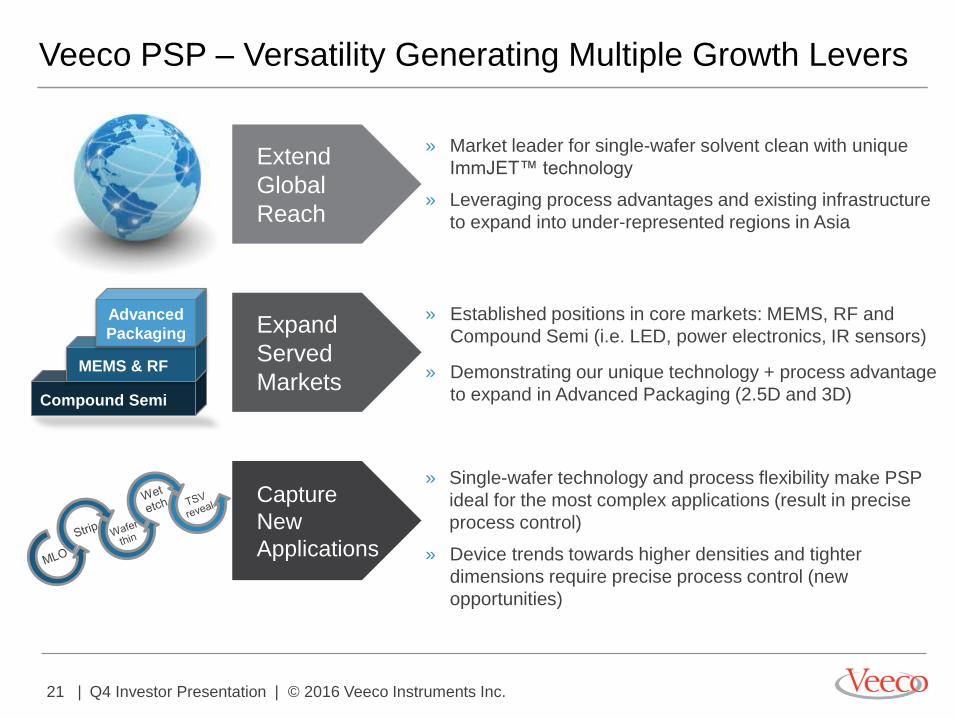
Veeco PSP – Versatility Generating Multiple Growth Levers
Expand
Served
Markets
Extend
Global
Reach
Capture
New
Applications
» Market leader for single-wafer solvent clean with unique
ImmJET™ technology
» Leveraging process advantages and existing infrastructure
to expand into under-represented regions in Asia
» Established positions in core markets: MEMS, RF and
Compound Semi (i.e. LED, power electronics, IR sensors)
» Demonstrating our unique technology + process advantage
to expand in Advanced Packaging (2.5D and 3D)
» Single-wafer technology and process flexibility make PSP
ideal for the most complex applications (result in precise
process control)
» Device trends towards higher densities and tighter
dimensions require precise process control (new
opportunities)
Compound Semi
MEMS & RF
Advanced
Packaging
22 | Q4 Investor Presentation | © 2016 Veeco Instruments Inc.
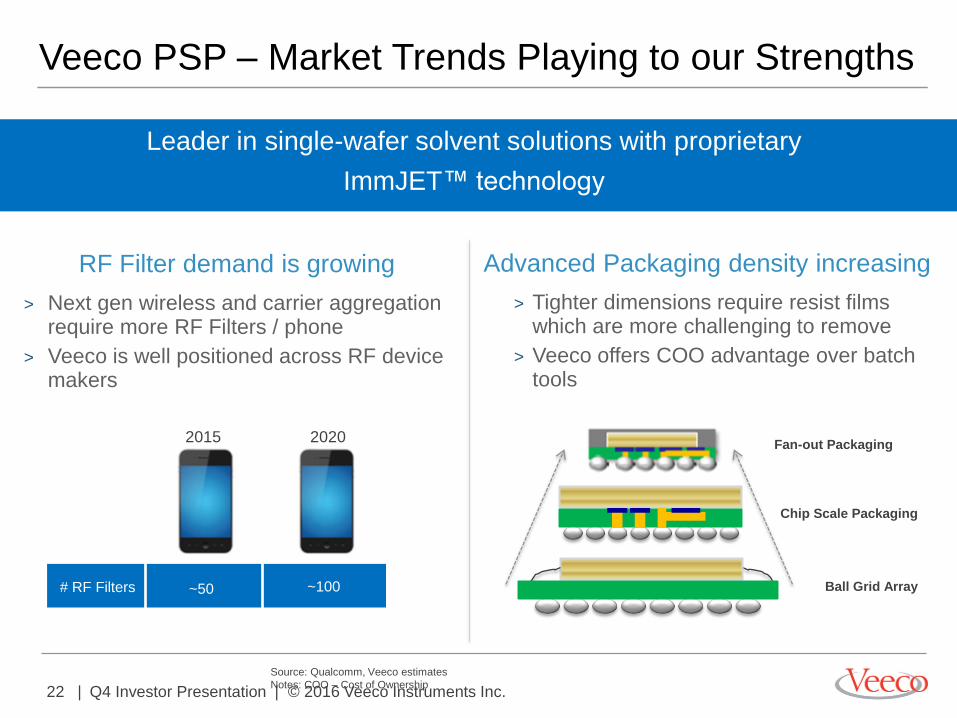
RF Filter demand is growing Advanced Packaging density increasing
Veeco PSP – Market Trends Playing to our Strengths
> Tighter dimensions require resist films which are more challenging to remove
> Veeco offers COO advantage over batch tools
Fan-out Packaging
Leader in single-wafer solvent solutions with proprietary
ImmJET™ technology
> Next gen wireless and carrier aggregation require more RF Filters / phone
> Veeco is well positioned across RF device makers
Source: Qualcomm, Veeco estimates
Notes: COO – Cost of Ownership
Chip Scale Packaging
Ball Grid Array
2015 2020
# RF Filters ~50 ~100
23 | Q4 Investor Presentation | © 2016 Veeco Instruments Inc.
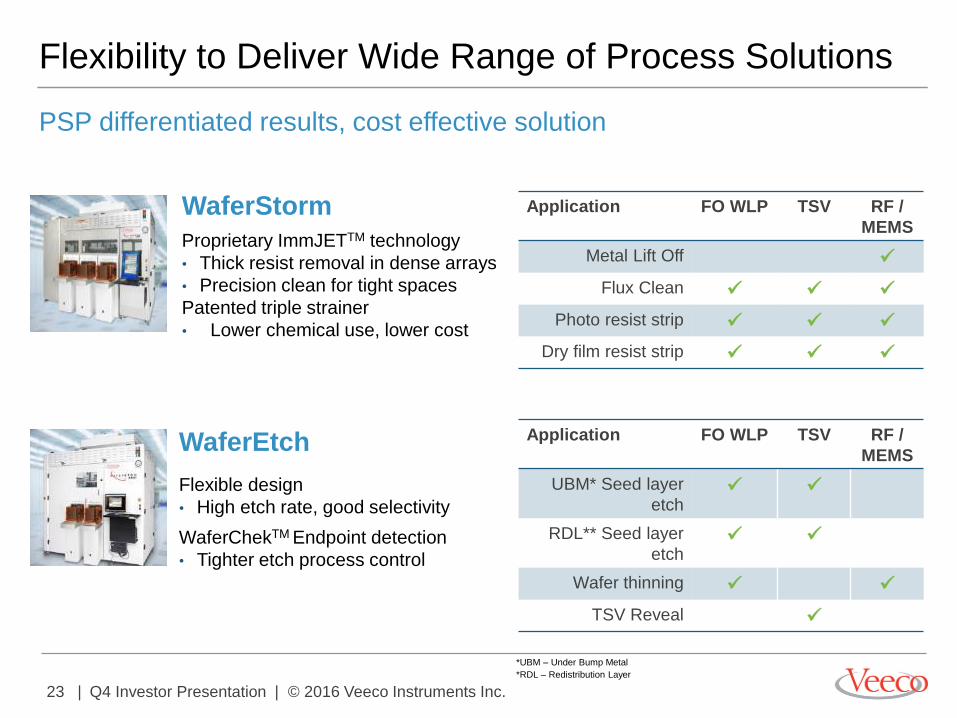
Flexibility to Deliver Wide Range of Process Solutions
Application FO WLP TSV RF /
MEMS
Metal Lift Off
Flux Clean
Photo resist strip
Dry film resist strip
Application FO WLP TSV RF /
MEMS
UBM* Seed layer
etch
RDL** Seed layer
etch
Wafer thinning
TSV Reveal
WaferStorm
Proprietary ImmJETTM technology
• Thick resist removal in dense arrays
• Precision clean for tight spaces
Patented triple strainer
• Lower chemical use, lower cost
PSP differentiated results, cost effective solution
WaferEtch
Flexible design
• High etch rate, good selectivity
WaferChekTM Endpoint detection
• Tighter etch process control
*UBM – Under Bump Metal
*RDL – Redistribution Layer
24 | Q4 Investor Presentation | © 2016 Veeco Instruments Inc.
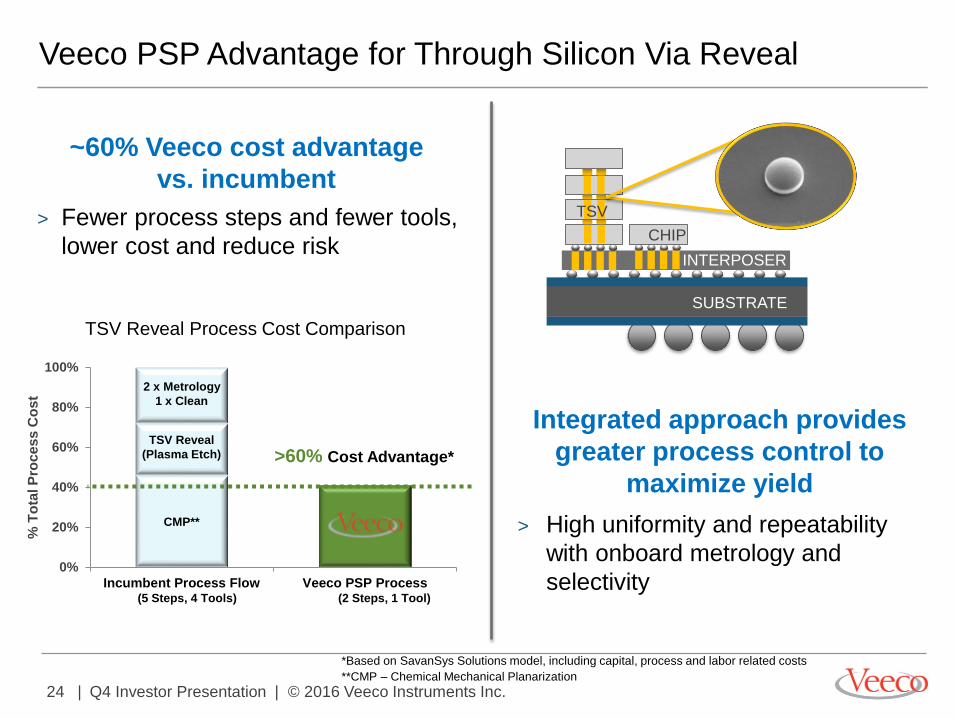
Veeco PSP Advantage for Through Silicon Via Reveal
0%
20%
40%
60%
80%
100%
Incumbent Process Flow Veeco PSP Process
% T
ota
l P
roc
es
s C
os
t
2 x Metrology
1 x Clean
TSV Reveal
(Plasma Etch)
CMP**
(5 Steps, 4 Tools) (2 Steps, 1 Tool)
INTERPOSER
SUBSTRATE
CHIP
TSV
~60% Veeco cost advantage
vs. incumbent
> Fewer process steps and fewer tools,
lower cost and reduce risk
TSV Reveal Process Cost Comparison
>60% Cost Advantage*
*Based on SavanSys Solutions model, including capital, process and labor related costs
**CMP – Chemical Mechanical Planarization
Integrated approach provides
greater process control to
maximize yield
> High uniformity and repeatability
with onboard metrology and
selectivity
25 | Q4 Investor Presentation | © 2016 Veeco Instruments Inc.
Veeco PSP Serves Top MEMS and OSAT Names
Note: Universe of target companies; logos do not necessarily reflect current customers; trademarks are property of respective owners
26 | Q4 Investor Presentation | © 2016 Veeco Instruments Inc.
Foundational
Business
27 | Q4 Investor Presentation | © 2016 Veeco Instruments Inc.
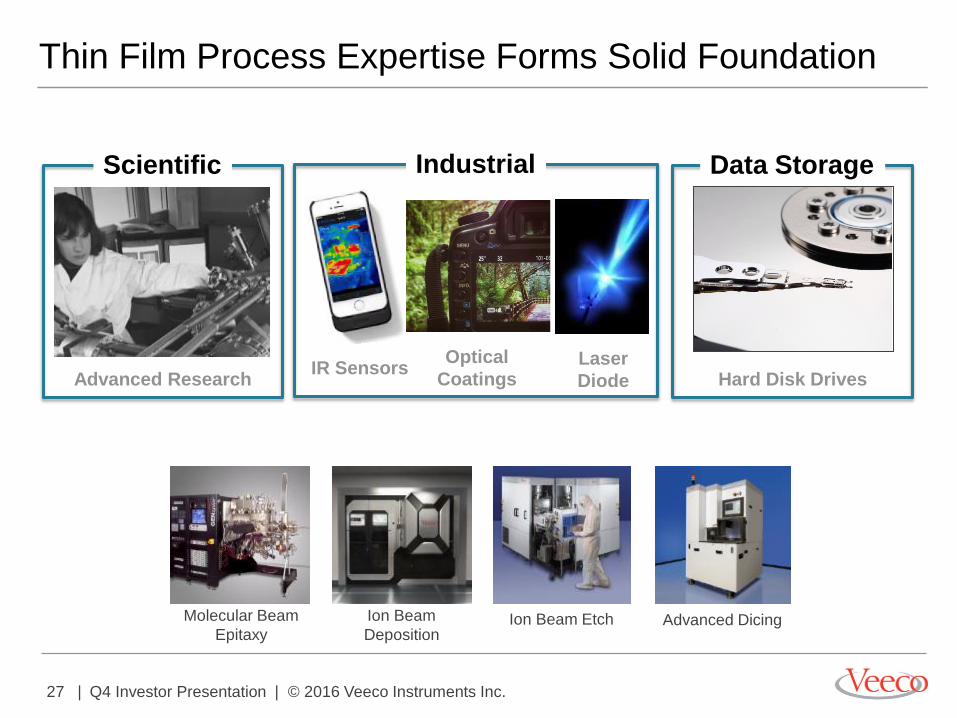
Thin Film Process Expertise Forms Solid Foundation
Ion Beam Etch Advanced Dicing Molecular Beam
Epitaxy
Ion Beam
Deposition
Data Storage
Hard Disk Drives
Industrial
Optical
Coatings
Scientific
Advanced Research IR Sensors
Laser
Diode
28 | Q4 Investor Presentation | © 2016 Veeco Instruments Inc.
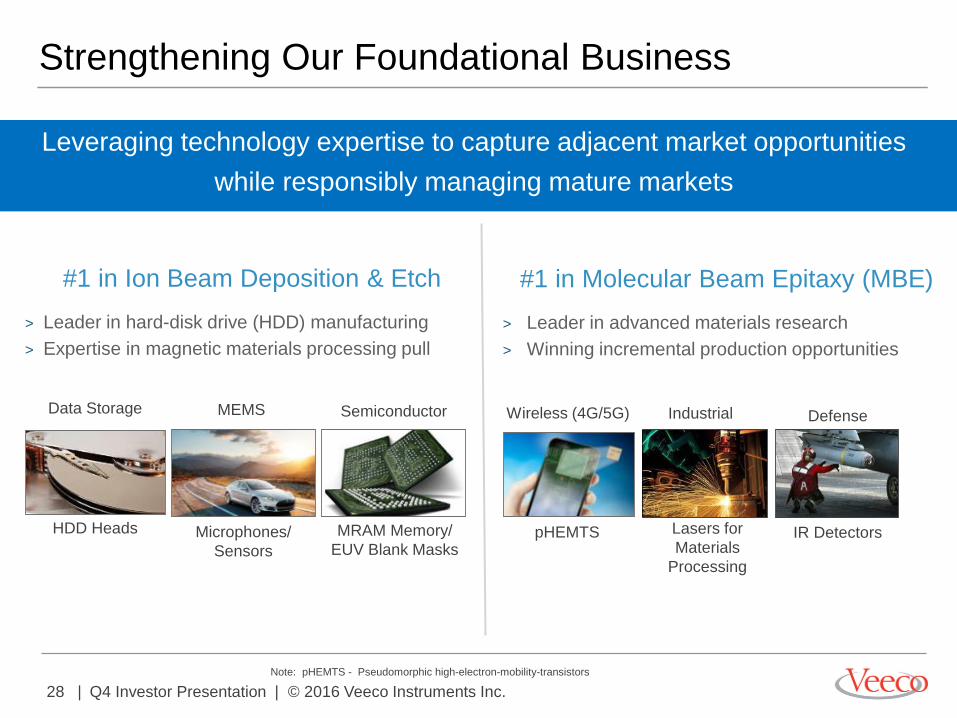
Strengthening Our Foundational Business
> Leader in advanced materials research
> Winning incremental production opportunities
#1 in Molecular Beam Epitaxy (MBE)
Wireless (4G/5G) Industrial
Lasers for
Materials
Processing
pHEMTS IR Detectors
Defense
#1 in Ion Beam Deposition & Etch
> Leader in hard-disk drive (HDD) manufacturing
> Expertise in magnetic materials processing pull
Microphones/
Sensors
MEMS Semiconductor
MRAM Memory/
EUV Blank Masks
Data Storage
HDD Heads
Leveraging technology expertise to capture adjacent market opportunities
while responsibly managing mature markets
Note: pHEMTS - Pseudomorphic high-electron-mobility-transistors
29 | Q4 Investor Presentation | © 2016 Veeco Instruments Inc.
Reconciliation
Tables
30 | Q4 Investor Presentation | © 2016 Veeco Instruments Inc.
Safe Harbor
To the extent that this presentation discusses expectations or otherwise
makes statements about the future, such statements are forward-looking
and are subject to a number of risks and uncertainties that could cause
actual results to differ materially from the statements made.
These items include the risk factors discussed in the Business Description
and Management's Discussion and Analysis sections of Veeco's Annual
Report on Form 10-K for the year ended December 31, 2015 and
subsequent Quarterly Reports on Form 10-Q and current reports on Form
8-K. Veeco does not undertake any obligation to update any forward-
looking statements to reflect future events or circumstances after the date
of such statements.
31 | Q4 Investor Presentation | © 2016 Veeco Instruments Inc.
Note On Reconciliation Tables
These tables include financial measures adjusted for the impact of certain items; these financial measures are
therefore not calculated in accordance with U.S. generally accepted accounting principles (“GAAP”). These Non-
GAAP financial measures exclude items such as: share-based compensation expense; charges relating to
restructuring initiatives; non-cash asset impairments; certain other non-operating gains and losses; and
acquisition-related items such as transaction costs, non-cash amortization of acquired intangible assets, and
incremental transaction-related compensation.
These Non-GAAP financial measures may be different from Non-GAAP financial measures used by other
companies. Non-GAAP financial measures should not be considered a substitute for, or superior to, measures of
financial performance prepared in accordance with GAAP. By excluding these items, Non-GAAP financial
measures are intended to facilitate meaningful comparisons to historical operating results, competitors' operating
results, and estimates made by securities analysts. Management is evaluated on key performance metrics
including adjusted EBITDA, which is used to determine management incentive compensation as well as to
forecast future periods.
These Non-GAAP financial measures may be useful to investors in allowing for greater transparency of
supplemental information used by management in its financial and operational decision-making. In addition, similar
Non-GAAP financial measures have historically been reported to investors; the inclusion of comparable numbers
provides consistency in financial reporting. Investors are encouraged to review the reconciliation of the Non-GAAP
financial measures used in this news release to their most directly comparable GAAP financial measures.
32 | Q4 Investor Presentation | © 2016 Veeco Instruments Inc.
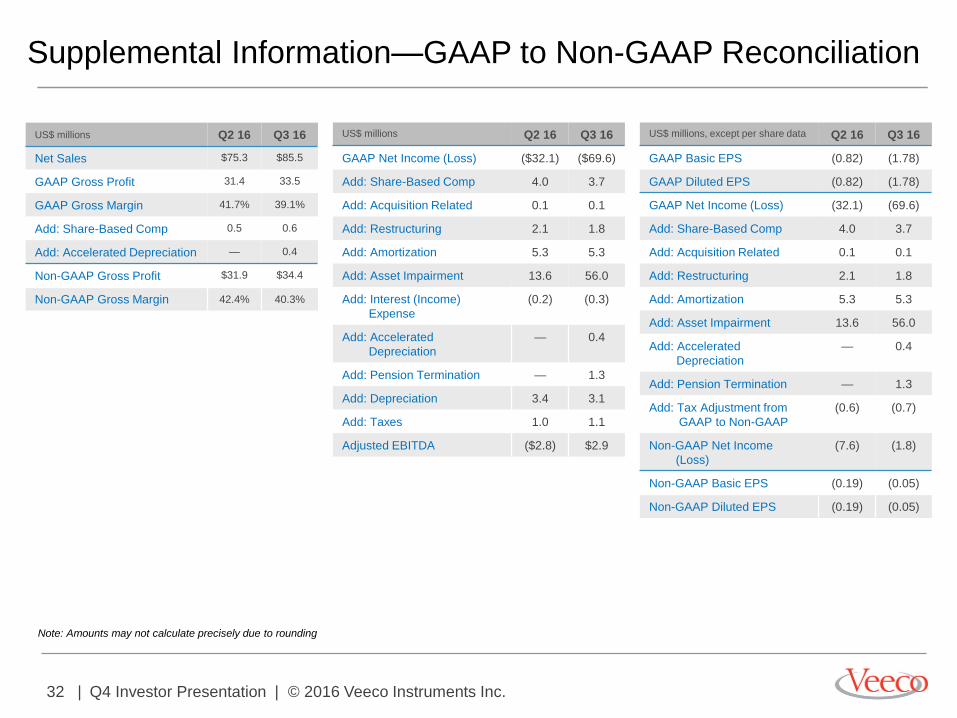
Supplemental Information—GAAP to Non-GAAP Reconciliation
US$ millions Q2 16 Q3 16
Net Sales $75.3 $85.5
GAAP Gross Profit 31.4 33.5
GAAP Gross Margin 41.7% 39.1%
Add: Share-Based Comp 0.5 0.6
Add: Accelerated Depreciation — 0.4
Non-GAAP Gross Profit $31.9 $34.4
Non-GAAP Gross Margin 42.4% 40.3%
US$ millions Q2 16 Q3 16
GAAP Net Income (Loss) ($32.1) ($69.6)
Add: Share-Based Comp 4.0 3.7
Add: Acquisition Related 0.1 0.1
Add: Restructuring 2.1 1.8
Add: Amortization 5.3 5.3
Add: Asset Impairment 13.6 56.0
Add: Interest (Income)
Expense
(0.2) (0.3)
Add: Accelerated
Depreciation
— 0.4
Add: Pension Termination — 1.3
Add: Depreciation 3.4 3.1
Add: Taxes 1.0 1.1
Adjusted EBITDA ($2.8) $2.9
US$ millions, except per share data Q2 16 Q3 16
GAAP Basic EPS (0.82) (1.78)
GAAP Diluted EPS (0.82) (1.78)
GAAP Net Income (Loss) (32.1) (69.6)
Add: Share-Based Comp 4.0 3.7
Add: Acquisition Related 0.1 0.1
Add: Restructuring 2.1 1.8
Add: Amortization 5.3 5.3
Add: Asset Impairment 13.6 56.0
Add: Accelerated
Depreciation
— 0.4
Add: Pension Termination — 1.3
Add: Tax Adjustment from
GAAP to Non-GAAP
(0.6) (0.7)
Non-GAAP Net Income
(Loss)
(7.6) (1.8)
Non-GAAP Basic EPS (0.19) (0.05)
Non-GAAP Diluted EPS (0.19) (0.05)
Note: Amounts may not calculate precisely due to rounding
33 | Q4 Investor Presentation | © 2016 Veeco Instruments Inc.
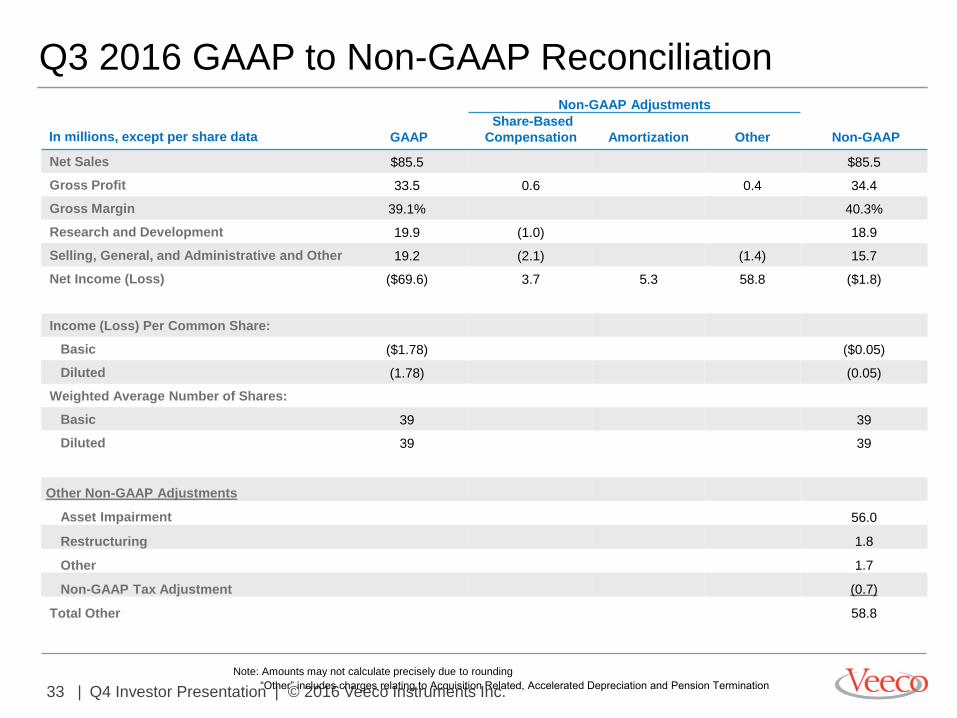
Q3 2016 GAAP to Non-GAAP Reconciliation Non-GAAP Adjustments
In millions, except per share data GAAP
Share-Based
Compensation
Amortization Other Non-GAAP
Net Sales $85.5 $85.5
Gross Profit 33.5 0.6 0.4 34.4
Gross Margin 39.1% 40.3%
Research and Development 19.9 (1.0) 18.9
Selling, General, and Administrative and Other 19.2 (2.1) (1.4) 15.7
Net Income (Loss) ($69.6) 3.7 5.3 58.8 ($1.8)
Income (Loss) Per Common Share:
Basic ($1.78) ($0.05)
Diluted (1.78) (0.05)
Weighted Average Number of Shares:
Basic 39 39
Diluted 39 39
Other Non-GAAP Adjustments
Asset Impairment 56.0
Restructuring 1.8
Other 1.7
Non-GAAP Tax Adjustment (0.7)
Total Other 58.8
Note: Amounts may not calculate precisely due to rounding
“Other” includes charges relating to Acquisition Related, Accelerated Depreciation and Pension Termination
34 | Q4 Investor Presentation | © 2016 Veeco Instruments Inc.
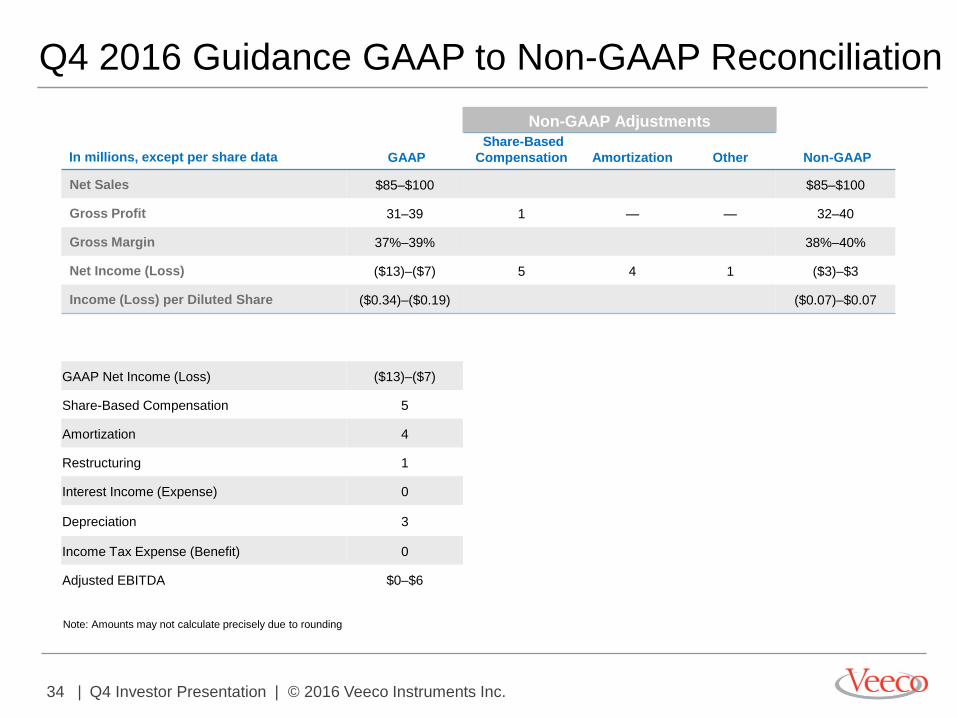
Q4 2016 Guidance GAAP to Non-GAAP Reconciliation
Non-GAAP Adjustments
In millions, except per share data GAAP
Share-Based
Compensation
Amortization Other Non-GAAP
Net Sales $85–$100 $85–$100
Gross Profit 31–39 1 — — 32–40
Gross Margin 37%–39% 38%–40%
Net Income (Loss) ($13)–($7) 5 4 1 ($3)–$3
Income (Loss) per Diluted Share ($0.34)–($0.19) ($0.07)–$0.07
GAAP Net Income (Loss) ($13)–($7)
Share-Based Compensation 5
Amortization 4
Restructuring 1
Interest Income (Expense) 0
Depreciation 3
Income Tax Expense (Benefit) 0
Adjusted EBITDA $0–$6
Note: Amounts may not calculate precisely due to rounding
Non-GAAP Adjustments
![Investor Presentation - Q4 & FY16 [Company Update]](https://cdn.vdocuments.net/doc/165x107/577c7bb11a28abe0549832d4/investor-presentation-q4-fy16-company-update.jpg)


