
International Journal of Scientific & Engineering Research, Volume 5, Issue 5, May-2014 504 ISSN 2229-5518
IJSER © 2014 http://www.ijser.org
Isotherms, kinetics and thermodynamic studies of adsorption of Cu2+ from
aqueous solutions by natural bentonite
Ayed,S., Hannachi,Y*.,Rezgui,A., Boubaker,T
Laboratory of Heterocyclic Chemistry, Natural Products and Reactivity, Faculty of Sciences of Monastir, Monastir, Tunisia
*Corresponding author; E-mail:[email protected] Abstract —In the present study, the adsorption characteristics of natural bentonite in the removal of copper (II) from aqueous solution were studied. The extent of adsorption was investigated as a function of pH, contact time, adsorbate concentration and temperature. Langmuir, Freundlich and Dubinin–Radushkevich (D–R) models were applied to describe the adsorption isotherms. The equilibrium adsorption results are fitted better with Langmuir isotherm compared to Freundlich models. The adsorption capacity of bentonite for total copper was found to be 33.33 mg/g at pH 6 and 4 g/L adsorbent dosage, 30 min equilibrium time and 20 °C. From the D–R isotherm model, the mean free energy was calculated as 10.23 kJ/mol, indicating that the adsorption of copper (II) was taken place by ion-exchange mechanism. The thermodynamic parameters showed that the adsorption of copper (II) onto bentonite was feasible, spontaneous and exothermic at 20-40°C.Kinetic results showed that the pseudo-second-order kinetic model was well fitted to the experimental data. Infrared (IR) spectra of the bentonite sample showed that the positions and shapes of the fundamental vibrations of the OH and Si–O groups were influenced by the adsorbed Cu(II) cations. The X-ray diffraction (XRD) spectra indicated that the Cu(II) adsorption onto the bentonite samples led to changes in unit cell dimensions and symmetry of the parent bentonite Index Terms — Bentonite, (IR) spectra, (XRD) spectra, thermodynamic parameters, Kinetic models, copper
I. INTRODUCTION
The environmental pollution due to toxic heavy metals is spreading through the world along with industrial progress. Heavy metals are major pollutants in marine, surface water
and even treated wastewaters. The specific problem associated with heavy metals in the environment is their accumulation in the food chain and their persistence in nature. Among these, copper is one of the most ubiquitously spread heavy metals in soil and aquatic environments. Industrial activities such as metal cleaning and plating, paper board, printed circuit board, wood pulp, fertilizer, paints and pigments are considered as the major sources of copper release into the environment [1]. It is well verified that ultra-trace amount of copper is essential for human, animals, and microorganisms. However, excessive copper can cause adverse health effects including neurotoxicity, nephrotoxicity, and deleterious effects on the hematological and cardiovascular systems [2] [3]. The
permissible limit for Cu2+ in drinking water, as described by the World Health Organization (WHO) is 1.5 mg/L [4]. As copper(II) does not degrade biologically, the control of Cu(II) pollution has special importance for both organisms that live in waters and those that benefit from waters. Conventional methods used to remove copper ions from aqueous solutions include chemical precipitation, ion exchangers, chemical oxidation/reduction, reverse osmosis, electro dialysis, ultra filtration etc [5] [6] [7] [8]. However these techniques have their own inherent limitations such as less efficiency, sensitive operating conditions, production of secondary sludge and further the disposal is a costly affair [9]. Adsorption compared with other methods appears to be an attractive process in view of its high efficiency, easy handling, availability of different adsorbents and cost effectiveness. Although there are many adsorbents used in adsorption methods, active carbon is the most common one used in
IJSER

International Journal of Scientific & Engineering Research, Volume 5, Issue 5, May-2014 505 ISSN 2229-5518
IJSER © 2014 http://www.ijser.org
wastewater treatment all over the world. However, its high cost causes restrictions in use [10]. For this reason, many studies have been carried out in order to find out effective and low cost adsorbents. Clay minerals have great potential as inexpensive and efficient adsorbents due to their large quantities, chemical and mechanical stability, high specific surface area, and structural properties. The abundance of bentonite and its low cost are likely to make it a strong candidate as an adsorbent for the removal of heavy metal from wastewater. Bentonite is a 2:1 mineral with one octahedral sheet and two silica sheets, which forms a layer. Layers are held together by van der Waals forces. The ion-exchange capacity of the bentonite therefore depends on the framework Si/Al ratio and decreases as the Si/Al ratio increases. The clays carry a net negative charge due to the broken bonds around the edges of the silica–alumina units that would give rise to unsatisfied charges, which would be balanced by the adsorbed cations. Substitutions within the lattice structure of trivalent aluminum for quardrivalent silicon in the tetrahedral sheet and of ions of lower valence particularly magnesium for trivalent aluminum in the octahedral sheet result in unbalanced charges in the structural units of clay minerals [11] [12] [13]. Adsorption of metal ions onto bentonite appears to involve two distinct mechanisms: (i) an ion exchange reaction at permanent charge sites, and (ii) formation of complexes with the surface hydroxyl groups [14] [15]. The present work was undertaken to explore the adsorption potential of bentonite (mainly
montmorillonite) in the removal of copper from aqueous solution. Experimental parameters affecting the adsorption process such as pH, contact time, adsorbent dosage and temperature were studied. The equilibrium adsorption data were evaluated by Langmuir, Freundlich and Dubinin–Radushkevich (D–R) isotherm models. Kinetic and thermodynamic parameters were also calculated to describe the adsorption mechanism. The XRD and IR spectra were used to characterize and discern the location of Cu (II) cations onto bentonite 2. MATERIALS AND METHODS
2.1. Materials
The bentonite sample was obtained from Gabés deposit located in southeastern of Tunisia. The raw clay sample was in the clod sized form when first received. Later, it was grounded and washed in deionized water several times at a 1:10 bentonite/water ratio. The mixture was stirred for 5 h and then kept standing overnight, followed by separation, washing and drying at 70 °C. 2.2. Characterization procedures The mineralogical composition of the bentonite was determined from the XRD pattern of the product taken on a Rigaku 2000 automated diffractometer using Ni filtered Cu Kα radiation. The chemical composition of bentonite was measured by X-ray fluorescence Rigaku RIX2000 and was depicted in Table 1.
Table 1. The chemical composition of bentonite
SiO2 Al2O 3 CaO K2O MgO Fe2O3 Na2O
62 .70 20 .10 2.29 2.53 3.64 2.16 0.27
IJSER

International Journal of Scientific & Engineering Research, Volume 5, Issue 5, May-2014 506 ISSN 2229-5518
IJSER © 2014 http://www.ijser.org
IR spectra of the bentonite samples were recorded in the region 4000–400 cm−1on a Mattson-1000 FTIR spectrometer at 4 cm−1 resolution. The surface area was determined by BET method using a surface area analyzer (Model 1750 SORPTY, Carlo Erba, Italy) and was found to be 18.87 m2/g. The cation exchange capacity (CEC) of the sample was estimated by using the copper bisethylenediamine complex method [16] .The value of CEC for bentonite was 15.87 mg Cu(II) g−1 bentonite. The point of zero charge (PZC) of montmorillonite was found to be 3.6 2.3. Reagents and equipments A Stock solution (1.0 g/L) of Cu2+ was prepared by dissolving CuSO4·5H2O in double distilled water and then was diluted to desired concentrations for the experiments. The pH of the solutions was adjusted to the desired value by adding 0.1 M HNO3 or 0.1M NaOH solutions before mixing the adsorbent with the solution. The metal concentrations were analyzed using an atomic absorption spectrophotometer (SHIMADZU AA-680, Japan). 2.4. Batch biosorption experiments In order to optimize the experimental conditions, the batch studies were performed for different metal concentrations (10–400mg/L), contact times (5–90 min), pH (2–8), biosorbent dosages from (1 to 20 g/L), and temperatures (20–50°C). Necessary amount of the adsorbent was equilibrated in a series of aqueous solutions (25 ml) placed in conical flasks containing different amounts of metal at
a constant pH, which was adjusted with 0.1 M HNO3 or 0.1M NaOH solution at the beginning of each experiment. The flasks were shaken for the desired contact time in an electrically thermostatic reciprocating shaker (Selecta multimatic-55, Spain) at 100 rpm. The experiments were repeated at 293, 303, 313, and 323 K. The time required for reaching the equilibrium condition estimated by drawing samples at regular intervals of time till equilibrium was reached. The contents of the flask were centrifuged and the centrifugate was analyzed for metal concentration by using flame AAS. The percent adsorption of metal ion was calculated as follows (Eq.1) :
( )100(%) ×
−=
i
fi
CCC
Adsorption (1)
where Ci and Cf are the initial and final (or equilibrium) metal concentrations, respectively.
To ensure the accuracy, reliability and reproducibility of the collected data, the measurements were carried out in duplicated and the average values are presented. 3. RESULTS AND DISCUSSION
3.1. X-ray diffraction studies of the pristine and copper-loaded bentonite
The XRD patterns of the pristine and Cu(II) loaded bentonite are presented in Fig. 1and the details of the reflection positions and intensities are reported in Table 2.
IJSER

International Journal of Scientific & Engineering Research, Volume 5, Issue 5, May-2014 507 ISSN 2229-5518
IJSER © 2014 http://www.ijser.org
Table 2. d-Spacing and relative intensity for bentonite samples Pristine d (Å) I/I0
Cu loaded d (Å) I/I0
15.49 4.47 3.84 3.62 3.33 3.09 2.80 2.63 2.24 1.72 1.52
100 54 10 12 20 16 4 24 8 12 14
13.93 4.54 3.93 3.57 3.39 3.03 2.80 2.64 2.34 1.71 1.52
100 76 18 16 24 20 8 30 16 12 32
For the XRD pattern of the pristine bentonite, one reflection was observed in the region 2° <2θ <8°. This corresponds to the 5.82° (2θ) value from which the interlamellar distance was found to be 15.49 Å (Fig. 1.a). However, several reflections were observed in the region 2° <2θ <8° for the pattern of the Cu(II) saturated bentonite sample(Fig. 1.b). One reflection situated at a higher 2θ value corresponds to the basal spacing, the other reflections situated at a lower 2θ values are likely to appear because of the agglomeration of clay sheets [17]. The adsorption of Cu(II) onto the bentonite led to decrease in the basal space of the host material from 15.49 to 13.93 Å. The intensity gain in Cu loaded bentonite is approximately 1.36 fold higher than in its host material counterpart. The differences of XRD patterns of the pristine and metal-loaded bentonite indicate the effects of Cu (II) adsorption on the stucture of clay mineral, and are not sample-specific.
The XRD spectra of Cu- loaded bentonite indicated that the copper adsorption may lead to changes in unit cell dimensions and symmetry of the parent bentonite. Also, the Bragg angle for several reflections has notably changed, while for others it essentially remained same. These findings show that Cu(II) cations are arranged in one or more
equivalent positions and they contribute to the reflection intensities.
Fig. 1. The XRD patterns of the pristine (a) and Cu(II) loaded bentonite (b).
3.2. IR spectra studies of the pristine and metal-loaded bentonite
The XRD and IR spectra of bentonite indicate that montmorillonite is the dominant mineral phase in this clay (Figs. 1a and 2a).
IJSER

International Journal of Scientific & Engineering Research, Volume 5, Issue 5, May-2014 508 ISSN 2229-5518
IJSER © 2014 http://www.ijser.org
Fig.2. IR spectra of the pristine (a) and Cu (II) loaded bentonite (b)
The absorption band at 3639 cm−1 is due to stretching vibrations of structural OH groups of montmorillonite. The bands corresponding to AlAlOH, AlFeOH and AlMgOH bending vibrations were observed at 943, 894 and 845 cm−1, respectively. A complex band at 1045 cm−1 is related to the stretching vibrations of Si–O groups, while the bands at 535 and 474 cm−1 are due to Al–O–Si and Si–O–Si bending vibrations, respectively. The band at 635 cm−1 was assigned to coupled Al–O and Si–O out-of-plane vibrations. Water in montmorillonite gave a broad band at 3421 cm−1 corresponding to the H2O-stretching vibrations, with a shoulder near 3370 cm−1, due to an overtone of the bending vibration of water observed at 1662 cm−1 . Detailed analysis of IR spectra in the whole spectral region (4000–400 cm−1) can be use for discern of the location of Cu (II) cations. The structural modifications of the tetrahedral and octahedral sheets due to the adsorbed Cu (II) ions influenced the fundamental vibrations of the Si–O and OH groups (Fig. 2b). For example, the stretching OH band was shifted up to 3648 cm−1 and moreover, a new band appeared near 3527 cm−1 in the spectrum of Cu (II)-saturated bentonite sample. This band, assigned to AlMgCuOH vibration, confirms the presence of the Cu (II) ions in the former vacant octahedral sites. The IR pattern of the Cu (II)-saturated bentonite sample showed a strong broad band of water near 3468 cm−1, due to the overlapping asymmetric ν3 and symmetric ν1
(H–O–H) stretching vibrations and the absorption near 1640 cm−1 related to the ν2 (H–O–H) bending vibrations. The band of RB at 3374 cm−1 was ascribed to an overtone (2ν2) of the bending mode [18]. The broad band near 1045 cm−1, assigned to complex Si–O stretching vibrations in the tetrahedral sheet, upon saturation process moved to 1058 cm−1 for the pristine bentonite sample. The position of the Si–O bending vibration at 535 cm−1, due to Si–O–Al remained basically unchanged for the Cu (II)-loaded sample, but some broadening and a decrease in intensity of the Si–O–Al band were observed . 3.2. Effect of pH
The pH value of a solution strongly influences not only the site dissociation of the adsorbent surface, but also the solution chemistry of the heavy metals: hydrolysis, complexation by organic and/or inorganic ligands, redox reactions, precipitation and the adsorption availability of the heavy metals. The effect of pH on adsorption efficiency is shown in Fig. 3.
0
20
40
60
80
100
120
0 2 4 6 8 10
Bios
orpt
ion
(%)
pH
Fig 3. Effect of pH on biosorption of Cu(II) onto bentonite (metal concentration, 10 mg · L−1; temperature, 20 °C). The high adsorption was obtained at pH 5–9. At higher pH values than 9, metal precipitation was observed. The maximum adsorption yield was 96% at pH 5 and this pH
IJSER

International Journal of Scientific & Engineering Research, Volume 5, Issue 5, May-2014 509 ISSN 2229-5518
IJSER © 2014 http://www.ijser.org
value was selected as optimum pH for further studies. The effect of pH can be explained considering the surface charge on the adsorbent material. Under acidic conditions, (pH 2–4), the low adsorption capacity can be attributed to the increase in positive charge (protons) density on the surface sites and thus, electrostatic repulsion occurred between the metal ions (Cu2+) and the edge groups with positive charge (Si OH2+) on the surface as follows:
In an alkaline medium (pH > 7), the surface of bentonite becomes negatively charged and electrostatic repulsion decreases with raising pH due to reduction of positive charge density on the sorption edges thus resulting in an increase metal adsorption. This mechanism can be shown as follows [19] [20]
3.3 Effect of adsorbent dosage The adsorbent concentration is another important variable during metal uptake. The influence of adsorbent dosage on the adsorption of Cu (II) is shown in Fig.4.
30
40
50
60
70
80
90
100
110
1 2 3 4 5 6 7
Bios
orpt
ion
(%)
Adsorbent dosage (g/L)
Fig 4. Effect of biomass dosage on adsorption of Cu(II) onto bentonite (metal concentration, 10 mg · L−1; pH 6; temperature, 20 ◦C).
The copper adsorption steeply increases with the adsorbent concentration up to 4 g/L. This is attributed to the availability of more active sites on the adsorbent and thus making easier penetration of the metal ions to the sorption sites. There is no significant increase in removal of Cu (II) when biosorbent dosage increases beyond 4 g/L. This suggests that after a certain adsorbent dosage, the maximum adsorption is attained and hence the amount of ions remains constant even with further increase in the surface area of the adsorbent, which in turn increases the number of binding sites [21] [22] . Therefore, the optimal biomass concentration was selected as 4 g L−1 for the further experiments. 3.4. Effects of contact time and temperature
The effect of contact time on the adsorption of Cu (II) ion onto bentonite at the temperature range, 20- 40 °C is shown in Fig. 5.
20
40
60
80
100
120
0 20 40 60 80 100
313 K303 K293 K
Bios
orpt
ion
(%)
contact time (min)
Fig 5. Effect of contact time and temperature on adsorption of Cu(II) onto bentonite (metal concentration, 10 mg · L−1; biomass dosage, 4 g · L−1; pH 6). According to this figure, the adsorption yield of Cu (II) increased with contact time up to 30 min. After this time there was no considerable increase. Therefore, 30 min was selected as the optimum contact time for all further experiments. Temperature of the medium is also an effective parameter on adsorption
MO + H OH M OH+2 + OH
-
SiOH + OH- SiO- + H2O
SiO + M2+Si O M2+IJSER
International Journal of Scientific & Engineering Research, Volume 5, Issue 5, May-2014 510 ISSN 2229-5518
IJSER © 2014 http://www.ijser.org
efficiency. Fig. 5 also shows the effect of the temperature on the adsorption of Cu(II) onto bentonite. The adsorption percent decreased from 96% to 78% as temperature was increased from 20 to 40°C. This result indicated the exothermic nature of copper adsorption onto bentonite. The decreasing in adsorption efficiency may be attributed to either the damage of active binding sites in the adsorbent or increasing tendency to desorb metal ions from the interface to the solution [23] [24]. The optimum solution temperature was selected as 20 °C for further adsorption experiments. 3.5. Adsorption isotherms
The adsorption isotherms describe the fraction of sorbate molecules that are partitioned between liquid and solid phases at equilibrium. In this study, the equilibrium data were evaluated by three isotherms models, which are namely the Langmuir, Freundlich and Dubinin–Radushkevich (D–R) isotherm models were analyzed. The Langmuir isotherm assumes monolayer adsorption on a uniform surface with a finite number of adsorption sites [25]. Once a site is filled, no further sorption can take place at that site. As such the surface will eventually reach a saturation point where the maximum adsorption of the surface will be achieved. The linear form of the Langmuir isotherm model is described as:
maxmax
1qC
bqqC e
e
e += (2)
Where qe is the equilibrium metal ion concentration on the adsorbent (mg/g), Ce is the equilibrium metal ion concentration in the solution (mg/L), qmax is the monolayer adsorption capacity of the adsorbent (mg/g), and b is the Langmuir adsorption constant
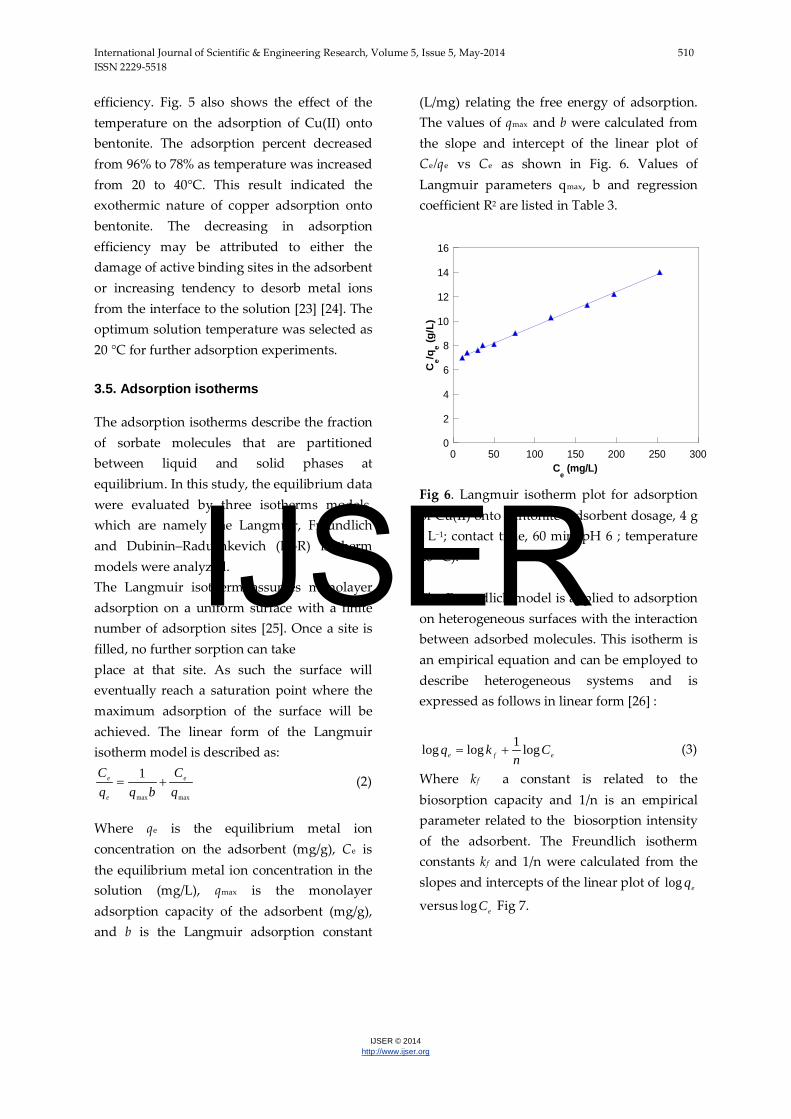
(L/mg) relating the free energy of adsorption. The values of qmax and b were calculated from the slope and intercept of the linear plot of Ce/qe vs Ce as shown in Fig. 6. Values of Langmuir parameters qmax, b and regression coefficient R2 are listed in Table 3.
0
2
4
6
8
10
12
14
16
0 50 100 150 200 250 300
Ce/q
e (g/L
)
Ce (mg/L)
Fig 6. Langmuir isotherm plot for adsorption of Cu(II) onto bentonite (adsorbent dosage, 4 g · L−1; contact time, 60 min; pH 6 ; temperature 20 °C). The Freundlich model is applied to adsorption on heterogeneous surfaces with the interaction between adsorbed molecules. This isotherm is an empirical equation and can be employed to describe heterogeneous systems and is expressed as follows in linear form [26] :
efe Cn
kq log1loglog += (3)
Where kf a constant is related to the biosorption capacity and 1/n is an empirical parameter related to the biosorption intensity of the adsorbent. The Freundlich isotherm constants kf and 1/n were calculated from the slopes and intercepts of the linear plot of eqlog
versus eClog Fig 7.
IJSER

International Journal of Scientific & Engineering Research, Volume 5, Issue 5, May-2014 511 ISSN 2229-5518
IJSER © 2014 http://www.ijser.org
1
1,5
2
2,5
3
0 0,2 0,4 0,6 0,8 1 1,2 1,4 1,6
logq
e
log Ce
Fig 7. Freundlich isotherm plot for adsorption of Cu(II) bentonite (adsorbent dosage, 4 g · L−1; contact time, 60 min; pH 6 ; temperature 20 °C).
The 1/n value in Freundlich equation was found to be 0.6, Table 1. Since 1/n lie between 0 and 1, this indicates that the adsorption of Cu(II) onto bentonite was favourable at studied conditions. From the data in Table 3, it was observed that Langmuir model showed a better fit than the Freundlich isotherm, thus indicating the applicability of monolayer coverage of copper (II) ions on the bentonite surface. The equilibrium data were also subjected to the Dubinin–Radushkevich (D–R) isotherm model to determine the nature of adsorption processes as physical or chemical.The D–R isotherm is a semi-empirical equation where adsorption follows a pore filling mechanism. The linear presentation of the D–R isotherm equation [27] is expressed as :
2lnln βε−= me qq (4)
where qe is the amount of metal ions adsorbed on per unit weight of adsorbent (mol/L), qm is the maximum adsorption capacity (mol/g), β is the activity coefficient related to adsorption mean free energy (mol2/J2) and ε is the Polanyi
potential [ )11ln(eC
RT +=ε ].
The D–R isotherm model well fitted the equilibrium data since the R2 value was found to be 0.997 (Fig. 8). From the intercept of the plots, the qm value was found to be 2.1 ×10⁻⁴ mol/g. The adsorption mean free energy (E, kJ/mol) is as follow:
β21−
=E (5)
The E (kJ/mol) value gives information about adsorption mechanism, physical or chemical. If it lies between 8 and 16 kJ/mol, the adsorption process takes place chemically and while E < 8 kJ/mol, the adsorption process proceeds physically. The mean adsorption energy was calculated as 10.23 kJ/mol for the adsorption of Cu (II)) ions. These results indicated that the adsorption processes of Cu (II) onto bentonite may be carried out via chemisorptions involving valence forces through sharing or exchange of electrons between sorbent and sorbate [28] .
Table 3. Langmuir and Freundlich, constants for Cu (II) adsorption onto bentonite
Langmuir constant Freundlich constant qmax (mg g-1) KL (L mg-1) R2 Kf 1/n R2 33.33 18.75 x10⁻² 0.995 10.78 0.9 0.978
IJSER

International Journal of Scientific & Engineering Research, Volume 5, Issue 5, May-2014 512 ISSN 2229-5518
IJSER © 2014 http://www.ijser.org
-13
-12
-11
-10
-9
-8
20 40 60 80 100
lnq e (m
ol/g
)
ε2x 10⁷ (J2/mol2)
Fig 8. D–R isotherm plot for adsorption of Cu (II) bentonite (adsorbent dosage, 4 g · L−1; contact time, 60 min; pH 6; temperature 20 °C). 3.6. Adsorption Kinetics Study
In order to investigate the mechanism of adsorption, particularly potential rate-controlling step, the transient behavior of the copper metal ion (Cu2+) adsorption process was analyzed using the pseudo-first-order, and pseudo-second-order. Pseudo-first-order kinetics equation as expressed by Lagergren [29] can be written as
( ) tkqqq ete 1lnln −=− (6)
where qt and qe (mg/g) are the amounts of the metal ions adsorbed at equilibrium (mg/g) and t (min), respectively and k1 is the rate constant of the equation (min−1). The values of the rate constant, k1, equilibrium adsoption capacity, qe, and the correlation coefficient,R2,were calculated from the plots of log(qe −qt) versus t (figure is not shown) (Table 4). Kinetic data were further treated with pseudo second-order kinetic model which is given in the following form:
2222
1qt
qkqt
t
+= (7)
where k2 (gmg−1 min−1) is the rate constant of adsorption, q2 is maximum adsorption
capacity (mg g−1) [30] . The values of k1, qe and k2, q2 were obtained from the slopes and intercepts of plots of log (qe −qt) versus t and t/qt versus t at different temperatures.
The linear plots of t/qt versus t for the pseudo-second order model for the adsorption of Cu (II) ions onto bentonite at 20–40°C were shown in Fig. 9.
0
2
4
6
8
10
12
0 5 10 15 20 25 30
50°C40°C30°C20°C
t/qt
t(min)
Fig 9. Pseudo-second-order kinetic plots at different temperatures (adsorbent dosage, 4 g ·L−1; contact time, 60 min; pH 6; temperature 20°C).
The Pseudo-first-order and pseudo-second-order parameters adsorption of Cu (II) ions onto bentonite at different temperatures were given in Table 4.
The data show that the correlation coefficient values (R2) for pseudo-first-order kinetics are very low in comparison to pseudo-second-order kinetics (Table 4). The values of theoretical adsorption capacity qe(theo) are very near to experimental values qe(exp) for second-order kinetics but for first-order kinetics equation these values are very different. Higher correlation coefficient (R2) values and similar qe(cal) and qe(exp) values indicate the better applicability of pseudo-second-order kinetics model.
IJSER

International Journal of Scientific & Engineering Research, Volume 5, Issue 5, May-2014 513 ISSN 2229-5518
IJSER © 2014 http://www.ijser.org
Table.4 Pseudo-first-order and pseudo-second-order parameters adsorption of Cu (II) ions onto bentonite at different temperatures Temperature
(°C) qe exp (mg g-1) pseudo-first-order pseudo-second-order
K1(min-1) qe cal(mg g-1) R2 k2(g mg-1) qe cal(mg g-1) R2
20 1.12 8.4.10-2 0.58 0.984 0.27 1.09 0.999
30 1.05 7.8.10-2 0.56 0.996 0.23 0.99 0.997
40 0.94 7.1.10-2 0.49 0.991 0.21 0.90 0.996
50 0.87 4.5.10-2 0.41 0.984 0.18 0.85 0.995
3.7. Thermodynamic Parameters
The mechanism of adsorption can be checked through determining thermodynamic parameters like Gibbs free energy 0G∆ , enthalpy 0H∆ and entropy 0S∆ . These parameters were calculated by the following equations:
RTH
RSkc
∆−
∆=ln (Van’t Hoff equation) (8)
bRTG ln−=°∆ (9)
Where b is the Langmuir constant (L/mol) , T is absolute temperature (K), R is gas constant. When ln b versus 1/T is plotted (Fig.10.), 0H∆ and 0S∆ values can be computed from slope and intercept of the Van’t Hoff equation [31]. The calculated parameters were given in Table 5.
8
8,5
9
9,5
10
10,5
11
11,5
12
3,15 3,2 3,25 3,3 3,35 3,4 3,45
Lnk c
10-3 x (1/T), K-1
Fig.10. Determination of thermodynamic parameters for adsorption of Cu(II) onto bentonite
The negative 0G∆ values indicated thermodynamically feasible and spontaneous nature of the adsorption. The decrease in 0G∆value with increase in temperature shows a decrease in feasibility of adsorption at higher temperatures.
The Negative value of 0H∆ is indicator of exothermic nature of the adsorption and also its magnitude gives information on the type of adsorption, which can be either physical or chemical. Therefore, the 0H∆ values showed that the adsorption process of Cu (II) ions onto bentonite was taken place via ion exchange [32]. The 0S∆ parameter was found to be (-47.41 J/mol K), implying a decrease in the randomness at the solid/solution interface during the biosorption process [33].
3.8. Comparison of Cu (II) Removal with Different Adsorbents Reported in Literature
The adsorption capacity of bentonite for the removal of Cu (II) has been compared with that of different adsorbents reported in literature and the values of sorption capacities have been presented in table 6.
IJSER
International Journal of Scientific & Engineering Research, Volume 5, Issue 5, May-2014 514 ISSN 2229-5518
IJSER © 2014 http://www.ijser.org
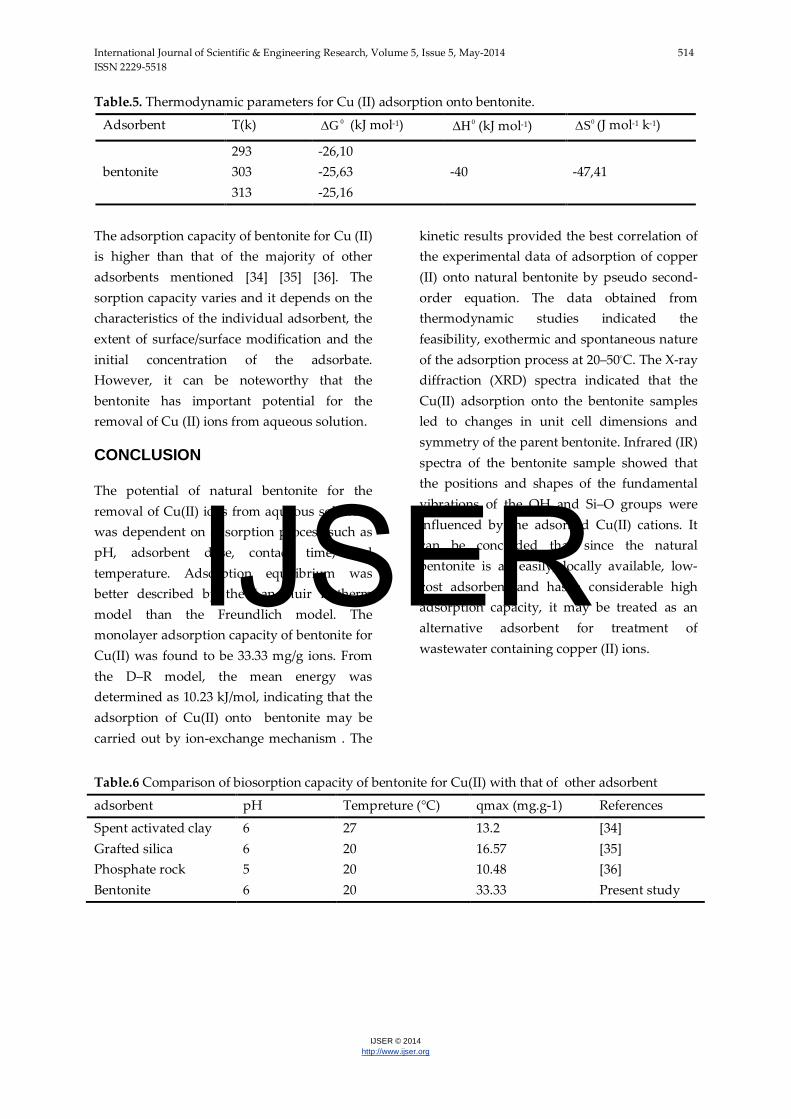
Table.5. Thermodynamic parameters for Cu (II) adsorption onto bentonite.
Adsorbent T(k) 0G∆ (kJ mol-1) 0H∆ (kJ mol-1) 0S∆ (J mol-1 k-1)
bentonite
293 -26,10 -40
-47,41 303 -25,63
313 -25,16
The adsorption capacity of bentonite for Cu (II) is higher than that of the majority of other adsorbents mentioned [34] [35] [36]. The sorption capacity varies and it depends on the characteristics of the individual adsorbent, the extent of surface/surface modification and the initial concentration of the adsorbate. However, it can be noteworthy that the bentonite has important potential for the removal of Cu (II) ions from aqueous solution.
CONCLUSION The potential of natural bentonite for the removal of Cu(II) ions from aqueous solutions was dependent on adsorption process such as pH, adsorbent dose, contact time, and temperature. Adsorption equilibrium was better described by the Langmuir isotherm model than the Freundlich model. The monolayer adsorption capacity of bentonite for Cu(II) was found to be 33.33 mg/g ions. From the D–R model, the mean energy was determined as 10.23 kJ/mol, indicating that the adsorption of Cu(II) onto bentonite may be carried out by ion-exchange mechanism . The
kinetic results provided the best correlation of the experimental data of adsorption of copper (II) onto natural bentonite by pseudo second-order equation. The data obtained from thermodynamic studies indicated the feasibility, exothermic and spontaneous nature of the adsorption process at 20–50°C. The X-ray diffraction (XRD) spectra indicated that the Cu(II) adsorption onto the bentonite samples led to changes in unit cell dimensions and symmetry of the parent bentonite. Infrared (IR) spectra of the bentonite sample showed that the positions and shapes of the fundamental vibrations of the OH and Si–O groups were influenced by the adsorbed Cu(II) cations. It can be concluded that since the natural bentonite is an easily, locally available, low-cost adsorbent and has a considerable high adsorption capacity, it may be treated as an alternative adsorbent for treatment of wastewater containing copper (II) ions.
Table.6 Comparison of biosorption capacity of bentonite for Cu(II) with that of other adsorbent
adsorbent pH Tempreture (°C) qmax (mg.g-1) References
Spent activated clay 6 27 13.2 [34] Grafted silica 6 20 16.57 [35] Phosphate rock 5 20 10.48 [36] Bentonite 6 20 33.33 Present study
IJSER

International Journal of Scientific & Engineering Research, Volume 5, Issue 5, May-2014 515 ISSN 2229-5518
IJSER © 2014 http://www.ijser.org
REFERENCES
[1] Ayhan, S., I.,Engil, Mahmut, O., and Harun T. (2009). Kinetic and isotherm studies of Cu(II) biosorption onto valonia tannin resin. Journal of Hazardous Materials, 162, 1046–1052.
[2] Qingqing, P., Yunguo, L., Guangming, Z., Weihua, X., Chunping, Y., and Jingjin, Z. (2010). Biosorption of copper(II) by immobilizing Saccharomyces cerevisiae on the surface of chitosan-coated magnetic nanoparticles from aqueous solution. Journal of Hazardous Materials, 177, 676–682.
[3] Ningchuan, F., Xueyi, G., and Sha, L. (2009). Adsorption study of copper (II) by chemically modified orange peel. Journal of Hazardous Materials, 164, 1286–1292.
[4] Rao, C.S.(1992). Environmental Pollution Control Engineering. Wiley Eastern, New Delhi.
[5] Qodah, Z.A. (2006). Biosorption of heavy metal ions from aqueous solutions by activated
Sludge. Desalination, 196, 164–176.
[6] Ozcan, A., Ozcan, A.S., Tunali, S., Akar, T., and Kiran, I. (2005). Determination of the equilibrium, kinetic and thermodynamic parameters of adsorption of copper (II) ions onto seeds of capsicum annuum. Journal of Hazardous Materials, 124, 200–208.
[7] Inglezakis, V. J., Loizidou, M. D., and Grigoropoulou, H. P. (2003). Ion exchange of Pb 2+ , Cu 2+ , Fe 3+ and Cr 3+ on natural clinoptilolite: selectivity determination and influence on activity on metal uptake. Journal of Colloid and Interface Science, 261, 4954.
[8] Nouri, J., Mahvi, A. H., and Bazrafshan, E. (2010). Application of electrocoagulation process in removal of zinc and copper from aqueous solutions by aluminium electrodes. International Journal of Environmental Research, 4, 201-208.
[9] Ali, I., Protoc, N., and Gupta, V.K. (2007). Advances in water treatment by adsorption technology. Nature protocols, 1, 2661-2667
[10] Hannachi, Y., Shapovalov, N.A., and Hannachi, A. (2010). Adsorption of nickel from aqueous solution by the use of low-cost adsorbents. Korean J. Chem. Eng., 27, 152–158.
[11] Bhattacharyya, K., G., and Gupta, S., S. (2008). Adsorption of a few heavy metals on natural and modified kaolinite and montmorillonite: A review. Advances in Colloid and Interface Science, 140, 114–131.
[12] Gupta, S. S., and Bhattacharyya, K. G. (2008). Immobilization of Pb(II), Cd(II) and Ni(II) ions on kaolinite and montmorillonite surfaces from aqueous medium. Journal of Environmental Management, 87, 46–58.
[13] Tushar, K. S. , and Dustin, G. (2011). Adsorption of zinc (Zn2+) from aqueous solution on natural bentonite. Desalination, 267, 286–294.
[14] Ayuso, E. A., and Sanchez, A. G. (2003). Removal of heavy metals from waste waters by natural and Na-exchanged bentonites. Clays and Clay Minerals, 51, 475–480.
[15] Christianah, O. I., Mi-Hwa, B., and Dong-Su K. (2009). Montmorillonite surface properties and sorption characteristics for heavy metal removal from aqueous solutions. Journal of Hazardous Materials, 166, 538–546.
[16] Bergaya, F., and Vayer, M.(1997). CEC of clays: measurement by adsorption of a copper ethylenediamine complex. Applied Clay Science, 12, 275–280.
[17] Dermatas, D., and Dadachov, M.S. (2003). Rietveld quantification of montmorillonites in lead-contaminated soils. Applied Clay Science, 23, 245–255.
[18] Bishop, J.L., Pieters, C.M, and Edwards, J.O. (1994). Infrared spectroscopic analyses on the nature of water in montmorillonite. Clays and Clay Minerals, 42, 702–716.
[19] Gupta, S.S., and Bhattacharyya, K.G. (2006). Adsorption of Ni(II) on clays. Journal of Colloid and Interface Science, 295, 21–32.
[20] Weng, C.H.,and Huang, C.P. (2004) adsorption characteristics of Zn(II) from dilute
IJSER

International Journal of Scientific & Engineering Research, Volume 5, Issue 5, May-2014 516 ISSN 2229-5518
IJSER © 2014 http://www.ijser.org
aqueous solution by fly ash. Colloids and Surfaces A, 247, 137–143.
[21] Prasanna, K., King, Y. P., and Prasad, V.S.R.K.( 2007). Adsorption of zinc from aqueous solution using marine green algae – Ulva fasciata sp. Chemical Engineering Journal, 129, 161–166.
[22] Gong, R. D.Y., and Liu Chen, H. (2005). Lead biosorption and desorption by intact and pretreated Spirulina maxima biomass. Chemosphere, 58, 125–30.
[23] Meena, A.K, Mishra, G.K, Rai, P.K, Rajagopal, C., and Nagar, P.N. (2005). Removal of heavy metal ions from aqueous solutions using carbon aerogel as an adsorbent. Journal of Hazardous Materials,122,161–170.
[24] Dekhil, A. B., Hannachi, Y., Ghorbel, A., and Boubaker, T. (2011). Removal of Lead and Cadmium Ions From Aqueous Solutions Using Dried Marine Green Macroalga (Caulerpa racemosa). International Journal of Environmental Research, 5, 725-732.
[25] Langmuir, I. (1918). The adsorption of gases on plane surface of glass, mica, and platinum. J. Amer. Chem. Soc., 40, 1361–1403.
[26] Freundlich, H. (1939). Adsorption in solution. J. Am. Chem. Soc., 61, 2– 28.
[27] Dubinin, M. M., Zaverina, E. D., and Radushkevich, L.V. (1947). Sorption and structure of active carbons. I. Adsorption of organic vapors. Zh. Fiz. Khim., 21, 1351– 1362.
[28] Helfferich, F. (1962). Ion Exchange, McGraw Hill, NY, USA, 166.
[29] Lagergren, S. (1989). Zur theorie der sogenannten, adsorption geloster stoffe. Kunglia a sevenska venten skapasa kademiens. Hand lingar., 24, 1-39.
[30] Ho, Y.S., McKay, G., Wase, D. J., and Foster, C. (2000). Study of the sorption of divalent metal ions onto peet. Adsorpt. Sci. Technol., 18, 639-650.
[31] Hao, C., Guoliang, D., Jie, Z., Aiguo, Z., Junyong, W., and Hua, Y. (2010). Removal of copper(II) ions by a biosorbent—Cinnamomum camphora leaves powder. Journal of Hazardous Materials, 177, 228–236.
[32] Smith, J. M. (1998). Chemical engineering kinetic, Third edition, McGraw-Hill, Singapor.
[33] Tushar, K. S., and Dustin, G. (2011). Adsorption of zinc (Zn2+) from aqueous solution on natural bentonite .Desalination, 267, 286-294.
[34] Weng, C.H., Tsai, C.Z., Chu, S.H., and Sharma, Y.C. (2007) Adsorption characteristics of copper(II) onto spent activated clay. Separation and Purification Technology, 54, 187-197.
[35] Chiron, N., Guilet, R., and Deydier, E. (2003). Adsorption of Cu(II) and Pb(II) onto a grafted silica: isotherms and kinetic models. Water Res., 37, 3079–3086.
[36] Sarioglu, M., May, O. A., and Cebeci, Y. (2005). Removal of copper from aqueous solutions by phosphate rock. Desalination., 181, 303-311.
IJSER


