
It’s not CAD to GIS; It’s Design to As-Built
Richard E ChappellAPS (Arizona Public Service)[email protected]

1.3 Million Customers5 Operating Divisions1140 Feeders/CircuitsMetro Region =
75 % of Customers, 15% of Service Territory
One of the Fastest Growing Customer bases in United States
APS Background
MetroMetro
NorthNorthWestWest
NorthNorthEastEast
SouthSouthEastEast
SouthSouthWestWest
MetroMetroWestWest
Contents
• Discuss issues related to managing data across the facility management organization
• Dispel myths• Identify technical issues• Identify non-technical issues• Discuss options

Intended Audience
• Designed for a mixed audience • Generally not technical• Some understanding of AutoCAD and GIS would be helpful

Ground Rules
• No religious discussions– No discussion of whether GIS or CAD is better.– Many of us, for various reasons, need to work in an environment
shared between CAD and GIS software
Photo credit: Bill Murray from the movie Meatballs
http://www.flixster.com/movie/meatballs/photos?p=10871326
“It just doesn’t matter”

Some Myths to Dispel
• CAD is dumb data• GIS data is not accurate • CAD doesn’t use coordinate systems • Technology now allows us to capture 80% of CAD data for
GIS• CAD uses x and y coordinates, and GIS uses Latitude and
Longitude• CAD is a graphics program and GIS is a database program

CAD and GIS Basics
• Both consist of basic primitive elements– Points– Lines– Polygons– Attributes
• Both store this information within databases
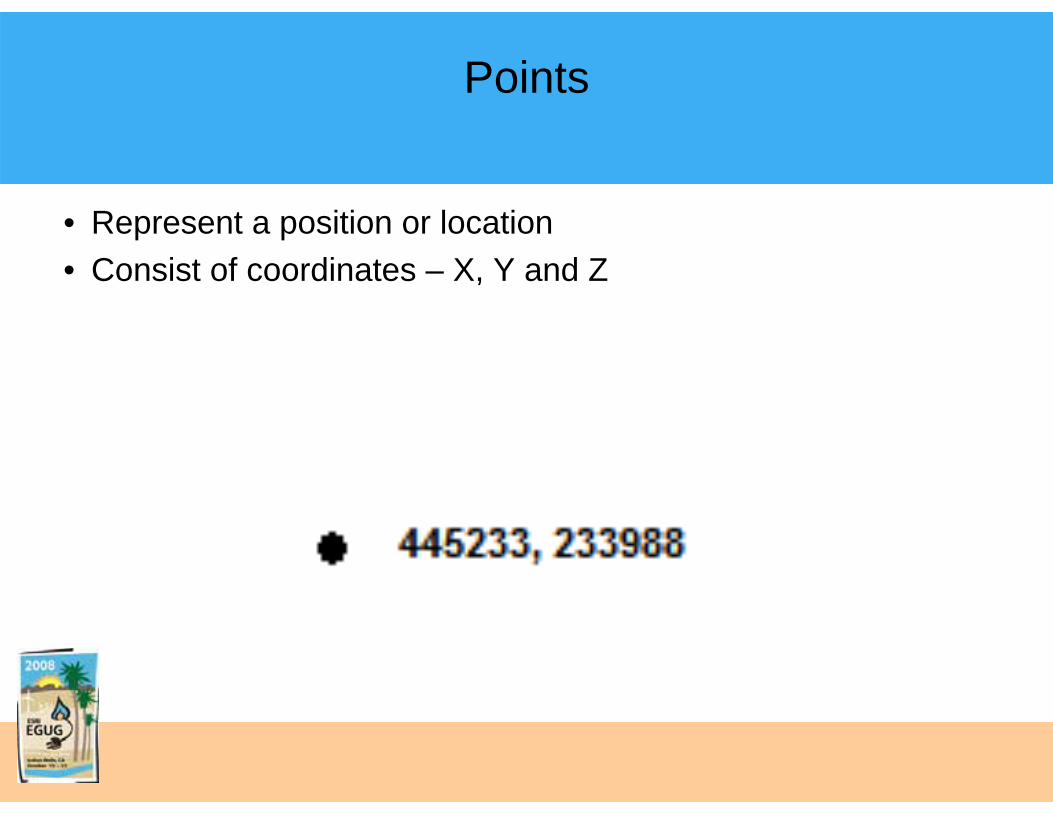
Points
• Represent a position or location• Consist of coordinates – X, Y and Z

Lines
• Consist of coordinate pairs – a start point and end point

Polygons
• Consist of group of coordinate pairs – a boundary of lines

Complex Features
Complex features are generally some construct of these primitives
• Annotation is a form of point• Polylines are groups of lines

Attributes
• Primitives will have data elements attached– Some elements describe the object itself– Some are data describing what the object represents

So what is the difference?
There are 2 key differences between CAD and GIS that are critical
• Data Structure Paradigm• Graphic Representation

Data Structure Paradigm
• AutoCAD stores data in a free form object oriented database where the fields in each row are defined by the entity type
• ArcGIS stores data in predefined data structures where the fields are defined in each data type
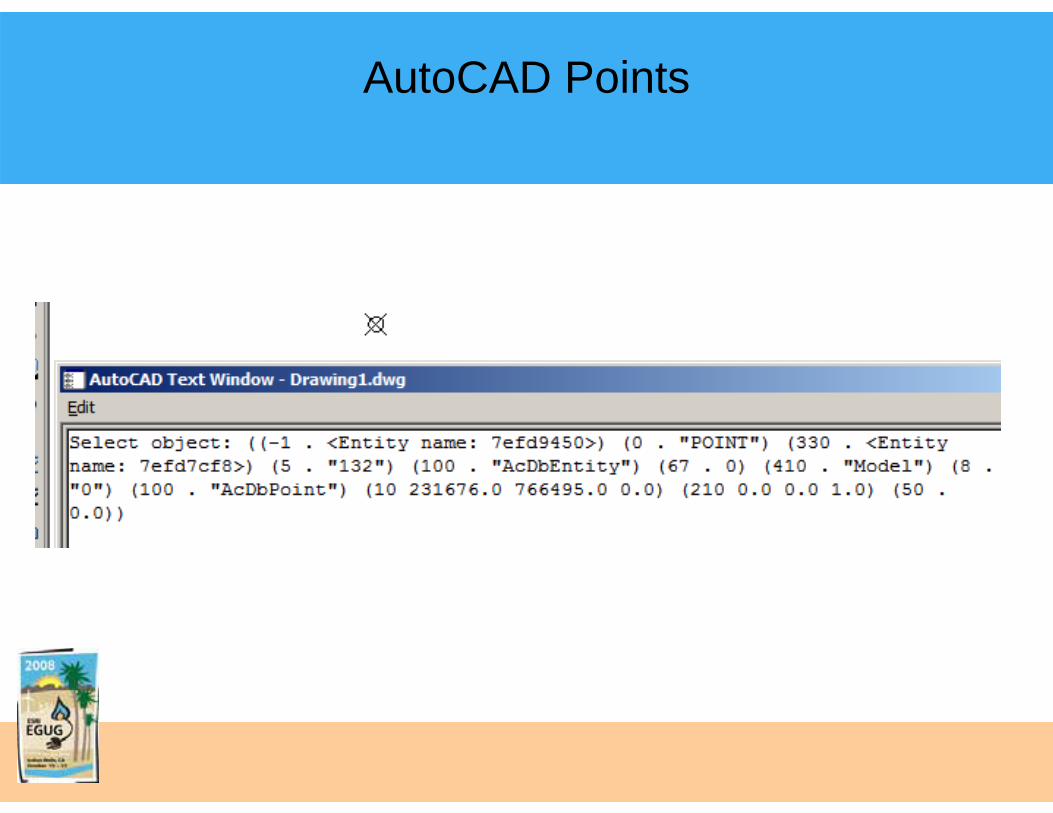
AutoCAD Points

AutoCAD Lines

AutoCAD Polygons

AutoCAD Point Data Set with Attributes

ArcGIS dataset

What this Means
• The means that AutoCAD will store multiple data types in a single DWG, while ArcGIS will store multiple data types in separate structures (tables or files)– Tables in Geodatabase– Sets of files for Shapes and other formats

Graphic Representation
• In AutoCAD, the graphic representation is stored on the object as part of the individual object definition– Redefining appearance can be time consuming
• In ArcGIS, the graphic representation is kept separate from the data and generated on the fly– Redefining appearance comes from changing the legend
What this means
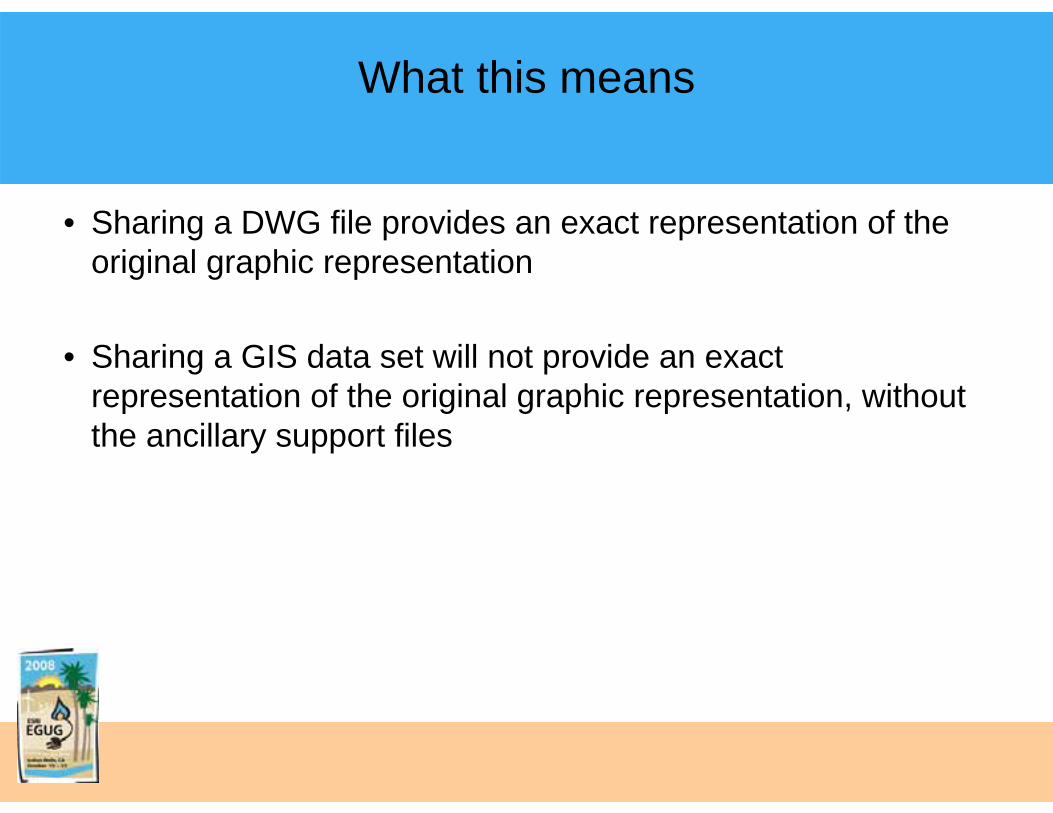
• Sharing a DWG file provides an exact representation of the original graphic representation
• Sharing a GIS data set will not provide an exact representation of the original graphic representation, without the ancillary support files

Not Good or Bad – Just Different

Other Differences
• Coordinate number data types– Floating point vs Long Integers
• 32-bit– Single vs Double Precision
• Some differences in primitives– Annotation – feature linked as well as annotation objects– Curves – curve data isn’t carried through some GIS data sets
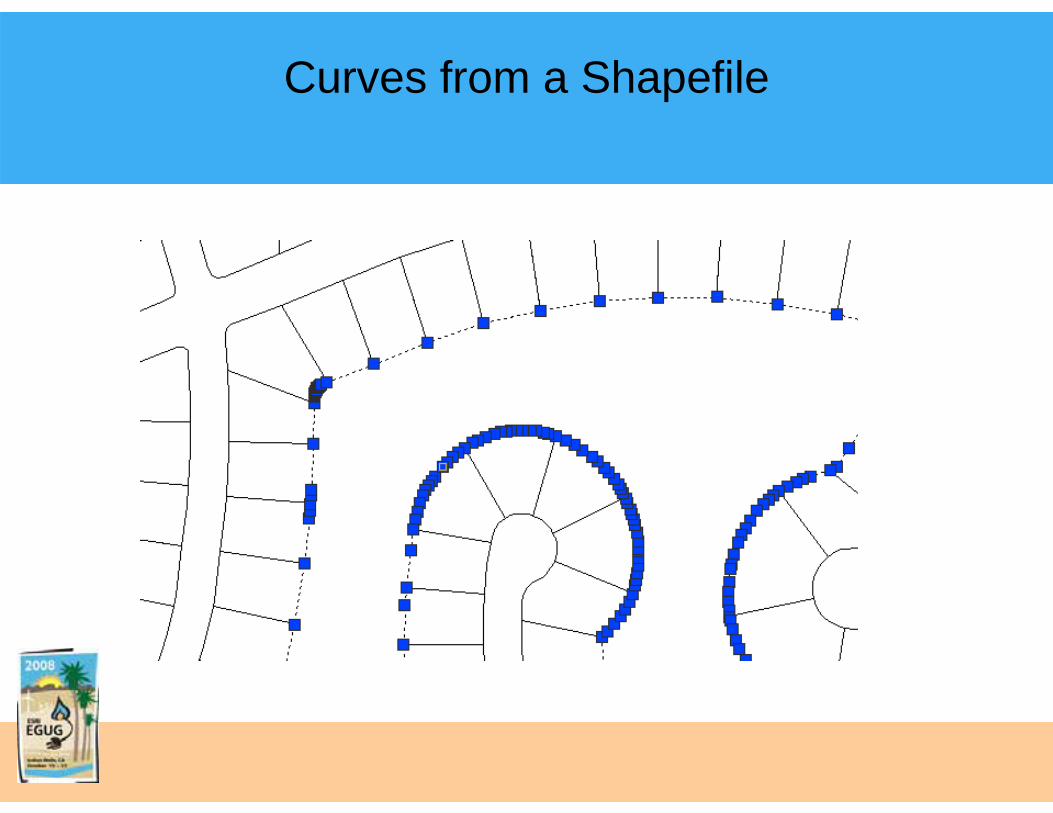
Curves from a Shapefile

What’s The Point
The physical transfer of data is a minor technical issue• Most software vendors now provide excellent tools to transfer
data back and forth• Most will allow direct editing of other data formats

Third-Party Options
• Additionally, there are a number of third-party applications to further enable this interaction between systems– FME by Safe Software– GISConnect by Haestad Methods (Bentley)– Crossfire by EMS

So What’s the Problem?

Design Representation
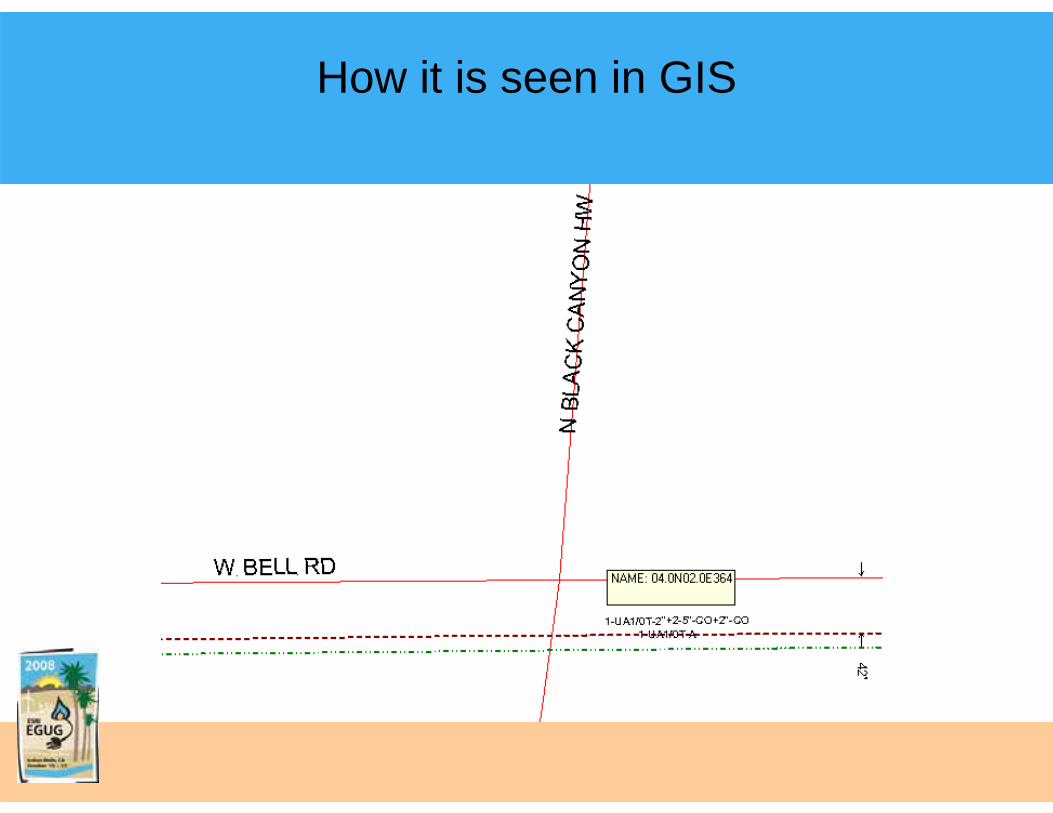
How it is seen in GIS

Integration Barriers
• The primary barriers to integration are data organization and business issues rather than technical issues
• The purposes of the data have a much larger impact than how the data is stored
• Understanding those issues can remove the barriers

Purpose of the Data
• The purpose of the data can have a profound impact on the data
• Across the facility management environment, there are a number of areas of the lifecycle, each with its own requirements
Commonality Across the Workflow
• Design and Facility Management are different activities that have unique requirements
• Identify the common requirements and you identify the targets of integration
• Then we can move to a real design to as-built data management process
Some of the Issues
• Scale• Precision• Granularity• Generalization• Data Capture• Cartographic Issues
Scale
• Different scales have different requirements• Generally, design scales will be much larger than GIS map
scales – Design scales get in the 1”=20’-50’ range, where system maps get much smaller, as in 1”=100’-400’

1”=5000’ Map Electrical System Map
It shows the road centerlines and the feeders
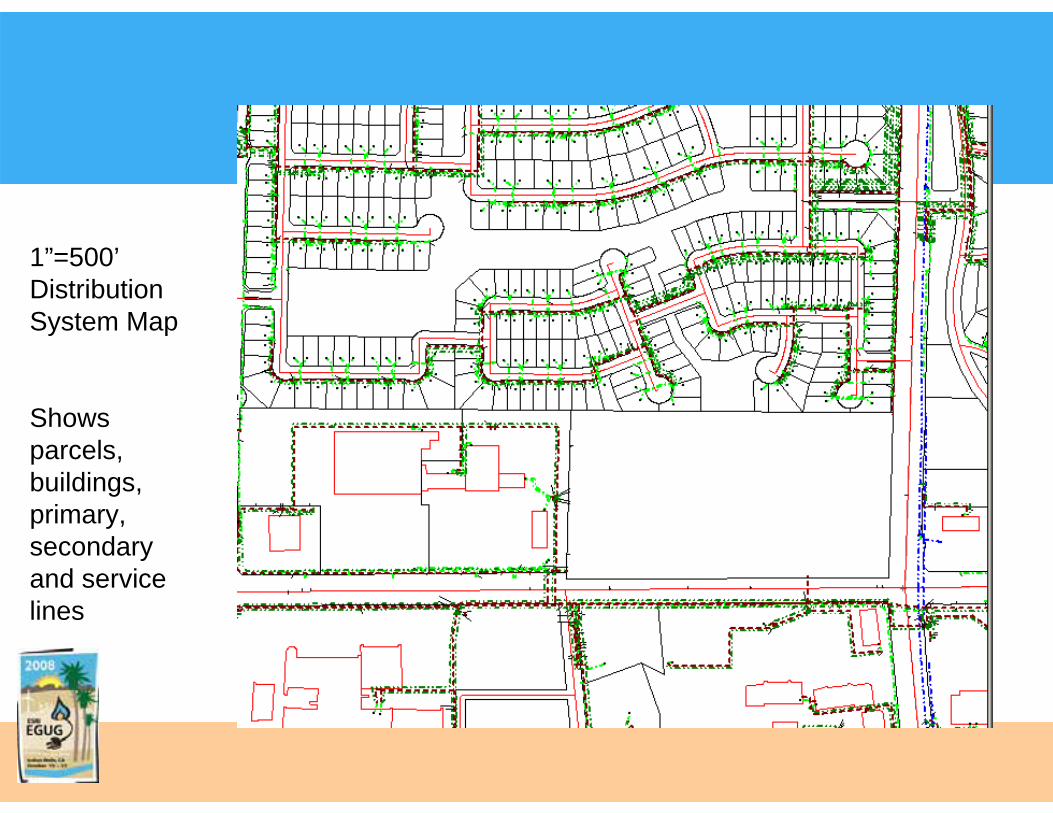
1”=500’Distribution System Map
Shows parcels, buildings, primary, secondary and service lines
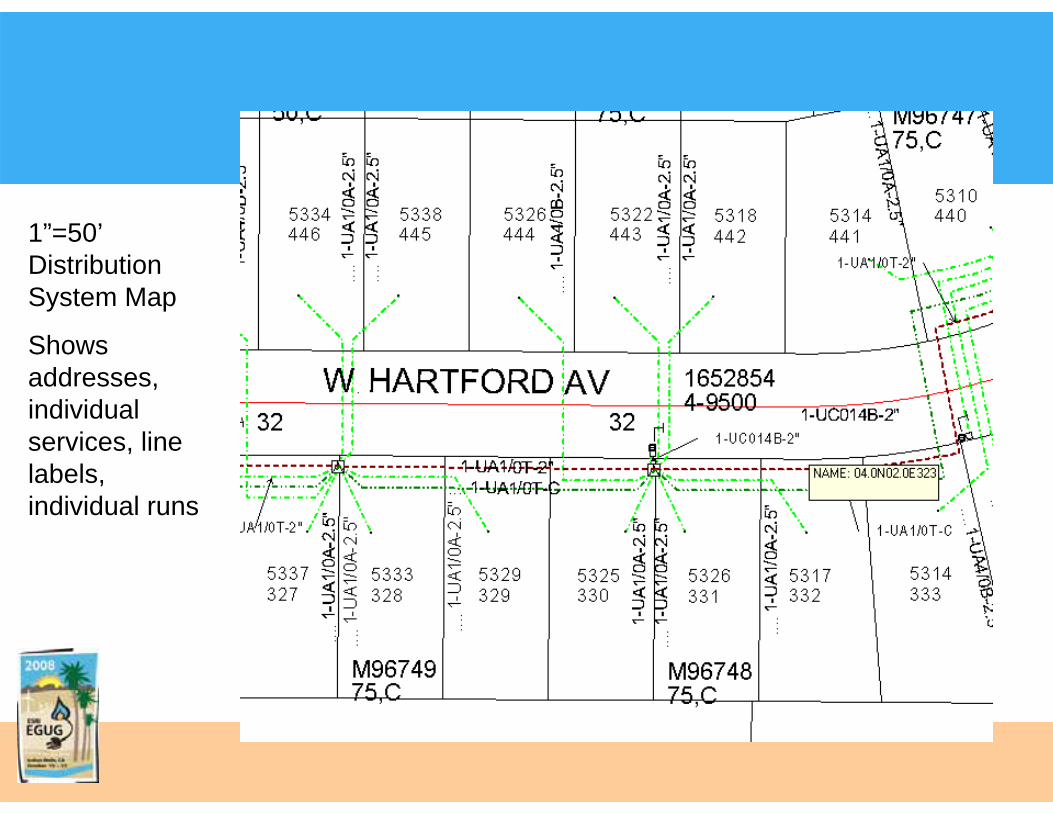
1”=50’Distribution System Map
Shows addresses, individual services, line labels, individual runs

Precision - Critical Terminology
• Error• Accuracy• Precision
Photo Credit: http://www.mandypatinkin.net/PB/pb.html
“You keep saying that word. I do not think it means what you think it means.”

Error
Measurement is an inexact science. There is error inherent in all measurement.
• Errors can exist due to mistakes• Errors can exist due to methods and tools

Accuracy and Precision
"Accuracy - closeness of an estimated (e.g., measured or computed) value to a standard or accepted [true] value of a particular quantity.”
FGDC-STD-007.1-1998
Precision - in statistics, a measure of thetendency of a set of random numbers to cluster about a number
determined bythe set.
FGDC-STD-007.1-1998

Photo credit: NOAA Collections
http://celebrating200years.noaa.gov/distance_tools/theb1670.html

Photo Credit: How to:
http://www.westone.wa.gov.au/toolbox6/hort6/html/resources/visitor_centre/how_to/measure.htm

Target Model of Data Quality
ACCURATEACCURATE PRECISEPRECISE ACCURATE &PRECISE
ACCURATE &PRECISE
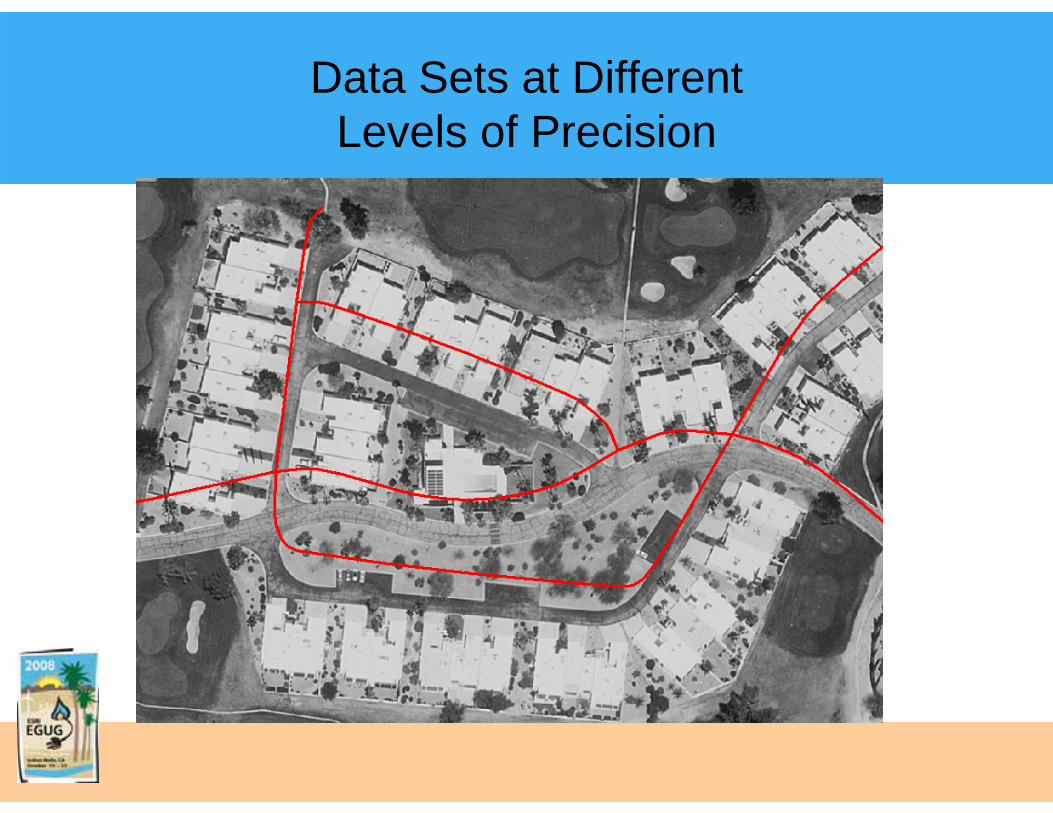
Data Sets at Different Levels of Precision


Precision and Accuracy
• Higher accuracy is more expensive• Design requires a high degree of accuracy
– Underground utilities• Most new construction work will include a site survey of 3rd
order (or close) to identify the existing conditions• With a large land base, highly accurate data is likely too
expensive to create and maintain

Generalization
• Reduce complexity by– Grouping of similar objects to simplify an image– Simplification of lines based on scale– Feature coalescence, selection and complexity reduction

Granularity
• Granularity is the grouping of dissimilar objects to represent asingle feature
• Items that aren’t important to the operation of the system may be dropped from facility maps
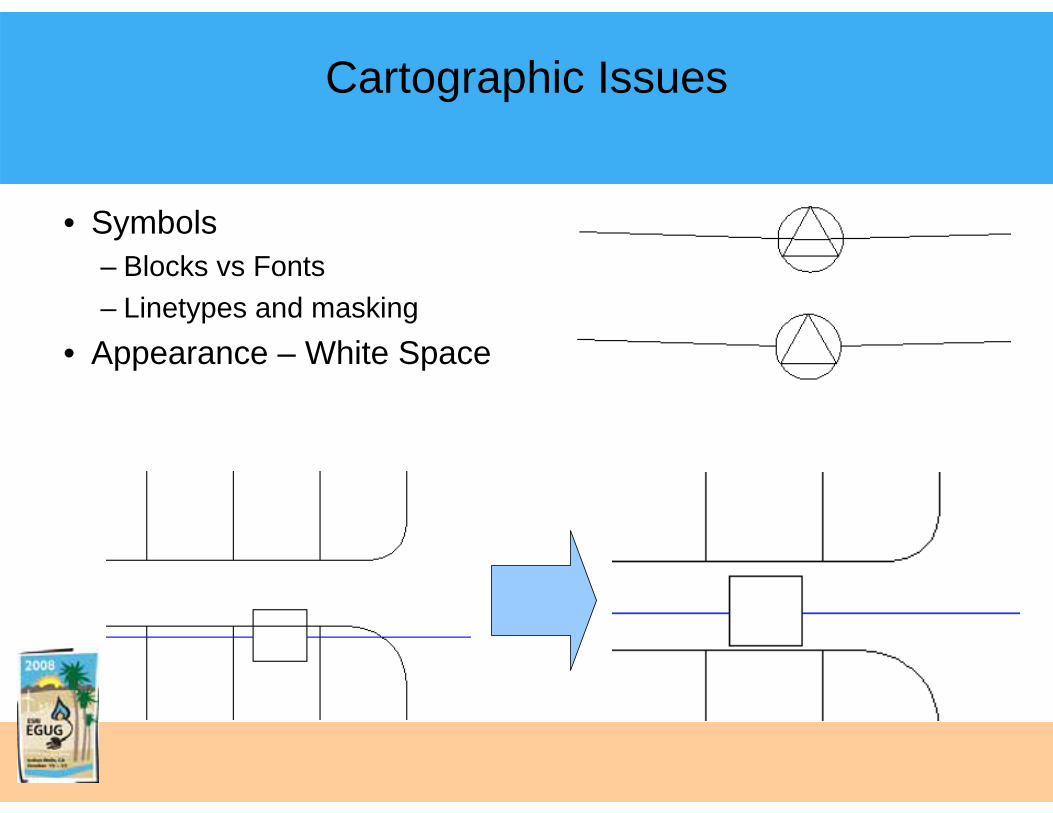
Cartographic Issues
• Symbols– Blocks vs Fonts– Linetypes and masking
• Appearance – White Space
Putting It Together
• Determine what data can move through the work flow• Understand how the pieces fit together• Be willing to re-evaluate your processes• Use the information to develop CAD standards that can make
integration possible
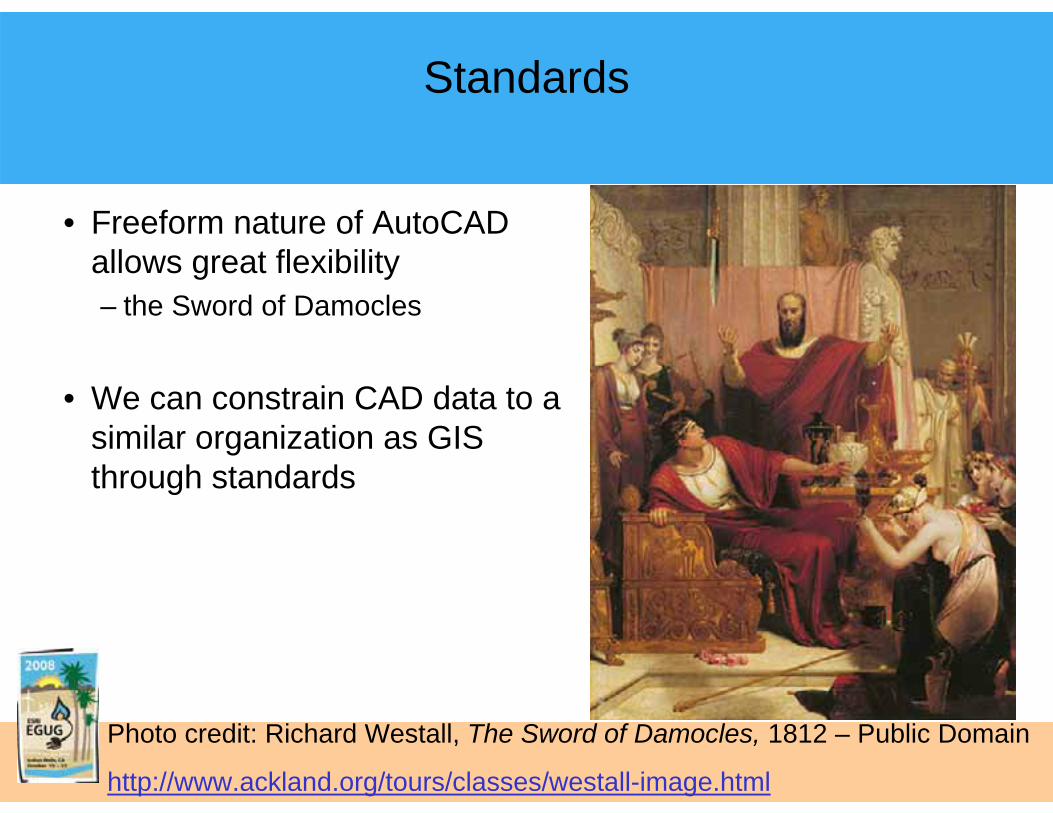
Standards
• Freeform nature of AutoCAD allows great flexibility– the Sword of Damocles
• We can constrain CAD data to a similar organization as GIS through standards
Photo credit: Richard Westall, The Sword of Damocles, 1812 – Public Domain
http://www.ackland.org/tours/classes/westall-image.html

Areas of Standardization
• Layering• Symbols (Block)• Geometry• Attributes

Layers
• In AutoCAD, layering is the most common method of segregating data
• In ArcGIS, feature classes and subtypes define the segregation of the data
• Match layers to feature classes and subtypes to segregate the data
• Use similar object types within each layer– ie. Lines with lines, points with points

Point Symbols
• Represent points in data set• ArcGIS uses a font in the map document to create the symbol• AutoCAD would use a block in the drawing• Identify Font-Block Mappings during conversion

Geometry
• Maintain snapping through connected line features – use wipeouts to mask lines
• Insure intersections are broken within a single data set• Use closed polygons to identify polygons

Attributes
• Use attributes to label items rather than text labels• Use label blocks to attribute polygons and lines – after
conversion, they can be spatially joined– By placing insert point on line, an intersection of the label points will
join the attributes to the lines, and the actual text features can be placed anywhere
• One label block per element• Consider using external database links and maintaining an ID
as an attribute

Conclusion
By understanding the issues that really impact our processes, we can develop
workflows that will allow us to take the most advantage of our data

Questions?


