
Global Environmental Research Fund (GERF/S-3-1) Japan-UK Joint Research Project “a Sustainable Low-Carbon Society (LCS)”
Japan Scenarios and Actions towards Low-Carbon Societies (LCSs)
June 2008
“2050 Japan Low-Carbon Society” scenario team National Institute for Environmental Studies (NIES),
Kyoto University, Ritsumeikan University, and Mizuho Information and Research Institute
34
23
35
16
13
24
77
17
28
7
9
38
13
10
24
1
6 21●●
Low Carbon Society Leadership
Labeling to Encourage Smart and
rational Choices
Next G
eneration Fuels
Local Renewable Resources for Local
Dem
and
Low-Carbon Electricity
Pedestrian Friendly City Design
Swift and Sm
ooth Logistics
Environmentally Enlightened Business
and Industry
Sustainable Building Materials
Promoting Seasonal Local Food
Anytim
e, Anywhere A
ppropriate A
ppliances
Comfortable and G
reen Built Environm
ent
●
●
●
12
40●●●●●
●●●●●●●●
●●●●●
5●●●●●
●●●●●●●
●●●●
14●●●●
●●●●●●
●●●
4●□●□●
1110987654321
2000年
CO
2排
出量
2000年
CO
2排
出量
1990
CO
2 Em
issi
on
70%
redu
ctio
n
* Unit of number in the table is MtC.
621
90
36
77
24
1013
38
97
28
17
41
36CCS
21
24
63
82
40
24
1314
16
35
23
34
40
5
Energy supplysector
Trans-portation
Industry
Change of activity
<Scenario A>
Ener
gy s
uppl
yse
ctor
Impr
ovem
ent o
f ca
rbon
inte
nsity
16
214
230+)
230+)
35
60
52
77
42
65
62
40
● : Sector in which actions contribute reduction directly: Sector in which actions contribute reduction indirectly.
□ : Sector in which reduction by actions is included under "Change of activity"
56 - 48 95 - 81 Included in others
2000
CO
2 Em
issi
on
Impr
ovem
ent o
f ca
rbon
inte
nsity
Ener
gy d
eman
dse
ctor
<Scenario B>
Change of activity
Industry
Residential & commercial
Trans-portation
Residential & commercial
Energy supplysector
Impr
ovem
ent
of
ener
gyin
tens
ityRe
duct
ion
of d
eman
d
Impr
ovem
ent o
f ca
rbon
inte
nsity
Impr
ovem
ent o
f ca
rbon
inte
nsity
Impr
ovem
ent o
f en
ergy
inte
nsit
yRe
duct
ion
of d
eman
d
Ener
gy d
eman
dse
ctor
Ener
gy s
uppl
y se
ctor
2050
CO
2 Em
issi
on
30 - 35 (+ α) 44 - 45
2050
CO
2 Em
issi
on
Japan Scenarios and Actions tow
ards Low
-Carbon Societies (L
CSs)
June 2008

Preface
On 9th June 2008, Japanese Prime Minister Fukuda released his new vision “Towards a Japan Low-Carbon Society (LCS)”. The vision consists of following components; 1) transition from a fossil fuel dependent industrialized society to a LCS for a sustainable future, 2) stepping forward with great confidence as transition to LCS will bring opportunity for new businesses and Japan’s traditional wisdom provided notion to live in harmony with nature such as “Mottainai”, 3) setting up a long-term goal to reduce 60-80% CO2 emissions by 2050 from current level based on the former Prime Minister Abe’s proposal, invitation to “Cool Earth 50” which had 50% Greenhouse Gas (GHG) emission reduction target by 2050, 4) peaking out emission level by next 10-20 years to achieve long-term goal, 5) implementing following four actions ;i) development of innovative technology and diffusion of existing technologies, ii) set up institutions such as emission trading, tax reform to change social and economic structure into a LCS, iii) measures from local governments such as producing locally and consuming locally, and iv) behavioral change. He put forward this vision as “Low-Carbon Society” revolution and anticipated that it will make Japanese economy more strong and resilient. Japan Low-Carbon Society project has started its research activity since April 2004 with around 60 researchers (http://2050.nies.go.jp). The project consists of five teams; scenario team, long-term goal setting team, urban structure team, Information and Communication Technology (ICT) team, and transportation team. Each team carries out researches coordinated by project leader with the support from scenario team. It also coordinated “The Japan–UK Joint Research Project on a Sustainable Low-Carbon Society (LCS)” with participation of experts from 20 countries and delivered “Call for Action” of the three LCS workshops and “Executive Summary” of the 3rd LCS workshop to Gleneagles dialogue (G20) in Chiba, during 14-16 March 2008 and G8 Environmental Ministerial Meeting in Kobe, during 24-26 May 2008. The project further extended its support to edit the Climate Policy international journal’s special issue entitled “Modelling Long-Term Scenarios for a Low Carbon Society” published on June 2008.
Scenario team released a report “Japan Scenarios towards Low-Carbon Society (LCS) -Feasibility study for 70% CO2 emission reduction by 2050 below 1990 level- on February 2007. It was the first attempt to show that there is technological potential to reduce 70% CO2 emissions in Japan by 2050 and at the same time satisfy necessary service demands. Furthermore, scenario team released a report “A Dozen Actions towards Low-Carbon Societies (LCSs)” that proposed a dozen actions to reduce CO2 emissions by 70% by 2050 from the 1990 level in May 2008. This report is a package of the report published by scenario team in 2007 (revised May 2008), Chapter I, and the report on a dozen actions, Chapter II. We would be very much delighted if this report could be helpful to develop visions, scenarios and actions towards Low-Carbon Societies and sustainable future in Japan and the world.
June 2008


I. Japan Scenarios towards Low-Carbon Society (LCS)
-Feasibility study for 70% CO2 emission
reduction by 2050 below 1990 level-
1
70%
red
uctio
n
621
90
36
77
6124
1013
38
97
28
17
41
36CCS
Carbon Capture Storage
Change of activity
1990
CO
2 Em
issi
on
2000
CO
2 Em
issi
on
2050
CO
2 Em
issi
on
Change of activity
Impr
ovem
ent o
f ca
rbon
inte
nsity
of
ene
rgy
supp
ly
Impr
ovem
ent o
f ca
rbon
inte
nsity
of
end
-use
Impr
ovem
ent o
f en
ergy
inte
nsity
of
end
-use
Redu
ctio
n of
dem
and
Ener
gy d
eman
d se
ctor
Ener
gy s
uppl
y se
ctor
Indu
stry
Tran
spor
tatio
nRe
side
ntia
l &
com
mer
cial
Ener
gy s
uppl
y
Reduction of service demandImprovement ofenergy intensityImprovement ofcarbon intensity
Reduction of service demand
Reduction of service demand
Improvement ofenergy intensity
Improvement ofenergy intensity
Improvement ofcarbon intensity
Improvement ofcarbon intensity
Improvement ofcarbon intensity
・High economic growth, Increase of service demand per household, Increase of office floor (increase)
・Servicizing of industry, Decline in number of households, Increase of public transportation (decrease)
・Significant improvement in energy efficiency of production equipment
・Fuel switch from coal and oil to natural gas
・Insulation・Energy use management (HEMS/BEMS)
・Efficient heat pump air-conditioner, Efficient water heater, Efficient lighting equipment
・Development and widespread use of fuel cell・All-electric house・Photovoltaic
・Advanced land use / Aggregation of urban function・Modal shift to public transportation service・Widespread use of motor-driven vehicle such as
electric vehicle and fuel-cell electric vehicle・High efficiency freight vehicle・Improvement of energy efficiency (train/ship/airplane)
・Power generation without CO2 emission・Hydrogen production without CO2 emission
・Fuel mix change to low carbon energy sources such as natural gas, nuclear energy, and renewable energy
・Effective use of night power / Electricity storage・Hydrogen (derived from renewable energy) supply
・Farm products produced and consumed in season


3
Key Conclusions Japan has the technological potential to reduce its CO2 emissions by 70% compared to the 1990 level, while satisfying the expected demand for energy services in 2050. Overview of the project: 1. This research assesses the possibility of achieving the Low-Carbon Society (LCS) in Japan by
targeting at 70% CO2 emission reduction by 2050 compared to the 1990 level. 2. The project has been sponsored by the Global Environmental Research Fund, which is funded
by the Ministry of the Environment of Japan. Approximately 60 experts from research institutes, universities, and private companies, with diversified specialties such as environmental and energy engineering, economics, industry, transportation, urban engineering international law and politics have contributed to this research.
Socio-economic prerequisites: 3. To achieve the LCS, the following socio-economic prerequisites are considered:
◇ Vibrant society maintaining a certain level of economic growth. ◇ Satisfying of the energy services demand as envisioned in the expected socio-economic
scenarios. ◇ Consideration of innovative technologies, for example, electric vehicles and hydrogen
vehicles; yet, this research does not take into account uncertain technologies such as nuclear fusion.
◇ Consistency with the existing long-term governmental plan, such as a plan of nuclear energy.
◇ Since the objective is to identify the carbon abatement potential of Japan, the policy options that aim at making the technological changes possible are out of the scope of this research project.
Potential of 70% carbon abatement, cost and sectors 4. Satisfying the prerequisites mentioned above, a 70% CO2 emission reduction below the 1990
level can be achieved by reducing 40% the energy demand and by introducing low-carbon energy supply.
5. The annual direct cost related to a CO2 emission reduction of 70% by 2050 would range between JPY 7.0 and 9.9 trillion, which would account for around 1% of the estimated GDP in 2050.
6. The energy demand-side emission reductions could be accomplished by combining a shrinking population scenario with promoting rational energy use, energy conservation and improvements in energy efficiency, while allowing the per capita GDP growth at 1-2% towards 2050.
7. Estimated reduction rates of sectoral energy demand (relative to the 2000 value) are as follows, where the range of reductions varies due to different scenarios in 2050: • Industrial sector: reduction of 30-40% due to structural changes and introduction of
energy-saving technologies. • Passenger transportation sector: reduction of 80% due to proper land use, and
improvement in energy efficiency and carbon intensity. • Freight transportation sector: reduction of 50% due to better logistics management and
improvements in the energy efficiency of vehicles. • Household sector: reduction of 40-50% due to rebuilding and diffusion of high-insulated
houses and introduction of energy-saving house appliances.

• Commercial sector: reduction of 40% due to renovation and rebuilding with high-insulated building and introduction of energy-saving office devices.
8. The energy supply side will also be low-carbon intensive by a combination of appropriate selection of improvement of energy efficiency and low-carbon content energy (partially including carbon capture and storage (CCS)).
To achieve LCS: 9. In order to achieve the LCS goals while satisfying the required amount of energy services at the
same time, prompt actions should be taken at the earliest stage of the roadmap. Such actions involve structural changes in the industrial sector and investment in infrastructure. Moreover, it is necessary to accelerate development, investment, and use of energy-saving technologies and low-carbon energy technologies. The government should play a leading role in promoting a common vision towards LCS at the earliest stage, enforcing comprehensive measures for social and technological innovation, implementing strong measures for translating such reduction potentials into a reality, promoting measures for public investment based on long-term perspectives and leading incentives for private investment.
4

1. Methodology of the Low-Carbon Society (LCS) scenario approach: Applying a back-casting approach
This study analyses the possibility of achieving a LCS in Japan, where CO2 emissions, one of the
major greenhouse drivers, would undergo a 70% reduction by 2050 below the 1990 level. Transformation in social, economic and technological activities is expected during the first half of the century. The range of such transformation varies widely. It is necessary to make preparations for the desired socioeconomic changes to achieve LCS.
Assuming that such a degree of socioeconomic change is possible, the back-casting method was adopted in this study to examine the strategies for achieving the LCS. Some of the key aspects of this method are shown in Fig. 1. Among the most important steps of this process we could highlight the following: 1) to envision the direction of future Japanese socioeconomic structure towards 2050 within a
certain range (for instance, Scenario A: active, quick-changing, and technology oriented, and Scenario B: calmer, slower, and nature oriented) and to describe the characteristics of those two types of societies qualitatively through brainstorming by experts (narrative version),
2) to quantify behavior of people and households (how people spend time, what services will be needed), design of city and transportation (what kinds of city and houses people live in, how people travel), and industrial structure (estimation of the structural changes by a multi-sector computable general equilibrium model) for each scenario, and to estimate energy-service demand for each scenario (for instance, the volume of cooling [calories], hot water supply [liters], crude steel production [tons], and transportation demand [ton-km, passenger-km]),
3) to calculate energy services demand, while satisfying the CO2 emission reduction target that supports the estimated socioeconomic activity in each scenario; to explore the appropriate combination of energy services demand, end-use energy technology (air conditioner, thermal insulation, boiler, steal plant, hybrid car, etc.), types of energy supply and energy supply technologies, based on the consideration of the available volume of energy supply (shown as (5) in Fig. 1), its cost-efficiency and its political feasibility; to identify the types of energy demand and supply technologies as well as their shares, and finally,
4) to quantify the primary and secondary energy demands and the amount of resulting CO2 emissions.
5

Achieving energy-related CO2
emissions target
Quantifying energy
demand and supply to
estimate CO2emissions
Step4
Depicting socio-
economic visions in 2050
Step1
Estimating energy service
demands
Step2
Exploring innovations for energy demands
and energy supplies
Step3
Checking potentials for energy
supply
Step5
Fig. 1 LCS scenario approach
2. Visions for 2050’s Japan:
Assumptions of possible future socio-economic scenarios and changes in industrial structures
Different pictures of future Japan:
Possible pictures of future Japan and their pathways towards the LCS have been discussed by experts from various fields. Two scenarios, A and B, have been developed as a result (Table 1, 2) [See also (1) in Fig. 1]. The features of Scenario A can be described as active, quick-changing, and technology oriented society. On the other hand, Scenario B is a calmer, slower, and nature oriented society. Changes in social indicators and various assumptions made in both scenarios are within the ranges of existing major studies of Japanese future society projections (Japan’s visions for 21st century (2005, the Cabinet Office)). In reality, however, the future Japanese society may be a mixture of elements from both the scenarios.
In scenarios A and B, annual growth rate of per capita GDP has been assumed to be 2% and 1% respectively. The changes in services demand that are directly related to energy consumption (ex. heating, transportation, and built environment management, etc.) have been set by assuming the changes in lifestyle of the representative people in each scenario. The improvement in the service levels has been assumed to be gradual and moderate. Excessive service demands such as heavy loads in household and offices (such as air-conditioned throughout the day), or disorganized urban structure with inappropriate urban planning which leads to considerable increase in traffic demand, is not assumed in the scenarios.
6

Table 1 Narrative Scenarios for land use and urban structure Key words Scenario A Scenario B Migration: Decrease in population across all region
Population and capital would be concentrated more in urban areas because of the increase in urban preference of the people and pursuit of convenience/efficient lifestyles.
Decentralization of population and capital would occur because of the increasing need for slower lifestyles of the people.
Metropolitan area: Urban Intensive land use (vertical use of land
area including underground space) in urban areas would allow people to live near their work places, and the ratio of people who live in convenient urban areas increases.
It becomes more common to move out from urban centers and people want to migrate where living environment matches with their own lifestyles. The capital city and other core cities remain moderate in size and population.
Suburb Emigration of population would be observed in suburb area, however, most of the it would be redeveloped as amusement facilities or natural symbiosis areas through well-planned and effective urban designing.
Outflow of population and capital would continue. Therefore, the regeneration plan is targeted to develop these areas as independent urban cities rather than suburbs of mega-city.
Local area: Urban A number of local cities discontinue
functioning as core city, however, some cities get re-developed as bases for land intensive businesses such as mass plantation or power generation.
Decrease in population would be restricted since sufficient health services or education can be enjoyed in those areas. There would be many attractive local cities with original cultures and unique features. Citizens and NGOs play important roles in decision making processes.
Agricultural, Mountainous area
Many agricultural areas or mountainous areas would suffer from depopulation. The regeneration efforts are targeted to effective use of land and resources. Agriculture, forestry and fisheries industries are operated by big private companies, Efficient use of resources such as manpower, materials, and capital become possible. Some areas are designated as national parks.
More people migrate from urban to rural areas due to increasing attractiveness of agriculture, forestry and fisheries industries. In addition to permanent farmers, increasing numbers of families enjoy secure food supply and healthy life-styles in rural areas while pursuing businesses in the pattern of Small Office Home Office (SOHO).
7

Projections of population and number of households: Based on the methodology and assumptions made in the research publication, “Population
Projections for Japan: 2001-2050, January 2002, National Institute of Population and Society Security Research”, changes in parameters including birth rate, mortality rate, and percentages of householders in the population were set (see Table 2), and the populations and number of households for each scenario were estimated. The results of the simulations show that the population in scenarios A and B would drastically decrease to 95 million and 100 million respectively, from 127 million in 2000, because of continuing trends of aging population and lowering fertility rates. The number of households in both scenarios has also diminished; however, the household reduction rate is much slower than that of population since the number of family members would also decrease because of increasing proportion of single households and elderly households. As a result, the number of households in scenarios A and B fades away from 47 million in 2000 to 43 million and 42 million in 2050, respectively.
Table 2 Narrative scenarios for the economy and the industry
Keywords Scenario A Scenario B Economy:
Annual growth rate
• Approximately 2% of GDP per capita growth rate
• Approximately 1% of GDP per capita growth rate
Technology development rate
• High • Moderately high
Industry: Market • Reducing regulation • Penetration of market rules with
moderate regulation Primary industry
• Decrease in share • Increase in import dependency
• Relatively less decrease • Reduced import dependency
Secondary industry
• Tendency to heighten the added value
• Globalization of production bases
• Decrease in share • Limited production of diversified
products with local brand
Service industry
• Increase in share • Increase in productivity
• Increase in share • Increase in social activity
8
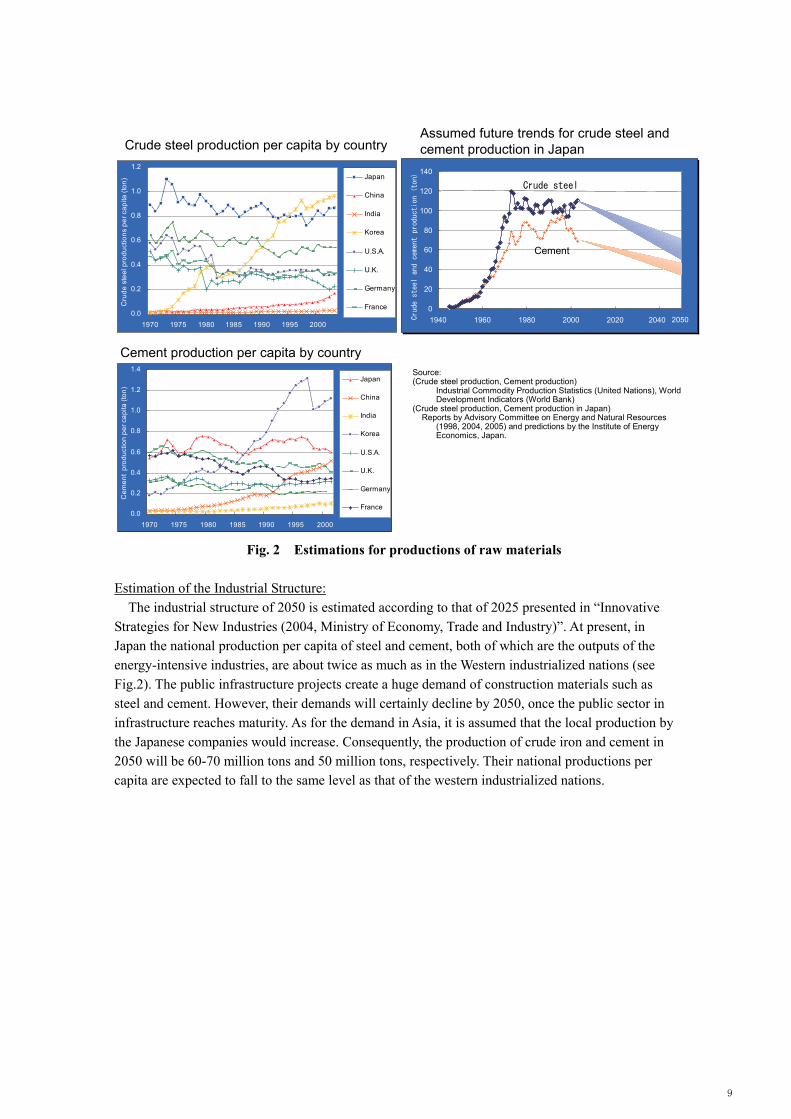
Crude steel production per capita by country
Cement production per capita by country
Assumed future trends for crude steel and cement production in Japan
0
20
40
60
80
100
120
140
1940 1960 1980 2000 2020 2040Crude steel and cement production (ton)
Crude steel
Cement
0.0
0.2
0.4
0.6
0.8
1.0
1.2
1970 1975 1980 1985 1990 1995 2000
Cru
de s
teel
pro
duct
ions
per
cap
ita (t
on) Japan
China
India
Korea
U.S.A.
U.K.
Germany
France
Source:(Crude steel production, Cement production)
Industrial Commodity Production Statistics (United Nations), World Development Indicators (World Bank)
(Crude steel production, Cement production in Japan)Reports by Advisory Committee on Energy and Natural Resources
(1998, 2004, 2005) and predictions by the Institute of Energy Economics, Japan.
0.0
0.2
0.4
0.6
0.8
1.0
1.2
1.4
1970 1975 1980 1985 1990 1995 2000
Cem
ent
prod
uctio
n pe
r cap
ita (t
on)
Japan
China
India
Korea
U.S.A.
U.K.
Germany
France
2050
Fig. 2 Estimations for productions of raw materials
Estimation of the Industrial Structure:
The industrial structure of 2050 is estimated according to that of 2025 presented in “Innovative Strategies for New Industries (2004, Ministry of Economy, Trade and Industry)”. At present, in Japan the national production per capita of steel and cement, both of which are the outputs of the energy-intensive industries, are about twice as much as in the Western industrialized nations (see Fig.2). The public infrastructure projects create a huge demand of construction materials such as steel and cement. However, their demands will certainly decline by 2050, once the public sector in infrastructure reaches maturity. As for the demand in Asia, it is assumed that the local production by the Japanese companies would increase. Consequently, the production of crude iron and cement in 2050 will be 60-70 million tons and 50 million tons, respectively. Their national productions per capita are expected to fall to the same level as that of the western industrialized nations.
9

0
50
100
150
200A
gric
ultu
re, F
ores
try a
nd F
ishi
ngM
inin
gFo
od p
rodu
cts
& b
ever
ages
Text
iles
Tim
ber a
nd W
oode
n pr
oduc
tsP
ump.
Pap
er &
pap
er p
rodu
cts
Pub
lishi
ng &
prin
ting
Org
anic
che
mic
al m
ater
ials
Med
icam
ents
Oth
er c
hem
ical
pro
duct
sP
etro
leum
refin
ary
and
Coa
l pro
duct
sC
emen
tO
ther
cer
amic
pro
duct
sS
teel
pro
duct
sN
on-fe
rrous
met
alFa
bric
ated
met
al p
rodu
cts
Mac
hier
yE
lec.
Mac
hine
, equ
ip. &
sup
plie
sTr
ansp
ort e
quip
men
tP
reci
sion
inst
rum
ents
Oth
er m
anuf
actu
ring
Con
stru
ctio
nP
ower
& g
as s
uppl
ies
Wat
er s
uppl
yW
hole
sale
& re
tail
trade
Fina
nce
& in
sura
nce
Rea
l est
ate
Tran
spor
tC
omm
unic
atio
nsP
ublic
adm
inis
tratio
nS
choo
l edu
catio
n an
d re
sear
chM
edic
al, H
ealth
and
Soc
ial s
ecur
ityO
ther
pub
lic s
ervi
ces
Oth
er b
usin
ess
serv
ices
Am
usem
ent a
nd re
crea
tiona
l ser
vice
sE
atin
g an
d dr
inki
ng p
lace
sH
otel
and
oth
er lo
dgin
g pl
aces
Oth
er p
erso
nal s
ervi
ces
Offi
ce s
uppl
ies
Act
iviti
es n
ot e
lsew
here
cla
ssifi
edDom
estic
pro
duct
s, tr
illio
n JP
Y
20002050A2050B
Fig. 3 Domestic outputs by industrial sectors in 2050 The industrial structure of 2050 aiming at the low-carbon target is estimated using a
Computational General Equilibrium model (CGE) in 57 sectors. The macroeconomic indicators and productions by categories are estimated according to the consideration of the raw material production in Table 2 and Fig. 2. This estimation is based on a work force consistent with the demographic composition and a size of capital stock relevant to its productivity in 2050. The energy demand is estimated from the major parameters describing the society of 2050: the efficiency change (the improvement of energy efficiency by introducing the technologies essential to fulfill the low-carbon target, and the progress of dematerialization) and the pattern of energy supply; the change in demand function according to the change in demographic composition and social structure; the expansion of raw material recycling from the stock renewal; the change of the raw material production mentioned (as in Fig. 2); the shift in the public investment towards focusing on the maintenance of infrastructure; the change of trade structure based on relocation of production bases. Only a depiction of society in 2050 is considered, regardless of the change in production facilities over time, since most of them will be replaced by 2050 (see Step 2 in Fig. 1). Fig. 3 shows the results summed up into 40 sectors. Both scenarios A and B show the progress of the service sector, the increase of electric machines, equipment & supplies, the transport equipment industries, and the reduction of the energy-intensive industries. These results are not different from the previous estimations (Japan’s visions for 21st century (2005, the Cabinet Office)). The active society (Scenario A) demonstrates a remarkable progress in sectors such as commercial services, and electromechanical machinery and transport machinery industries. Based on this estimation, in the following sectors, only the direct effect of measures for fulfilling the LCS is evaluated. The indirect effects such as trigger effects by the measures will not be analyzed.
10

11
3. Options for LCS: 70% reduction of CO2 emissions can be achieved by means of both a 40% reduction of final energy consumption through rationalization and appropriate choice of energy supply options with satisfying, and/or improving current service demand levels.
Technology choices for energy demand-side under the LCS:
Scenario A and B select packages of technological countermeasures for the LCS from the Environmental Option Database (EDB) [Step 2 in Fig. 1] on the basis of the estimated industrial structure in 2050, as shown in Fig. 3. The EDB includes more than 600 technology options (Table 3 lists key elements in the database). Prospects for future technological innovations have been set based on various reports, research articles, and white papers, such as “Strategic Technology Roadmap in Energy Field-Energy Technology Vision 2100” by Ministry of Economy, Trade and Industry, Japan (METI). After configurations of technological countermeasures, required secondary energy demands, such as grid electricity, fossil fuels, hydrogen, and others, were determined [Step 3 in Fig. 1]. These two steps (Step 2 and 3 in Fig. 1) have benefited from expert judgments.
Table 3 Key technological countermeasures in the Environmental Option Database The table lists technologies which are currently expected to have potentials for deployment and diffusion in the future. In addition, innovations in other technologies are also expected to occur which may play an important role in achieving the LCS. Such innovations would be driven to accomplish other purposes, such as improving quality of life, as well as to implement the LCS.
Sector Technology
Residential & Commercial
Efficient air conditioner, Efficient electric water heater, Efficient gas/oil water heater, Solar water heater, Efficient gas cooking appliances, Efficient electric cooling appliances, Efficient lights, Efficient visual display, Efficient refrigerator, Efficient cool/hot carrier system, Fuel cell cogeneration, Photovoltaic, Building energy management system (BEMS), Efficient insulation, Eco-life navigation, Electric newspaper/magazine etc.
Transportation Efficient reciprocating engine vehicle, Hybrid engine vehicle, Bio-alcohol vehicle, Electric vehicle, Plug-in hybrid vehicle, Natural gas vehicle, Fuel cell vehicle, Weight reduction of vehicle, Friction and drag reduction in vehicle, Efficient railway, Efficient ship, Efficient airplane, Intelligent traffic system (ITS), Real-time and security traffic system, Supply-chain management, Virtual communication system etc.
Industrial Efficient technologies for boiler, industrial furnace, Independent Power Plant (IPP), coke oven, and other innovations like Eco-cement, Fluidized catalytic cracking of naphtha, Methane coupling, and Gasification of black liquid.
Energy Transformation
Efficient coal-fired generation (IGCC, A-PFBC, Co-combustion with biomass etc), Efficient gas-fired generation, Efficient biomass-fired generation, Wind generation (On-shore, Off-shore), Nuclear power generation, Hydro power generation, By-product hydrogen, Natural gas reforming hydrogen production, Biomass reforming hydrogen production, Electrolysis hydrogen production, Hydrogen station, Hydrogen pipeline, Hydrogen tanker, CCS (Carbon Capture and Storage), etc.

Low-carbon alternatives for energy supply: We have examined feasible combinations of energy sources in supply-side, shown in Fig. 4, which
satisfy both secondary energy demands and quantity constraints for various energy resources [Step 4 and Step 5 in Fig. 1]. Various criteria for energy supply-side include economic efficiency, uncertainty of technological innovation, public acceptance, and expert judgments in the context of the narrative scenarios as mentioned in chapter 2. As per our estimate, required energy demands in 2050 would decrease to about 60% of 2000 level due to various kinds of innovations even with reasonable economic growth. In addition, decarbonization of energy supply will be necessary in order to achieve the LCS. Decarbonized energy supply systems exhibit a lot of variation (we shall discuss diversity of energy supply systems again in chapter 7). In this research, it is assumed that large-scale centralized energy systems, such as nuclear power, carbon capture and storage (CCS), and hydrogen production are suitable options for the scenario A, and small-sized distributed energy systems, such as solar, wind and biomass are suitable for scenario B.
Fig. 4 Energy demands and supply for achieving 70% reduction of CO2 emissions (Mtoe: Million tons of oil equivalent)
Coal Oil Gas
Biomass
Nuclear
Solar and Wind
100 200 300 400 500 600
2000(Actural)
2050(Scenario A)
2050(Scenario B)
Primary Energy Consumption (Mtoe)
Coal Oil Gas Biomass Nuclear Hydro Solar and Wind
Seconday Energy Consumption (Mtoe)
Industrial ResidentialCommercial
Trans. Prv.Trans. Frg.
50 100 150 200 250 300 350 400
2000(Actual)
2050(Scenario A)
2050(Scenario B)
Industrial Residential Commercial Trans. Prv. Trans. Frg.
Decrease ofenergy demand
Trans. Prv.: Transportation (Private), Trans. Frg.: Transportation (Freight)
12

Fig. 5 List of countermeasures for 70% reduction of CO2 emissions, scenario A and B In the scenario A, countermeasures for housing complex and measures toward compact city have an effect on CO2 reduction due to centralization of urban activities. Effective options in the scenario B include actions for detached house and automobiles as well as demand reduction strategies. There are common countermeasures to scenario A and B.
13
70%
red
uctio
n621
90
36
77
6124
1013
38
97
28
17
41
36CCS
Carbon Capture Storage
Change of activity19
90 C
O2
Emis
sion
2000
CO
2 Em
issi
on
2050
CO
2 Em
issi
on
Change of activity
Impr
ovem
ent o
f ca
rbon
inte
nsity
of
ene
rgy
supp
ly
Impr
ovem
ent o
f ca
rbon
inte
nsity
of
end
-use
Impr
ovem
ent o
f en
ergy
inte
nsity
of
end
-use
Redu
ctio
n of
dem
and
Ener
gy d
eman
d se
ctor
Ener
gy s
uppl
y se
ctor
Indu
stry
Tran
spor
tatio
nRe
side
ntia
l &
com
mer
cial
Ener
gy s
uppl
y
Reduction of service demandImprovement ofenergy intensityImprovement ofcarbon intensity
Reduction of service demand
Reduction of service demand
Improvement ofenergy intensity
Improvement ofenergy intensity
Improvement ofcarbon intensity
Improvement ofcarbon intensity
Improvement ofcarbon intensity
・High economic growth, Increase of service demand per household, Increase of office floor (increase)
・Servicizing of industry, Decline in number of households, Increase of public transportation (decrease)
・Significant improvement in energy efficiency of production equipment
・Fuel switch from coal and oil to natural gas
・Insulation・Energy use management (HEMS/BEMS)
・Efficient heat pump air-conditioner, Efficient water heater, Efficient lighting equipment
・Development and widespread use of fuel cell・All-electric house・Photovoltaic
・Advanced land use / Aggregation of urban function・Modal shift to public transportation service・Widespread use of motor-driven vehicle such as
electric vehicle and fuel-cell electric vehicle・High efficiency freight vehicle・Improvement of energy efficiency (train/ship/airplane)
・Power generation without CO2 emission・Hydrogen production without CO2 emission
・Fuel mix change to low carbon energy sources such as natural gas, nuclear energy, and renewable energy
・Effective use of night power / Electricity storage・Hydrogen (derived from renewable energy) supply
・Farm products produced and consumed in season
21
24
63
82
40
24
1314
16
35
23
34
40
5
214
Impr
ovem
ent o
f ca
rbon
inte
nsity
of
ene
rgy
supp
ly
Impr
ovem
ent o
f ca
rbon
inte
nsity
of
end
-use
Impr
ovem
ent o
f en
ergy
inte
nsity
of
end
-use
Ener
gy d
eman
d se
ctor
Ener
gy s
uppl
y se
ctor
70%
red
uctio
n
1990
CO
2 Em
issi
on
2000
CO
2 Em
issi
on
2050
CO
2 Em
issi
on
Change of activity
Indu
stry
Tran
spor
tatio
nRe
side
ntia
l &
com
mer
cial
Ener
gy s
uppl
y
Reduction of service demandImprovement ofenergy intensityImprovement ofcarbon intensity
Reduction of service demand
Improvement ofenergy intensityImprovement ofcarbon intensity
Reduction of service demand
Improvement ofenergy intensityImprovement ofcarbon intensity
Improvement ofcarbon intensity
Change of activity
・Significant improvement in energy efficiency of production equipment
・Fuel switch from coal and oil to natural gas
・Insulation・Energy use management (HEMS/BEMS)
・Efficient heat pump air-conditioner, Efficient water heater, Efficient lighting equipment
・Expanding biomass energy use in home・Diffusion of solar water heating and photovoltaic on the roof
・Shortening trip distances for commuting through intensive land use
・Infrastructure for pedestrians and bicycle riders(sidewalk, bikeway, cycle parking)
・Widespread use of hybrid vehicle・Expanding biofuels・Improvement of energy efficiency (train/ship/airplane)
・Expanding share of both advanced gas combined cycle and biomass generation
・Decrease of electricity demand
・High economic growth, Increase of service demand per household, Increase of office floor (increase)
・Slowing of final demand by breaking away from physical affluence mind-set, Reduction of war material production, Servicizing of industry, Decline in number of households, Increase of public transportation (decrease)
・Promoting seasonal local food

LCS can be achieved: Through this research, we conclude that CO2 emissions in 2050 can be reduced by 70% from the
2000 level, both in scenario A and scenario B, under acceleration of research, development and deployment of new technologies. 2050’s GDPs in scenarios A and B are set to about double and 1.5 times the 2000 level, respectively. Expected future innovations will lead to the reductions in energy demand by about 40% from the 2000 level while maintaining GDP growth and improving service demands. In addition, decarbonization of energy supply boosts CO2 reductions to 70% below 2000 level. In each scenario, strategies for realizing LCS include three key elements: demand reduction through rationalization of energy use; development and deployment of energy efficient technologies and; decarbonization of energy in supply-side.
Effective countermeasures in the scenario A are energy efficiency options in demand-side, such as implementation of energy efficient appliances in the industrial, residential, commercial and transportation sectors, and fuel-switching options from conventional energy sources to low-carbon energy sources, such as nuclear power and hydrogen. In scenario B, the use of low-carbon energy, such as biomass and solar energy, in demand-side would result in drastic reductions of CO2 emissions.
Although CO2 reductions by sector vary according to the scenario, both scenarios share many technology options. These options involve no-regret investments, which reduce the energy costs and are profitable. Research and development activities for such technologies yield desirable outcomes for society. The technology options that take long periods of time for implementing such as hydrogen, nuclear power, and renewable-based energy systems, require early, well-planned strategies with consideration to uncertainties. 4. Technology cost to achieve LCS:
Annual implementation cost required for low-carbon technology is estimated at least 7.0 to 9.9 trillion JPY
Future cost of countermeasures will vary depending on the direction of socioeconomic
development in the envisioned society. In order to achieve the envisioned society in 2050, it is necessary to appropriately lead industrial transformation and investment in transportation infrastructure as soon as possible. Those investments are not necessarily carried out as a climate change policy since they will be deployed anyway for enhancing Japan’s international competitiveness, designing safe communities with comfortable levels of mobility and energy security. In this study, it is assumed that those investments, which also contribute for developing LCS, as a result, will occur with appropriate timing. Hence those investments are not included in the cost analysis for achieving LCS in this study. However, even if those investments are carried out, it will become necessary to accelerate the diffusion of innovative technologies to achieve LCS.
This study estimates the annual implementation cost of introducing low-carbon technologies in order to achieve LCS targeting at 70% emission reductions in 2050. Annual implementation cost of low-carbon technology needed in 2050 is estimated to be JPY 9.0 trillion to 9.9 trillion for scenario A and 7.0 trillion to JPY 7.9 trillion for scenario B as shown in Table 4. The additional costs were estimated by subtraction of the cost of existing technology and the cost of selected low-carbon technology in each sector (Fig. 6). Annual additional cost in 2050 was estimated to be JPY 1.0 to 2.0 trillion for scenario A and JPY 0.7 to 1.9 trillion in scenario B. The corresponding average reduction costs are estimated in the range of 25,000 JPY/tC to 39,900 JPY/tC.
14

Low-carbon technology
Conventional technology
Energy price,Interest rate
Reduction of CO2emissions (tC)
Fixed cost, O&M cost,Energy consumption,
Lifetime
CO2emissions
Abatement cost ($/tC)
Annualized cost of
technology
CO2 emission factor
Fixed cost, O&M cost,Energy consumption,
Lifetime
CO2emissions
Annualized cost of
technology
Additional cost ($)
M: Annualized cost of technology
ENOMPM L
L
++•−+
+=
1)1()1(
ααα
P: Fixed costs ($)OM: O&M costs ($/yr)EN: Energy costs ($/yr): : Interest rate (%)L: Service lifetime (yr)α
Fig. 6 Calculation of additional cost to induce low-carbon technology for 70% reduction
The difference between the cost of conventional technology (existing technology which is induced when no action for LCS is taken) and Low-carbon technology (necessary technology to actualize 70% reduction) is considered as the additional cost.
Table 4 Additional Cost for LCS
Scenario A Scenario B
Annual implementation
Cost (% of GDP in 2050)
9.0-9.9 trillion yen
(0.83%-0.90%)
7.0-7.9 trillion yen
(1.01%-1.12%)
Annual Additional Cost 1.0-2.0 trillion yen 0.7-1.9 trillion yen
Average Reduction Cost* 25,200-38,900yen/tC 25,000-39,900yen/tC
*Average Reduction Cost=Additional Cost/Emission quantity reduced by the additional measure
15

5. Technology roadmap for 2050: A long-term saving effect through early investments in energy saving technologies
For a preliminary analysis, the emission reduction target for 2050 was set and the optimal path
(i.e., the path of minimum economic loss), of mitigation measures from 2000 to 2050 were simulated by a dynamic optimization model. The important point to note is that this analysis was based on a comprehensive database of feasible technology options shown in Table 3 and Fig. 5 and it excluded unrealistic technologies that exhibit high uncertainty. As a result, it was found that, considering lifetime of capital, promoting an early investment on energy savings as well as those in the target year becomes the optimal path of mitigation action. When energy saving investments are delayed and yet the reduction target is to be achieved by the target year, introduction of technologies at a higher marginal cost becomes essential and it is estimated that economic loss will be greater than the loss in the case of early investment. The effect of price reduction due to diffusion of energy saving technologies is not considered in this simulation model, but if such an effect is taken into account, much earlier mitigation action is chosen and it will further reduce the economic loss. On the other hand, as for investment amount, incremental costs are caused by introducing energy saving investments. Considering an efficient use of existing capital invested, it is vital to promote energy saving investments without missing an opportunity of new investment, because recruitment and replacement of existing technologies by new technologies take time.
With regard to full-scale action aiming at LCS, there is an argument that it is better to delay current mitigation action at a high cost and wait for development of cheaper measures in the future because mitigation costs are expected to become cheaper in the future as a result of technical innovation. However, judging from this analysis, such an argument would be unsound. 6. Feasibility from the viewpoint of rate of change of technology and society:
Further acceleration from the past improvement rate is necessary. The improvement rates of Energy intensity (Energy consumption/GDP) and Carbon intensity
(Carbon emission/Energy consumption) achieved by the technology innovations and social structure changes that were adopted by this analysis for 70% reduction are faster than that of the historical improvement rate (Fig. 7). Especially, as for Energy intensity, the improvement rate is necessary to be accelerated up to about 2%/year. In the past this has been less than 1.5%/year. With regard to Carbon intensity, if CCS is not introduced the required improvement rate exceeds the historical improvement rate. In scenarios of European countries aiming at reductions of 60-80% in 2050, technology improvement rates need to be at the same level as that estimated for Japan. It cannot be overlooked that the decoupling of GDP growth and the amount of the energy service demand is essential due to the requirement of dematerialization under resource constraints; in scenario B, energy service demand does not increase whereas GDP increases by about 1.5 times, as shown in Fig. 5. As a result, 0.5-1% of energy intensity improvement rate can be achieved. A drastic social innovation and an exeptional technological competition will start in the future (Fig. 7 and Table 5).
16

Fig. 7 Required improvement rate of carbon intensity and energy intensity To realize a Low-Carbon Society which reduces CO2 by 60-80% toward 2050, it is necessary to keep up the improvement rate of Energy intensity (earn GDP with a less energy) and Carbon intensity (fuel switch into low-carbon energy) which have been achieved before and even more.
Table 5 Speed of Improvement for Low-Carbon Society from 2000 to 2050
Improvement
rate of energy intensity
Improvement rate of carbon intensity [rate of CCS]
Assumed GDP growth rate [Per capita GDP growth rate]
Reduction target in 2050 [Reduction rate from 2000]
(%/year) (%/year) (%/year) (%)
Range of historical change rate
World 1.0 - 1.5 0.3 - 0.4
2050 Japan’s LCS scenario (this study)
Scenario A 2.4 1.3 [0.5]
1.4 [2.0] 70 [73]
(base year: 1990) Scenario B 1.7 1.4 [0]
0.5 [1.0] 70 [73]
European Countries United Kingdom 2.6 - 2.9 1.2 - 1.8 [0.3 - 0.9]
2.2-3.0 [2.1 - 2.8]
60 [60]
Germany
1.8 - 2.8 1.3 - 2.3 [0 - 1.4]
1.4 [1.7] 80 [75]
France
1.3 - 2.3 1.7 - 2.6 [0 - 2.0]
1.7 [1.7] 75 [70]
Base year of reduction target in United Kingdom is current state (1997), those in Germany and France are 2000. Reference:
(Historical change) Third Assessment Report of the IPCC (United Kingdom) Dept. of Trade and Industry (DTI) in UK, 2003; Future Energy Solutions: Options for a low-carbon future, DTI.
Economic Paper No. 4., DTI, London (Germany) Deutscher Bundestag in Germany, 2002; Enquete Commission on Sustainable Energy Supply Against the Background of
Globalisation and Liberalisation: Summary of the Final Report (France) Interministerial Task Force on Climate Change (MIES) in France, 2004; Reducing CO2 emissions fourfold in France by
2050 -Introduction to the debate-
0.0 1.0 2.0 3.0 4.0 5.0
Germany
France
U.K.
Scenario B
Scenario A
Historical trend
Improvement rate of carbon and energy intensity (%/y)
Energy Intensity Carbon Intensity (without CCS) Carbon Intensity (CCS)
17

7. Feasibility of energy supply: Assessing energy supply constraints and early determination of future directions of energy system
There are many possible combinations of primary energy sources. Those considered in scenarios
A and B, as shown in Fig. 8, achieve 70% CO2 emission reductions of as shown in Fig. 4. Each primary energy source has two types of constraints: supply constraints and demand-side constraints. Supply constraints are limitations of available quantity of energy sources, and demand-side constraints include preference of energy sources by customers. For example, nuclear power would be restricted by locational conditions, level of public acceptance, lead time for newly constructed plant, and load factor at demand-side. Biomass energy has limitations of both domestic production and import volume due to competition for land-use. Renewables, such as wind and solar, have physical limits of supply potentials and instability of output in essence. Hydrogen-based energy system requires building entire systems from scratch including low-carbon energy resources to produce hydrogen.
In order to consolidate future energy systems for the LCS, it is important to determine as soon as possible the future directions of the energy system in consideration both of keeping energy security and of achieving the LCS, on the grounds of perspectives for primary energy supply, energy types at demand-side, and diversifications both of energy supply and of applications.
Coal Oil Gas
Biomass
Nuclear
Solar & Wind
0 100 200 300 400 500
H2+PV/Wind
Ele.+Nuc./CCS
Biomass
H2+PV/Wind
Ele.+Nuc./CCS
Biomass
2000
2050
A20
50B
Primary Energy Consumption (Mtoe)
Coal Oil Gas Biomass Nuclear Hydro Solar & Wind
H2+PV/Wind: Hydrogen by PV/Wind, Ele.+Nuc./CCS: Electricity by nuclear and CCS
Fig. 8 Examples of energy compositions for achieving 70% of CO2 reductions in 2050
Above figure shows three extreme conditions of energy supply. H2+PV/Wind case represents installation of solar, wind, hydrogen system and fuel cell at a maximum with the assistance of micro-grid system. Electricity+Nuclear/CCS case accelerates electrification of demand-side, and expands the utilization both of nuclear power and of fossil-fueled plants with CCS. Biomass case boosts the use of biomass energy at demand-side as well as in the electricity sector. Energy compositions at scenario A and B lie between these three cases.
18

8. Feasibility for reducing energy demand: Huge potential for energy demand reduction in various sectors
Energy demands in industry, transportation, household, and commercial sector in 2050 can be
reduced by approximately 40% below the 2000 level by accelerating social technological innovations and energy technology development, as well as by developing appropriate infrastructure and by transforming the industrial structure. Industrial sector: 30%-40% reduction in energy demand through structural transformation and energy efficient technologies
35
2532
76
6
55
7
0
50
100
150
200
250
2000 2050A 2050B
Ene
rgy
Con
sum
ptio
n (M
toe)
Change of industrialoutputDecrease of servicedemandChange of industrialstructureImprovement of energyefficiencyElectricityconsumptionBiomass consumption
Gas consumption
Oil consumption
Coal consumption
Energy consumptionin 2000
Change of industrial output: changes in total production of primary and secondary industry Change of industrial structure: structural changes in primary and secondary sectors Improvement of energy efficiency: efficient energy devices such as furnaces and motors
Fig. 9 Energy demand reduction in industry sector
The industrial structure would shift towards service economy (see Fig. 3). Productions of
electric/transport machinery industries would also increase enhancing industrial competitiveness of manufacturing sectors. Social infrastructures would be further developed and the volumes of steel or cement stocked in such infrastructures would increase considerably. An innovative recycling technology would be developed and the stocked materials within the society could be re-used for high-quality purposes. Applications of such technologies would lead to improvements in resource usage rates of raw materials.
Energy demand in manufacturing processes can be classified as direct heating, steam, mechanical power, chemical reduction, refining, and others. Energy efficiencies of the technologies to fulfill those energy demands such as furnaces, boilers, and motors have great potential in terms of energy efficiency improvements.
In scenario A, in which 2% of annual GDP per capita growth rate is assumed, the production of primary industries and secondary industries will increase. Nevertheless, it is estimated that 30% of energy savings can be achieved through reduced output of energy-intensive raw materials and energy
19

efficiency improvements (the energy saving effects are 76 Mtoe and 32 Mtoe respectively). In scenario B, it is estimated that further 40% of energy reduction is possible by industrial transformations and energy efficiency improvements (see Fig. 9). Passenger transportation sector: 80% reduction in energy demand through appropriate land use and energy efficient technologies
28
98
28
12
67
0
10
20
30
40
50
60
2000 2050A 2050B
Ene
rgy
Con
sum
ptio
n (M
toe)
Change of totaltransportation volumeChange oftransportation structureDecrease of servicedemand Improvement of energyefficiencyElectricity consumption
H2 consumption
Solar consumption
Biomass consumption
Gas consumption
Oil consumption
Energy consumption in2000
Change of total transportation volume: decrease in total transportation demand associated with population decrease Change of transportation structure: modal shift towards public transportation due to change of population allocation (LRT, public buses, etc.) Decrease of service demand: shortened average trip distances associated with changes in urban structure such as compact city Improvement of energy efficiency: Improvement of energy efficiency of vehicles(hybrid vehicle, lightening of car body, etc)
Fig. 10 Energy demand reduction in passenger transportation sector Passenger transportation demand reduces due to several factors which include decrease in
population, reduction in average trip distance via development of “compact city” aimed at secure and safe society, promotion of public transformation in order to achieve urban development dedicated to vulnerable road users, and other measures.
Combining the demand reduction measures together with more efficient vehicles, such as hybrid vehicles or electric motor vehicles, and changes in fuel towards lower carbon intensity (electricity, hydrogen, and biomass) can lead to 80% reduction in energy demand from the passenger transportation sector.
In scenario A, households, offices, and shopping centers are located more intensively in the urban areas compared with scenario B. Therefore, the average trip distance is shorter and modal share of public transportation is higher. Promotion of increasing density of urban structures could additionally reduce 8-9 Mtoe of energy consumption for both scenarios.
Note, however, that car transportation would still have the highest share in passenger transportation sector in 2050. Technology innovations of the vehicle including penetration of electric or hydrogen vehicle, lightness of car body, improvement of air resistance, installation of hybrid engine, and other similar measures can save 28 Mtoe of energy demand for scenario A and scenario B.
20

Freight transportation sector: 50% reduction in energy demand through efficient transportation management system and energy efficient technologies
1413
24
2 23 3
0
5
10
15
20
25
30
35
40
2000 2050A 2050B
Ener
gy C
onsu
mpt
ion(
Mto
e)
Change of totaltransportation volumeChange oftransportation structureChange of servicedemand Improvement of energyefficiencyElectricity consumption
H2 consumption
Solar consumption
Biomass consumption
Gas consumption
Oil consumption
Energy consumption in2000
Change of total transportation volume: changes in freight transportation demand associated with industrial production Change of transportation structure: changes in mode of transportation through modal-shift Change of service demand: changes associated with application of rational logistic systems such as SCM (supply chain management) Improvement of energy efficiency: improvement of energy efficiency of vehicles
Fig. 11 Energy demand reduction in freight transportation sector
It is possible to save approximately 50% of energy demand in scenario A and B respectively by
developing rational logistics systems with Information and Communications Technologies (ICT) and by promoting more efficient transportation vehicles (see Fig. 11).
SCM (Supply Chain Management), which includes appropriate management of product flows and efficient route search through ICT, would be expected to enhance the load efficiency and lessen the volumes of returned or disposed products. In addition, advanced management of logistics networks would make connections between small lot cargoes by truck and large lot cargoes by ship/train smoother, thus facilitating modal-shift. Those effects are estimated to be 4 Mtoe for scenario A and 2 Mtoe for scenario B, respectively.
Through drastic improvement of energy efficiency vehicles in the freight transportation sector, for scenario A, 13 Mtoe of energy would be saved with penetration of electric or hydrogen fueled vehicles. In scenario B, on the other hand, it is assumed that 50% more efficient vehicles fueled with biomass would reduce the energy demand by 14 Mtoe in this sector.
21

Residential sector: Leading future replacement building to high insulated dwellings, which strike a balance between comfortable living space and energy saving, reduces 40-50% of energy demand
17
12
23
9
3 43 4
0
10
20
30
40
50
60
70
2000 2050A 2050B
Ener
gy C
onsu
mpt
ion
(Mto
e)
Change of the numbersof householdsChange of servicedemand per householdChange of servicedemand per householdImprovement of energyefficiencyElectricity consumption
H2 consumption
Solar consumption
Biomass consumption
Gas consumption
Oil consumption
Energy consumption in2000
Change of the number of households: the number of households decrease both in scenario A and B from present to 2050 Change of service demand per household: convenient lifestyle increases service demand per household Change of energy demand per household: high insulated dwellings, thermo bathtub and Home Energy Management System (HEMS) decrease service demand per household Improvement of energy efficiency: energy efficiency improvement of air conditioner, water heater, cooking stove, lighting and standby power
Fig. 12 Energy demand reduction in residential sector
The average lifetime of dwellings in Japan is around 35 years and a lot of existing dwellings will
be rebuilt by 2050. Therefore it is possible to create a dwelling stock that can strike a balance between comfortable living space and energy saving by leading future replacement buildings to energy-saving highly-insulated dwellings (Fig. 12).
The decrease in the number of households compensates for the increase of energy demand with the rise of service demand. The reason why the service demand of scenario A, in which people seek convenience, almost equals that of scenario B in which people prefer more sustainable ways of living, is that energy service demand of scenario A will decrease due to eating out, increase of collective houses, and other new practices.
Rebuilding into highly insulated dwellings could reduce about 10 Mtoe. In addition to this, technological innovations such as efficiency improvement of heat pumps (for air conditioners and electric water heaters), cooking stoves, lightings, and standby power could reduce 50% of total energy demand below the 2000 level.
Similar results are shown in The UK “40% House (2005, Boardman)” and Japan “Guideline for self-sustainable recycling-oriented dwellings (2005, Ministry of Land, Infrastructure and Transport Japan Project for technological improvement)”.
CO2 emissions from the residential sector could be almost reduced to zero by increasing the use of hydrogen and electricity which does not emit CO2 in scenario A, and increasing the use of distributed renewable energy such as solar heat, solar power and biomass in scenario B.
22

Service sector: Combination of comfortable servicing space/working environment and energy efficiency improvement reduces 40% of energy demand
18
8
25
7
56
62
0
10
20
30
40
50
60
70
2000 2050A 2050B
Ener
gy C
onsu
mpt
ion
(Mto
e)
Change of commercialactivityChange of commercialsector structure Change of energydemand per floor spaceImprovement of energyefficiencyElectricity consumption
H2 consumption
Solar consumption
Biomass consumption
Gas consumption
Oil consumption
Coal consumption
Energy consumption in2000
Change of commercial activity: floor space increases with the rise of activity Change of commercial sector structure: share of energy intensive business fields such as hotels and restaurant increases Change of energy demand per floor space: high insulated buildings and Building Energy Management System (BEMS) reduce energy demand Improvement of energy efficiency: efficient air conditioner, water heater, lightings fulfills service demand with less energy
Fig. 13 Energy demand reduction in commercial sector
The demand for floor space in service industries would rise due to increase of their outputs as the economy becomes more service-oriented in both scenarios, A and B (Fig. 3). However, the labor population of service industry would not increase much because of population decrease. The number of electric appliances in the offices would increase in order to improve the working environment, but insulation, BEMS and energy efficiency improvement of appliances could reduce 40% of energy demand in 2050 (Fig. 13).
The activity of hotels, restaurants and amusement places which consume a lot of energy would increase with the active consumption in scenario A. As a result, the energy consumption would increase by 12 Mtoe. However, rebuilding to high insulated buildings and distributing BEMS could reduce 7 Mtoe of energy demand. Besides, high efficient air conditioners, high efficient water heaters and high efficient lightings could reduce 25 Mtoe of energy demand.
23

9. Incentives for achieving LCS: It is necessary to build a common vision towards LCS at an earlier stage, establish comprehensive measures, and implement actions in a long-term schedule.
This research shows that there are technological potentials to achieve LCS by implementing
appropriate changes of industrial structure, maintaining land-use and infrastructure, and introducing innovative technologies while satisfying a certain level of social welfare. However, to realize LCS, the government should take a strong leadership in promoting a common awareness about risks of climate change, coordinating a national agreement on aiming at LCS, and implementing policy measures which internalizes the negative externalities of CO2 emissions.
Especially, it is important to note that early actions are cost-effective. Adoption of industrial transformation and technological development and its use depends on each decision maker (i.e., each private sector, thus the government needs to clearly show a vision for LCS at an earlier stage, and provide a social system where there are incentives for private sectors to reduce carbon emissions. Moreover, the government should immediately determine a consistent policy to promote investment on transportation and urban infrastructure towards LCS so as to avoid a social structure of high carbon society in the future.
The challenge for achieving LCS is now in a global main stream and there is no turning back in this trend. It is necessary to face this problem sincerely and the Japanese government must take steps to enhance international competitiveness by promoting innovative technologies envisioned for achieving LCS
In order to achieve LCS by 2050 without missing opportunities for various investments on capital formation and technology development, it is necessary to set up the national goals (i.e., the vision of LCS, rather than target rates of reduction) at an early stage, establish the abatement schemes, and realize a society that internalizes the negative externalities of CO2 emissions. In this process, it stimulates and accelerates social and technological innovations that help in getting an advantage in international competition in the future low-carbon world.
10. Step towards global participation on climate change mitigation strategies:
Japan would set an attractive example of a LCS to Asian countries as well as to the rest of the world.
This research focuses not only on domestic actions, but also on international collective actions for
achieving the global LCSs under the UNFCCC, and on grass-roots activities. Our team has made collaborative researches with some Asian countries, namely, China, India and Thailand, through the development and application of integrated assessment models. Such joint research projects attempt to depict feasible LCS visions in developing Asian countries, and to explore ways for building frameworks of international cooperation for the realization of the LCSs. Such activities begin to affect national energy policies. Also, recent tight conditions of energy supply accelerate these trends.
The Ministry of the Environment of Japan and the Department for Environment, Food and Rural Affairs in the UK has been jointly promoting a scientific research project, “Developing visions for a LCS through sustainable development”, since February 16, 2006. Our team has supported to coordinate three workshops (the 1st workshop in June 2006, Tokyo, the 2nd one in June 2007, London, and the 3rd workshop in February 2008, Tokyo) with participation of around 20 countries experts. Finally “Call for Action” of the three workshops and “Executive Summary” of the 3rd workshop on 13-15 Feb 2008 were delivered to Gleneagles dialogue (G20) in Chiba, during 14-16 March 2008
24

and G8 Environmental Ministerial Meeting in Kobe, during 24-26 May 2008. It supported to edit the international journal, Climate Policy Special Issue “Modelling Long-Term Scenarios for a Low Carbon Society” released on June 2008.
US
Canada
UK
France
China
India
W orld
0
1
2
3
4
5
6
7
1970
1980
1990
2000
2010
2020
2030
2040
2050
CO
2 per
cap
ita e
mis
sion
s (t-C
/cap
)
GermanyMETI, Japan2030 scenario
Target for Low Carbon SocietyIB1
IA2
Japan 2050 scenario
US: delay for tech development, global warming business
EU: Initiatives toward LCSJapan: Need long-term vision
Developing countries: earlierguidance toward LCS is key
$200/t-C scenario
Shuzo Nishioka, Junichi Fujino; NIES COP11 and COP/MOP1 side eventGlobal Challenges Toward Low-Carbon Economy (LCE), Dec.3, 2005
How to structure How to structure global participation global participation
Fig. 14 Current per capita CO2 emissions and international targets for LCS
European countries and Japan have gone into action for the LCS. U.S.A and Canada have CO2 reduction plans, such as emission trading schemes. On the other hand, although CO2 emissions per capita in developing counties, such as China and India, is below compared to developed countries at the present time, these countries have large potentials to drastic increases in CO2 emissions. How LCS is attained in developing countries? How do they get freedom from lock-in on their energy system to high carbon infrastructures, such as private-vehicle dependent transportation systems? How can they enjoy high quality of life under the LCS by leap-frogging into developed countries through both technological and social innovations?
25


II. A Dozen Actions towards Low-Carbon Societies (LCSs)
1. Comfortable and Green Built EnvironmentEfficiently use of sunlight and energy efficient built environment design. Intelligent buildings
2. Anytime, Anywhere Appropriate AppliancesUse of Top-runner and Appropriate appliances. Initial cost reduction by rent and release system resulting in improved availability.
3. Promoting Seasonal Local FoodSupply of seasonal and safe low carbon local foods for local cuisine
4. Consuming In-Season LocalUsing local and renewable buildings materials and products.
7. Pedestrian Friendly City DesignCity design requiring short trips and pedestrian (and bicycle) friendly transport, augmented by efficient public transport
6. Swift and Smooth LogisticsNetworking seamless logistics systems with supply chain management, using both transportation and ICT infrastructure
8. Low-Carbon ElectricitySupplying low carbon electricity by large-scale renewables, nuclear power and CCS-equipped fossil (and biomass) fired plants
9. Local Renewables for Local DemandEnhancing local renewables use, such as solar, wind, biomass and others.
10. Next Generation FuelsDevelopment of carbon free hydrogen- and/or biomass-based energy supply system with required infrastructure
5. Environmentally Enlightened Business and IndustryBusinesses aiming at creating and operating in LCmarket. Supplying LC and high value-added goods &services through energy efficient production systems
12. Low Carbon Society LeadershipHuman resource development for building “Low-Carbon Society” and recognizing extraordinary contributions.
(All sectors)11. Labeling to Encourage Smart and rational Choices
Publicizing of energy use and CO2 costs information for smart choices of LC goods and service by consumers, and public acknowledgement of such consumers
(All sectors)
Commercial & Residential
56-48 MtC reduction
Transportation
44-45 MtC reduction
95-81 MtC reduction30-35 MtC reduction
Industrial Energy transmission
27


Principal contents This report proposes a dozen actions to be taken in Japan to reduce CO2 emissions by 70% by 2050 from the emission level in 1990. These actions should be taken without delay in order to create low-carbon society in Japan. 1. “2050 Japan Low-Carbon Societies” scenario team published a report entitled “Japan Low
Carbon Society Scenarios: Feasibility study for 70% CO2 emission reduction by 2050 below 1990 level” in February 2007, in which it stated that Japan has the technological potential to reduce the emissions of CO2, which is the major greenhouse gas, by 70% by 2050 from the emission level in 1990 while satisfying the required amount of energy services. The report also mentioned that to achieve the goal, the Japanese government must take strong initiatives in sharing the goals of a low-carbon society, establishing comprehensive measures and long-term plans, reforming industrial structures, and funding infrastructures to encourage private investment in energy-saving technologies and R&D of low-carbon energy technologies.
2. Based on analyses of scenarios, innovations such as technologies and reform programs for social systems have been studied from the viewpoint of when and how such innovations should be implemented and what kind of measures and policies are effective to realize them. A dozen actions are proposed and their effectiveness has been studied with the use of an assessment model. The actions are expected to cover the entire 70% reduction goal. Cross-sectional and/or additional measures will enable emissions to be reduced further, but efforts in the energy demand sectors are particularly important. The 70% reduction will be shared as follows: 13 to 15% in industry, 21 to 24% in buildings, 19 to 20% in transportation, and 35 to 41% in energy sectors.
3. The effects of measures and policies undertaken in a particular sector for achieving a low-carbon society also help carbon reduction in other sectors. For example, well insulated houses and the use of solar energy are direct and effective low-carbon measures for the residential and commercial sectors (including the building sector). Low-carbon measures taken by primary energy suppliers, such as increased use of renewables, will also contribute to the CO2 reduction in the building sector. To expand the use of renewables, it is also necessary to encourage their use in the end-use sectors. Publicity and environmental education underpin all measures. There are also various technological and social barriers to achieving reduction goals, and it takes time to remove these barriers. Therefore proper steps must be taken in a due sequence. In this report, an action denotes a set of technological measures, social system reform programs and stimulatory policies that are combined appropriately by also considering mutual relationships.
4. In this report, economic methods that are cross-sectorally effective, such as a carbon tax and emissions trading, are not included as independent actions. The addition of economic methods will enhance the effects of the dozen actions proposed here. Social infrastructures, such as public works and the capital market, are assumed to be properly in place.
5. The actions proposed here were prepared based on the results of studies by about 60 researchers in the project and opinions of experts. The scenario team has a responsibility to summarize this report. It is hoped that the report will contribute to drawing up policies and measures for low-carbon societies.
29


1. Low-carbon societies in 2050: CO2 emissions can be reduced by 70% On February 15, 2007, “2050 Japan Low-Carbon Society” scenario team mentioned in its report
entitled “Japan Low Carbon Society Scenarios: Feasibility study for 70% CO2 emission reduction by 2050 below 1990 level” that Japan has the technological potential to reduce the emissions of CO2, which is the major greenhouse gas, by 70% by 2050 from the emission level in 1990 while satisfying the required amount of energy services in either of the two possible socioeconomic scenarios (Scenario A: Vivid / Scenario B: Slow).
Table 6 Two socioeconomic scenarios (Scenarios A and B)
Scenario A: Vivid Scenario B: Slow
Technology-driven Nature-orientedUrban/Personal Decentralized/Community
Technology breakthroughCentralized production /recycle
Self-sufficientProduce locally, consume locally
Comfortable and Convenient Social and Cultural Values
2%/yr GDP per capita growth 1%/yr GDP per capita growth
Akemi Imagawa
Further investigations were conducted for the purpose of setting reduction goals, formulating
methods for designing low-carbon society scenarios, and estimating roles of technologies related to energy, city, transportation and ICT. In February 2008 a part of the study results was published entitled “Vision and achieving scenarios of a low-carbon society (in Japanese)” (Global Environment, Vol. 12, No. 2, 2007, Association of International Research Initiatives for Environmental Studies).
In Scenarios A and B, the GDP per capita is estimated to increase by 2.7 and 1.6 fold, while the population will decrease by factors of 0.74 and 0.8, leading the GDP to increase by 2.0 and 1.3 fold, respectively, from the corresponding levels in 2000. There are several movements that will reduce energy service demands such as shifts to service industries, saturation of number of vehicles, and change of industrial structures through decrease of investment in social infrastructures. Thus, the total energy demand for services will be almost equal to that in 2000 (Table 6, Fig. 15).
Various innovations, such as well insulated buildings, city structures where people can live within walking distance, and the development and spread of energy-saving devices will enable energy demand to be reduced by about 40% while satisfying the service demands. It is shown that CO2 emissions can be reduced by 70% from the emission level in 1990 by implementing low-carbon
31

measures by energy suppliers, such as increasing the share of solar, wind power and other renewables and appropriate use of nuclear power and carbon capture and storage (Fig. 15 and 16).
×PopulationGDP Service demand
× Population× ×
GDP per capitachangex 2.7
Demand cut by Servicizing
x 0.4
Improvement of energy eff.
x 0.7
Total service demand is approximately same as 2000 level (about 0% reduction)
[Energy demand sector]About 40% reduction
by efficient appliances, insulated building, compact city etc.
[Energy supply sector]About 30% reduction
by nuclear, renewables, CCS etc.
Fuel shift to low carbon mix
x 0.4
CO2 changex 0.3
Populationchangex 0.8
CO2 Emission =GDP Service demand
Energy demandEnergy demandCO2 Emission
Total about 70%reduction of CO2
emissions
× × × ×=
= + +
Fig. 15 Relationships among components for achieving 70% CO2 emission reduction from the 1990 level (The ratio indicates the approximate value in 2050 to the value in 2000, Scenario A)
Fig. 16 Combinations of actions for achieving 70% reduction by 2050 (Scenario A)
2. Reduction effects of the dozen actions for each sector In order to achieve the goal of 70% reduction by 2050, innovations such as technologies and
reform programs have been studied from the viewpoint of when and how such innovations should be implemented and what kind of measures and policies are effective to realize them (Fig. 17). A dozen actions are proposed and their effectiveness has been studied.
32
70%
red
uctio
n
621
90
36
77
6124
1013
38
97
28
17
41
36CCS
Carbon Capture Storage
Change of activity
1990
CO
2 Em
issi
on
2000
CO
2 Em
issi
on
2050
CO
2 Em
issi
on
Change of activity
Impr
ovem
ent o
f ca
rbon
inte
nsity
of
ene
rgy
supp
ly
Impr
ovem
ent o
f ca
rbon
inte
nsity
of
end
-use
Impr
ovem
ent o
f en
ergy
inte
nsity
of
end
-use
Redu
ctio
n of
dem
and
Ener
gy d
eman
d se
ctor
Ener
gy s
uppl
y se
ctor
Indu
stry
Tran
spor
tatio
nRe
side
ntia
l &
com
mer
cial
Ener
gy s
uppl
y
Reduction of service demandImprovement ofenergy intensityImprovement ofcarbon intensity
Reduction of service demand
Reduction of service demand
Improvement ofenergy intensity
Improvement ofenergy intensity
Improvement ofcarbon intensity
Improvement ofcarbon intensity
Improvement ofcarbon intensity
・High economic growth, Increase of service demand per household, Increase of office floor (increase)
・Servicizing of industry, Decline in number of households, Increase of public transportation (decrease)
・Significant improvement in energy efficiency of production equipment
・Fuel switch from coal and oil to natural gas
・Insulation・Energy use management (HEMS/BEMS)
・Efficient heat pump air-conditioner, Efficient water heater, Efficient lighting equipment
・Development and widespread use of fuel cell・All-electric house・Photovoltaic
・Advanced land use / Aggregation of urban function・Modal shift to public transportation service・Widespread use of motor-driven vehicle such as
electric vehicle and fuel-cell electric vehicle・High efficiency freight vehicle・Improvement of energy efficiency (train/ship/airplane)
・Power generation without CO2 emission・Hydrogen production without CO2 emission
・Fuel mix change to low carbon energy sources such as natural gas, nuclear energy, and renewable energy
・Effective use of night power / Electricity storage・Hydrogen (derived from renewable energy) supply
・Farm products produced and consumed in season

Fig. 17 The role of actions towards low-carbon societies in 2050 Measures and policies undertaken in a particular sector for achieving a low-carbon society not
only affect that sector but also promote carbon reduction in other sectors. For example, well insulated houses and the use of solar energy are direct and effective low-carbon measures for the residential and commercial sectors. Low-carbon measures taken by primary energy suppliers, such as increased use of renewables, will also contribute to the CO2 reduction in the building. To expand the use of renewables, it is also necessary to encourage their use in the end-use sectors. Wide publicity and environmental education underpin all measures. There are also various technological and social barriers to achieving reduction goals, and it takes time to remove these barriers. Therefore proper steps must be taken in a due sequence. In this report, an action denotes a set of technological measures, social system reform programs and stimulatory policies that are combined appropriately by also considering mutual relationships (Fig. 17).
The model studies indicate the reduction potential in each sector. The effective measures and policies to realize such reduction potential are summarized as actions. A dozen actions are formulated by taking into account the model results and experts interviews (Table 2).
Principal target fields of the actions are residential and commercial sector (1 and 2), agriculture and forestry (3 and 4), industries (5), transportation sector (6 and 7), and energy (8, 9 and 10). Actions 11 and 12 are cross-sectional actions.
In this report, economic methods that are cross-sectorally effective, such as a carbon tax and emissions trading, are not included as independent actions. The addition of economic methods will add value effects and enhance the effects of the dozen actions. Social infrastructures, such as public works and the capital market, were assumed to be properly in place and improved.
33
In order to achieve the 70% reduction goal by 2050, we In order to achieve the 70% reduction goal by 2050, we investigated investigated --which options should be selected,which options should be selected,--when options should be introduced,when options should be introduced,--how much of each option should be how much of each option should be introduced at each stage,introduced at each stage,
with reference of candidatewith reference of candidate options as prepared.options as prepared.
Current society
2050 Society
Economic activityCO2 Emission
2000 2050
CO2
CO2
Low carbon society
Economicactivity
CO2
BaU society
70% reductiontarget
Actions bind Actions bind up these up these optionsoptionsEconomic
activity
Technology, infrastructure, institution,
management optionsTechnology,
infrastructure, institution, management options
Technology, infrastructure, institution,
management options

Table 7 A Dozen Actions towards Low-Carbon Societies
Name of Action Explanation Expected CO2 reductions1 Comfortable and Green Built
Environment Efficiently use of sunlight and energy
efficient built environment design. Intelligent buildings
2 Anytime, Anywhere Appropriate Appliances
Use of Top-runner and Appropriate appliances. Initial cost reduction by rent and release system resulting in improved availability
Residential sector: 56~48 MtC
3 Promoting Seasonal Local Food
Supply of seasonal and safe low carbon local foods for local cuisine
4 Sustainable Building Materials Using local and renewable buildings materials and products
5 Environmentally Enlightened Business and Industry
Businesses aiming at creating and operating in low carbon market Supplying low carbon and high value-added goods and services through energy efficient production systems
Industrial sector: 30~35 MtC
6 Swift and Smooth Logistics Networking seamless logistics systems with supply chain management, using both transportation and ICT infrastructure
7 Pedestrian Friendly City Design
City design requiring short trips and pedestrian (and bicycle) friendly transport, augmented by efficient public transport
Transportation sector: 44~45 MtC
8 Low-Carbon Electricity Supplying low carbon electricity by large-scale renewables, nuclear power and CCS-equipped fossil (and biomass) fired plants
9 Local Renewable Resources for Local Demand
Enhancing local renewables use, such as solar, wind, biomass and others
10 Next Generation Fuels Development of carbon free hydrogen- and/or biomass-based energy supply system with required infrastructure
Energy conversion sector:95~81 MtC
11 Labeling to Encourage Smart and Rational Choices
Publicizing of energy use and CO2 costs information for smart choices of low carbon goods and service by consumers, and public acknowledgement of such consumers
12 Low Carbon Society Leadership
Human resource development for building “Low-Carbon Society” and recognizing extraordinary contributions
Cross-sectional
The reductions in each sector are based on Scenario A and Scenario B, respectively.
34

Fig. 18 Role of a dozen actions to reduce CO2 emissions Fig. 18 shows the reduction effects of the dozen actions. The relationships among ranges and the
estimated reductions in CO2 emissions from each sector for each scenario are shown. One action contributes to reductions in two or more components and sectors, and reductions in a sector and in a component are the result of contributions of two or more actions. Possible reduction levels were calculated not for each action but for each cross-sectional approach. The values were then used to calculate the levels for energy supply and demand sectors, for each measure, such as changes in services, improved efficiency, and improved carbon intensity, and for each sector such as industry, residential and commercial, transportation, and energy conversion.
The total reduction value of 230 MtC corresponds to a 70% reduction from the emissions level in 1990. The reduction levels in each sector are shown in the right column for each scenario. Combinations of the dozen actions results in reductions of 35 to 42 MtC in industry, 60 to 65 MtC in residential and commercial, 52 to 62 MtC in transportation, and 68 to 96 MtC by energy conversion. Thus, the 70% reduction will be shared as follows: 15 to 18% in industry, 26 to 28% in residential and commercial, 23 to 27% in transportation, and 33 to 17% in energy conversion.
Improvement of carbon intensity in both energy supply and demand and improvement of energy efficiency on the demand side will be especially effective. On the whole, efforts in the energy demand side will be the key.
34
23
35
16
13
24
77
17
28
7
9
38
13
10
24
1
6 21●●
Low Carbon Society Leadership
Labeling to Encourage Smart and
rational Choices
Next G
eneration Fuels
Local Renewable Resources for Local
Dem
and
Low-Carbon Electricity
Pedestrian Friendly City Design
Swift and Sm
ooth Logistics
Environmentally Enlightened Business
and Industry
Sustainable Building Materials
Promoting Seasonal Local Food
Anytim
e, Anywhere A
ppropriate A
ppliances
Comfortable and G
reen Built Environm
ent
●
●
●
12
40●●●●●
●●●●●●●●
●●●●●
5●●●●●
●●●●●●●
●●●●
14●●●●
●●●●●●
●●●
4●□●□●
1110987654321
2000年
CO
2排
出量
2000年
CO
2排
出量
1990
CO
2 Em
issi
on
70%
redu
ctio
n
* Unit of number in the table is MtC.
621
90
36
77
24
1013
38
97
28
17
41
36CCS
21
24
63
82
40
24
1314
16
35
23
34
40
5
Energy supplysector
Trans-portation
Industry
Change of activity
<Scenario A>
Ener
gy s
uppl
yse
ctor
Impr
ovem
ent o
f ca
rbon
inte
nsity
16
214
230+)
230+)
35
60
52
77
42
65
62
40
● : Sector in which actions contribute reduction directly: Sector in which actions contribute reduction indirectly.
□ : Sector in which reduction by actions is included under "Change of activity"
56 - 48 95 - 81 Included in others
2000
CO
2 Em
issi
on
Impr
ovem
ent o
f ca
rbon
inte
nsity
Ener
gy d
eman
dse
ctor
<Scenario B>
Change of activity
Industry
Residential & commercial
Trans-portation
Residential & commercial
Energy supplysector
Impr
ovem
ent
of
ener
gyin
tens
ityRe
duct
ion
of d
eman
d
Impr
ovem
ent o
f ca
rbon
inte
nsity
Impr
ovem
ent o
f ca
rbon
inte
nsity
Impr
ovem
ent o
f en
ergy
inte
nsit
yRe
duct
ion
of d
eman
d
Ener
gy d
eman
dse
ctor
Ener
gy s
uppl
y se
ctor
2050
CO
2 Em
issi
on
30 - 35 (+ α) 44 - 45
2050
CO
2 Em
issi
on
35

3. Concept of Action
Fig. 19 outlines components of Action.
1) Future Objectives: Desired social systems in 2050 are described here. Concrete figures for the target, such as CO2 emissions, technological levels, and penetration levels are indicated quantitatively as much as possible.
2) Implementation Barriers and Strategic Steps: Actions cannot be taken spontaneously; it takes time to lay the foundations for establishing the actions first, then for the actions to gain public acceptance and become rooted in society. There are also technological and social barriers to be removed. Implementation time is needed to remove the barriers through various strategies, including approaches, countermeasures and policies. These strategies should be executed in the proper sequence. There are some strategies that can and must be taken immediately. Other strategies may need certain barriers to be removed before they can be implemented. There are certain barriers that need continuous counteracting efforts.
3) Procedure of actions: The bottom part of the figure shows elements of both (1) and (2) with timeline in the form of Gantt chart. Various actions, countermeasures and policies for overcoming the barriers, and their chronological implementation for achieving the goal are shown in the lower part of the sheet.
Fig. 19 Components of Action
The dozen actions are outlined in latter part of the report with two pages dedicated to each action.
4. Actions and their implications for homes and offices, transport and Industry The effects of the dozen actions for achieving low-carbon homes, offices, transport, and industry
were investigated. Not only the actions for directly reducing greenhouse gas emissions of a sector,
36
Future images expected from introduction of each action are described. Clear and quantitative targets are set where possible.
Barriers to achieving the future objectives and the stepwise strategies to overcome those barriers are described. The main actors for each action stated here are central and local governments if not otherwise specified.
When the actions of other stakeholders can be crucial to achieve the future objectives, their expected contributions are mentioned here.
This section outlines the barriers on the left side and presents the strategies to overcome them in form of a bar chart.
Indicators to measure the achievement of each action are presented here. Quantitative target are set where possible.
The keywords that describe future objectives are presented. The details of each keyword are described in “Future Objectives” in the left page (box 1 in this figure).
Each strategy is expressed in a solid bar and the length of the bar indicates the time schedule of the strategy. If a strategy lacks continuity then it is expressed as a sequence of circles.
1
2
3

but also actions which induce CO2 reductions indirectly were investigated. Actions in homes and offices
Many energy-consuming devices are used in homes and offices to make life and work more comfortable and efficient. Such devices are a major source of CO2 emissions.
To reduce energy load sharply, houses and buildings need to be designed to prevent heat from escaping and penetrating inside; solar heat and natural wind should be used for temperature control of buildings, and solar power should support lighting. To encourage the construction and penetration of such houses and buildings, policies should be implemented for reducing the economic burden on their owners and systems should be introduced for assessing and labeling the environmental performance of buildings. Well insulated houses minimize temperature differences among rooms, enable the provision of high-quality heat with low carbon emissions, such as radiant heat. These measures are appropriate for an aged society (Actions 1, 5).
Energy-efficient appliances and devices also contribute to the CO2 reduction in homes and offices. In order to accelerate the improvement of energy efficiency, the coverage of the conventional top-runner system should be extended to include all energy devices, and the improvement targets should be revised every few years. Rewarding systems for entities that develop excellent technologies should also be adopted for strengthening market penetration of energy-efficient technologies (Actions 2, 5).
However, these newly-developed efficient devices will not be widely used unless users actively adopt them. To support such low-carbon consumption, advertising systems and infrastructures should be constructed to enable consumers to obtain correct information about greenhouse gas emissions from their consumption behavior. Through these activities, CO2 emission from production of goods and services could be cut indirectly (Actions 11, 12).
Not eating vegetables, fruits and other food that are not seasonal reduces the energy required to produce farm products (Action 3). Active use of wood instead of steel and cement for constructing houses and buildings will reduce the consumption of materials whose production processes need high energy (Action 4).
There are also measures for sharply reducing energy, such as active use of solar, wind and biomass energies available locally and purchase of low-carbon electricity (Actions 8, 9 and 10).
37

Fig. 20 Actions for low-carbon homes and offices
Fig. 21 Actions for low-carbon transport
38
1. Comfortable & green built environment
Keep warm/cool air in the building by active solar system and by changing building structure.
2. Anytime, anywhere appropriate appliances
Rental services relieve the burden of initial cost of high efficiency equipments, and promote service supply independent from manufacture.
9. Local renewable resources for local demand
Active selection ofregional solar/wind energies.
4. Sustainable building materials
Actively use of wood feedstock and wood manufactures.
3. Promoting Seasonal Local Food
Consumers select low-carbon seasonal food and can get the information about farm producers.
CO2CO2 CO2CO2CO2CO2
11. Labeling to encourage smart and rational choices
Disclosing the amount of CO2emission makes consumers select low-carbon products in affordable way.
12. Low carbon society leadership
Citizens understand that low-carbon society promotes safe and cozy life, and undertake various actions towards that end.
8. Low-carbon electricity
Selection of low-carbon electricity such as renewable/nuclear energy and thermal power with CCS.
10. Next generation fuels
Simultaneous supply of heat and electricity by fuel cell.
5. Environmentally enlightened business and industry
Change of office space design and use fully to low-carbon style.
7. Pedestrian friendly city design
Effective urban planning; high use facilities, houses and offices are built in nearby areas.Use of public traffic system and efficient vehicles.
6. Swift and smooth logistics
Commodities are transported to shops and warehouses swiftly.
10. Next generation fuels
Use of hydrogen/bio-fuel energy.
11. Labeling to encourage smart and rational choices
Disclosing the amount of CO2 emission makes consumers smarter to select transportation devices.
CO2CO2 CO2CO2CO2CO2
5. Environmentally enlightened business and industry
Simultaneous matching of supply and demand changes production, logistics, consumption and disposal practices to low-carbon choices.
8. Low-carbon electricity
Use of low-carbon electricity such as renewable/nuclear energies and thermal power with CCS.
9. Renewable resources for local demand
Active selection of regional solar/wind energies.
12. Low carbon society leadershipDeveloping human resources for designing advanced urban areas organized within walking range. Encouraging citizens to prefer walking in urban areas.

Actions for transport Greenhouse gases in the transportation sector are mainly emitted when people travel by car or
public transportation, and when goods are transported by truck and ship. Concentrating houses, offices and commercial facilities at the center of cities will reduce the
distances traveled by people and hence reduce greenhouse gas emissions. To achieve this goal, people should fully understand the advantages of living in cities where they do not need cars but can walk for living. Municipal governments, together with citizens, should draw up land use plans that consider such low carbon designs. Realizing such cities will raise market competitiveness of public transportation systems, such as bus, railways and Light Railway Transit (LRT), and thus these systems should be actively constructed. On the other hand, in regions where people live far away, they will need cars to move. The efficiency of cars should be greatly improved by switching engines to electric motors and reducing vehicle weight, resulting in the drastic reduction of CO2 emissions from transportation (Actions 7, 12).
To achieve low-carbon logistics, infrastructures for mass transportation systems such as railways and ships need to be constructed. Diverse forms of support should be given to increase the transportation capacities of these systems, such as by improving and expanding harbors and the railway network and developing high efficiency transportation devices. Systems and infrastructures should also be constructed to enable smooth transshipment at distribution centers (Action 6).
Active use of solar and wind energy available locally for cars will contribute to sharp reduction of CO2 emissions. Purchasing low-carbon electricity is also effective. It is also necessary to encourage the use of hydrogen fuel cell cars and bioenergy fuels (Actions 8, 9 and 10).
To support low-carbon mobility, systems are needed to enable all entities involved in transport to acquire, at any time and place, information both on transportation system, such as timetable and transportation fare and on greenhouse gas emissions from transport (Actions 11, 12).
Actions for industry
Companies should minimize carbon production in the lifecycle of their products (production, transport, sales, consumption and disposal). The entire business process should also be optimized using advanced information technologies so as to synchronize supply and demand and to construct efficient production-transportation systems (Actions 5, 6).
With government providing economic support to low-carbon businesses, such as strengthening public investment and giving tax benefits, companies can continue to develop leading technologies with high energy-efficiency and low carbon intensity. Conventionally, energy devices are sold to users, but to shift to the low-carbon business model, industries and/or commerce should shift to leasing of devices and appliances. This business style also supplements the pathways towards sustainable and/or recycling society. Under this style, companies will be responsible for keeping the devices operating at maximum efficiency (Actions 1, 2, 5 and 11).
For farm products, farmers should intend to produce in-season foods, and information on production should be actively publicized to consumers to enable them to select low-carbon products (Action 6). In forestry, the timber market should be expanded to replace steel and cement, which consume high energy in manufacture, and competitiveness should be enhanced by rationalization (Action 5).
The energy industry should aim to supply zero-carbon power by combining renewable energies, nuclear power, and CCS-equipped fossil-fired power. Introduction of hydrogen- and biomass-based fuels are also indispensable for achieving low-carbonization of industries (Actions 8, 9 and 10).
Fosterage of low-carbon experts through school education curricula and establishment of
39

qualification system, such as a low-carbon advisory system, will grow human capital and resources for practice of activities towards low-carbonizing industries (Action 12).
Fig. 22 Actions for low-carbon industry
40
1. Comfortable and green built environment
Promoting R&D of zero-carbon buildings.
2. Anytime, anywhere appropriate appliances
Constant effort for development of user friendly top-runner efficient devices.
11. Labeling to encourage smart and rational choicesSupporting consumer’s wise-selection through actively information disclosure.
5. Corporate social responsibility for people and earthProviding high-value and low-carbon goods and services at affordable prices in an effective way.
9. Local renewable resources for local demand
Production activity using regional energy and supply of surplus energy to others.
3. Promoting seasonal local foodActive disclosure of product information for consumers.
6. Swift and smooth logisticsReducing stocks and goods-in-process by promoting supply chain management through the utilization of IT integrated with efficient logistics.
8. Low-carbon electricitySupplying low-carbon electricity such as renewable/ nuclear energy, and thermal power with CCS.
10. Next generation fuels
Promoting R&D and investment in supply systems based on hydrogen and bio-fuel.
12. Low carbon society leadership
Cultivation of human resources to design and support a low-carbon industry.
4. Sustainable building materialsEnhancement of competitiveness of domestic timber by thorough rationalization efforts.

5. Summary (1) Proposing a dozen actions and their quantification: A dozen actions are proposed that
enables Japan to reduce CO2 emissions by 70% by 2050 from the level in 1990, based on technological selection models. An action denotes a set of technological measures, social system reform programs and stimulatory policies that are combined appropriately by also considering mutual relationships.
(2) Investigating actions by back-casting method: We use back-casting method, which
investigates actions to achieve the 70% reduction goal starting from 2050 and working back to today. From the model, numerical estimates can be prepared on what energy use (or CO2 emissions) should be done. Actions are summary of necessary approaches, technological selections, social reforms, policies and measures to achieve the targets. It would have financial advantage to start the actions later for technological progress; however approaches to halt climate change cannot be taken at once. It takes time to construct the necessary infrastructures, and taking actions at once would impose higher costs due to limited resources, funds and manpower. Consistent policies towards clear goals must be developed in proper sequence.
(3) First step towards a sustainable society: Taking measures against climate change is a major
opportunity to transform the conventional technological society that depends on huge resources and energy, into a society in which little energy and resources are used. This will also be the first step towards a sustainable society, which is our goal. Japan is one of the most rapidly aging societies, and now is the time to restructure the nation. A low-carbon society should be created by fully considering these conditions, which require reforms, and so as to be mutually effective.
(4) Need for collaborative efforts: The government must demonstrate leadership for creating a
low-carbon society, but this alone is insufficient. The national government, municipal governments, citizens, business entities, NGOs and other entities should share the vision of a low-carbon society, understand their roles and act in cooperation with each other. Most of the actions proposed here will be the basis of such cooperation and cannot be fulfilled unless all cooperate. All researchers involved in this study sincerely hope that a low-carbon society will be created by all people collaborating on the dozen actions in order to stabilize the climate.
41


The Details of Actions
1. Comfortable and Green Built Environment
2. Anytime, Anywhere Appropriate Appliances
3. Promoting Seasonal Local Food
4. Sustainable Building Materials
5. Environmentally Enlightened Business and Industry
6. Swift and Smooth Logistics
7. Pedestrian Friendly City Design
8. Low-Carbon Electricity
9. Local Renewable Resources for Local Demand
10. Next Generation Fuels
11. Labeling to Encourage Smart and Rational Choices
12. Low Carbon Society Leadership
43

1Comfortable and Green Built Environment
Future Objectives
Solar and Wind Utilization DesignArchitectural technologies and designs that are suitable for the climate of each region, using passive design layout for introducing sunlight and natural wind into the building, are widely disseminated. In addition, the individual levels of insulation technologies, screen technologies, ventilation technologies have been improved drastically, thereby enabling reduction of energy consumption while retaining comfort within residences and buildings. Consequently, the demand for energy per household will decline by about 40% from 2000 levels; also, the energy demand per unit area of non-residential building floor space will decrease by 40%. Furthermore, for the walls and roof in each building, installation of solar water heaters and solar power generators will be standardized. In particular, most of low rise housing will become zero carbon residences through the combination of high insulation, passive design, and solar energy use.
Implementation Barriers and Strategic Steps
Standardization PeriodCurrently, at the time of purchasing or contract leasing of residences and buildings, since there is no requirement in general for the presentation of information regarding environmental efficiency, this has not been an item of importance. Also, even today, although it is possible to evaluate the environmental efficiency of residences and buildings, the number of people capable of performing these complex calculations have not been sufficient, hindering its widespread practice. Accordingly, the proposed strategy promotes the establishment of simplified evaluation method for building efficiency according to use in consultation with existing building evaluation methods (CASBEE, etc.) and evaluation methods implemented in Europe and other countries. At the same time, it continues to make progress on nurturing practitioners for the diagnosis of energy-saving efficiency and CO2 reduction efficiency. Furthermore, lectures for craftsmen on building technology will be established in universities and other educational institutions, and by organizing in each region training classes and events intended for construction workers, foundations will be created for passing on the knowledge of energy-efficient building technologies and designs.
Household Finance-friendly Environmental EfficiencyFor newly built or renovated buildings, reduction and exemption scheme of real estate tax and loan interest rates in response to certification results of household environmental efficiency (CO2 emissions and energy consumption) becomes available. The scheme provides incentives for purchasing of residences with high environmental efficiency. For existing residences, low cost environmental efficiency consulting services are provided. The services offer advices on the structural alteration of the building in order to enhance environmental efficiency and act as an intermediary for alteration expense discount programs and favorable loan interest rates. As such, a framework system for the entire society to place a high value on the level of environmental efficiency of residences is in place. Therefore, even citizens with low environmental awareness choose residences with superior environmental efficiency.
Nurturing of Worker Skills; Information TransmissionDesigners and architects who are highly skilled in bonding architectural designs that make use of local and regional climate and the use of leading edge equipment are nurtured in each area; their know-how will be handed over to the next generation. Moreover, long-life buildings such as “200-year homes” have become widespread, limiting unnecessary consumption of resources and energy.
Environmental Efficiency Labeling Introduction PeriodA labeling system for residences and buildings will be commenced based on the newly-developed evaluation methods. Long-term energy-saving target values (upward in incremental steps) will be set for each type of building usage. Certification and registration of labeling will be mandatory at the time of purchase for newly-built residences, at the time of renovation for existing buildings, and at certain intervals for leased and business buildings. Those failing to meet the lowest-rank standard will receive guidance to attain the acceptable standard values through the introduction of high-efficiency equipment, solar power generator, solar thermal equipment and so forth. In addition to the annual energy consumption of the average household and CO2 emissions, the environmental efficiency labels will include the economic figures for the buildings such as the average annual energy cost, enabling comparisons of initial investments and running costs. Furthermore, through combination of tax breaks and low interest financing loans that correspond to the environmental efficiency label, incentives will be provided to owners and users of buildings to select residences or buildings on a long-term basis.
低炭素英文.indd 44 08.6.20 17:32:33
44

Contribution of Building Owners
Selection of residential buildings with high environmental efficiency. Commission of low-carbon design to architects and construction companies.
Contribution of Architects, etc.
Development of low-carbon architectural design methods. Investing for technology development in insulation technologies, etc. Sustenance of regional worker skills.
20101990 2000 2020 2030 2040 2050
Dissemination of diagnosis practitioners for energy-savingand CO2 reduction efficiencies
Establishment of simplified evaluation method for environmentalefficiency of residences and buildings
Organizing training classes and events for passing on knowledgeof architectural technologies
Introduction and expansion of residence and building labelingsystem for environmental efficiency (new building, renovation,mandatory indication upon leasing)
Implementation and expansion of tax breaks and low interestloan financing based on the environmental efficiency label
Solar and wind utilizationdesign
Finance-friendly environmental efficiency
Nurturing ofworker skills &information transmission
Complex energy-saving performancemetrics, highcalculation costs,insufficientpersonnel
Establishment and review of long-term energy-savingstandard targets for buildings
Environmental Efficiency Labeling Introduction PeriodStandardization Period
Insufficientincentives forchoosing energy-saving residencesand buildings
FutureObjectives
BarriersResidential household energy demand:-40% (from FY2000 level)Building floor area energy demand:-40% (from FY2000 level)
右頁別�ターン.indd 45 08.6.20 19:17:18
45

2Anytime, Anywhere Appropriate Appliances
Future Objectives
Dissemination of Energy-saving and Control TechnologiesAs a result of technological competition for energy saving on home appliances and businesse quipment, the energy efficiency of all equipments is greatly improved, enabling efficient use of energy with minimal waste. Also, practical use of information communication technology (ICT) has made it possible for autonomous operation and control of equipments to automatically suspend the operation in spaces and periods of time when people are not present.
Implementation Barriers and Strategic Steps
System Revision PeriodThe top-runner system has been a system with great results. Based on this experience, the scope for its application will be expanded with the focus on business affairs. Moreover, the evaluation method for the top-runner standard values will be reviewed so as to appropriately evaluate the energy-saving efficiency attained by autonomous control of air-conditioning and lighting equipments.
Service Consumption LifestyleAir-conditioning equipment and hot water heaters are leased rather than sold, with a charging system in response to the volume of usage. The charging system for electricity and gas is such that the leasing companies are charged, causing them to make efforts for reduction of energy costs by improving the efficiency of equipments through continual equipment repairs and exchange of parts as well as updating to the latest high-efficiency equipments. Furthermore, more effective use of resources is performed as post-use equipments are sent back to the leasing companies to make the collection process of unnecessary equipment easy.
Leading the worldJapan has the highest global technological levels, and this advancement elevates the appeal of the country throughout the world. These technologies are exported throughout the world, thus besides supporting Japan’s economy they contribute to the creation of a low-carbon society.
Business Model Conversion PeriodUnder the revised top-runner system, efficiency improvement of each equipment item will be promoted. Simultaneously, in corporation with industry organizations, a third-party system will be established to evaluate the contribution level of each company for equipment efficiency, energy savings and CO2 emission reduction, publicly announcing and recognizing those companies with superior contribution in each year. Moreover, strategic initiatives will be taken to make Japanese technologies and evaluation techniques into international standards. A shift from the retail style to the leasing business style will be encouraged by establishing lowest recovery rates and by incrementally tightening the standards. Furthermore, for leasing companies, supportive measures will be in place, including provision of incentives such as reduction of fixed property tax for the top-runner equipments and CO2 emission reduction equipments (solar power generators, solar water heaters, etc.) that they own.
低炭素英文.indd 46 08.6.20 17:32:36
46

Contribution of Product Users
Selection of equipment high in energy savings and low in CO2 emission.
Contribution of Companies (manufacturers)
Positive performance of R&D on energy savings products. Appeals for environmental efficiency of their products.
20101990 2000 2020 2030 2040 2050
Broadening of targeted products to be regulated by Top-Runner system
Reviewing of evaluation method for top-runner standard values
Introduction of incentive schemes for companies
Supportive measures for leasing industry (reduction of fixed property tax, etc.)
Introduction of revised top-runner system
Dissemination ofenergy-saving &control tech-nologies
Serviceconsumptionlifestyle
Leading the world
Review of top-runner system (scope enlargement, system review, establishment of recovery rate)
FutureObjectives
Barriers
Insufficientframework forappropriateevaluation ofenergy-savingcontrol technologies,etc.
Establishment of a third-party institution to evaluatecontributions of companies in energy savings and CO2 reduction
System Expansion Period
Business Model Conversion Period
Air-conditioner COP : 5~8High efficiency illumination : 200lm/WHeat pump water heater COP : 6.3, etc.
Existence ofequipments notcovered by top-runnersystem
Development of top-runner and low CO2
equipments, fasterdiffusion
低炭素英文.indd 47 08.6.20 17:32:38
47

3Promoting Seasonal Local Food
Future Objectives
Raising of Low-Carbon Agriculture by ConsumersAt the time of selecting foodstuffs in supermarkets and restaurants, the advertising of health related information and CO2 emissions will increase the popularity of low-carbon agricultural produce. Specifically, consumers prefer seasonal produce and other vegetables grown using solar thermal or biomass even if they were grown in greenhouses, thus farmers make various innovations to ensure lower carbon emissions. Also, supermarkets and other stores support their efforts to promote low-carbon produce by introducing eco-points and similar other incentives.
Implementation Barriers and Strategic Steps
Verification PeriodFarmers who desire certification in low-carbon agriculture will be recruited to participate in verification tests for agricultural produce labeling. In collaboration with participants in the verification tests, discussions will be held to improve the policy towards low-carbon agriculture, thereby accumulating the experience and knowledge of low-carbon agriculture. Simultaneously, low-carbon agriculture advisors with adequate experience in the field will be nurtured.
Low-Carbonization of Production ProcessWhile production and consumption of produce in season have become more prevalent, there has been a large decrease in greenhouse cultivation which consumes a large amount of energy. Even with its implementation, farmers actively utilize solar thermal, biomass and local small- and medium-sized hydroelectric power generation. As a result, per yield CO2 emissions for vegetables and fruits have declined to less than half the current figures. Moreover, biofuels made from irregular agricultural produce and agricultural waste are used as fuels for agricultural machineries, contributing to the low-carbonization of production process for agricultural produce.
Agricultural Fields and Pastures without Greenhouse Gas EmissionThrough engagement in new agricultural production methods, technological development, breed improvement and so forth, emissions of N2O, CH4, etc. from agricultural fields and pastures have declined greatly.
Diffusion PeriodThe target areas of agricultural produce labeling system and low-carbon agriculture certification system will be expanded to include the whole country. However, in some cases introduction of high-efficiency equipment, solar water heater, biomass boiler, etc. are necessary, thus for these equipments, the municipalities will establish systems for lending (leasing) and giving out subsidies. Also, in order to assure the acceptance of low-carbon agricultural produce by consumers, guarantee of taste and safety will be given to certified produce, in addition to active appeals made both within and outside Japan through government publicity. In addition, systems will be constructed so that certified results can be mutually confirmed with major trading partners of agricultural produce, broadly spreading the knowledge of low-carbon agriculture that Japan has so as to contribute to the realization of a low-carbon society.
Establishment PeriodLow-carbon agriculture will become the standard method because consumers can easily select low-carbon produce, and because producers will have lower running cost with reduced usage of heavy oil and so forth. Thus, various government and municipal subsidies should be gradually reduced to promote independence.
低炭素英文.indd 48 08.6.20 17:32:38
48

Contribution of Consumers
Selection of seasonal food products and low-carbon items based on environmental and safety information of food.
Contribution of Farmers
Seasonal item cultivation. Use of low-carbon energy in greenhouses as much as possible.
20101990 2000 2020 2030 2040 2050
Verification testing of low-carbon agriculture
Nurturing of low-carbon agriculture advisors
Leasing and financial subsidies for agricultural machines and solar thermal equipments
Introduction of international certification system
Government publicity for low-carbon agriculture (safety/taste evaluation, low-carbon agriculture promotion)
Introduction/expansion of low-carbon agriculture certifi-cation system
Raising of low-carbon agri-culture by consumers
Low-carboni-zation of productionprocess
Fields & pastureswithout greenhouse gas emission
FutureObjectives
Barriers
Cost of equipmentintroduction is high.Lack of appropriateequipment
Diffusion Period Establishment Period
Insufficientknowledge andexperience of low-carbon agriculture
Demand for andsupply of lowcarbon produceneed to match
VerificationPeriod
CO2 emissions per yield of vegetablesand fruits : Less than half
低炭素英文.indd 49 08.6.20 17:32:39
49

4Sustainable Building Materials
Future Objectives
Life Surrounded by TreesIn addition to low-rise residences, the popularity of wooden residence has spread widely to medium-rise residences as well. Building construction using lumber with high strength and fire resistance (such as large-section laminated lumber) has become popular even for schools, hospitals, other public buildings, low-rise large-scale stores and factories, with the percentage of wooden buildings exceeding 70%. Also, the use of wood for furniture and fittings has greatly increased, and wood is used for various applications including civil engineering, architectural foundations, guardrails and sound-proof walls.
Implementation Barriers and Strategic Steps
Competitiveness Recovery PeriodIn order to achieve maximum utilization of usable domestic lumber, existing standards and restrictions regarding wood products will be reviewed. For current forestry, from the profit perspective, the incentives for forest owners are extremely insufficient to implement thinning and clear cutting. One of the factors is that the unit of forestry business is too small to achieve efficient management of forests. Accordingly, low-cost log production will be realized through intensification of forest management (collaborative business implementation) and subsidies to promote mechanization of log production. At the same time, political measures will be taken to achieve expansion of forestry management units by promoting small-scale forest owners to either sell or commission their forests for a long term to forest entities (such as forest associations) which can properly manage their forests. Furthermore, the remaining materials in the forest are currently not fully utilized at all because of their high supply costs, high moisture content and irregular shapes. In order to increase their utilization, the government will implement supportive measures for the development and introduction of necessary equipments for collection of the remaining materials as well as for the transportation of the materials.
Revival of Forestry BusinessDue to the introduction of service road networks and usage of advanced machineries, labor productivity of forestry has increased by 5 times the 2000 average level. Also, due to the establishment of effective application technology for wood biomass, over 9,000,000 BDT (Bone Dry Tonne) of remaining materials in the forest are used annually. Log production volume has expanded to 50,000,000m3, and timber self sufficiency has surpassed 65% to allow for increasing exportation of wood overseas (in 2006, the domestic log production volume was 17,480,000 m3, with the timber self sufficiency of 20.3%, according to “2006 Chart of Lumber Demand and Supply” by the Forestry Agency). However, clear cutting is limited to old growth forests with declining growth rate. Together with proper reforestation done using low-cost afforestation technologies, sustainable forestry business is established.
Utilization Expansion PeriodUtilization of wood will be promoted by thorough procurement of natural resources for construction of public infrastructures. In addition, for the use of wood and their material cycles, property tax reduction measures and environmental taxes will be introduced to promote wood utilization further. On the other hand, for prevention of profit-centered unregulated logging due to the increase in demand for wood, forestry guidelines will be created, by which third-party organizations are designated to certify business entities that implement sustainable forest management and pro-environmental logging. Simultaneously, systems will be constructed so that certified results can be mutually confirmed with major trading partners of lumber, suppressing illegal logging and other activities overseas. Furthermore, development of new machineries will be necessary due to the increase in tree age and size, and consequently, it will be necessary to construct large-scale service road networks on which large trucks can drive.
Utilization Establishment PeriodVarious kinds of utilization have been established for Japanese cedar wood, and the percentages of wood utilization for buildings and furniture approach 70%. Together with this, the competitiveness of eco-conscious wood products reach a global level. From then on, support will be given to the forestry industry so that new channels for sale of national lumber can be cultivated abroad. By this time, demand for biomass resources will outgrow supply of remaining materials from the forests, thus it will be necessary to commence production of biomass resources with short harvest intervals.
低炭素英文.indd 50 08.6.20 17:32:39
50

Contribution of Forest Owner
Proper forest management, or sales/commissioning of their forests to a forest association.
Contribution of Forest Industry
Disclosure of CO2 emissions of lumber to consumers.Establishment of construction technologies for medium-rise and large-scale wooden buildings.
20101990 2000 2020 2030 2040 2050
Review of standards and regulations
Preferential measures for wood products and recycling (property tax reduction, environmental tax)
Thorough green procurement
Intensive forest management and promotion of agglomeration
Subsidies for forestry machineries and collection system for remaining materials
Certification system for eco-conscious forest management (guideline, third-party certifying entity)
Introduction of international certification system
Expansion of service road networks
Cultivation of overseas sales channels for domestic lumber
Life surroundedby trees
Revival offorestry business
FutureObjectives
Barriers
Insufficientincentives for woodutilization
Utilization Expansion Period Utilization Establishment Period
Insufficient profitdue to lowmanagementefficiency of forestry
Risk of causingunregulated profit-centered forestmanagement
Forestry labor productivity : x5 (from FY2000 level)Forestry production volume : 50,000,000m3 (timberself sufficiency: 65%)Percentage of wood utilization for construction/furniture : 70%
CompetitivenessRecovery Period
Regulatory barriers foruse of domestic lumber for buildings
低炭素英文.indd 51 08.6.20 17:32:41
51

5Environmentally Enlightened Business and Industry
Future Objectives
Minimum 40% Efficiency ImprovementThrough continual efforts of enterprises and social systems supporting them, the energy consumption per actual production volume in each industry has declined by a minimum of 40% in comparison to 2000 (equivalent to an annual reduction rate of 1% in each section).
Implementation Barriers and Strategic Steps
System Establishment PeriodIn order to objectively apprehend companies’ efforts toward low-carbon targets, a system for publicizing the CO2 emissions of each company and office in a unified (standardized) format will be established. Moreover, another system for publicizing these companies’ efforts toward a sustainable society will be in place. To provide the companies with a third party certification for their emissions and efforts, a system for authorized CO2 accounting will be introduced. On the other hand, the policy for implementing eco-conscious “socially-responsible investment behavior” will be clearly addressed to financial institutions. Those achieving a certain rate of loan assets for low-carbon businesses will be announced, thereby providing support for low-carbon businesses. Moreover, a system to concentrate money on companies with low-carbon management will be constructed by introducing preferential measures, such as tax reductions, for low-carbon investments and financial products.
Demand Pull by “Low-Carbon” Value PermeationConsumers have come to prefer low-carbon products and services, and accordingly, companies are increasing their development investment in low-carbonization of their manufacturing technologies and services. In addition, since monetary investment on companies actively implementing low-carbonization is on the increase, low-carbonization of company activities has become an important element from the viewpoint of corporate competitiveness. Consequently, a number of revolutionary technologies have been put into practice, such as iron-making technologies that use hydrogen as the reducing agent.
Introduction PeriodBased on the CO2 emission data of companies from “disclosure” schemes, systems for supporting companies that conduct low-carbon management will be introduced. To be specific, a carbon tax will be imposed on the emission of CO2 caused by company activities. On the other hand, incentives (large scale tax reduction measures and technological development support for attaining CO2 reduction targets) will be given to companies which have achieved the CO2 reduction targets regarding which they had made an agreement with the government. CO2 reduction targets are evaluated by third-party organizations, and the incentives including tax reduction measures and technology development subsidies will be differentiated depending on the degree of achievement. Also, in parallel with the introduction of environmental taxes, a system for emissions trading will be introduced so as to create a systems framework that can minimize the companies’ CO2 reduction cost and the risk of not achieving their targets. Regarding the rate of the carbon tax, although it will be gradually increased, the long-term changes in the tax rate will be made public so that companies can make long-term management plans and technology development investment plans while taking future tax rates into account. Furthermore, for companies with particularly advanced activities, large scale public acknowledgement such as “Low-Carbon Organization of the Year” will be given. Through these measures, companies will be encouraged to convert to low-carbon production technologies and services.
Ensuring CompetitivenessRegarding some industries easily exposed to international competition, the introduction of carbon tax and such measures could lower their international competitiveness. Also, the burdens placed on manufacturing companies could lead to an exodus of manufacturing industry to overseas. Accordingly, through international negotiation, government will work with each country in the world to adopt an international framework (sectoral approach, border tax, etc.) in order to prevent significant disadvantages to some industries. Although flexible tax measures will be adopted until a sufficient scheme is constructed, these special tax measures will be repealed by 2020.
低炭素英文.indd 52 08.6.20 17:32:41
52

Contribution of Consumers
Active utilization of environmental information disclosed by companies in product selection. Support companies implementing low-carbon business (investment/product selection).
Contribution of companies
Perform thorough energy savings/CO2 reduction in company activities. Procure energy and material that are as low-carbon emission as possible.
20101990 2000 2020 2030 2040 2050
Establishment of CO2 emission information disclosure systemfor each company and office
Development of authorized CO2 accounting system
Tax reduction for investments in low-carbon business and financial products
Introduction of carbon tax based on emission reductiontarget and emissions trading system
Introduction/diffusion of public announcement system (Low-Carbon Organization of the Year)
Adoption of flexible tax measures
Negotiation for introduction of international scheme
Minimum 40%efficiencyimprovement
Demandpull by “low-carbon” valuepermeation
FutureObjectives
Barriers
Introduction Period
Ensuring Competitiveness
Amount of consumption per actualproduction : -40% (from FY2000 level)
System EstablishmentPeriod
Difficult to comparelevels ofcontribution for alow-carbon societyamong companies
Insufficientincentives forimplementation oflow-carbonmanagement
Possible loss ofinternationalcompetitivenessdue to carbon taxin some industries
Announcement of long-term tax rate changes, establish-ment and review of reduction targets
低炭素英文.indd 53 08.6.20 17:32:43
53

6 Swift and Smooth Logistics
Future Objectives
Thorough Removal of Waste by SCMThe idea and practice of “supply chain management” are widely accepted to optimize the overall business processes, where the flow of commodities from source of supply to final demand (consumption) including procurement of materials and parts, inbound logistics, production, outbound logistics and sales is captured as a “supply chain”. In SCM, information is shared and managed jointly among companies participating in supply chains using advanced information communication technology. Through this, supply and demand are synchronized to promote reduction of inventory of goods and goods-in-process and swift flow of materials. As a result, production of unnecessary items are limited, thereby making industries more efficient.
Implementation Barriers and Strategic Steps
SCM Promotion PeriodFor realization of overall optimization of business process following the introduction of SCM, it is necessary for all related companies to share necessary information. However, in some cases, due the cost of system introduction and resistance against the presentation of internal company information to other companies, only a limited number of companies participate to result in insufficient optimization. Therefore, cases of SCM will be evaluated in an investment-versus-result format, and superior cases will be announced. At the same time, the introduction of systems for sharing SCM on a network will be supported to decentralize and lower the investment expenses in order to enable participation of small- and medium-sized businesses. Furthermore, by implementing strategic approaches for rending the Japan-borne intra-and inter-business standards of electronic information into international standards, system cost will be reduced, further promoting their diffusion.
Enhancement of Infrastructure for Railroad and Marine Logistics and Realization of Seamless Logistics NetworksLarge-scale cargo logistic networks by ships and railroad between major centers are fully developed, and systems and infrastructures are constructed to enable smooth cargo transfer between different transportation modes at major unloading sites. As a result, long-distance logistics networks with low-carbon emissions and high efficiency are in place.
Local Logistics by High-efficiency VehiclesLocal logistics are based on motorized and hybrid cargo vehicles. Within central areas of urban cities, trolleys are also actively employed for collection and distribution of goods.
Infrastructure Preparation PeriodVarious systems will be introduced to remove barriers among multiple transportation means, such as development and unification of new railroad containers with identical dimensions as the international standard (ship containers). At the same time, public subsidies will be given for construction of necessary infrastructures such as expansion of freight railways and terminals, purchasing of carrier trucks and expansion of container yard for empty containers at ports. Also, various tax reductions will be performed on railroad and shipping real estate tax among others. These measures will encourage infrastructure construction of arterial networks for cargos.
Low-Carbon Logistics Realization PeriodBy broadening the scope of target for Top-Runner Law to include not only all automobile vehicles but also other transportation modes, the efficiency of all logistics transport modes will be continuously improved. Moreover, in order to enhance the competitiveness of low-carbon logistic modes, imposed taxation will be proportionate to the percentage of carbon content of the transportation energy used. As well, by supporting diffusion of a real-time browsing system for vacancy conditions, CO2 emissions, cost, lead-time, etc., of each available logistics mode, and by promoting widespread use of labeling systems such as Eco Rail Mark, “visualization” of greenhouse gas emissions caused by cargo transport will be advanced further, thereby providing cargo owners with an environment in which they can easily obtain information for selecting an appropriate logistics modes and companies.
低炭素英文.indd 54 08.6.20 17:32:43
54

Contribution of Manufacturing and Logistics Industries
Active introduction of SCM to strengthen partnerships with other related companies. Presentation of all necessary information for overall optimization.
Contribution of Cargo Owners
Selection of transportation means with as low CO2 emissions as possible.
20101990 2000 2020 2030 2040 2050
Evaluation of SCM investment versus result, announcement of superior cases
Support for lowering the SCM introduction expenses
Promotion of standardization of Japanese electronic informationtransfer system
Unification of the standards for containers
Support for development of infrastructures
Property tax reductions on railroad and ship
Carbon tax imposed on transportation energy
Promotion of awareness for emissions of each logisticstransportation mode
Broadening the coverage of top-runner system and low- carbonization of logistics mode
Thorough removalof waste by SCM
Infrastructureenhancementfor railroad &marine logistics
Realization ofseamless logisticsnetworks
Local logisticsby high-efficiencyvehicles
FutureObjectives
Barriers
Low-Carbon Logistics Realization Period
Disclosure of CO2 emissions for all logistics companiesCompletion of infrastructure construction for cargo arterial networks
Infrastructure PreparationSCM Promotion Period
A limited number ofcompaniesparticipate in SCM
Insufficientinfrastructure forcargotransportation
Lack of incentivesfor realizing low- carbon logistics
低炭素英文.indd 55 08.6.20 17:32:45
55

7Pedestrian Friendly City Design
Future Objectives
Public Transport Linking Central Urban AreasFacilities with high frequency of usage are located within central urban areas, while others with low frequency of usage are located somewhat away from those areas, assuring convenient city structures in each region. In addition, the central areas of all regions are connected with each other by public transportation networks, allowing for convenient use of public transportation.
Implementation Barriers and Strategic Steps
Planning PeriodIn order to make citizens understand the public nature of land and to carry out city planning that is based on a medium to long term perspective, in cooperation with the citizens, the government needs to establish a plan for land use and transportation with a clear statement about the shift towards concentrated land use appropriate for a low-carbon society and declining population. In addition, through establishing it as the master plan for city planning and as a comprehensive plan, improvements on land use and transportation infrastructure, that reflect low-carbon perspective, will be made. Moreover, in order to promote the widespread use of motor driven cars, researches will be performed to develop energy storage devices (high-efficiency secondary batteries, hydrogen storage devices, etc.) and lighter car bodies as well as to improve the efficiency of public transportation.
Safe Walking AreasAreas open to pedestrians and cyclists throughout the day are established in many sections of cities and suburbs. Since through traffic of cars and trucks are prohibited within these areas, persons in wheelchair and “senior car” (electric assistant scooter) can safely and comfortably travel.
Lightweight Electric Passenger VehiclesAutomobile vehicles are primarily driven in areas with relatively low-density land use, being used in combination with public transportation, park-and-ride, shared-taxi, carsharing and other approaches. Moreover, the standard types of vehicles are motor driven cars with batteries or fuel cells. The energy storage devices (secondary batteries, hydrogen storage devices) for these electric vehicles are highly advanced. This, together with the lightening of car bodies realized by the development of high-tensile steel, has greatly improved the operational energy efficiency of these cars. Many of the battery-car users perform quick charging at home, but there are some users who frequently use an exchange service for pre-charged car batteries for convenience.
City Structure Reform PeriodSpecial tax reduction measures will be introduced to central urban areas to induce effective land use and to accumulate facilities with high frequency of usage in areas within close proximity of public transportation. In addition, by adopting the vertical separation method that separates construction and maintenance of infrastructure from its operation, financial support will be distributed to many regional cities to promote introduction of commercial Light Rail Transit (LRT) and so forth. Moreover, for transportation by car, incentives for low-carbonization will be given to car owners in various aspects including the introduction of the green tax system, that promotes selection of vehicles with low environmental load throughout their lifecycle, as well as the establishment of priority lanes and parking spaces for these cars. For widely popular motor driven cars, strategies will be formed to ensure the supply of necessary amount of rare metals for secondary batteries, fuel cells and motors, while simultaneously conducting researches for alternative materials.
Permeation PeriodIn some areas, the possibility for realizing a low-carbon community will become clear, and its charm will attract people to move into the areas when they need to rebuild their houses, thereby forming concentrated residential areas. Regarding means of personal transportation, reduction in size and weight of the devices will improve further, expanding the market shares of such intra-urban transportation means as electric cars, electric wheelchairs, electric assisted bicycles and i-REAL.
低炭素英文.indd 56 08.6.20 17:32:45
56

Contribution of Citizens
Participation in the planning and execution of a medium to long term plans for land use and transportation that are appropriate for a low-carbon society.
Contribution of Retailers
Active participation in reforming and process of shifting to central urban areas.
20101990 2000 2020 2030 2040 2050
Creation and implementation of a master plan for low-carbon cityplanning by municipalities and citizens
Introduction of tax systems to promote the effective use of central urban areas
Introduction of the vertical separation method (infrastructureconstruction by the government and assistance on its cost)
R&D support and investment for development of high-efficiency secondary batteries and lighter vehicle bodies
Resources supply assurance, development ofrecycling technologies
Green tax system to promote diffusion of vehicles with low environmental load, strengthening of fuel regulation
Introduction and expansion of priority lanes and parking lots for vehicles with low environmental load
Public transportlinking centralurban areas
Safe walking areas
Lightweightelectric passengervehicles
FutureObjectives
Barriers
Rare metal stock assessment
City StructureReform Period
Permeation Period
Use of public transportation system : +10%Foot and other means : +10%Average distance of travel by car : -10%
Planning Period
Lack of considerationfor low-carbonizationin city planning
Costs including landusage fees arecheaper in suburbs
Economic aspectsof publictransportation
Various issuesregarding motordriven cars
Lack ofcompetitivenessagainst gasoline-powered cars
低炭素英文.indd 57 08.6.20 17:32:47
57

8 Low-Carbon Electricity
Future Objectives
Low Loss and Low Environmental ImpactIn both coal-fired and natural gas power generations, combined cycles of ultra-supercritical turbines have become standard, achieving efficiency of over 55% in all power plants. There are also large-scale, advanced power plants that have achieved more than 60% efficiency. In addition, carbon capture and storage (CCS) equipments are installed to prevent as much CO2 discharge into the outside air as possible. As such, the efficient systems for converting primary energy into secondary energy have become widely diffused.
Implementation Barriers and Strategic Steps
Shared Future Vision PeriodThrough partnerships among the government, electric companies and consumers, a system for having discussion on and sharing perspectives about the appropriate power supply over a medium-to-long term will be constructed. Based on these discussions, industries, academic sector, the government and the civilian sector will, in a collaboration with each other, promote the development of various technologies (ultra-supercritical turbines, ultra-high voltage electricity supply technology, CCS with low loss, technologies for management of electricity quality and so forth) that are essential for realizing the future objectives. Simultaneously, supply of low-carbon electricity will be prescribed by some political measures such as guidelines and incentives to actors other than the pre-existing electric companies for entry and cooperation. Regarding nuclear power generation, the operation and maintenance practice in cooperation with safety-assurance organizations and under the watch of appropriate information disclosure system will be strengthened. Moreover, efforts will be made to achieve proper awareness of nuclear power generation among the general public through communication with non-specialists. Furthermore, concerning the burden share of maintenance fees for quality electricity caused by introduction of renewable energy, the fee charging system for electricity will be reviewed thoroughly so as to pass on the maintenance fees to consumers while minimizing its influence on those with low income.
Grid network for Enhanced Utilization of Renewable EnergyTogether with large-scale solar power generators and wind power generators, output power leveling equipments such as batteries and hydrogen generators are installed to control their influences on the power system to a certain degree.
Appropriate Utilization of Nuclear EnergyNuclear power plants are established based on agreements made between the government, electric companies and the citizens while taking into account the likely changes in the demand for and supply of electricity as well as development of other power-generating technologies. With mandatory requirement for total disclosure of safety-related information, appropriate waste management is carried out. Taking into account the perspective for the prevention of international nuclear proliferation, maintenance and operation are performed at the appropriate levels.
Energy Transport Network without LossFor the central transmission grid within a jurisdiction area, ultra-high voltage transmission grid capable of transmitting 1 million volts is laid out. For transmission lines among electric power companies and between nuclear power generation facilities and places of high demand, extra-high voltage direct-current transmission is employed to reduce as much transmission loss as possible.
Low-Carbon Power Needs Expansion PeriodTo enable individuals to directly select an electric company, revisions will be made in the regulatory regime. At the same time, taxation systems related to electricity will be modified to become pro-environment. Through this, needs for low-carbon electricity among consumers will increase, resulting in added values of low-carbon power plants and transmission loss reduction. Technological developments will take place to realize practical applications of the CCS technology, ultra-high efficiency power generating technology and ultra-high voltage transmission technology roughly during this period. Based on long term guidelines, at the timing of upgrading infrastructure equipments of the power systems, electric companies will make progress on conversion to transmission lines with low loss, introduction of long distance direct current power lines as well as on capacity expansion of the transmission systems, thereby creating electricity distribution networks that are with low energy loss and can readily accept renewable energies.
低炭素英文.indd 58 08.6.20 17:32:47
58

Contribution of Power Companies
Stable nuclear power management and thorough information disclosure regarding the upper limit of renewable energy introduction.
Contribution of Power Consumers
Selection of low-carbon electricity.
Low-Carbon Power Supply PeriodAt the same time as promoting the diffusion of various highly efficient technologies that have been developed and verified until now, CO2 reduction technologies will be introduced to all of the newly-built power plants.
20101990 2000 2020 2030 2040 2050
Fundamental review of charging system for power andcost allocation among different consumer groups
Development and safety evaluation of CCS technology
Promotion of CCS installation to thermal power generation stations
Technology development for ultra-high voltage transmission andextra-efficient power generation
Staged high-voltage transmission network
Expansion of distribution capacity
Low energy loss &low environmentalimpact
Grid network for utilization ofrenewable energy
AppropriateUtilization ofnuclear energy
Energy transportnetworkwithout loss
FutureObjectives
Barriers
Agreement on the necessity of low-carbon power supply (prescribed by political measures)
Introduction of system for selection of electric companyby individuals
Low-Carbon PowerNeeds ExpansionPeriod
Realization of zero-emissionpower generation
Shared FuturePeriod
Lack of mechanismto pass on thecosts to create andintroduce high-efficiencytechnologies
Verification ofstorage stabilityand safety throughCO2 storage test
Loss caused byexisting powertransmissionnetworks
Influence on qualityof power systemsdue to installedrenewable energyfacilities
Low-Carbon Power Supply Period
低炭素英文.indd 59 08.6.20 17:32:49
59
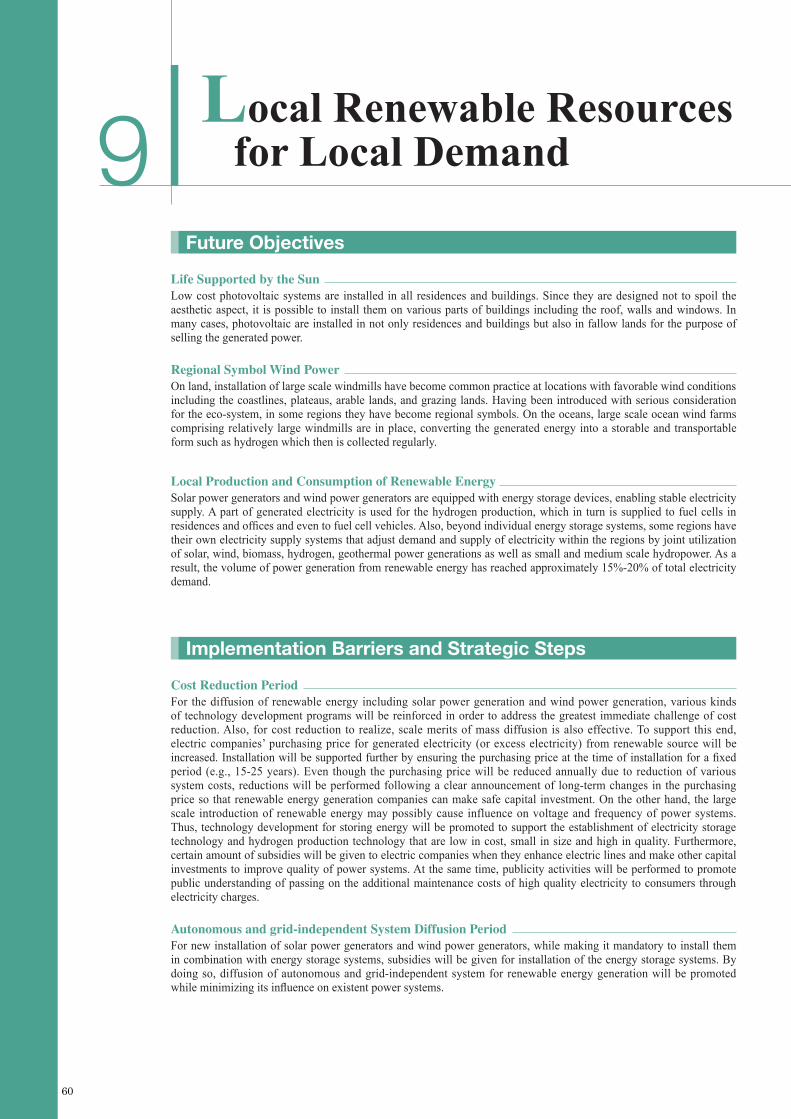
9Local Renewable Resources for Local Demand
Future Objectives
Life Supported by the SunLow cost photovoltaic systems are installed in all residences and buildings. Since they are designed not to spoil the aesthetic aspect, it is possible to install them on various parts of buildings including the roof, walls and windows. In many cases, photovoltaic are installed in not only residences and buildings but also in fallow lands for the purpose of selling the generated power.
Implementation Barriers and Strategic Steps
Cost Reduction PeriodFor the diffusion of renewable energy including solar power generation and wind power generation, various kinds of technology development programs will be reinforced in order to address the greatest immediate challenge of cost reduction. Also, for cost reduction to realize, scale merits of mass diffusion is also effective. To support this end, electric companies’ purchasing price for generated electricity (or excess electricity) from renewable source will be increased. Installation will be supported further by ensuring the purchasing price at the time of installation for a fixed period (e.g., 15-25 years). Even though the purchasing price will be reduced annually due to reduction of various system costs, reductions will be performed following a clear announcement of long-term changes in the purchasing price so that renewable energy generation companies can make safe capital investment. On the other hand, the large scale introduction of renewable energy may possibly cause influence on voltage and frequency of power systems. Thus, technology development for storing energy will be promoted to support the establishment of electricity storage technology and hydrogen production technology that are low in cost, small in size and high in quality. Furthermore, certain amount of subsidies will be given to electric companies when they enhance electric lines and make other capital investments to improve quality of power systems. At the same time, publicity activities will be performed to promote public understanding of passing on the additional maintenance costs of high quality electricity to consumers through electricity charges.
Regional Symbol Wind PowerOn land, installation of large scale windmills have become common practice at locations with favorable wind conditions including the coastlines, plateaus, arable lands, and grazing lands. Having been introduced with serious consideration for the eco-system, in some regions they have become regional symbols. On the oceans, large scale ocean wind farms comprising relatively large windmills are in place, converting the generated energy into a storable and transportable form such as hydrogen which then is collected regularly.
Local Production and Consumption of Renewable EnergySolar power generators and wind power generators are equipped with energy storage devices, enabling stable electricity supply. A part of generated electricity is used for the hydrogen production, which in turn is supplied to fuel cells in residences and offices and even to fuel cell vehicles. Also, beyond individual energy storage systems, some regions have their own electricity supply systems that adjust demand and supply of electricity within the regions by joint utilization of solar, wind, biomass, hydrogen, geothermal power generations as well as small and medium scale hydropower. As a result, the volume of power generation from renewable energy has reached approximately 15%-20% of total electricity demand.
Autonomous and grid-independent System Diffusion PeriodFor new installation of solar power generators and wind power generators, while making it mandatory to install them in combination with energy storage systems, subsidies will be given for installation of the energy storage systems. By doing so, diffusion of autonomous and grid-independent system for renewable energy generation will be promoted while minimizing its influence on existent power systems.
低炭素英文.indd 60 08.6.20 17:32:49
60

Contribution at Home and Buildings
Active introduction of renewable energy (e.g., solar power generation).
Contribution of Power Companies
Taking into account the possible expansion of renewable energy when enhancing electric power systems.
System Integration PeriodIn addition to the individual energy storage systems equipped onto solar power generators and wind power generators, deliberations will be made as to what the most appropriate combination may be with other distributed power sources and hydrogen energy systems, while taking into account the regional climate as well as local energy demand and supply. By supporting the construction of an appropriate electric power supply network in each region to accommodate local electricity generation, efforts will be made to reduce the overall system cost.
20101990 2000 2020 2030 2040 2050
Strengthening of renewable energy purchasing system
Strengthening of technology development for renewable energy
Introduction of subsidies for infrastructure construction tomaintain quality of power systems
Promotion of public understanding regarding passingon the maintenance costs to electricity charges
Mandatory installation of energy storage system with solar/wind power generators
Subsidies for installation of energy storage system
Technological development of energy storage systems
Support for construction of local electricity network
Life supportedby the sun
Regional symbolwind power
Local production& consumption ofrenewable energy
FutureObjectives
Barriers
AutonomousSystem Diffusion Period
Power generation by renewable energy :15-20% of electricity demand
Cost Reduction Period
Compared to otherelectric sources,the cost of powergeneration is high
Influence on qualityof power systems(voltage/frequency)
The cost of energystorage system,varioustechnological issues
System Integration Period
低炭素英文.indd 61 08.6.20 17:32:51
61

10 Next Generation Fuels
Future Objectives : Hydrogen
Dominance of Low-Carbon HydrogenIn addition to by-product hydrogen generated by industrial processes, hydrogen is produced at reforming plants with CCS and by electrolysis at ocean wind farms. The production methods that do not cause greenhouse gas emissions have become dominant. In addition, the hydrogen produced is transported mainly through pipelines to be used for logistics, power supply adjustment and fuel for fuel cells.
Implementation Barriers and Strategic Steps : Hydrogen
Planning and Verification PeriodWith future hydrogen demand in mind, plans will be made for hydrogen supply and production center allocations, taking into account the regions with high demand so that the necessary infrastructures can be minimized. First, some areas in which the use of hydrogen is relatively easier will be chosen; they need to have pre-existing hydrogen production facilities, such as by-product hydrogen source from some existing plants. Within these limited areas, necessary infrastructures for hydrogen transportation and storage will be constructed, and supply of hydrogen will be commenced. As one of the supply destinations, fuel cell buses will be in operation around these regions. Simultaneously, hydrogen utilization technologies will be improved further to achieve lower cost and higher efficiency. Furthermore, based on the hydrogen supply plan, support will be given to the development of technologies that are necessary from a long-term perspective, including hydrogen production from renewable energy, hydrogen storage and transportation technologies.
Expanded Introduction PeriodAt the same time as expanding the hydrogen-supply areas based on the hydrogen production center allocation plan, support will be given to encourage the connectivity among these areas. For example, public funding will be provided for preparation of infrastructures for arterial hydrogen transport pipelines between a hydrogen production center and large consumption areas. On the other hand, low-carbon hydrogen production will be made dominant by introducing financial incentives such as preferential tax measures according to the emission units of hydrogen produced.
20101990 2000 2020 2030 2040 2050
Establishment of hydrogen center allocation plan and supply plan
Verification tests in certain regions
Support for technology development basedon hydrogen supply plan
Public funding to infrastructure construction for hydrogen supply
Financial incentives such as preferential tax measures
Dominance oflow-carbonhydrogen
FutureObjectivesBarriers
Volume of hydrogen supplied: 100 billion Nm3
Planning and Verification Period
High costs ofhydrogenproduction, storage,transportation,utilization
Expanded Introduction Period
低炭素英文.indd 62 08.6.20 17:32:52
62

Future Objectives : Biofuel
Stable Supply of BiofuelsBiomass production and utilization plans suitable for each region are created, and food, lumber, animal feed and so forth are produced according to the plans. At the same time, the waste-type biomass generated within each region is also utilized to the full extent. Although shortfall within Japan is covered by importation from overseas, an international agreement on the management of biomass resources is concluded to ensure pro-environmental production method and low environmental load. In cases where liquid fuels are desired, as in fuels for logistics, liquid fuels derived from biomass are used on a priority basis. Moreover, the market share of bioenergy for heat and electricity is on the increase.
Implementation Barriers and Strategic Steps : Biofuel
Utilization Expansion, Cost Reduction PeriodAlthough expansion of biomass utilization is sought in many regions, the high costs of collecting and transporting the materials and energy conversion make it difficult. To add to that, the existing restrictions hinder the utilization of low quality bioenergy and energy production by mixed processing of biomass. Along with lowering of the costs and relaxing of the regulations, it is necessary to assure that energy is supplied in a sustainable way by the use of Life Cycle Assessment (LCA) methods and so forth.
Expanded Introduction PeriodThe synergy between a region’s agricultural and forestry plan and energy demand/supply plan will be strengthened. Through zoning with consideration for land application, the self-sufficiency for food, lumber and energy of the region will be increased, thereby introducing an additional value of local sustainability to the products. Development and cost reduction of biomass-conversion technologies should be performed on a perspective that includes biomass utilization in not only Japan but entire Asia. Although shortfall within Japan is covered by importation from overseas, support will be given for construction of an international framework to properly evaluate the environmental load during the production processes.
20101990 2000 2020 2030 2040 2050
Establishment of regional plans for promotion of biomass utilization
Relaxation of regulations and cost reduction in certain regions
Stronger synergy between plans for agriculture/forestry and regional energy, proper zoning
Support for construction of international framework
Development and cost reduction of biomass conversion technology with Asia-wide perspective
Stable supplyof biofuels
FutureObjectivesBarriers
Percentage of biomass supply in primary energy : 10%
Utilization Expansion, Cost Reduction Period
A standstillbioenergy usewithin Japan
Unstableimportation ofbioenergy
Expanded Introduction Period
低炭素英文.indd 63 08.6.20 17:32:53
63

Labeling to Encourage Smart and Rational Choices
Future Objectives
Visualization of Energy-saving EfficiencyFor residences and offices, digital meters (smart meters) for electricity and gas usage are introduced widely, enabling accurate and real-time calculation of energy consumption and CO2 emissions for usage of each device. In addition, all newly-built houses and offices come with LCS navigation system. Besides performing automatic control of air-conditioning and lighting equipments, this system displays obtained information in a user-friendly way, providing advices for enhanced energy savings and CO2 reduction in accordance with the activity pattern and lifestyle of each consumer. Many of these systems are provided in combination with various services including functions for assuring security and comfort of the elderly and monitoring functions for security at homes and offices.
Implementation Barriers and Strategic Steps
Foundation Preparation PeriodIn order to achieve widespread installation of smart meters that form the foundation for the LCS navigation system, a clear diffusion target (such as installation to all residences and offices within 5 years, etc.) will be established, followed by publicity campaigns to consumers and financial support for introduction costs to electricity companies. On the other hand, in collaboration with retailers including convenience stores, supermarkets, co-ops and electronic stores, displaying of lifecycle environmental load information (carbon labeling) will be done on those products for which information canbe easily obtained (such as products designed by the retailers). At the same time, manufacturers willing to participate in these systems will be recruited widely to steadily increase the range of products for displaying environmental information, thereby progressing the accumulation of necessary data and know-how for labeling. For the system planning, standards for the calculation method for environmental load and the details of labeling display will be created. Furthermore, a carbon labeling certification system operated by a third party will be in place to ensure that the consumers can compare environmental loads of multiple products with unified indices.
11
Visualization of Environmental Information of ProductsAt the time of purchasing a product, consumers can retrieve easy-to-read information regarding each product’s environmental efficiency (such as lifecycle environmental load) and various merits of selecting the product by scanning its tag using a mobile terminal. Moreover, for electric appliances, their operational conditions are sent to their manufacturers via a network so that the owners can receive appropriate directions (advices for repairs, upgrading, disposal methods, etc.) from the manufacturers.
System Introduction and Integration PeriodFor development of the LCS navigation system that integrates and displays various information, it is crucial to thoroughly comprehend the needs of the users from the developmental stage. Thus, potential system users will be selected for hearing sessions to grasp their needs. Based on these needs, discussion sessions for a number of developers, experts and users will be held. Based on the specifications determined in these sessions, system developers will be recruited openly. While giving incentives for developing the system to the system developers by grasping the needs of users and ensuring a certain level of demand, efforts will be made to pursue the realization of system designs with desired functions, price, and entertainment features. Furthermore, for home electronics and office equipments, manufacturers will be obligated to equip their products with an information communication function to transmit environmental information, and the unification of systems will be promoted so that information of all equipments will be available on the LCS navigation system.
Incentive Introduction PeriodThrough utilization of the carbon labeling system and LCS navigation system, the government and companies will introduce incentive systems for reduction of environmental load of individuals and businesses. The resulting enhancement in environmental awareness among individuals and businesses will then permeate low-carbon lifestyles and business-styles.
低炭素英文.indd 64 08.6.20 17:32:53
64

Contribution of System Users
Active introduction of LCS navigation system, practicing low-carbon lifestyle.
Contribution of System Developers
Develop a product that matches users’ demand.
20101990 2000 2020 2030 2040 2050
Promotion for widespread use of smart meters (publicity campaigns, financial support for installation)
Planning and development of technological features of LCS navigation system
Empirical introduction of carbon labeling and recruiting of companies for participation
Standardization of product environmental information, introduction of carbon labeling certification
Introduction of incentives for environmentalload reduction based on visualization
Visualization ofenergy-savingefficiency
Visualization ofenvironmentalinformation ofproducts
FutureObjectives
Barriers
Obligation of IC device installation on home appliances and office equipments
System Introduction/Integration Period
Introduction rate of LCS NavigationSystem in home and office : 100%
Foundation PreparationPeriod
Data collection ofenergyconsumption andCO2 emissions foreach activity
Integration of dataon energyconsumption andCO2 emissionsfrom variousdevices
Incentive Introduction Period
低炭素英文.indd 65 08.6.20 17:32:54
65

Low-Carbon Society Leadership
Future Objectives
Nurturing of SpecialistsWith the number of researchers and specialists of global warming who belong to a university, graduate school or research institute reaching nearly ten thousand, understanding about countermeasure technologies against global warming have advanced. Moreover, “low-carbon advisors” are professionally active in the society; they have extensive knowledge about global warming and provide multifaceted advices to reduce CO2 emissions at home and in business activities. The number of persons with this certification exceeds fifty thousand.
Implementation Barriers and Strategic Steps
Education Style Establishment PeriodEducational materials and curricula will be created to match the age of learners. Moreover, to cause child-to-parent and child-to-sibling spill-over effect of dissemination of environmental awareness, educational programs that require participation of parents and children will be developed. On the other hand, to improve the knowledge level among teachers, a subject related to environmental problems will be added to the employment examination for teachers, in addition to organizing environmental training sessions for teachers. To construct the certification system for low-carbon society advisors, experts will be gathered for discussions. In cooperation with NGOs and companies, provision of proper information to the general public will be achieved through holding of environmental events and training sessions as well as construction of websites for providing and exchanging information.
12
Sharing of Knowledge and InformationThe basic knowledge of global warming and its various countermeasures are disseminated to persons of all generations through environmental education at school, training sessions at companies and so forth. In addition, all types of media including TV broadcasting and newspapers always provide new information such as findings gained through the latest researches. Other than that, by organizing various environmental events and online information exchanges regarding practice of eco-life, information and knowledge for establishing a low carbon lifestyle and business-style are being shared to a greater extent.
Environmental Education Permeation PeriodIn educational institutions from elementary, junior-high to senior-high schools, environmental education will become a compulsory subject, implementing various educational programs. Along with the introduction of certification system for low-carbon society advisors, special courses for obtaining the certification will be established in universities and graduate schools. Furthermore, for companies, hiring of a certain number of low-carbon society advisor certification holders will be mandatory, and directions will be given to make all the employees attend sessions by low-carbon advisors regularly.
Stable Education Effect PeriodThe need for countermeasures against environmental problems will permeate to the citizens, and when introducing a new countermeasure, effective and appropriate education and publicity activities will be performed. Educational materials will be continuously revised based on new findings. Furthermore, in order to assure continuous interest of the citizens in environmental problems, opportunities will be provided for them to have discussions on environmental education, environmental administration and so forth.
Permeation of Low-Carbon Lifestyle and Business-styleIt has become natural for even the general public to have correct science-based awareness about global warming and to practice a low-carbon lifestyle or business-style based on that knowledge. Furthermore, an increasing number of people are making voluntary actions to realize a low-carbon society, actively participating in city planning and local administration of their own and neighborhood regions.
低炭素英文.indd 66 08.6.20 17:32:55
66

Contribution of Schools, Companies and NGOs
Transmission of information based on the latest scientific findings. Innovations to assure continued interest in environmental problems.
Contribution of Citizens
Continuous interest in and sharing of information on environmental problems. Voluntary participation in creation of a low carbon society.
20101990 2000 2020 2030 2040 2050
Development of various education programs and analysis of their effectiveness
Development of educational materials and curricula appropriate for learners’ age
Holding of environmental events and sessions
Implementation of environmental training sessions for teachers
Planning and introduction of low-carbon society advisors certification
Mandatory hiring of low-carbon society advisors
Establishment of courses for low-carbon society advisor in universities
Nurturing ofspecialists
Sharing ofknowledge &Information
Permeation oflow-carbon lifestyle
Permeation oflow-carbonbusiness-style
FutureObjectives
Barriers
Compulsory environment class from elementaryto senior-high school
Addition of environmental subject to employment examination for teachers
Environmental EducationPermeation Period
Low-carbon societyadvisors : 50,000 people
Education StyleEstablishment
Lack of know-howfor implementingeffectiveenvironmentaleducation program
Insufficientprovision ofinformation tocitizens
Insufficientknowledge of andeducation forenvironment amongteachers
Low environmentalawareness incompanymanagement
Stable EducationEffect Period Period
低炭素英文.indd 67 08.6.20 17:32:56
67


Global Environmental Research Fund (GERF/S-3-1) Japan-UK Joint Research Project “a Sustainable Low-Carbon Society (LCS)”
Japan Scenarios and Actions towards Low-Carbon Societies (LCSs)
June 2008
“2050 Japan Low-Carbon Society” scenario team National Institute for Environmental Studies (NIES),
Kyoto University, Ritsumeikan University, and Mizuho Information and Research Institute
34
23
35
16
13
24
77
17
28
7
9
38
13
10
24
1
6 21●●
Low Carbon Society Leadership
Labeling to Encourage Smart and
rational Choices
Next G
eneration Fuels
Local Renewable Resources for Local
Dem
and
Low-Carbon Electricity
Pedestrian Friendly City Design
Swift and Sm
ooth Logistics
Environmentally Enlightened Business
and Industry
Sustainable Building Materials
Promoting Seasonal Local Food
Anytim
e, Anywhere A
ppropriate A
ppliances
Comfortable and G
reen Built Environm
ent
●
●
●
12
40●●●●●
●●●●●●●●
●●●●●
5●●●●●
●●●●●●●
●●●●
14●●●●
●●●●●●
●●●
4●□●□●
1110987654321
34
23
35
16
13
24
77
17
28
7
9
38
13
10
24
1
6 21●●
Low Carbon Society Leadership
Labeling to Encourage Smart and
rational Choices
Next G
eneration Fuels
Local Renewable Resources for Local
Dem
and
Low-Carbon Electricity
Pedestrian Friendly City Design
Swift and Sm
ooth Logistics
Environmentally Enlightened Business
and Industry
Sustainable Building Materials
Promoting Seasonal Local Food
Anytim
e, Anywhere A
ppropriate A
ppliances
Comfortable and G
reen Built Environm
ent
●
●
●
12
40●●●●●
●●●●●●●●
●●●●●
5●●●●●
●●●●●●●
●●●●
14●●●●
●●●●●●
●●●
4●□●□●
1110987654321
2000年
CO
2排
出量
2000年
CO
2排
出量
1990
CO
2 Em
issi
on
70%
redu
ctio
n
* Unit of number in the table is MtC.
621
90
36
77
24
1013
38
97
28
17
41
36CCS
21
24
63
82
40
24
1314
16
35
23
34
40
5
Energy supplysector
Trans-portation
Industry
Change of activity
<Scenario A>
Ener
gy s
uppl
yse
ctor
Impr
ovem
ent o
f ca
rbon
inte
nsity
16
214
230+)
230+)
35
60
52
77
42
65
62
40
● : Sector in which actions contribute reduction directly: Sector in which actions contribute reduction indirectly.
□ : Sector in which reduction by actions is included under "Change of activity"
56 - 48 95 - 81 Included in others
2000
CO
2 Em
issi
on
Impr
ovem
ent o
f ca
rbon
inte
nsity
Ener
gy d
eman
dse
ctor
<Scenario B>
Change of activity
Industry
Residential & commercial
Trans-portation
Residential & commercial
Energy supplysector
Impr
ovem
ent
of
ener
gyin
tens
ityRe
duct
ion
of d
eman
d
Impr
ovem
ent o
f ca
rbon
inte
nsity
Impr
ovem
ent o
f ca
rbon
inte
nsity
Impr
ovem
ent o
f en
ergy
inte
nsit
yRe
duct
ion
of d
eman
d
Ener
gy d
eman
dse
ctor
Ener
gy s
uppl
y se
ctor
2050
CO
2 Em
issi
on
30 - 35 (+ α) 44 - 45
2050
CO
2 Em
issi
on
Japan Scenarios and Actions tow
ards Low
-Carbon Societies (L
CSs)
June 2008


