Download - July – September 2017

July – September 2017
2 © Experian Public
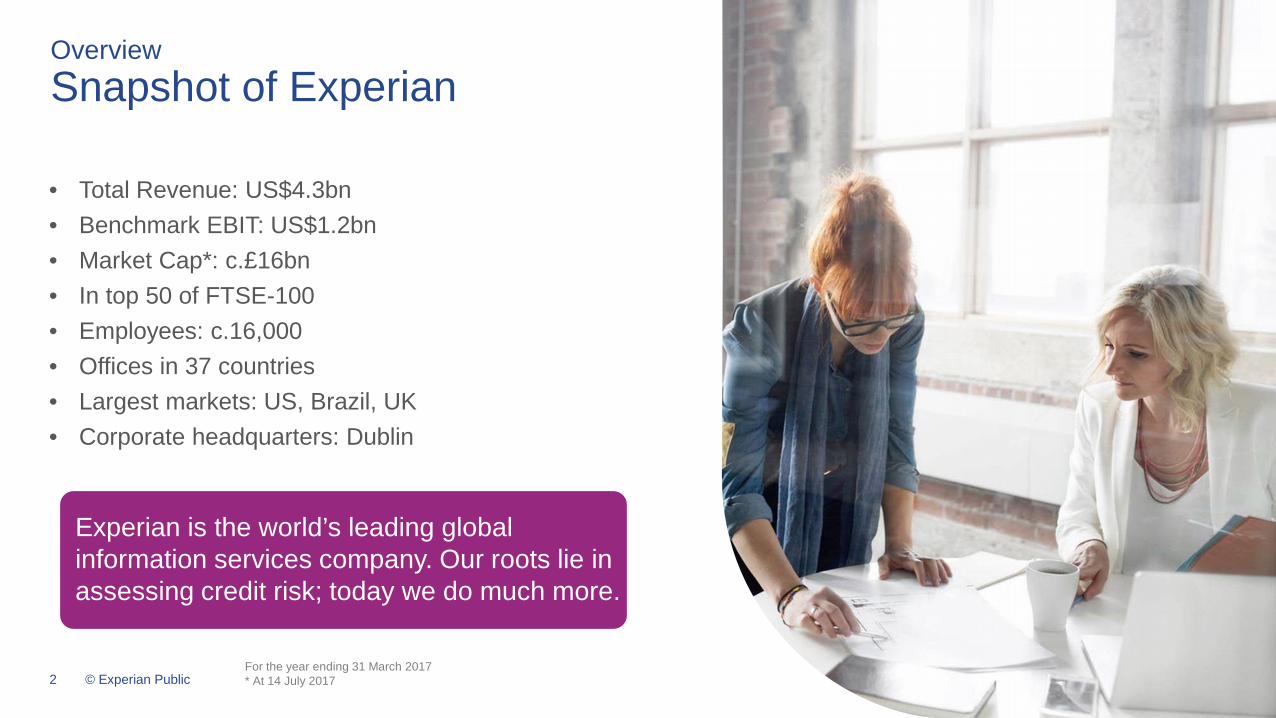
OverviewSnapshot of Experian
• Total Revenue: US$4.3bn• Benchmark EBIT: US$1.2bn • Market Cap*: c.£16bn• In top 50 of FTSE-100• Employees: c.16,000• Offices in 37 countries• Largest markets: US, Brazil, UK• Corporate headquarters: Dublin
For the year ending 31 March 2017* At 14 July 2017
Experian is the world’s leading global information services company. Our roots lie in assessing credit risk; today we do much more.

3 © Experian Public
Market leading global information company• Unique proprietary data, coupled with
analytics and software• Scalable business model
Strong market positions• No. 1 or 2 position across our largest markets• High barriers to entry
Significant growth potential• By bringing our assets together to access new
market opportunities
Strong financial track record• High quality, recurring revenues• Highly cash generative with low capital intensity
OverviewThe Experian investment case

4 © Experian Public
OverviewExperian business activities
Decision Analytics
• Helping clients to:• Lend effectively• Minimise the risk
of fraud• Using advanced
software and analytics, and expert consulting
CreditServices
• Large databases of information, used to manage risk
• 17 consumer credit bureaux
• 11 business credit bureaux
• Automotive information
• Health
Marketing Services
• Data quality and management
• Targeting relevant offers to individuals
Consumer Services
• Direct to consumer credit monitoring
• Credit matching services / lead generation
• Identity theft protection services
• Affinity (white label) credit and identity monitoring services
55% 13% 10% 22%% split of revenue shown for the year ending 31 March 2017.
By customer segment
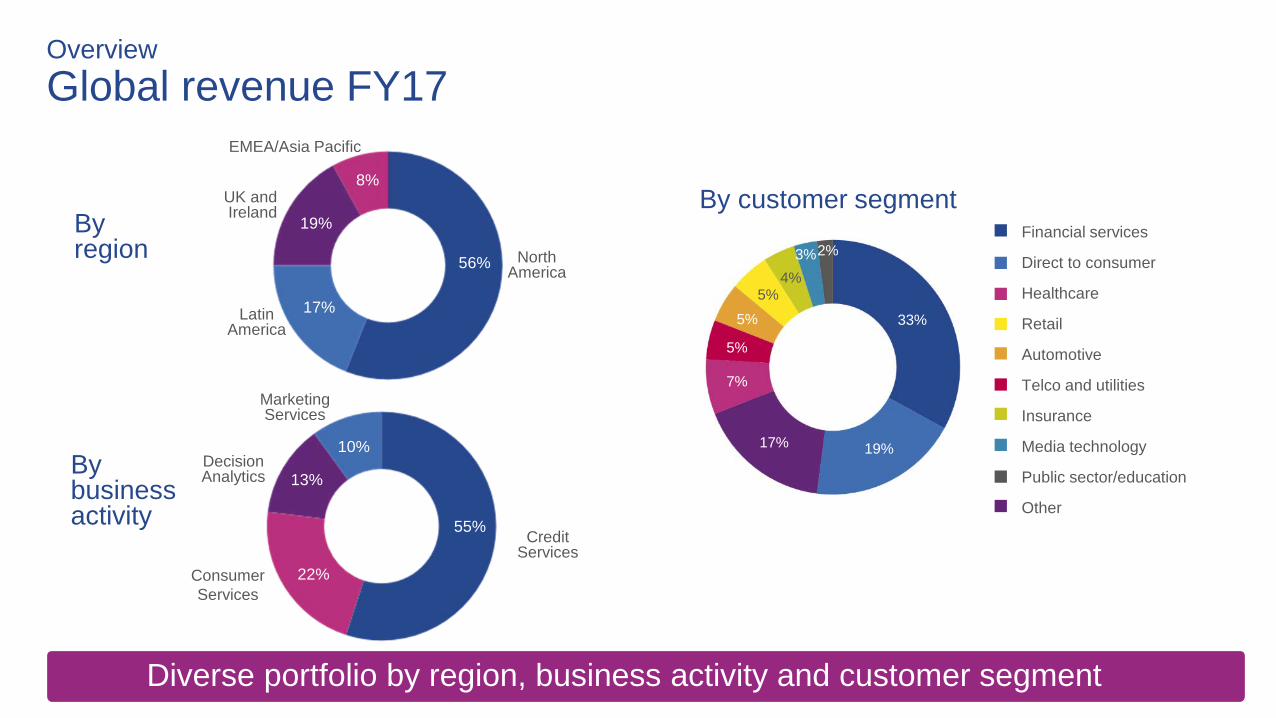
OverviewGlobal revenue FY17
Diverse portfolio by region, business activity and customer segment
Credit Services
Decision Analytics
Marketing Services
55%
13%
10%By business activity
22%
EMEA/Asia Pacific
UK and Ireland
North America
Latin America
8%
19%
56%
17%
Consumer Services
By region
33%
Financial services
Direct to consumer
Healthcare
Retail
Automotive
Telco and utilities
Insurance
Media technology
Public sector/education
Other
19%17%
7%
5%
5%
5%4%
3%2%
33%
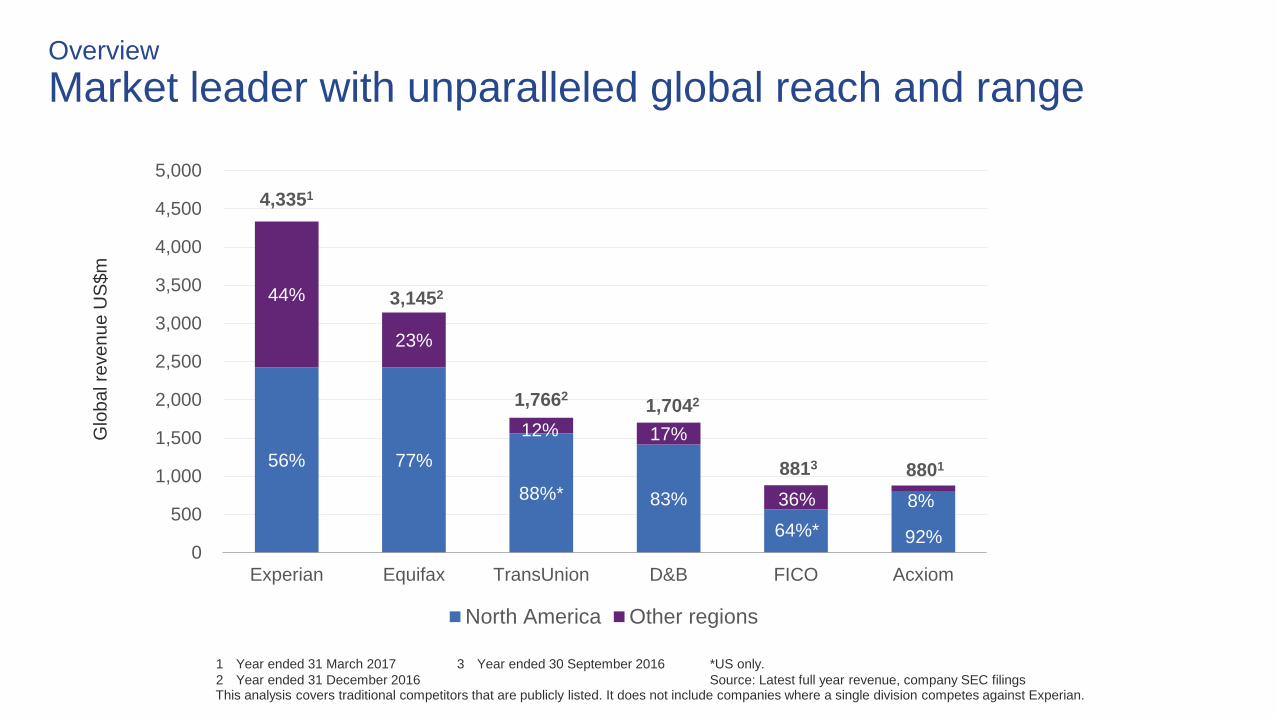
56% 77%
88%* 83%
92%64%*
44%
23%
12% 17%
8%36%
4,3351
3,1452
1,7662 1,7042
88018813
0
500
1,000
1,500
2,000
2,500
3,000
3,500
4,000
4,500
5,000
Experian Equifax TransUnion D&B FICO Acxiom
North America Other regions
OverviewMarket leader with unparalleled global reach and range
1 Year ended 31 March 20172 Year ended 31 December 2016This analysis covers traditional competitors that are publicly listed. It does not include companies where a single division competes against Experian.
*US only. Source: Latest full year revenue, company SEC filings
3 Year ended 30 September 2016
Glo
bal r
even
ue U
S$m
7 © Experian Public
Strategic overview
8 © Experian Public
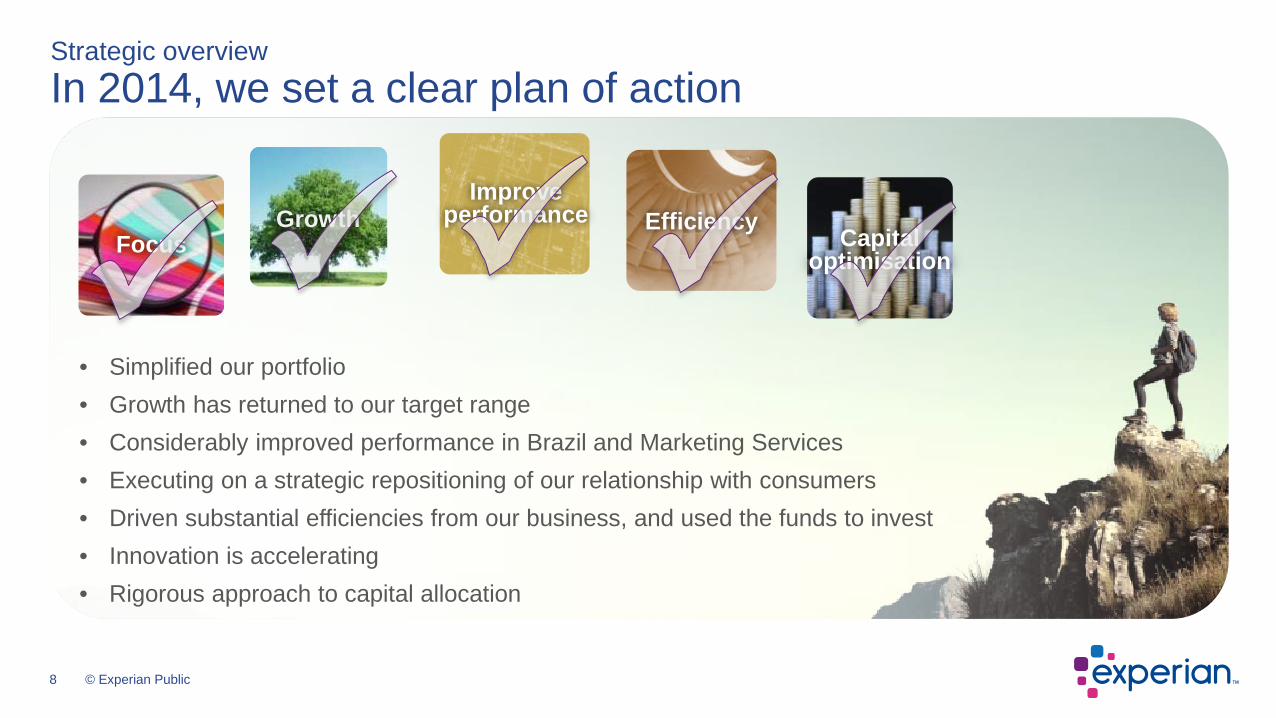
Strategic overviewIn 2014, we set a clear plan of action
8
• Simplified our portfolio• Growth has returned to our target range• Considerably improved performance in Brazil and Marketing Services• Executing on a strategic repositioning of our relationship with consumers• Driven substantial efficiencies from our business, and used the funds to invest• Innovation is accelerating• Rigorous approach to capital allocation
FocusGrowth
Improve performance Efficiency
Capital optimisation
9 © Experian Public
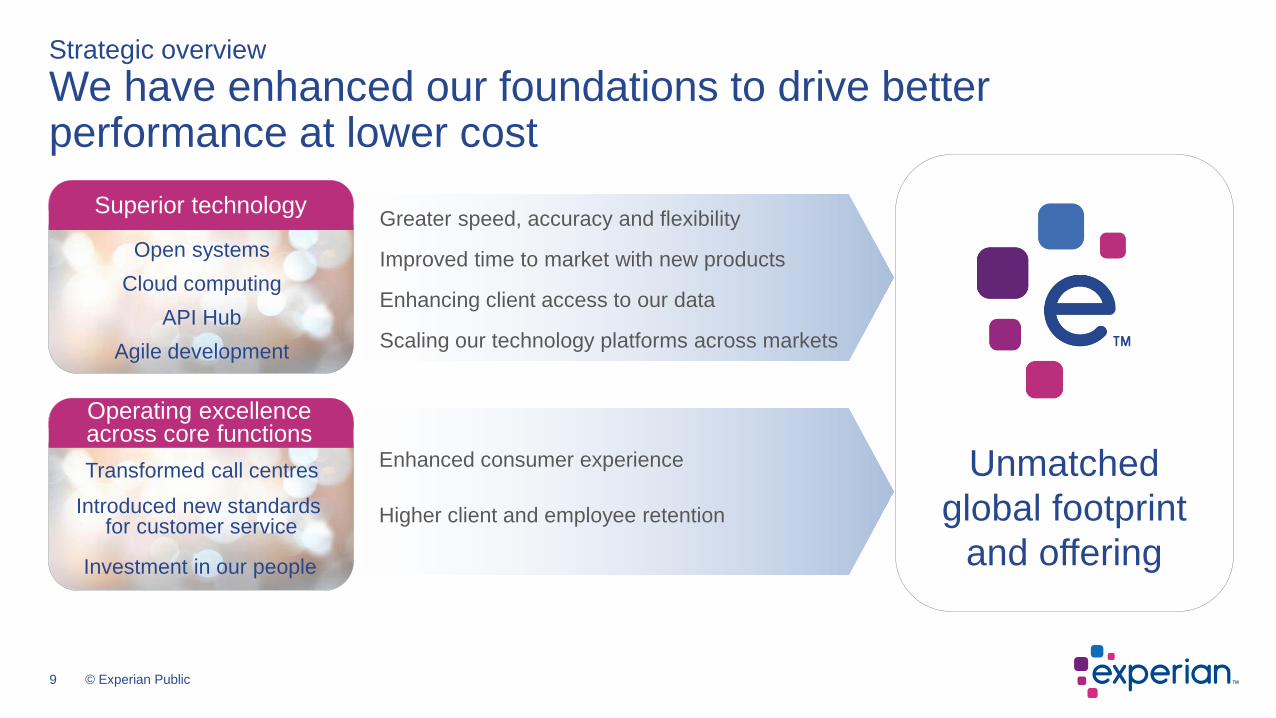
Strategic overviewWe have enhanced our foundations to drive better performance at lower cost
9
Superior technology
Operating excellence across core functions
Open systemsCloud computing
API HubAgile development
Transformed call centres
Introduced new standards for customer service
Investment in our people
Greater speed, accuracy and flexibility
Improved time to market with new products
Enhancing client access to our data
Enhanced consumer experience
Higher client and employee retention
Unmatched global footprint
and offering
Scaling our technology platforms across markets
10 © Experian Public
Strategic overviewDefining the path ahead: our growth objectives
Broaden and deepen our data assets
Extend our lead in analytics and software solutions
Transform engagement with consumers
Accelerate pace of innovation
Exploit the breadth of our capabilities
Scale in targeted verticals and geographies
11 © Experian Public
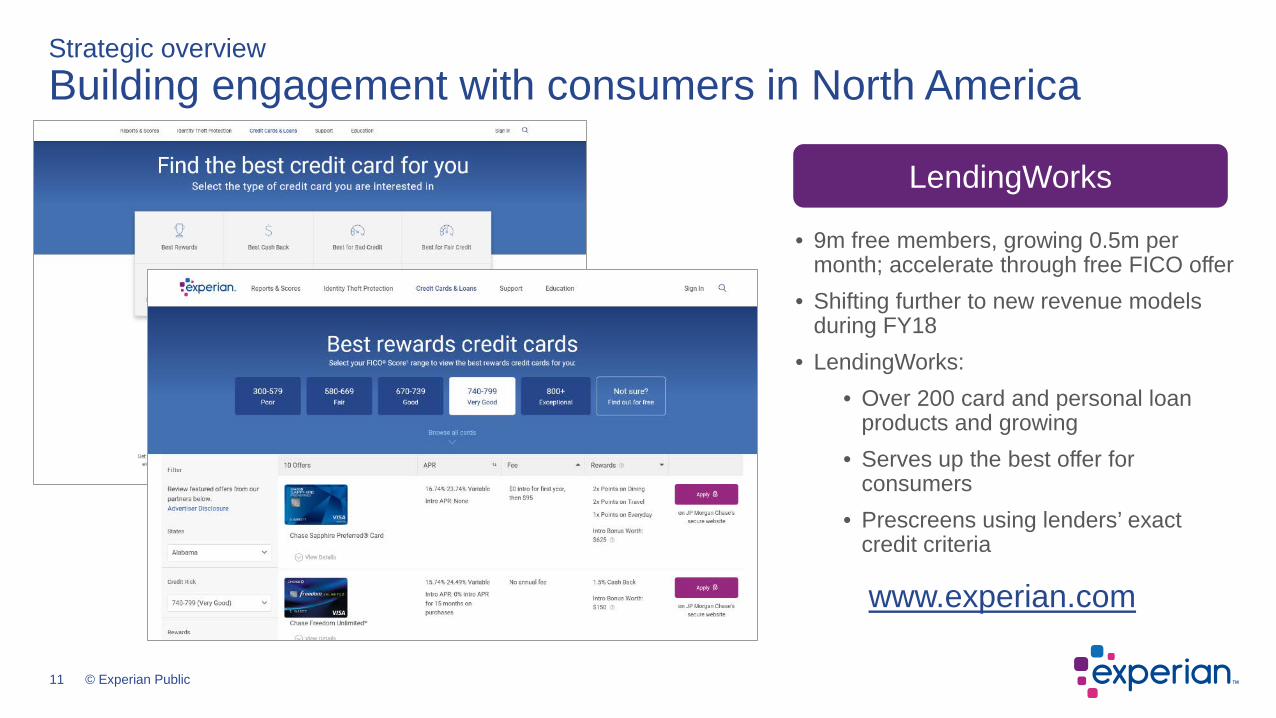
Strategic overview Building engagement with consumers in North America
11
LendingWorks
• 9m free members, growing 0.5m per month; accelerate through free FICO offer
• Shifting further to new revenue models during FY18
• LendingWorks: • Over 200 card and personal loan
products and growing• Serves up the best offer for
consumers• Prescreens using lenders’ exact
credit criteria
www.experian.com

12 © Experian Public
Strategic overviewBuilding engagement with consumers in North America
12
IdentityWorks
• Combines capabilities of Experian and CSID
• Best-in-class features
• Lower price point
• Proven market demand
www.experian.com

13 © Experian Public
Strategic overviewDelivering innovation to meet growing new customer needs
Data• Data ingestion engine• Alternative sources of data, including positive data• Targeted digital advertising• Pandora
Platforms• CrossCore• PowerCurve Collections
Analytics• North America Credit Services DaaS• Decision Analytics SaaS
Services • SerasaConnecta• Digital Credit Marketing• Universal Master Patient Index (UMPI)• Text To Credit
• Deliver fast, efficient services in the digital ecosphere
• Undertake checks in real time to ensure a smooth customer experience while managing risks
• Counter risks from fraud while authenticating people quickly
• Make sense of data across their whole organisation, to get a single view of their customer
• Know why a customer has missed a loan payment or is late paying a bill and deliver a better collections experience
Experian innovationB2B customer needs

14 © Experian Public
Strategic overviewCase study: digital credit marketing update
14
15 © Experian Public
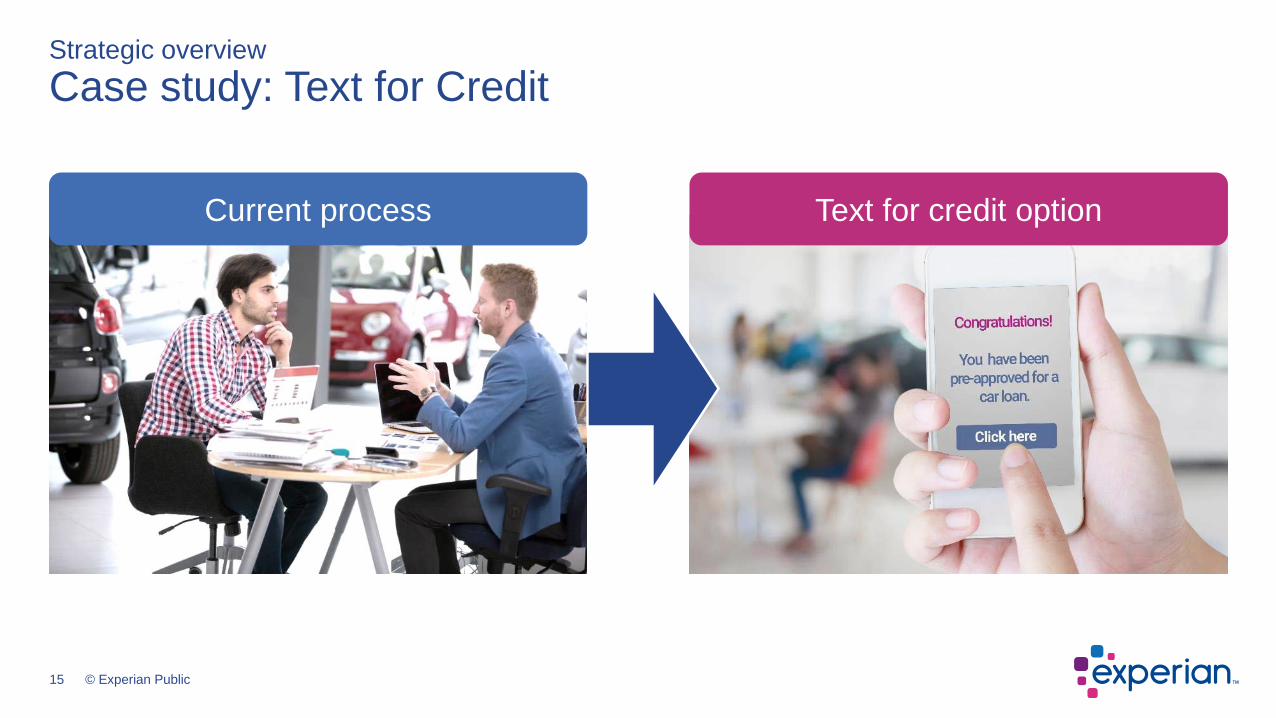
Current process Text for credit option
Strategic overviewCase study: Text for Credit
16 © Experian Public
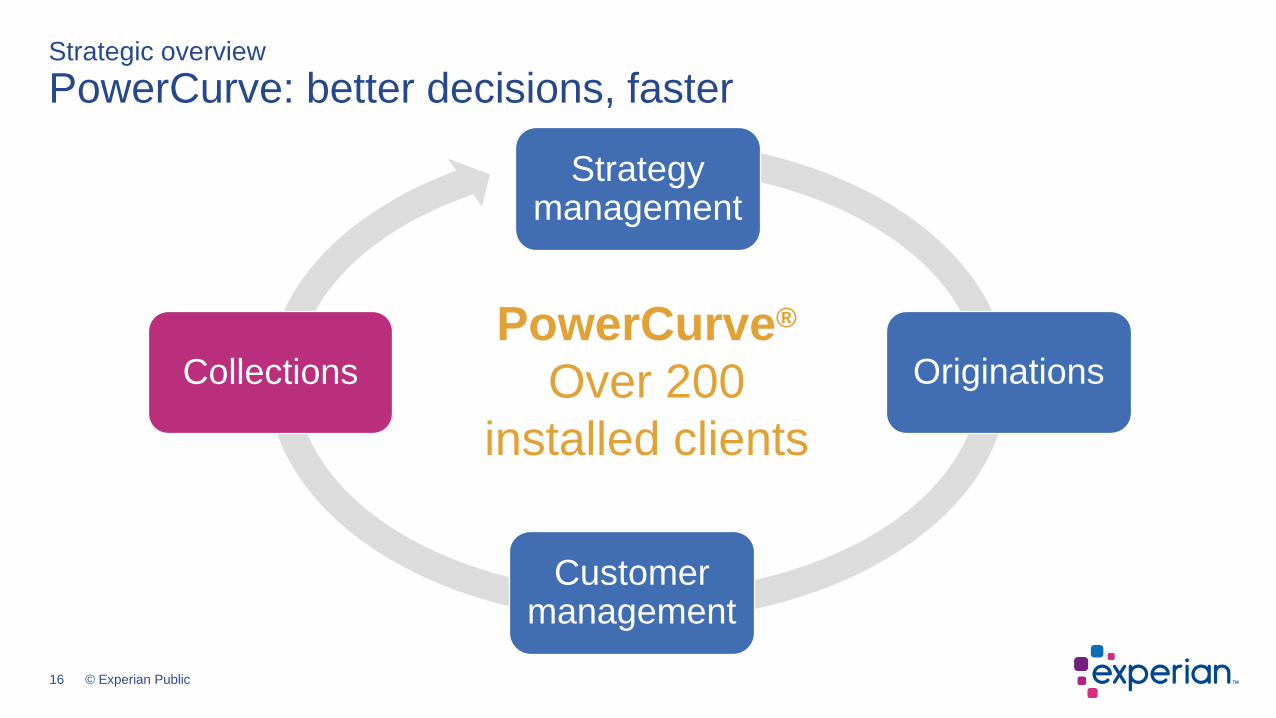
Strategy management
Originations
Customer management
CollectionsPowerCurve®
Over 200 installed clients
Strategic overviewPowerCurve: better decisions, faster

17 © Experian Public
Strategic overviewCase study: PowerCurve Collections: a growing and sizeable opportunity
17
Source: IDC Banking IT Spending Guide H2 2014 (Custom Dataset for Experian), November 2014
• Significant global opportunity
• Banking sector market c. US$0.5bn, plus telco, utilities
• Signed major Tier 1 bank in Australia as early adopter
• Pipeline growing and engagement across all regions

18 © Experian Public
Strategic overviewLatin America
Small Moderate LargeCore
Positioned to capture the structural potential
BusinessInformation
D&B
DecisionAnalytics
EXPN
MarketingServices
EXPN
ConsumerDirect
Healthcare
EXPN
Automotive
Fraud & ID
EXPN
Others
Insurance
EXPN
LexisNexis
Affinity
EXPN
Core Consumer Information
EXPN
EXPN
EXPN
CoreBusiness
InformationEXPN
DecisionAnalytics
EXPN
MarketingServices
EXPN
ConsumerDirect
EXPN
Insurance
EXPN
Fraud & ID
EXPN
Affinity
EXPN
BusinessInformation
Core Consumer Information
EXPN
EXPN
United StatesBrazil

19 © Experian Public
Capital strategyOur medium-term financial framework
Organic business
Mid single-digit organic growth
Operating cash flow application
Strong growth in Benchmark earnings per share
• Structural growth
• Strong cash generation
• Strong core and portfolio optionality
Organic investment Portfolio Shareholder
returns
Optimised capital allocation

20 © Experian Public
Recent performance
21 © Experian Public
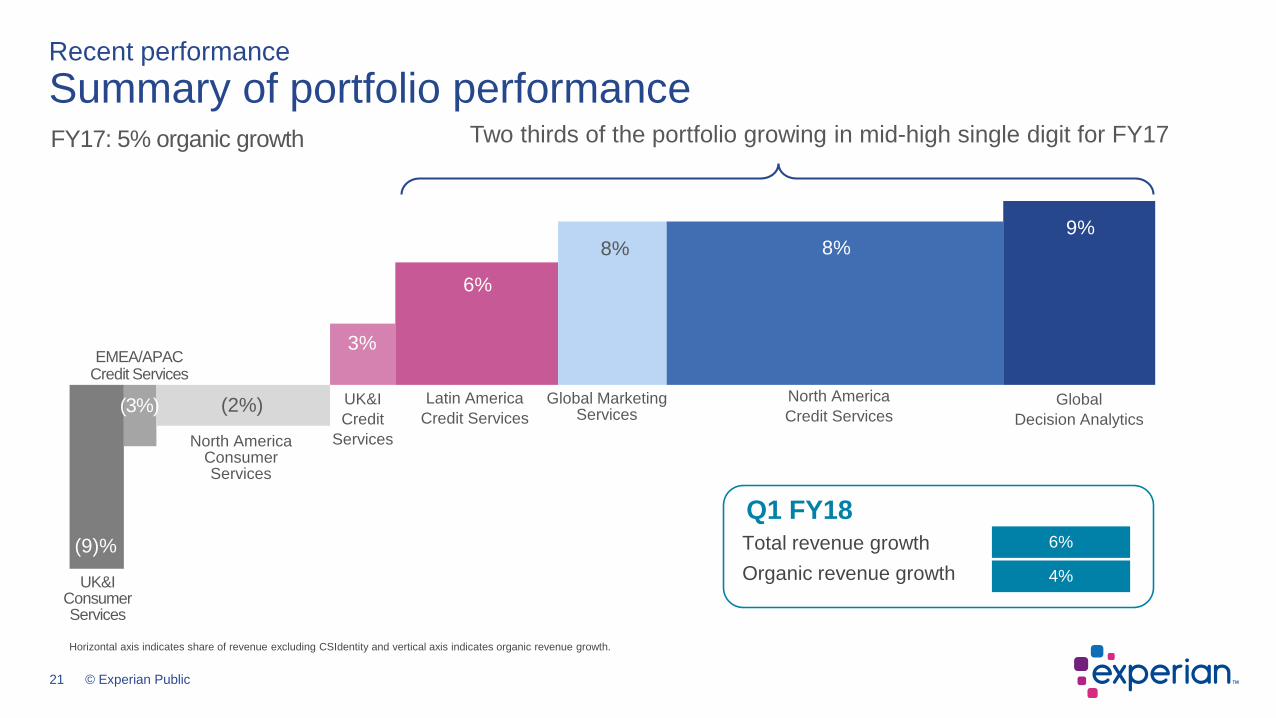
Recent performanceSummary of portfolio performance
Horizontal axis indicates share of revenue excluding CSIdentity and vertical axis indicates organic revenue growth.
UK&I Consumer Services
(9)%
EMEA/APACCredit Services
(3%)
North America Consumer Services
(2%) UK&ICredit
Services
3%
Latin America Credit Services
6%
Global Marketing Services
8%
North AmericaCredit Services
8%
Global Decision Analytics
9%
Two thirds of the portfolio growing in mid-high single digit for FY17 FY17: 5% organic growth
Q1 FY18Total revenue growthOrganic revenue growth 4%
6%
22 © Experian Public
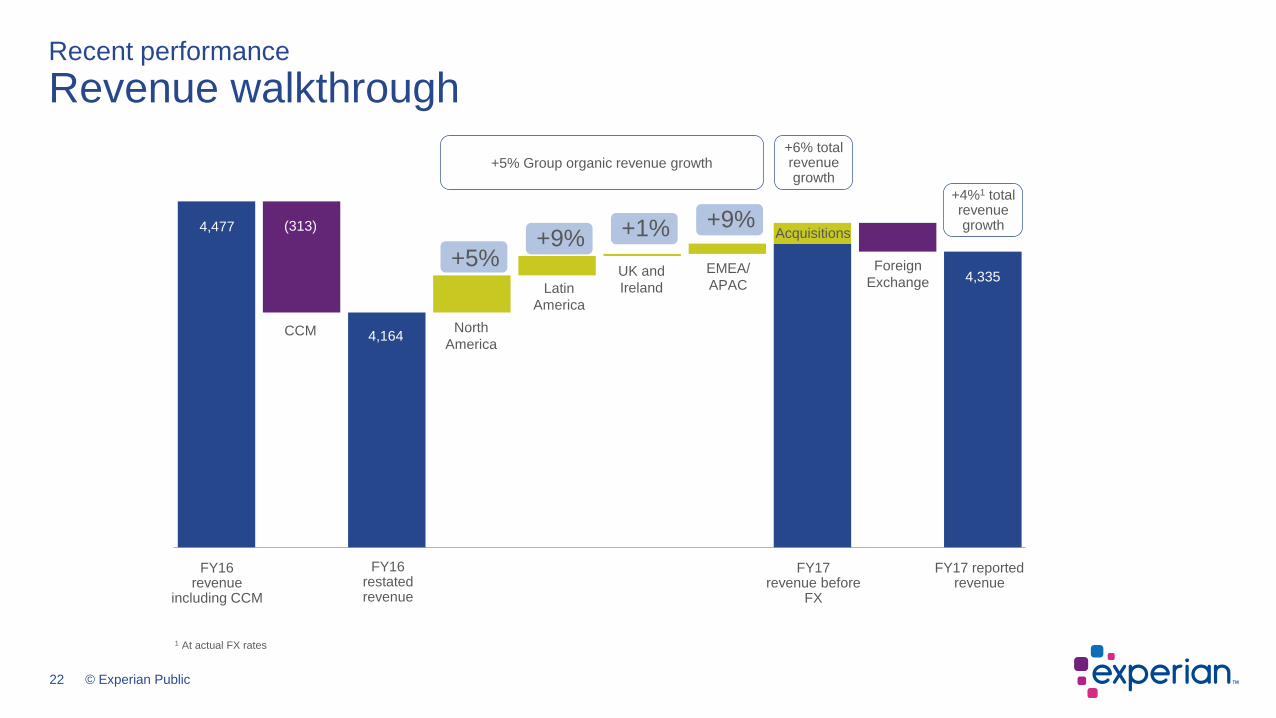
Recent performanceRevenue walkthrough
FY16 revenue
including CCM
FY17 reported revenue
North America
ForeignExchange
4,477
UK and Ireland
EMEA/APAC
CCM
FY17 revenue before
FX
FY16 restated revenue
Latin America
(313)
+5% +9% +1% +9%
4,164
4,335
Acquisitions
+5% Group organic revenue growth+6% total revenue growth
+4%1 total revenue growth
1 At actual FX rates

23 © Experian Public
Recent performanceCapital framework
1 Share repurchases as at 31 March 2017.2 Funds from Operations is defined as Benchmark free cash flow plus organic capital investment (capital expenditure).
0
200
400
600
800
1,000
1,200
1,400
1,600
Cashgenerated
Uses ofcash
Capital summary
Organic capital investment
Share repurchaseprogramme
Dividends
Acquisitions and minority investments
Funds from Operations2
Increase in net debt
Other
Capital allocation
• Organic innovation investment
• Signed agreement for the sale of CCM
• FY17 shareholder returns:• Dividend growth of 4%• US$353m1 net share repurchases completed
during the year
• Expect to make US$600m of share repurchases in FY18.

24 © Experian Public
SummaryInvesting in the growth of the future
24
Investing for a better and stronger business, well positioned for future growth

25 © Experian Public
Appendix
26 © Experian Public
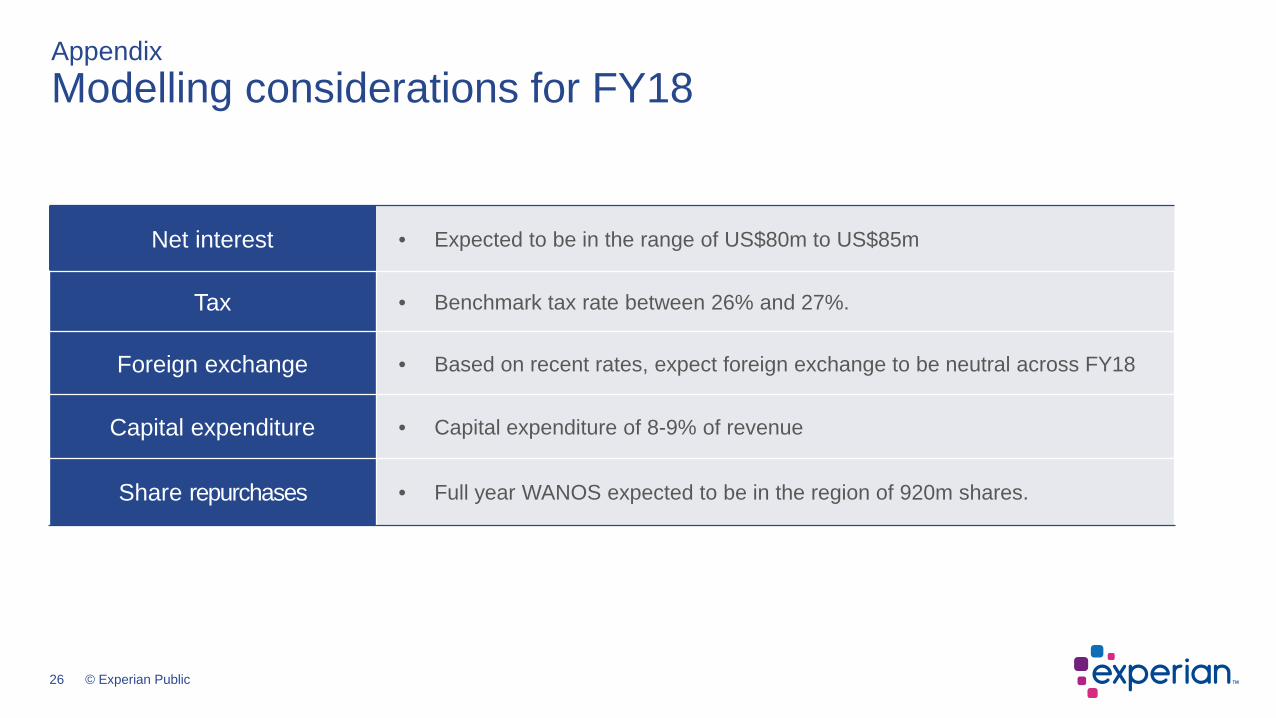
AppendixModelling considerations for FY18
Net interest • Expected to be in the range of US$80m to US$85m
Tax • Benchmark tax rate between 26% and 27%.
Foreign exchange • Based on recent rates, expect foreign exchange to be neutral across FY18
Capital expenditure • Capital expenditure of 8-9% of revenue
Share repurchases • Full year WANOS expected to be in the region of 920m shares.
27 © Experian Public
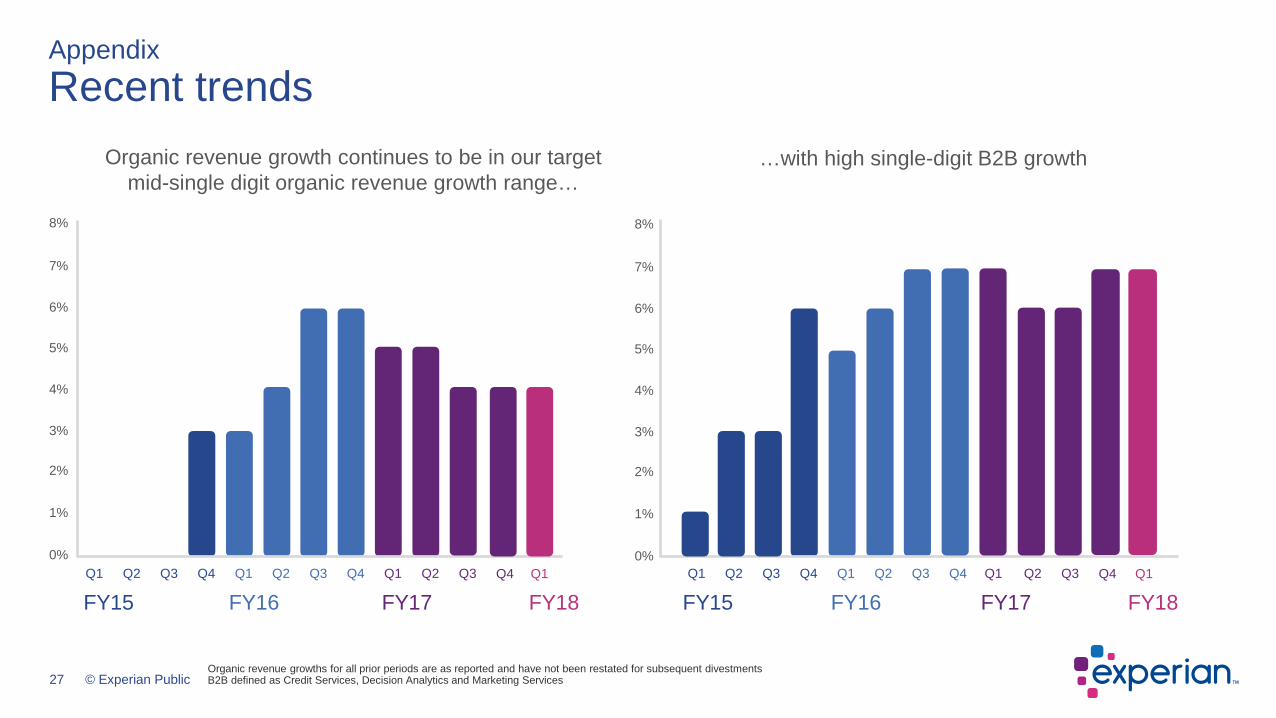
AppendixRecent trends
Organic revenue growths for all prior periods are as reported and have not been restated for subsequent divestmentsB2B defined as Credit Services, Decision Analytics and Marketing Services
Organic revenue growth continues to be in our target mid-single digit organic revenue growth range…
7%
6%
5%
4%
3%
2%
1%
0%
8%
Q1 Q2 Q3 Q4 Q1 Q2 Q3 Q4 Q1 Q2 Q3 Q4
FY15 FY16 FY17 FY18Q1
7%
6%
5%
4%
3%
2%
1%
0%
8%
Q1 Q2 Q3 Q4 Q1 Q2 Q3 Q4 Q1 Q2 Q3
FY15 FY16 FY17Q4
FY18Q1
…with high single-digit B2B growth
28 © Experian Public
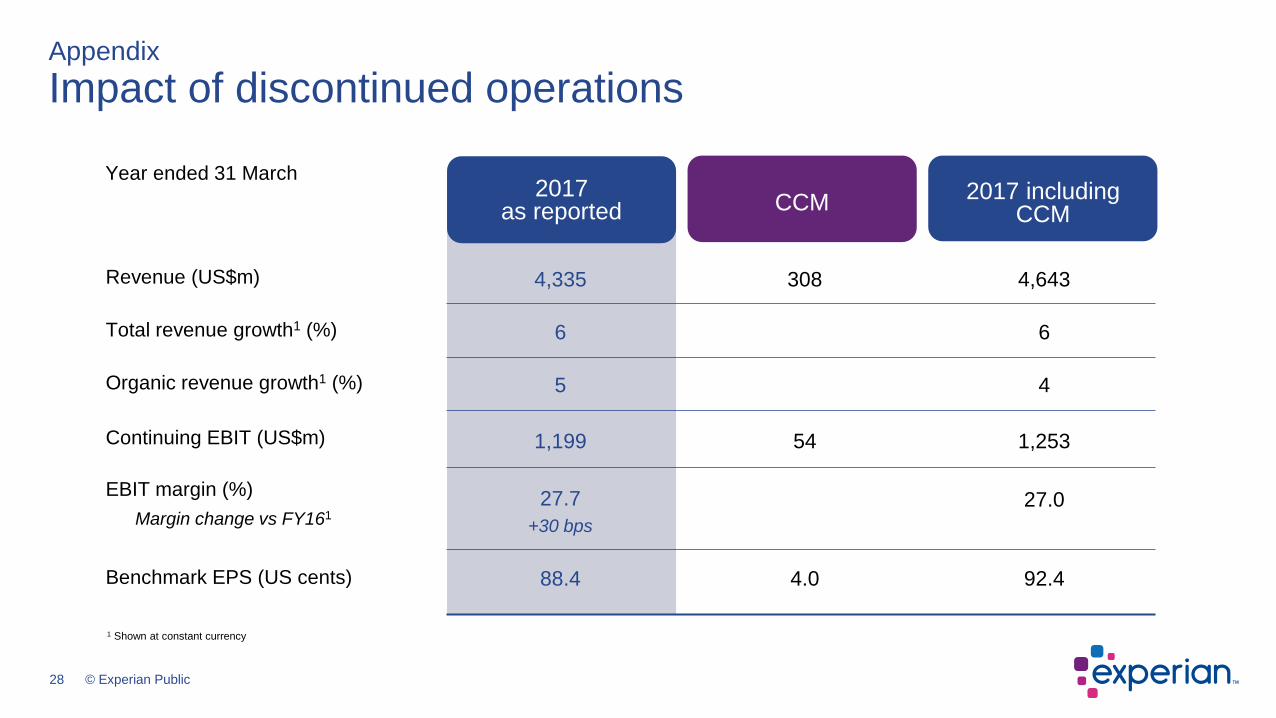
AppendixImpact of discontinued operations
Revenue (US$m)
Total revenue growth1 (%)
Organic revenue growth1 (%)
EBIT margin (%)
Continuing EBIT (US$m)
Year ended 31 March
Benchmark EPS (US cents)
308
54
CCM
4.0
Margin change vs FY161
4,335
6
5
27.7
1,199
2017 as reported
88.4
+30 bps
4,643
6
4
27.0
1,253
2017 includingCCM
92.4
1 Shown at constant currency
29 © Experian Public
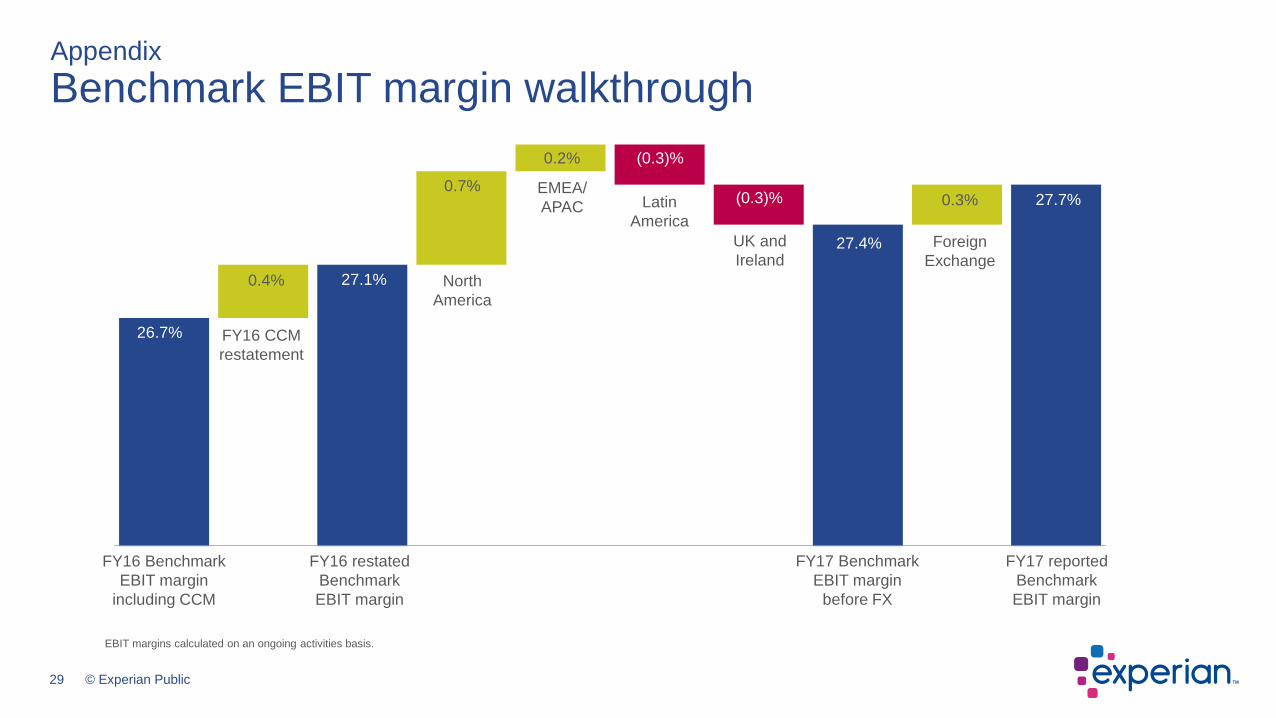
AppendixBenchmark EBIT margin walkthrough
EBIT margins calculated on an ongoing activities basis.
FY16 Benchmark EBIT margin
including CCM
FY17 reported Benchmark EBIT margin
FY16 CCM restatement
ForeignExchange
26.7%
27.7%
0.2%
0.4%
FY17 Benchmark EBIT margin
before FX
27.1%
0.7%Latin
AmericaUK and Ireland
EMEA/APAC
(0.3)%
27.4%
FY16 restated Benchmark EBIT margin
North America
0.3%(0.3)%
30 © Experian Public
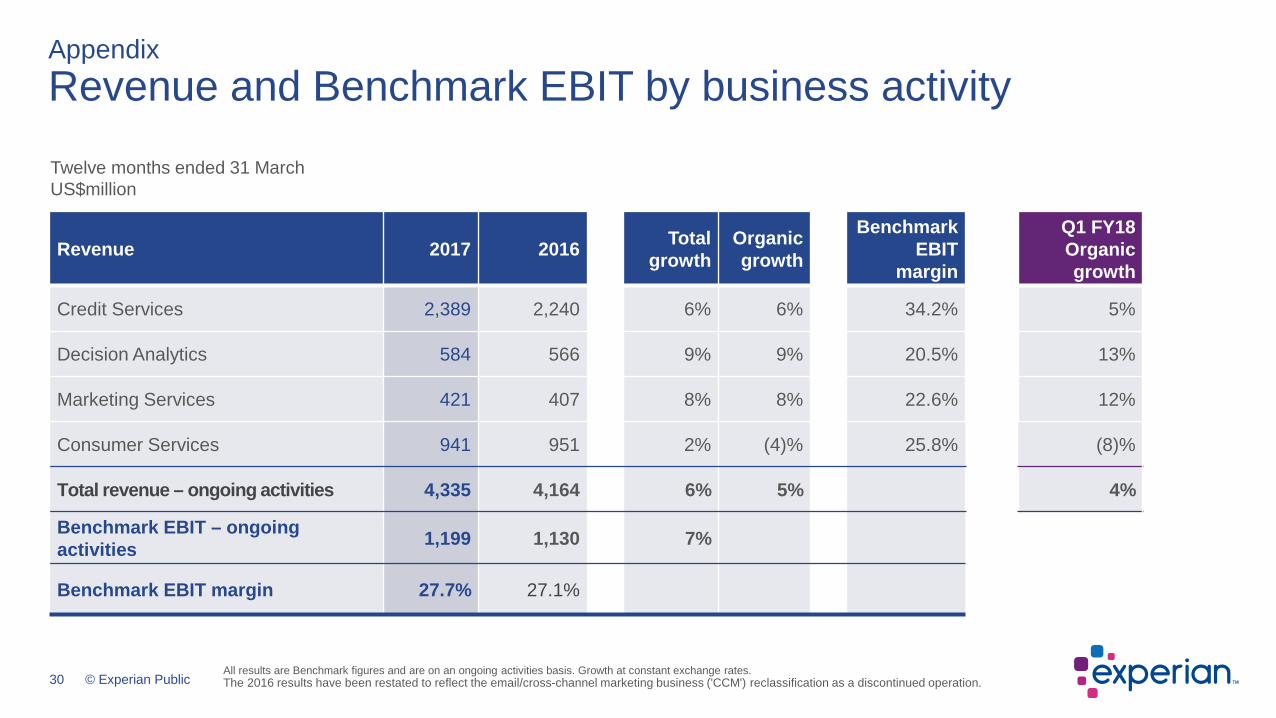
Revenue 2017 2016 Total growth
Organic growth
BenchmarkEBIT
margin
Q1 FY18 Organic growth
Credit Services 2,389 2,240 6% 6% 34.2% 5%
Decision Analytics 584 566 9% 9% 20.5% 13%
Marketing Services 421 407 8% 8% 22.6% 12%
Consumer Services 941 951 2% (4)% 25.8% (8)%
Total revenue – ongoing activities 4,335 4,164 6% 5% 4%
Benchmark EBIT – ongoing activities 1,199 1,130 7%
Benchmark EBIT margin 27.7% 27.1%
Twelve months ended 31 MarchUS$million
All results are Benchmark figures and are on an ongoing activities basis. Growth at constant exchange rates. The 2016 results have been restated to reflect the email/cross-channel marketing business ('CCM') reclassification as a discontinued operation.
AppendixRevenue and Benchmark EBIT by business activity
31 © Experian Public
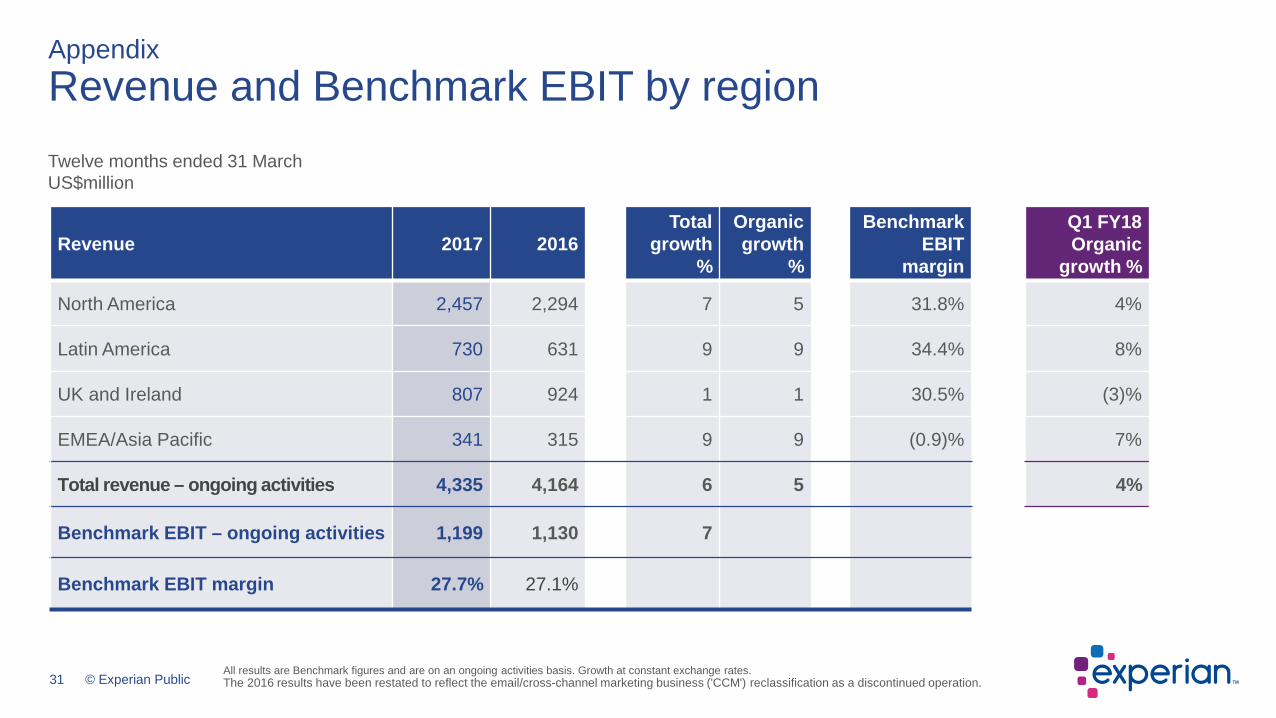
Revenue 2017 2016Total
growth %
Organic growth
%
Benchmark EBIT
margin
Q1 FY18Organic
growth %
North America 2,457 2,294 7 5 31.8% 4%
Latin America 730 631 9 9 34.4% 8%
UK and Ireland 807 924 1 1 30.5% (3)%
EMEA/Asia Pacific 341 315 9 9 (0.9)% 7%
Total revenue – ongoing activities 4,335 4,164 6 5 4%
Benchmark EBIT – ongoing activities 1,199 1,130 7
Benchmark EBIT margin 27.7% 27.1%
Twelve months ended 31 MarchUS$million
AppendixRevenue and Benchmark EBIT by region
All results are Benchmark figures and are on an ongoing activities basis. Growth at constant exchange rates. The 2016 results have been restated to reflect the email/cross-channel marketing business ('CCM') reclassification as a discontinued operation.
32 © Experian Public
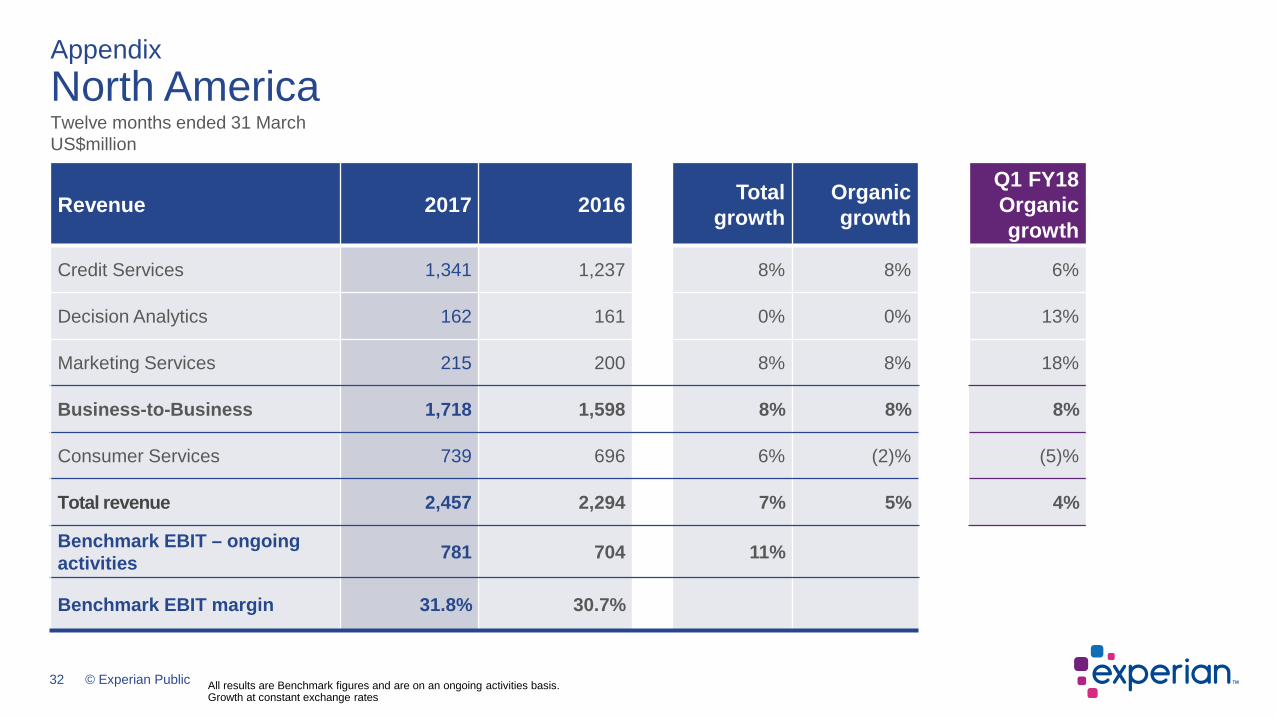
Revenue 2017 2016 Total growth
Organic growth
Q1 FY18Organic growth
Credit Services 1,341 1,237 8% 8% 6%
Decision Analytics 162 161 0% 0% 13%
Marketing Services 215 200 8% 8% 18%
Business-to-Business 1,718 1,598 8% 8% 8%
Consumer Services 739 696 6% (2)% (5)%
Total revenue 2,457 2,294 7% 5% 4%
Benchmark EBIT – ongoing activities 781 704 11%
Benchmark EBIT margin 31.8% 30.7%
Twelve months ended 31 MarchUS$million
AppendixNorth America
All results are Benchmark figures and are on an ongoing activities basis.Growth at constant exchange rates
33 © Experian Public
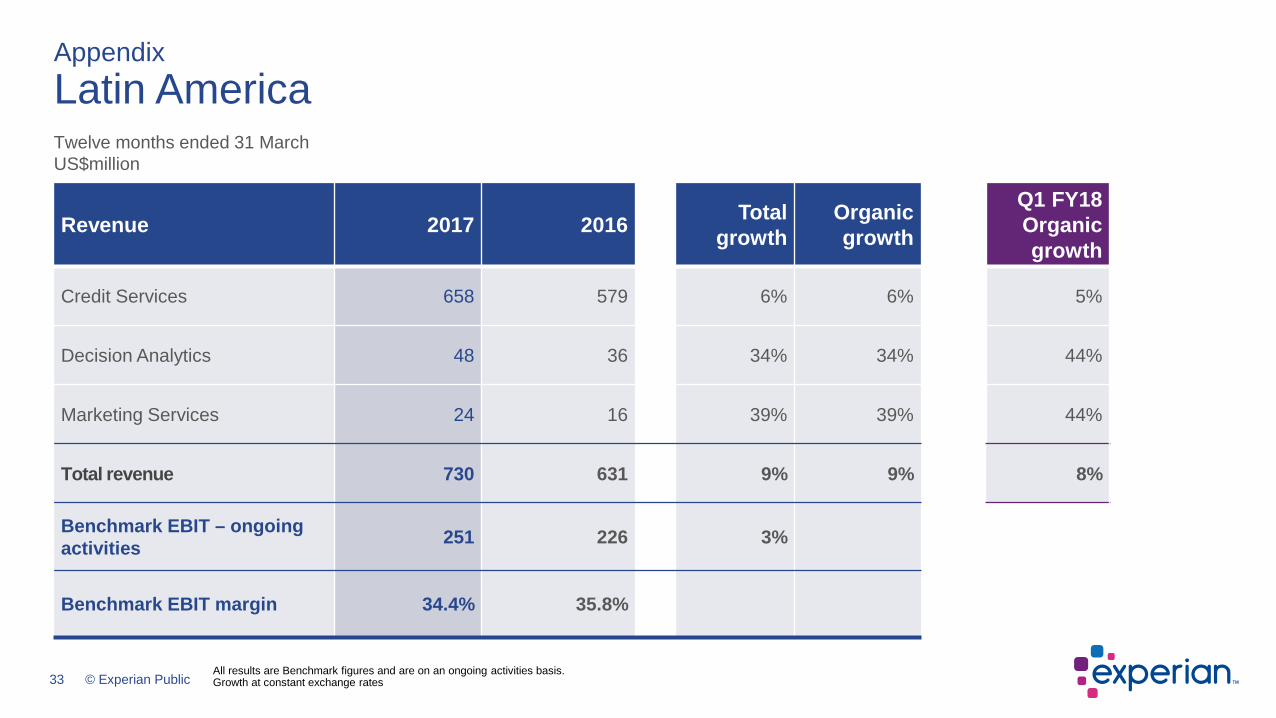
Revenue 2017 2016 Total growth
Organic growth
Q1 FY18Organic growth
Credit Services 658 579 6% 6% 5%
Decision Analytics 48 36 34% 34% 44%
Marketing Services 24 16 39% 39% 44%
Total revenue 730 631 9% 9% 8%
Benchmark EBIT – ongoing activities 251 226 3%
Benchmark EBIT margin 34.4% 35.8%
AppendixLatin AmericaTwelve months ended 31 MarchUS$million
All results are Benchmark figures and are on an ongoing activities basis.Growth at constant exchange rates

34 © Experian Public
Revenue 2017 2016 Total growth
Organic growth
Q1 FY18Organic growth
Credit Services 246 275 3% 3% 3%
Decision Analytics 214 234 5% 5% 7%
Marketing Services 145 160 5% 5% 0%
Business-to-Business 605 669 4% 4% 4%
Consumer Services 202 255 (9)% (9)% (19)%
Total revenue 807 924 1% 1% (3)%
Benchmark EBIT – ongoing activities 246 297 (4)%
Benchmark EBIT margin 30.5% 32.1%
AppendixUK and IrelandTwelve months ended 31 MarchUS$million
All results are Benchmark figures and are on an ongoing activities basis.Growth at constant exchange rates
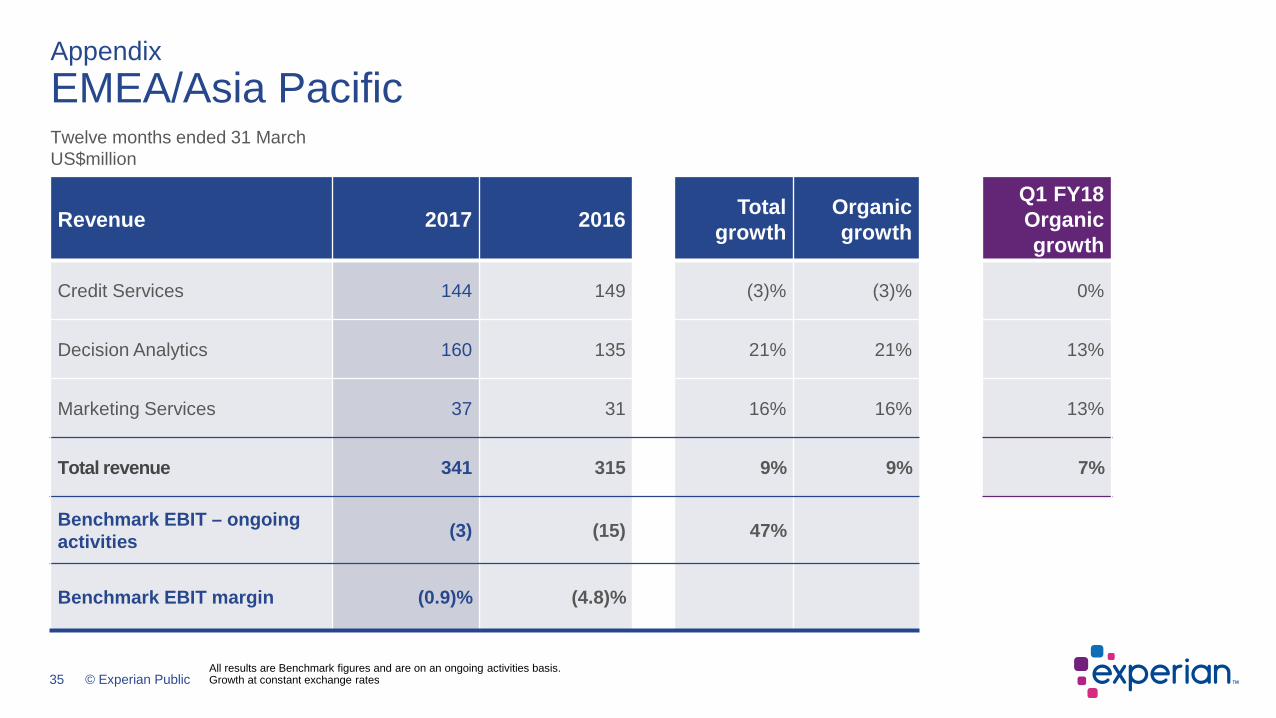
35 © Experian Public
Revenue 2017 2016 Total growth
Organic growth
Q1 FY18Organic growth
Credit Services 144 149 (3)% (3)% 0%
Decision Analytics 160 135 21% 21% 13%
Marketing Services 37 31 16% 16% 13%
Total revenue 341 315 9% 9% 7%
Benchmark EBIT – ongoing activities (3) (15) 47%
Benchmark EBIT margin (0.9)% (4.8)%
AppendixEMEA/Asia PacificTwelve months ended 31 MarchUS$million
All results are Benchmark figures and are on an ongoing activities basis.Growth at constant exchange rates

36 © Experian Public
Appendix
Credit Services
Revenue 2017 2016Total
GrowthOrganic growth
Q1 FY18Organic growth
North America 1,341 1,237 8% 8% 6%
Latin America 658 579 6% 6% 5%
UK and Ireland 246 275 3% 3% 3%
EMEA/Asia Pacific 144 149 (3)% (3)% 0%
Total revenue 2,389 2,240 6% 6% 5%
Benchmark EBIT 817 791 2%
Benchmark EBIT margin 34.2% 35.3%
All figures above on a ongoing activities basisGrowth at constant exchange rates
Twelve months ended 31 MarchUS$million
37 © Experian Public
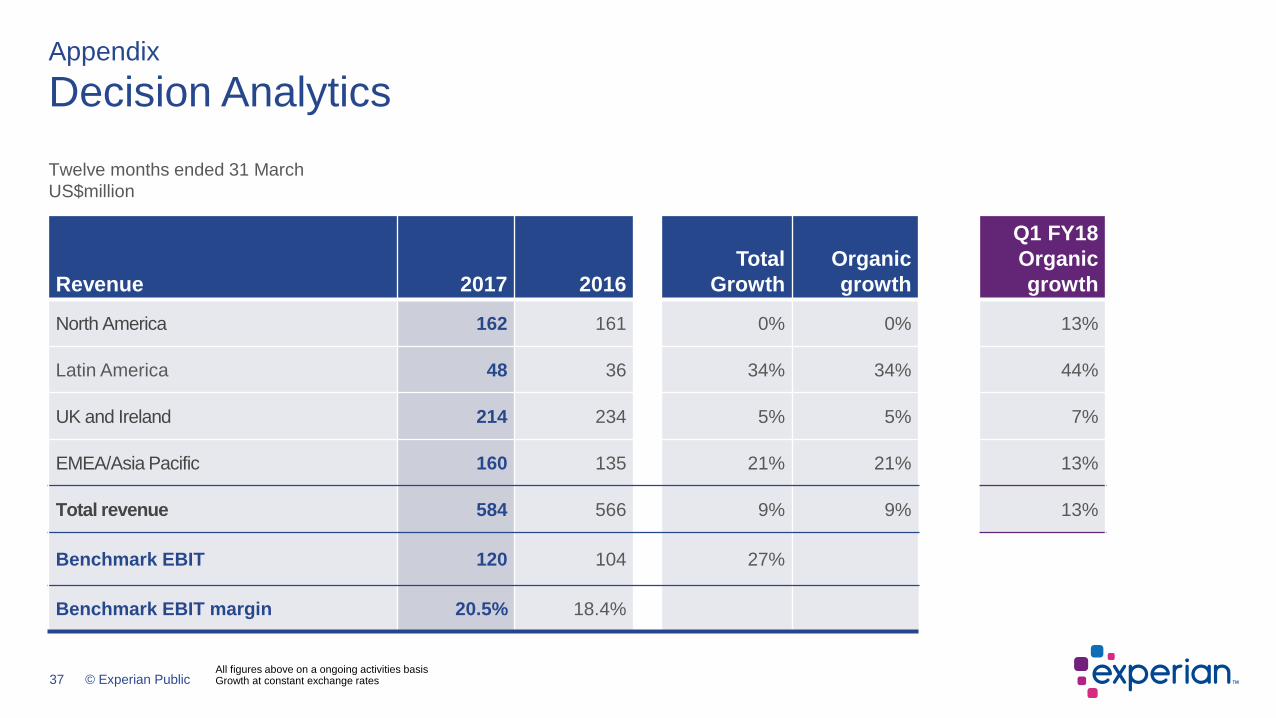
Appendix
Decision Analytics
Revenue 2017 2016Total
GrowthOrganic growth
Q1 FY18Organic growth
North America 162 161 0% 0% 13%
Latin America 48 36 34% 34% 44%
UK and Ireland 214 234 5% 5% 7%
EMEA/Asia Pacific 160 135 21% 21% 13%
Total revenue 584 566 9% 9% 13%
Benchmark EBIT 120 104 27%
Benchmark EBIT margin 20.5% 18.4%
All figures above on a ongoing activities basisGrowth at constant exchange rates
Twelve months ended 31 MarchUS$million
38 © Experian Public
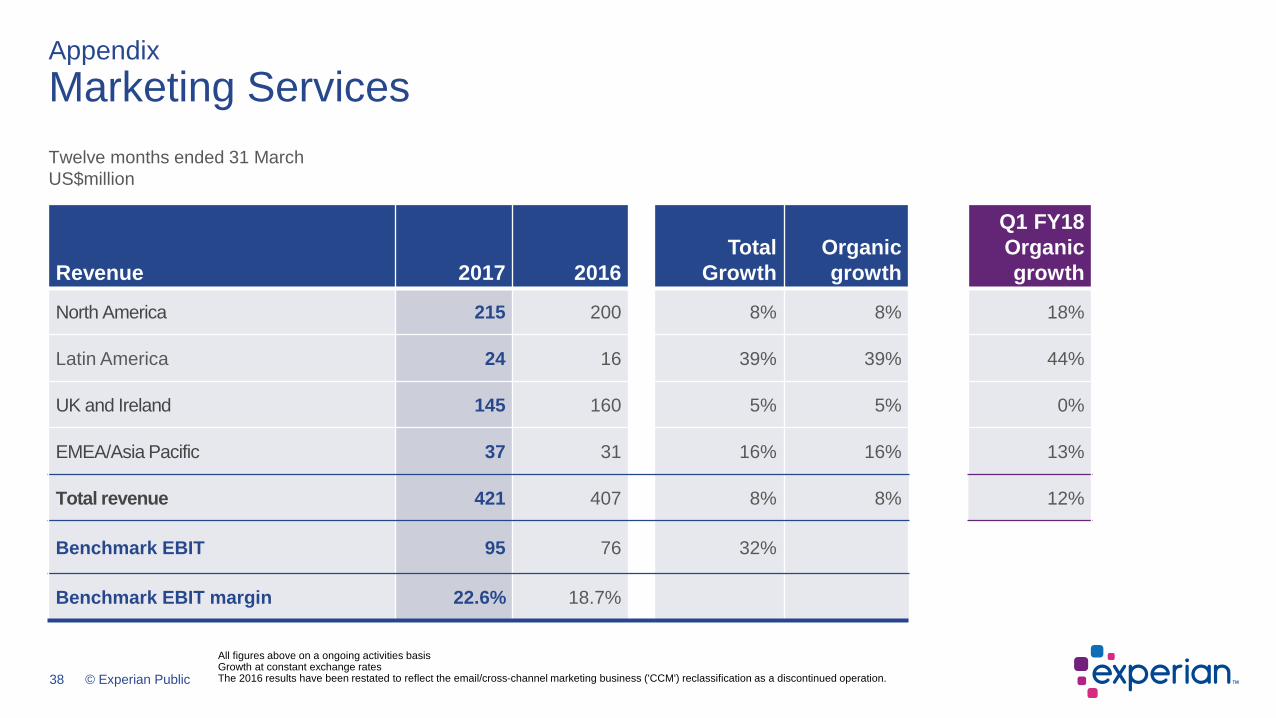
AppendixMarketing Services
Revenue 2017 2016Total
GrowthOrganic growth
Q1 FY18Organic growth
North America 215 200 8% 8% 18%
Latin America 24 16 39% 39% 44%
UK and Ireland 145 160 5% 5% 0%
EMEA/Asia Pacific 37 31 16% 16% 13%
Total revenue 421 407 8% 8% 12%
Benchmark EBIT 95 76 32%
Benchmark EBIT margin 22.6% 18.7%
All figures above on a ongoing activities basisGrowth at constant exchange ratesThe 2016 results have been restated to reflect the email/cross-channel marketing business ('CCM') reclassification as a discontinued operation.
Twelve months ended 31 MarchUS$million
39 © Experian Public
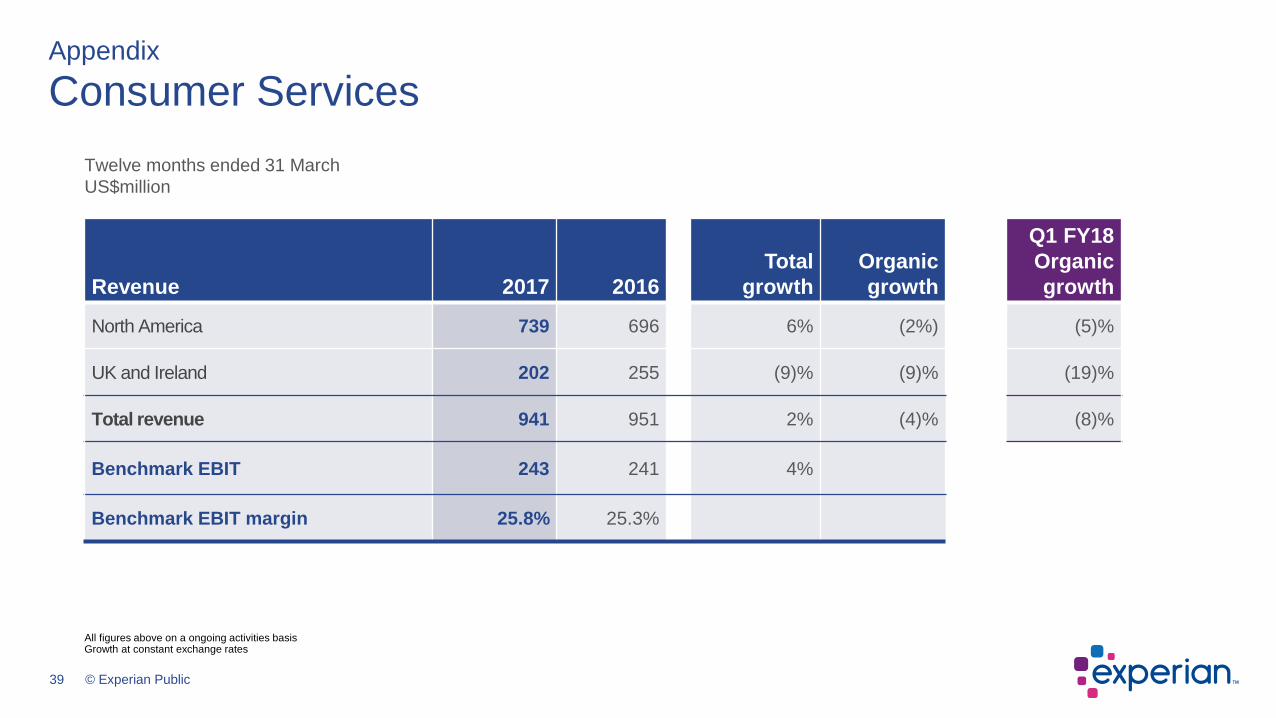
Appendix
Consumer Services
Revenue 2017 2016Total
growthOrganic growth
Q1 FY18Organic growth
North America 739 696 6% (2%) (5)%
UK and Ireland 202 255 (9)% (9)% (19)%
Total revenue 941 951 2% (4)% (8)%
Benchmark EBIT 243 241 4%
Benchmark EBIT margin 25.8% 25.3%
All figures above on a ongoing activities basisGrowth at constant exchange rates
Twelve months ended 31 MarchUS$million

40 © Experian Public
AppendixBenchmark cash flow performance
Benchmark EBIT
Benchmark operating cash
flow
Working capital and
other
Net capital expenditure
Amortisation and
depreciation
Benchmark free cash flow
Net interest paid
Tax paid on operating activities
1,199 (393)322
21
1,149 (70)(144)
(2)
933
96%conversion of EBIT into
operating cash flow
112%conversion of Benchmark
earnings into free cash flow
Dividends to minorities

41 © Experian Public
AppendixNet debt reconciliation
Net debt at 1 April 2016Net debt /
Benchmark EBITDA 1.9x
Net share purchases
Equity dividends paid
Benchmark free cash flow
Acquisitions and minority investments
Net debt at31 March 2017
Net debt / Benchmark EBITDA
2.1x
FX and other
3,023
392
(933)
432
353
381
(83)
3,173

42 © Experian Public
AppendixExperian American Depositary Receipt (ADR) program
For ADR shareholder enquiries, please contact:Shareholder RelationsBNY Mellon Depositary ReceiptsPO Box 30170College StationTX 77842-3170United States
T: + 1 201 680 6825 (From the US: 1-888-BNY-ADRS, toll free)
E: [email protected]: www.mybnymdr.com
Experian ADR shares trade on the OTCQX under the following information:Symbol EXPGYCUSIP 30215C101Ratio 1 ADR : 1 ORDCountry United KingdomEffective Date October 11, 2006Underlying SEDOL B19NLV4Underlying ISIN GB00B19NLV48U.S. ISIN US30215C1018Depositary BNY Mellon
43 © Experian Public
AppendixContacts
ExperianCardinal Place80 Victoria StreetLondon Tel: +44 (0)203 042 4200SW1E 5JL Website: www.experianplc.com
Nadia Ridout-Jamieson Peg SmithChief Communications Officer Executive Vice-PresidentEmail: [email protected] Email: [email protected]
Sarah SchibliInvestor Relations and Communications ManagerEmail: [email protected]
AppendixContacts

44 © Experian Public
20 July 2017 Annual General Meeting
15 November 2017 Half year financial report
AppendixEvent calendar

45 © Experian Public
• This presentation is being made only to, and is only directed at, persons to whom this presentation may lawfully be communicated(“relevant persons”). Any person who is not a relevant person should not act or rely on this presentation or any of its contents.
• Information in this presentation relating to the price at which relevant investments have been bought or sold in the past or the yield on such investments cannot be relied upon as a guide to the future performance of such investments.
• This presentation does not constitute or form part of, and should not be construed as, an offering of securities or otherwise constitute an invitation, inducement or recommendation to any person to underwrite, subscribe for or otherwise acquire securities in anycompany within the Experian group (the “Group”).
• Certain statements made in this presentation are forward looking statements. Such statements are based on current expectations and are subject to a number of risks and uncertainties that could cause actual events or results to differ materially from any expected future events or results expressed or implied in these forward-looking statements. Forward-looking statements speak only as of the date of this presentation.
• This presentation contains certain non-GAAP financial information. The Group’s management believes that these measures provide valuable additional information in understanding the performance of the Group or the Group’s businesses because they provide measures used by the Group to assess performance. Although these measures are important in the management of the business, they should not be viewed as replacements for, but rather as complementary to, the GAAP measures.
AppendixDisclaimer


