Download - Lean Manufacturing - Barclays Corporate Bank

FS 57537
www.bourton.co.uk © Bourton Group 2009Barclays 05/2010
Lean Manufacturing -Barclays Corporate Bank
Keith Bissett
Chairman
Bourton Group

• Introductions
• Philosophy and principles of Lean
• History of Lean
• The key tools and methodologies- including exercise and examples
– Plan Do Check Act cycle
– 7 wastes
– 5s
– Standard work
– Visual Management
– Value streams
• ‘Killer questions’ to ask manufacturers to test their lean credentials
• Sectoral differences and jargon
• Q&A
www.bourton.co.uk © Bourton Group 2009page 2Barclays 05/2010
Presentation today
The Aim is to provide you with an overview of Lean
www.bourton.co.uk © Bourton Group 2009
Some of our clients
Barclays 05/2010
nationalgrid
page 3

www.bourton.co.uk © Bourton Group 2009
Experience
Construction and infrastructure
Banking and finance
Defence and aerospace
Manufacturing
"Our experience working with Bourton has been excellent.”
HR Director, MOD Agency
“We’re already talking to our suppliers about the Bourton Group. You can’t fault them.”Vice President HSEQ, Wellstream International
“They were totally focused on customers and improving service whilst reducing costs.”
Head of Operations, Corporate Bank
“Their consultancy was extremely pragmatic.”
CI Manager, Carillion
Barclays 05/2010 page 4

www.bourton.co.uk © Bourton Group 2009Barclays 05/2010
What we do
• Scoping and Diagnosis• Setting Direction• Management and Stakeholder
Engagement
page 5

www.bourton.co.uk © Bourton Group 2009Barclays 05/2010
What we do
• Strategic Process Design• Lean Sigma Projects• Rapid Improvement Events• Work Team Continuous
Improvement
page 6

www.bourton.co.uk © Bourton Group 2009Barclays 05/2010
What we do
• Developing Leaders for Change• Developing Teams• Training for Lean Sigma• Skills transfer• Diffusion Strategy
page 7
www.bourton.co.uk © Bourton Group 2009Barclays 05/2010
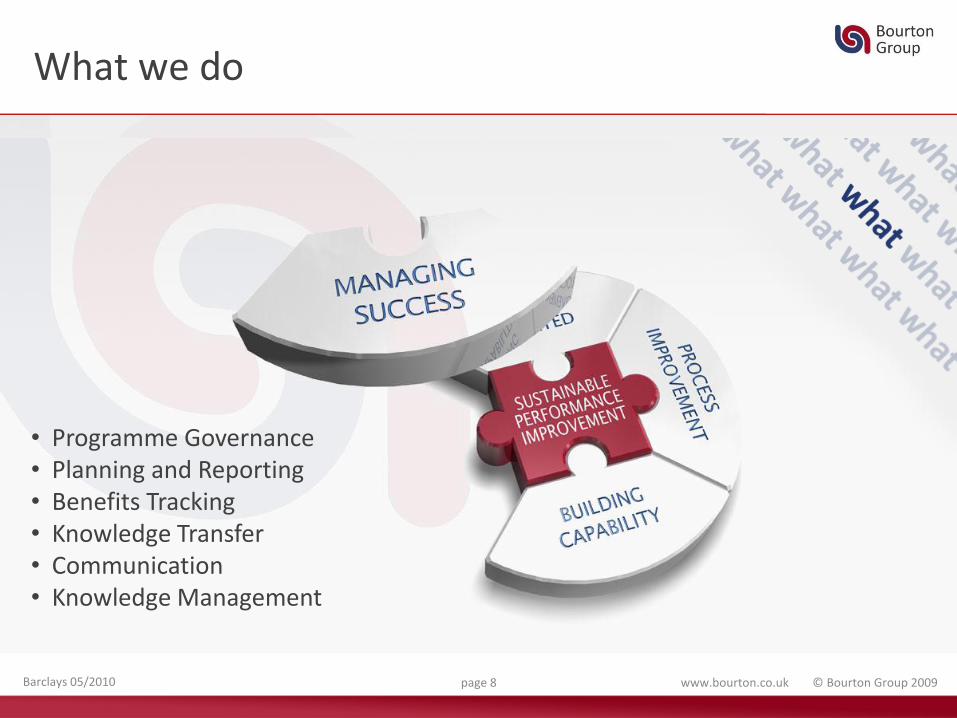
What we do
• Programme Governance• Planning and Reporting• Benefits Tracking• Knowledge Transfer• Communication• Knowledge Management
page 8

• Lean is a way of thinking
• Lean is a way of doing more with less – less human effort, less equipment, less materials, less time and less space
• Lean aims to come closer and closer to providing customers with what meets their needs
• At the heart of Lean are flexible, motivated team members continuously solving problems
What is Lean?
Barclays 05/2010 page 9 www.bourton.co.uk © Bourton Group 2009
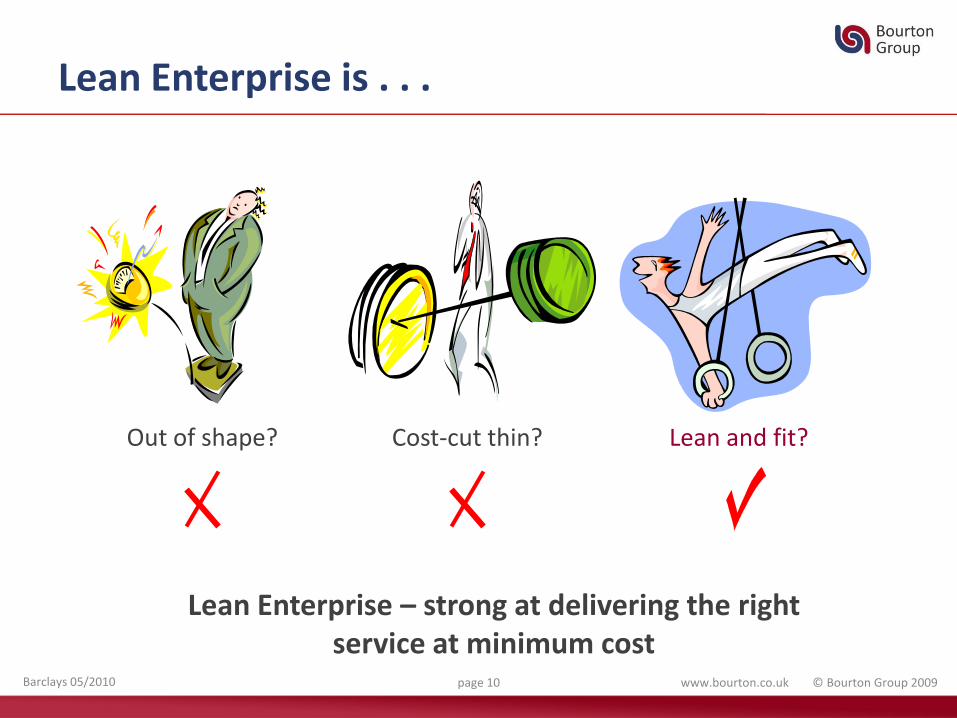
Lean Enterprise is . . .
Out of shape? Cost-cut thin? Lean and fit?
Lean Enterprise – strong at delivering the right service at minimum cost
Barclays 05/2010 page 10 www.bourton.co.uk © Bourton Group 2009

What does Lean Mean?
Principles now adopted world-wide in a variety of industries and professions
PULL
FLOW
VALUE STREAM
CUSTOMER VALUE
Understanding and agreeing exactly what your customer needs
Understanding all your processes
Pulling value through the chain
Smoothing the flow
Continuing to attack wastePERFECTION
Barclays 05/2010 page 11 www.bourton.co.uk © Bourton Group 2009

Involvement
Flexible, motivated employees continually seeking a better way
QualityImmediately respond to
abnormalities
Prevent recurrence to achieve
Zero defects
Customer Focused
JITJust what is needed
Just the amount needed
Just when needed
via
Flow
Takt
Pull
FoundationDisciplined predictable processes relentlessly improved through
elimination of waste
House of Lean
Barclays 05/2010 page 12 www.bourton.co.uk © Bourton Group 2009

What does Lean look like?
• Single items or small batches of work keep flowing, synchronised to delivery requirements
• Error prevention rather than checking
• Minimise work in progress, queues and delays
• Working to the beat of customer demand
• People work in self-managed teams to deliver a first class service
• Active involvement of everyone in the improvement process
• Focus on process not functions
The overriding principle is to focus on adding value and removing wasteBarclays 05/2010 page 13 www.bourton.co.uk © Bourton Group 2009
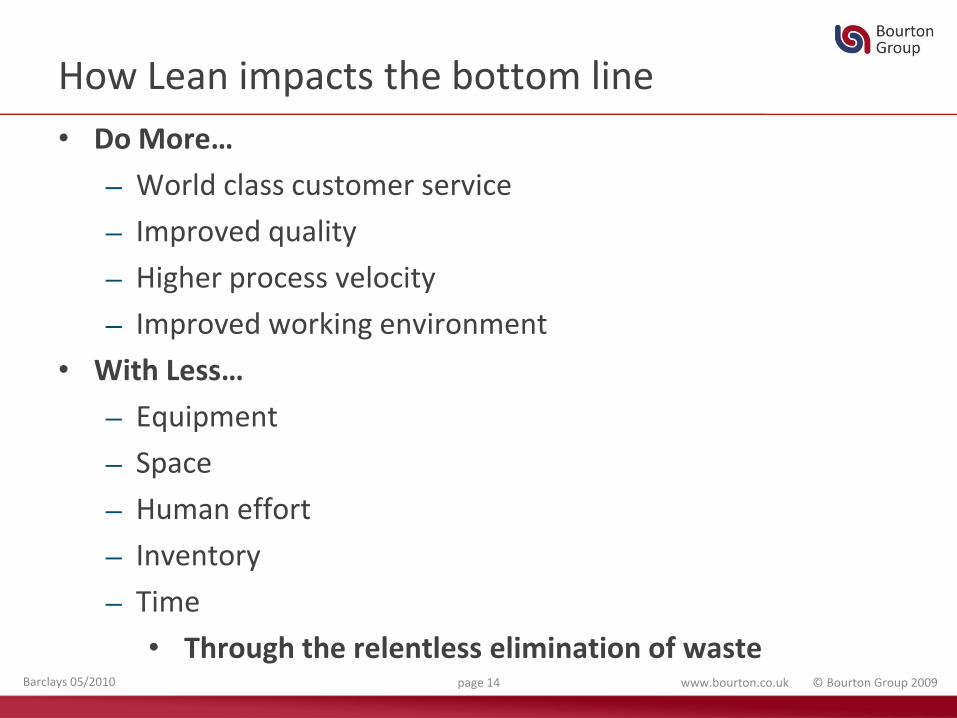
How Lean impacts the bottom line
• Do More…
─ World class customer service
─ Improved quality
─ Higher process velocity
─ Improved working environment
• With Less…
─ Equipment
─ Space
─ Human effort
─ Inventory
─ Time
• Through the relentless elimination of wasteBarclays 05/2010 page 14 www.bourton.co.uk © Bourton Group 2009
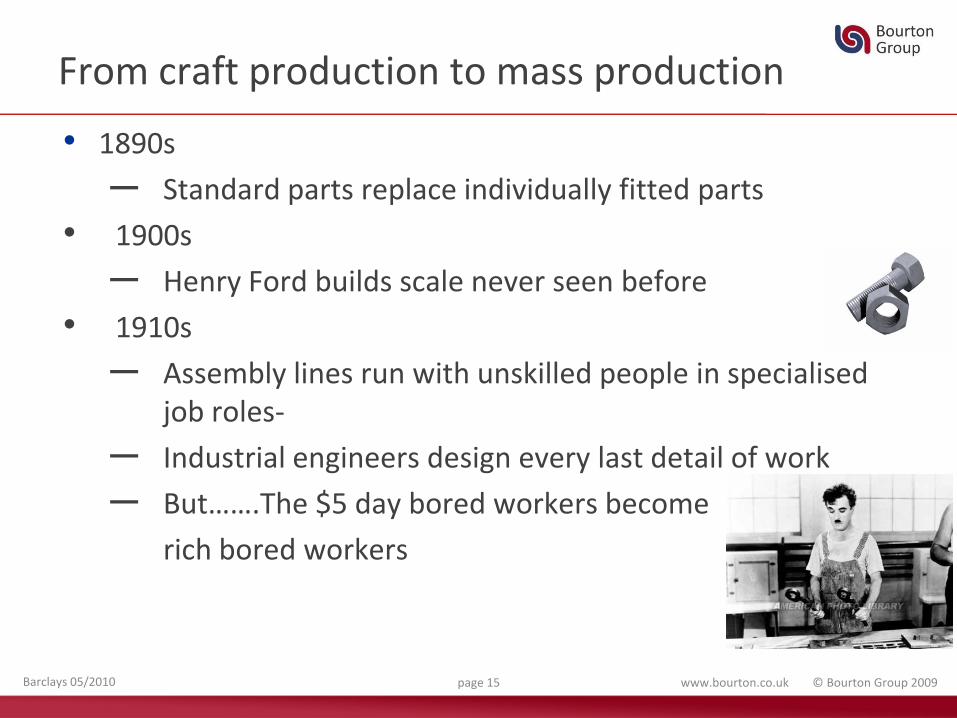
From craft production to mass production
• 1890s
─ Standard parts replace individually fitted parts
• 1900s
─ Henry Ford builds scale never seen before
• 1910s
─ Assembly lines run with unskilled people in specialised job roles-
─ Industrial engineers design every last detail of work
─ But…….The $5 day bored workers become
rich bored workers
Barclays 05/2010 page 15 www.bourton.co.uk © Bourton Group 2009

From mass production…
• 1920s
Ford: any colour, as long as it’s black
• 1930s
You have a choice from General Motors – based on complicated forecasts and big batches
• 1950s
Mass production worldwide. Lower cost of goods, but waste becoming evident
Barclays 05/2010 page 16 www.bourton.co.uk © Bourton Group 2009

… To Lean production
1940s
Eiji Toyoda visits Ford. Impressed with scale and flow, but sees the waste
1950s onwards
Toyota develops the “way” and the production system
1990s
“Lean” coined to describe Toyota. Worldwide publicity through books and visits. Toyota makes no secrets of its system
Barclays 05/2010 page 17 www.bourton.co.uk © Bourton Group 2009

The Ball Game
Barclays 05/2010 page 18 www.bourton.co.uk © Bourton Group 2009

Some of the Basic Tools
• Plan-Do-Check-Act (PDCA) – the improvement cycle that underpins Lean implementation
• The 7 wastes – the cornerstone of Lean implementation
• 5S – creating a productive and safe workplace, where abnormalities are
made visible and corrected
• Visual management – simple communication of the state of the process (e.g. what needs to be done, how things are going)
• Standardisation – doing things the same every time in the least waste way
• Takt Time – the process heartbeat to customers need
• ‘Pull’ not ‘push’ – value to the customer (e.g. the use of Kanban)
• Kaizen – the philosophy of continuous improvementBarclays 05/2010 page 19 www.bourton.co.uk © Bourton Group 2009

Attacking Waste –The Plan Do Check Act (PDCA) Improvement Cycle
The outputs from each step become the inputs for the next step.There are tools and techniques to help at each point
• Implement the change (keeping a record as you go)
• Monitor the effectiveness of your solution(s)
• If successful, capture the new standard.
• If not, re-visit root cause.
A structured method for selecting, analysing and solving problems….
• Identify the problem
• Measure the problem
• Develop solution(s)
Do
Act
Check
Plan
Barclays 05/2010 page 20 www.bourton.co.uk © Bourton Group 2009

So what is Waste?
Non Value Added (Waste)
Non Value Added(but necessary)
Value Added activity
Capacity = value work + waste
• Is this activity something that the customer would be ‘willing to pay’ for?• Does this activity change the form or function of the product or service?• Any activity that does not add value is waste and only adds cost to the
process
Any activity that does not add value from the perspective of the customer can be defined as Waste
Barclays 05/2010 page 21 www.bourton.co.uk © Bourton Group 2009

T ransportation
I nventory
M otion
W aiting
O verproduction
O verprocessing
D efects
Identifying Wastes – the 7 Wastes
Barclays 05/2010 page 22 www.bourton.co.uk © Bourton Group 2009
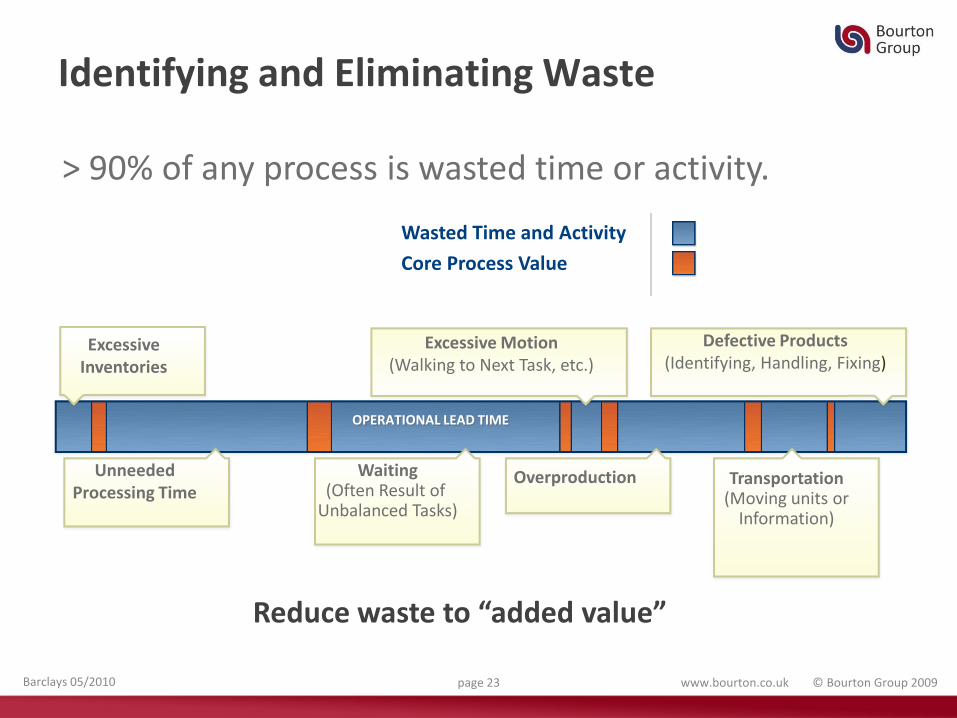
OPERATIONAL LEAD TIME
Wasted Time and Activity
Core Process Value
Excessive Motion(Walking to Next Task, etc.)
Defective Products(Identifying, Handling, Fixing)
UnneededProcessing Time
Waiting(Often Result of
Unbalanced Tasks)
Transportation(Moving units or
Information)
ExcessiveInventories
Overproduction
> 90% of any process is wasted time or activity.
Identifying and Eliminating Waste
Reduce waste to “added value”
Barclays 05/2010 page 23 www.bourton.co.uk © Bourton Group 2009

A methodology for achieving a consistently tidy, safe and productive environment
The 5S Process
SORTIdentify necessary items and remove unnecessary
ones.
Locate items where they are needed and limit amount stored.
STRAIGHTEN
SWEEP
Eliminate dirt, dust and scrap. Make workplace shine.
SUSTAIN
Make 5S a strong habit. Make problems appear and solve them.
STANDARDISEWork to standards, wear safety equipment.
5S
2
5 4
31
Barclays 05/2010 page 24 www.bourton.co.uk © Bourton Group 2009

How will you as a business benefit from 5S?
• Reduced waste making work easier
• Improved safety
• Improved maintenance
• Higher quality
• Foundation for process improvement
How will individuals benefit from 5S?
• Pride in the workplace
• Internal and external customers will notice
• Achieving results with the team
What can 5s give us?
Barclays 05/2010 page 25 www.bourton.co.uk © Bourton Group 2009

An Example: Tool Store (Pre 5S)
Barclays 05/2010 page 26 www.bourton.co.uk © Bourton Group 2009

An Example: Tool Store (Post 5S)
Barclays 05/2010 page 27 www.bourton.co.uk © Bourton Group 2009

To standardise a method is to choose out of the many methods the best
one, and use it. Standardisation means nothing unless it means
standardising upward.
Today’s standardisation, instead of being a barricade against
improvement, is the necessary foundation on which tomorrow’s
improvement will be based.
If you think of “standardisation” as the best that you know today, but
which is to be improved tomorrow – you get somewhere. But if you think
of standards as confining, then progress stops.”
Henry Ford, 1926
Today & Tomorrow
Henry Ford – Standards
Barclays 05/2010 page 28 www.bourton.co.uk © Bourton Group 2009

Standardised Work is…
The current best known, least waste, combination of people and equipment…
…utilising the minimum amount of labour, space, inventory, and equipment.
Barclays 05/2010 page 29 www.bourton.co.uk © Bourton Group 2009
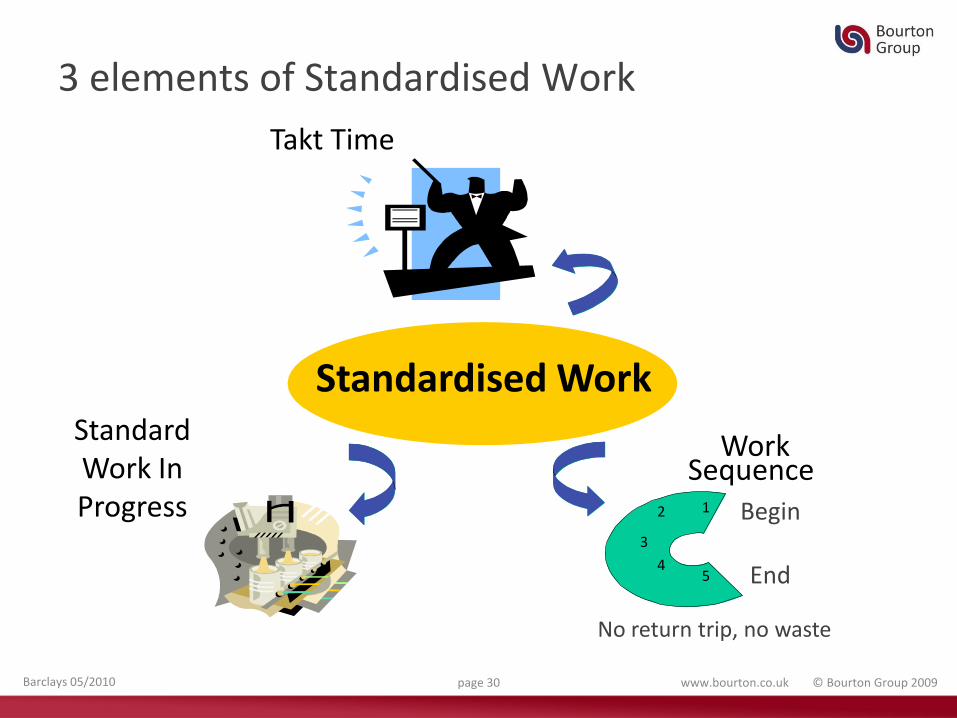
StandardWork InProgress
Takt Time
WorkSequence
12
3
45
Standardised Work
3 elements of Standardised Work
No return trip, no waste
Begin
End
Barclays 05/2010 page 30 www.bourton.co.uk © Bourton Group 2009

Visual Controls – Key Points
• Displayed where everyone can see them
• Information reflecting current conditions
• The current situation, good or bad, at a glance
• The reason for the result compared to prediction
• What countermeasures/actions are required
Visual Control MUST be simple and easily understood
Barclays 05/2010 page 31 www.bourton.co.uk © Bourton Group 2009

Limbo Bar Example For Kanbans
Limbo bars display visually “How Much Is Ok?”
Barclays 05/2010 page 32 www.bourton.co.uk © Bourton Group 2009

Do not use Computers Unless you Have to
Barclays 05/2010 page 33 www.bourton.co.uk © Bourton Group 2009
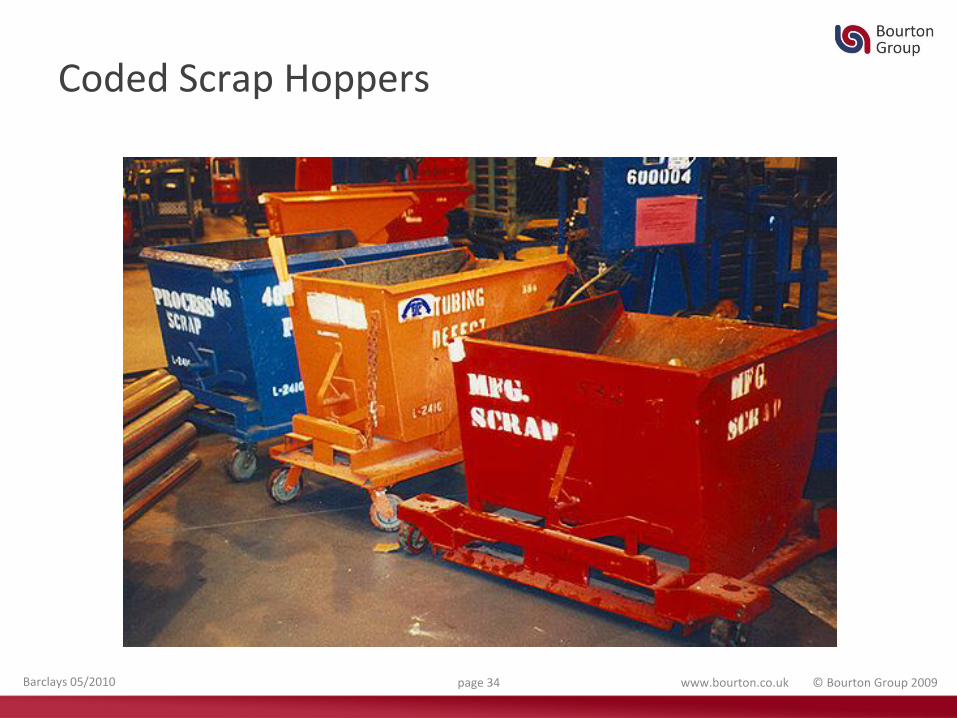
Coded Scrap Hoppers
Barclays 05/2010 page 34 www.bourton.co.uk © Bourton Group 2009

Colour Coded Dies
Barclays 05/2010 page 35 www.bourton.co.uk © Bourton Group 2009

What is a Value Stream?
The flow of information, resources and materials that produce the ‘goods and services’ that are of value to customers.
Includes value-adding and non-value added activities
Barclays 05/2010 page 36 www.bourton.co.uk © Bourton Group 2009

Fitter requisitions part
Team leader signs req.
Send req. to procurement.
Procurement raise order
Order telephoned to supplier
Supplier enters order to system
System prints pick note for stores
Return dely note for entry to system
Manager allocates pick sheets
Stores pick and pack for delivery
Deliver to site by van (sign for dely)
Fitter collects part
Fitter repairs equipment!
Enter D Note to system
System produces consolidated invoice
Book part into system
Inform fitter part is available
30 sec 2.5 min 6 min 4 min 30 sec 3 min 2 min1 hr
1 min 10 min 1 hr 1 min 1 min 15 min 10 min
1 min1 min1 hr
9 hr1 hr2 hr
0 hr9 hr
1 hr9 hr
0 hr1 hr
0 hr1 hr
1 hr9 hr
1 hr9 hr
Month end
1 hr4 hr
1 hr4 hr
1 hr9 hr
1 hr4 hr
1 hr9 hr
1 hr2 hr
Make-up of part cost to supplier also contains waste
Time waste 49 minutes
Cost waste £ 16.33
Part cost £ 42.70
Queue time 10 - 72 hours
Current State Mapping Example
Barclays 05/2010 page 37 www.bourton.co.uk © Bourton Group 2009

Fitter requisitions part
Team leader signs req.
Send req. to procurement.
Procuremnt raise order
Order telephoned to supplier
Supplier enters order to system
System prints pick note for stores
Return dely note for entry to system
Manager allocates pick sheets
Stores pick and pack for delivery
Deliver to site by van (sign for dely)
Fitter collects part
Fitter repairs equipment!
Enter D Note to system
System produces consolidated invoice
Book part into system
Inform fitter part is available
30 sec 2.5 min 6 min 4 min 30 sec 3 min 2 min1 hr
1 min 10 min 1 hr 1 min 1 min 15 min 10 min
1 min1 min1 hr
9 hr1 hr2 hr
0 hr9 hr
1 hr9 hr
0 hr1 hr
0 hr1 hr
1 hr9 hr
1 hr9 hr
Month end
1 hr4 hr
1 hr4 hr
1 hr9 hr
1 hr4 hr
1 hr9 hr
1 hr2 hr
Make-up of part cost to supplier also contains waste
Can fitter be issued with P Card valid at spares supplier?
Can van deliver direct to fitter?
Can invoice be provided through P Card system?
Some Value Stream Improvements
Barclays 05/2010 page 38 www.bourton.co.uk © Bourton Group 2009
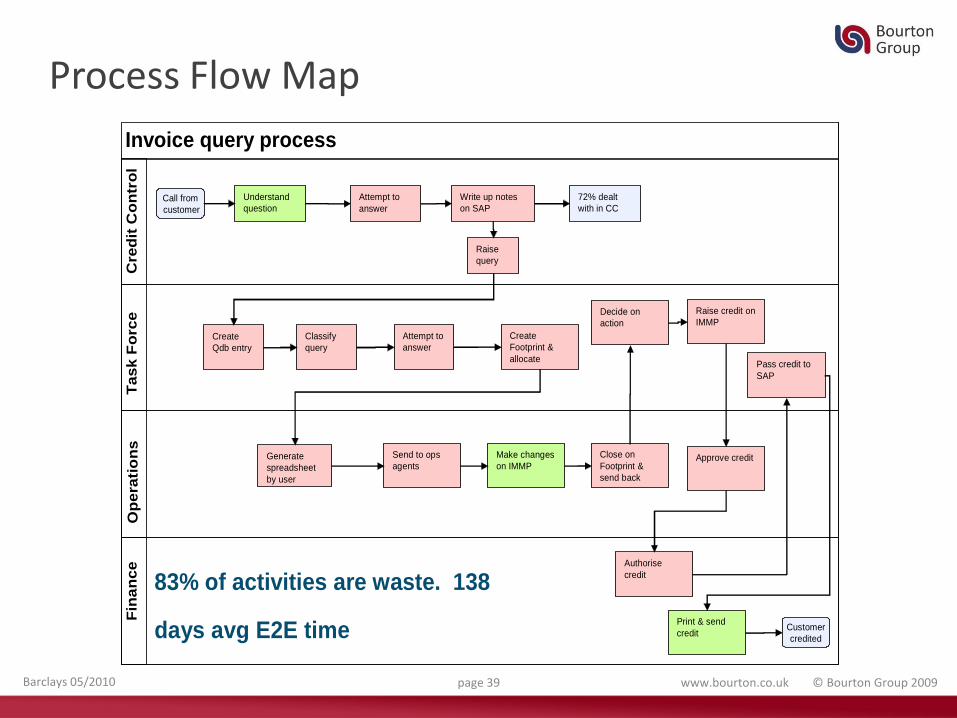
Process Flow Map
Invoice query processF
ina
nce
Op
era
tio
ns
Tas
k F
orc
eC
red
it C
on
tro
l
Attempt to
answer
Raise
query
Create
Qdb entry
Classify
query
Attempt to
answer
Generate
spreadsheet
by user
Create
Footprint &
allocate
Send to ops
agents
Make changes
on IMMP
Close on
Footprint &
send back
Decide on
action
Raise credit on
IMMP
Approve credit
Authorise
credit
Pass credit to
SAP
Print & send
credit
Understand
questionCall from
customer
Customer
credited
83% of activities are waste. 138
days avg E2E time
72% dealt
with in CC
Write up notes
on SAP
Barclays 05/2010 page 39 www.bourton.co.uk © Bourton Group 2009
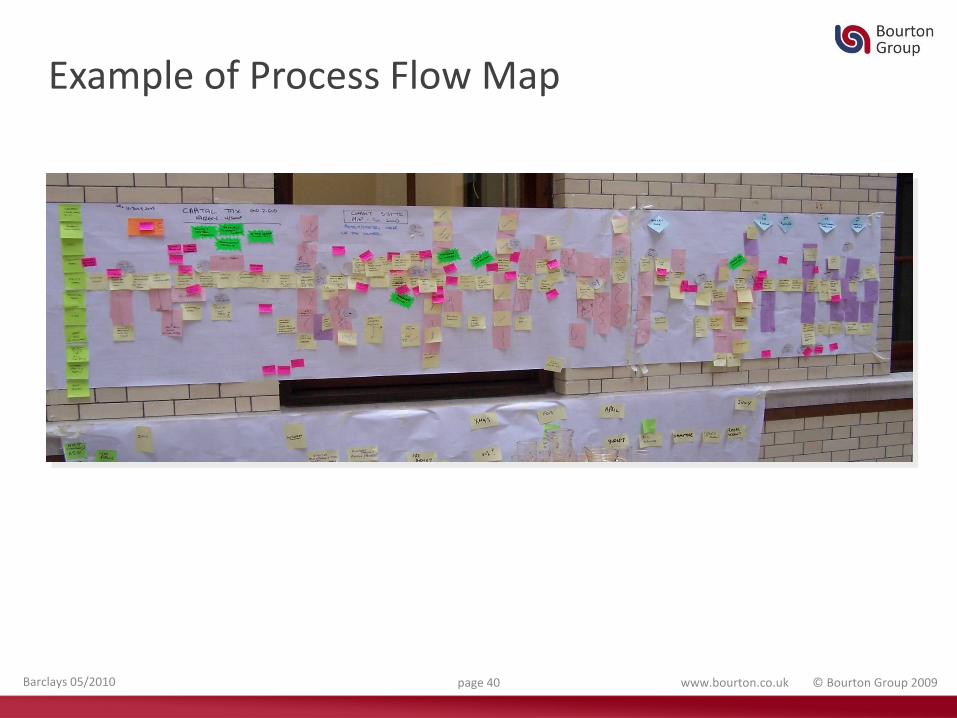
Example of Process Flow Map
Barclays 05/2010 page 40 www.bourton.co.uk © Bourton Group 2009

5 Why’sWhat is it?
This is a simple technique to help identify the root causes of a problem. Using the question ‘Why?’ five times (or more if necessary) it encourages people to probe below the surface to the underlying reasons for a problem existing.
What can it be used for?
During team-based problem-solving this technique helps to measure the extent of a problem by identifying root causes and influential factors. It can be used for the same purposes as a fishbone diagram.
Example PROBLEM
WHY
WHY
WHY
WHY
WHY
Operator slipped
Oil on floor
Machine leaking oil
Bearing leaking
Bearing cage broken
No preventative maintenance
Barclays 05/2010 page 41 www.bourton.co.uk © Bourton Group 2009

Sustainable Improvement – requires a solid foundation
You should ask killer questions about each step
The 7 wastes (how many can you spot?)
5 S (does the place look tidy and organised?)
Visual management (do the information boards look up to date and tell you what’s happening?)
Standardised working (is there evidence of ‘one best way’)
Enhanced performance
Barclays 05/2010 page 42 www.bourton.co.uk © Bourton Group 2009
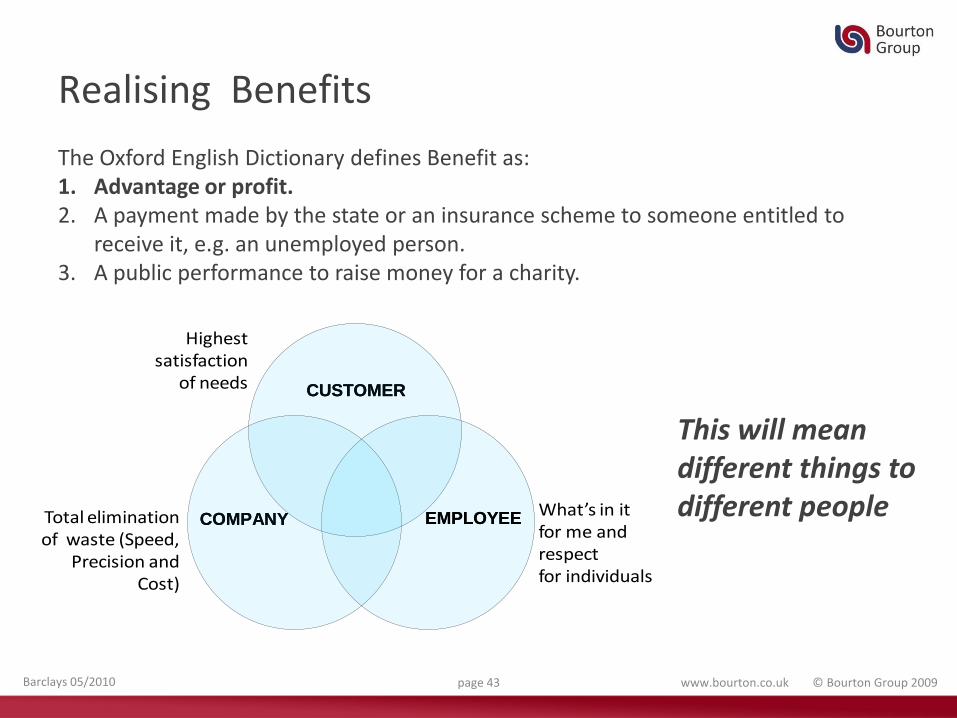
Realising Benefits
The Oxford English Dictionary defines Benefit as:1. Advantage or profit. 2. A payment made by the state or an insurance scheme to someone entitled to
receive it, e.g. an unemployed person. 3. A public performance to raise money for a charity.
What’s in it for me and respect for individuals
Highest satisfaction
of needs
Total elimination of waste (Speed,
Precision and Cost)
COMPANY
CUSTOMER
EMPLOYEECOMPANY
CUSTOMER
EMPLOYEE
This will mean different things to different people
Barclays 05/2010 page 43 www.bourton.co.uk © Bourton Group 2009

We can Categorise Benefits in different ways
Category Breakdown
Yield Type Cashable vs. Non-Cashable
Beneficiary Focused Customer vs. Employer vs. Employee
Specific Source Efficiency; Service; Quality; Time etc
How definable the Benefit is Tangible vs. Non-Tangible
How would you categorise these specific benefits?:• Reduced Lead-time to supply a given Service• Improved material yield• Fewer Customer Complaints• Better Employee Perception• Reduced Risk of Failure to deliver
What do you think your clients want from Lean?Barclays 05/2010 page 44 www.bourton.co.uk © Bourton Group 2009

Checklist for Improvement Events
Phase Benefit Focus Benefit Use Tools Available
Diagnostic High level, order of magnitude, often opinion based
Support identification of potential improvement opportunities
• Ease-Benefit Matrix•Basic Data collection•Benchmarking• Customer Feedback
Scoping More specific, types of benefit identified.Scale of benefit potential estimated
•Help to Scope event•Define type of Intervention• Focus the Team•Go vs. No-Go decision
•Basic Data Tools•Quad of Aims•Observation & Discussion
Current State Analysis
Specific definition of Waste based on real data & observation
•Baseline Current Performance
•Data analysis tools•Value Stream Mapping•Observation & recording
Future State Development
Specific Benefits identified by type with forecasts of when they will be realised
• Show success of the exercise• Justify any expense
•Benefits tracking spreadsheet• Comparison of predicted
future performance with Baseline
Implementation Realisation of forecast benefits
• Show that benefits are being realised
•Drive process owner to realise improvements
• Predicted Benefits built into Budgets & Objectives
•On-going performance Measurement
Barclays 05/2010 page 45 www.bourton.co.uk © Bourton Group 2009

Sectoral differences in manufacturingSector Characteristics Measures Killer Questions
Automotive (supply)
High level of integration with customer. Dedicated linesShould be Lean!
PPMSchedule adherence (OTIF)CI / cost reduction activityOEE
•How many line stoppers have you caused?
•What’s your warranty costs?•What’s your Stockturn?•How are your people ‘doing CI’
Aerospace Complex bills of materialLevels of Customisation High levels of design cost per unit
• Schedule adherence•Quality metrics•Design cycle time• Lead time to delivery
•How many of your programmes are overrunning?
•What’s your Stockturn?• Which suppliers are late?
Food Flat Bills of materials High numbers of SKU’s (packaging based)Low WIP, but high raw materials and finished goods stock
•OTIF•Quality- PPM•OEE• Yield
•What stock outs have you had for key clients?
• Customer visit reports?•Biggest causes of downtime?
Process Similar to food •As above plus Safety measures
Contract High design cost per unit Scope creep from original tender
• Schedule adherence• Cost / revenue tracking
•How effective is your supply chain?
•Design hours actual vs budget?
Barclays 05/2010 page 46 www.bourton.co.uk © Bourton Group 2009

“The greatest wasteis the waste we do
not see”
Shingo
Barclays 05/2010 page 47 www.bourton.co.uk © Bourton Group 2009

www.bourton.co.uk © Bourton Group 2009page 48Barclays 05/2010


