Download - Letter of Transmittal - zra.org.zm


Letter of Transmittal
OFFICE OF THE CHAIRMAN OF THE ZAMBIA REVENUE AUTHORITY GOVERNING BOARD
th29 May, 2017
Honourable Felix C. Mutati, MP
Minister of Finance
Ministry of Finance
P. O. Box 50062
LUSAKA
Honourable Minister,
ndI have the honour of presenting to you, on behalf of the Governing Board, the 22 Annual Report of the Zambia Revenue
Authority, covering the Financial Year 1st January 2016 to 31st December 2016.
This report has been prepared in accordance with the requirements of the Zambia Revenue Authority Act, Chapter
321 of the Laws of Zambia.
Yours faithfully,
Chileshe M. Kapwepwe
Chairman of the Governing Board
i

Vision
“To be a world class organisation recognised as a beacon of excellence in revenue administration.”
Mission Statement
“To optimise and sustain revenue collection through integrated, efficient,cost effective and transparent systems professionally managed to meet the
expectations of all stakeholders.”
ii

iii
Table of Contents
ii
ii
2
3 4
6
8
9
11
13
15
17
19
21
23
25
30
37
39
42
45
47
49
53
i
1
iv Acronyms
Letter of Transmittal
Vision
Mission Statement
Corporate Profile
Governing Board
Senior Management
Chairman’s Statement
Commissioner General's Report
Values
Overview of the Authority
Taxpayer Charter
Priorities for the Year
Enforcement and Compliance Actions
Business Development
Stakeholder Relations
Trends in Domestic and Global Economic Indicators
Tax Policy Support
Review of Revenue Performance
Performance of Operating Divisions and Corporate Initiatives
Managing Public Confidence
Corporate Governance
Internal and External Scrutiny
Managing People
Information Technology and Physical Asset Management
Managing Resources
Financial Statements

iv
Acronyms
ART Antiretroviral Therapy
ASYPM ASYCUDA System Performance Measurement
B2B Business to Business
BDO Binder Dijker Otte
BSC Balanced Scorecard
BSC Balance Score Card
CPC Central Processing Centre
CSA Customs Self-Assessment
CSP Corporate Strategic Plan
ERMS Electronic Records Management System
ESA East and Southern Africa
EU European Union
FUAT Final User Acceptance Testing
IASB International Accounting Standards Board
IESBA International Ethics Standard Board for Accountantants
ISA International Standards on Auditing
KPI Key Performance Indicators
LME London Metal Exchange
MOSES Mineral Output Statistical Evaluation System
MoU Memorandum of Understanding
MP Member of Parliament
MTO Medium Taxpayer Office
MVCMP Mineral Value Chain Monitoring Project
NCC National Constraction Council
NeSW National Electronic Single Window
NIIE Non-Intrusive Inspection Equipment
OMC Oil Marketing Companies
OTA Office of Technical Assistance
PAYE Pay As You Earn
PWC PriceWaterhouseCoopers
RATSA Road Transport and Safety Agency
RDA Road Development Agency
RMIU Risk Management and Intelligence Unit
RTSA Road Transport & Safety Agency Zambia
SMM Senior Management Members
SSA Sub-Saharan Africa
STO Small Taxpayer Office
TPRC Tax Policy Review Committee
UAT User Acceptance Test
URA Uganda Revenue Authority
US United States
VAT Value Added Tax
VCT Voluntary Counselling and Testing
VDP Value for Duty Purposes
VLAN Virtual Local Area Network
ZABS Zambia Bureau of Standards
ZACCI Zambia Chamber of Commerce and Industry
ZDA Zambia Development Agency
ZICA Zambia Institute for Chartered Accountants
ZIPAR Zambia Institute for Policy Analysis and Research
ZRA
ZRAIC
Zambia Revenue Authority
Zambia Revenue Authority Integrity Committee
ACC Anti-Corruption Commission ASYCUDA Automated System for Customs Data
BMS Block Management Strategy
CIP
Customs Import Permit COMESA
Common Market for Eastern and Southern Africa
CSO
Central Statistical Office
CSR
Corporate Social Responsibility
DEC
Drug Enforcement Commission DFID
Department for International Development (UK)
GDP
Gross Domestic Product
GIZ
Deutsche Gesellschaft für Internationale Zusammenarbeit
ICF Investment Climate Facility ICT
Information and Communication Technology
IMF International Monetary Fund
LTO
Large Taxpayer Office
MCU Mobile Compliance Unit
NTA Norwegian Tax Administration
OSBP
One-Stop Border Post
PACRA
Patents and Companies Registration Agency
PFMRP Public Financial Management Reform Programme
PMDC
Performance Management and Development Contract
SADC Southern African Development Community SME Small and Medium Enterprises
SMTO
Small and Medium Taxpayer Office
UNCTAD
United Nations Conference on Trade and Development
VSAT
Very Small Aperture Terminal VSS
Voluntary Support Scheme
WCO
World Customs Organisation
WTO
World Trade Organisation

1
The Zambia Revenue Authority (ZRA) was established on
1st April 1994 as a corporate body, under the Zambia
Revenue Authority Act, Chapter 321 of the Laws of
Zambia enacted in 1993. Pursuant to this Act, ZRA is
charged with the responsibility of collecting revenue on
behalf of the Government of the Republic of Zambia under
the supervision of the Minister of Finance.
The operations of ZRA are overseen by the Governing
Board which, as provided for in the Act, comprises:
·the Secretary to the Treasury;
·the Permanent Secretary - Ministry of Justice;
·the Governor of the Bank of Zambia;
·a representative of the Law Association of
Zambia;
·a representative of the Zambia Association of
Chambers of Commerce and Industry;
·a representative of the Bankers' Association of
Zambia;
·a representative of the Zambia Institute of
Chartered Accountants; and
·two other members appointed by the Minister of
Finance.
The members of the Board elect the Chairman and the
Vice- Chairman from amongst themselves.
The Chief Executive Officer of ZRA is the Commissioner
General who is appointed by the President of the Republic
of Zambia.
Responsibilities
The main responsibilities of ZRA are to:
·properly assess and collect the following taxes,
duties, levies and fees at the right time:
§Income Taxes;
§Value Added Tax;
§Excise Duties;
§Customs and Export Duties;
§Mineral Royalty;
§Property Transfer Tax;
§Motor Vehicle Fee;
§Carbon Emissions Surtax;
§Insurance Premium Levy; and
§Tourism Levy
·ensure that all monies collected are properly accounted for and banked;
·properly enforce all relevant legislation and administrative provisions;
·provide revenue and trade statistics to the Government;
·give advice on Tax Policy to Government; and
·facilitate international trade.
Stakeholders
The stakeholders in the operations of ZRA include:
· the people of Zambia;
· the taxpayers;
· The Government of the Republic of Zambia;
· the Zambian business community and those
groups which represent their interests,
together with their professional advisors;
· banks and other financial institutions;
· members of Common Market for Eastern and
Southern Africa (COMESA), Southern African
Development Community (SADC), World
Trade Organisation (WTO) and other
countries transacting business with Zambia or
transiting goods through Zambia;
· tourists, travellers and traders crossing
Zambia's borders;
· Cooperating Partners, e.g. the International
Monetary Fund (IMF), World Bank, the
European Union (EU), and the Department for
International Development (DFID);
· the Governing Board, Management and Staff
of ZRA;
· the media; and
· Non-Governmental Organisations and other
interest groups.
Corporate Profile

Governing Board
2
Mr. Kamalesh M. Shah
Member
Dr. Denny Kalyalya
Member
Mr. Fredson K. YambaMember
Mr. Andrew M. MusukwaMember
Mr. Alfred J. LunguVice Chairman
Mrs. Tandiwe D. OtengMember
Ms. Chileshe M. KapwepweChairman
Mr. James KoniMember

3
Mr. Kwibisa Siyunyi
Mr. Benjamin SimpungweDirector Treasury Management
Mr. Clement M. Kasepa
Mr. Kingsley Chanda
Mrs. Suzyo Musukwa Ng’anduBoard SecretaryDirector Research & Planning
Mr. Kwegyer Msimuko
Senior Managementst as at 31 December 2016

Chairman's Statement
4
ndIt is with great pleasure that I present to you the 22 Annual Report of the Zambia Revenue Authority (ZRA) for
st stthe financial year 1 January 2016 to 31 December 2016. The report reviews, among other things, major economic developments during the year and their impact on the performance and operations of ZRA.
During the year under review, significant changes were made at senior management and Governing Board levels of ZRA. At management level, His Excellency the President of the Republic of Zambia Mr. Edgar Chagwa
thLungu, on 15 September 2016, in exercise of powers vested in him under the Zambia Revenue Authority Act appointed Mr. Kingsley Chanda as Commissioner General of the Zambia Revenue Authority taking over from Mr. Berlin Msiska. Mr. Chanda is not new in ZRA having served as Commissioner Customs and Excise before, and I have no doubt that he will deliver to the expectation of the appointing authority and the nation at large. On behalf of the Board and indeed on my own behalf, I take this opportunity to wish Mr. Chanda all the best in his new portfolio. In the same vein, I would like to thank Mr. Berlin Msiska, the former Commissioner General, for pioneering a number of modernisation reforms in ZRA and for his invaluable contribution to the Nation through this strategic institution.
At Board level, the Governing Board under the ndChairmanship of Mr. Mwila Lumbwe, was dissolved on 2
November 2016 and a new Board was constituted in January 2017. The Board would like to thank Mr. Mwila Lumbwe for his distinguished contribution and the able stewardship of the Board.
Major Economic Developments Affecting Revenue Performance
In 2016, there were many demands placed on the Authority as a result of the extremely difficult fiscal developments that were encountered during the year. As a consequence, revenue collection in 2016 posed several challenges emanating from both global and domestic factors.
On the global front the price of copper on the London Metal Exchange (LME) was lower in 2016 at US$4, 862 per metric tonne compared to US$5, 500 per metric tonne in2015. This exerted pressure on the overall balance of trade for Zambia as it resulted in the reduction of the value of exports of Zambia's major export commodity. Further, the reduced price of copper in 2016 adversely affected the profitability of most mining companies resulting in reduced receipts of company tax from the mining sector and a general reduction in tax collections from businesses that heavily relied on supplying goods and services to this sector. The lower copper prices also led to a decline in mineral royalty collections while Pay-As-You-Earn from the sector also declined as major mining companies reduced employment in line with lower profitability.
On the domestic front, Zambia's Gross Domestic Product (GDP) recorded a real growth of 3.4 percent in 2016 which was lower than the projected real growth rate of 5.0 percent. However, the 3.4 percent real economic growth
recoded in 2016 was higher than the 2.9 percent growth registered in 2015. The main drivers of growth during the year were the Wholesale and Retail Trade, Repair of Motor Vehicles and Motorcycles; Construction; Mining and Quarrying; Manufacturing; Education and Agriculture, Forestry and Fishing sectors which collectively accounted for approximately 66.1 percent of the total real GDP. The economy registered modest growth in 2016 despite pressures exerted by slower regional and global growth, lower copper prices and the electricity deficit.
In 2016, the average annual inflation rate was recorded at 18.2 percent and was 8.2 percentage points higher than the 10.0 percent recorded in 2015. The rise in the rate of inflation was influenced by increases in prices of food and non-food items and the depreciation of the Kwacha exchange rate against major trading currencies.
In line with the decline in the price of copper which is the country's major foreign exchange earner, coupled with the increased demand for US Dollars to finance importation of electricity, the average exchange rate in 2016 depreciated to K10.31 per US Dollar from an average of K8.63 per US Dollar in 2015.
Government's desire to sustain the mining sector amid persistent low metal prices on the international market led to a revision of the mining tax regime which necessitated the downward adjustment in the revenue projections for the year.
Revenue Performance in 2016
During 2016, the Authority collected K39, 217.94 million in gross taxes with the level of refunds standing at K7,974.75 million translating into a net tax collection of K31,243.19 million against the Parliament target of K33,299.40 million. Thus, the Authority's net revenue collection was K2,056.21 million or 6.2 percent below the target.
1In terms of revenue to GDP ratio, preliminary figures show that the ratio decreased in 2016 to 14.4 percent from 16.3 percent in 2015. The tax revenue base in 2016 was generally dampened by factors external to tax policy and administration such as the economic uncertainty caused by the August 2016 general elections, the low metal prices on the international market, unfavourable outturn in the
1 Central Statistical Office Preliminary GDP estimate for 2016

5
inflation rate and the shortfall in electricity supply. These factors in addition to others, resulted in the slowdown in economic growth evidenced by a reduced growth rate of 3.4 percent compared to 5.0 percent projected at the beginning of the year. Despite the challenging economic environment, there were many demands placed on the Authority from its principal stakeholders as a result of prevailing difficult fiscal developments. I am glad to report that the Authority was equal to the challenge and put in place a number of administrative initiatives that mitigated the situation. Initiatives included enhanced audits, the block management system, decentralisation of the mobile compliance unit, setting up of regional processing centres and anti-smuggling patrols. The tenacity with which the revenue collection effort was sustained and successfully executed is a clear demonstration of the Authority's resilience.
Operations
The modernisation agenda that the Authority has been undertaking over the last years is bearing fruit as it has resulted in provision of efficient services through robust and integrated systems in modern office infrastructure. In this regard, renovations, upgrading and construction of various infrastructure continued during the year.
The automation of our business processes remained high on our agenda during the year. In this regard, there was a roll-out of the Insurance Premium Levy module on TaxOnline for the management of Insurance Premium Levy. In order to streamline operations, TaxOnline and ASYCUDAWorld were interfaced. In addition, TaxOnline was also interfaced with the Patents and Companies Registration Agency (PACRA) system to allow for the ease of sharing information between ZRA and PACRA. With the e-payment solution now rolled out to 16 commercial banks, I am confident that the electronic payment uptake will significantly increase leading to enhanced efficiencies in revenue collection across all tax types. As regards the implementation of the Electronic Records Management System, requisite equipment was procured and the User Acceptance Testing of the System was successfully conducted with the pilot roll-out of the System expected in 2017.
I am happy to report that during the year, industrial relations remained cordial and no work disruptions were reported. I want to commend management and the Union for resolving industrial matters relating to staff remuneration and other conditions of service in a cordial manner.
General administration
During the year under review, the Governing Board approved the:
·Annual Report for the year 2015; ·Revised ZRA operational budget for the year
2016;·Audited Financial Statements of ZRA for the year
stended 31 December 2015;·Information Communication and Technology
(ICT) strategy;
·Adjustment to the Tax Appeals Office in the Office of the Commissioner General;
·Establishment of the Regional Offices for the Mobile Compliance Unit and recruitment of staff for the Unit;
· Restructuring of the Corporate Services Division;·Board Charter that spells out the authority,
responsibilities, membership and operations of the Board;
·Code of Corporate Governance; and·Disposal of ZRA obsolete and unserviceable
assets by Public Auction.
Following the creation of the Direct and Indirect Taxes directorates under the Domestic Taxes Division and the need to enhance staff complement under Commissioner General's Office, Finance Division, Information Technology and Investigations departments, the staff establishment was increased. Thus, at end 2016, staff complement stood at 1, 557 employees compared to 1,536 employees in 2015, representing an increase of 1.4 percent. Despite this increase, staff complement still remains below the approved establishment of 1, 739 employees. With improved budgetary allocation in 2017, I expect management to accelerate the recruitment process so that the Authority can operate at full establishment and ensure efficient service delivery to our stakeholders.
The business environment in which we operate is ever dynamic and it is therefore important that staff are constantly up to date with these developments if we are to remain efficient and effective. In addition, the advanced implementation of projects in the core Divisions of Domestic Taxes and Customs Services Divisions, meant that more resources had to be committed to capacity building of staff. Consistent with this, a total of 2,470 participants attended various training programmes in 2016 compared to 1,560 participants in 2015.
In conclusion, I would like to thank all cooperating partners who have continued to render financial, material and technical support to the Authority as it pursues its agenda of becoming a beacon of excellence in revenue collection. I would be failing in my duty if I did not recognise the commitment, perseverance and timely stewardship of the Governing Board in ensuring that this strategic institution delivers on its mandate of domestic revenue mobilisation. In the same vein, I want to thank management and staff for their commitment in ensuring that the Authority delivers revenue to the Treasury in the midst of economic and operational constraints.
Finally, I wish to thank the Minister of Finance, Honourable Felix C. Mutati MP, and his officials for giving me and the Board timely counsel that made it easy for us to carry out our oversight function over the affairs of the Authority.
Chileshe M. KapwepweChairman of the ZRA Governing Board

6
Commissioner General's Report I have the honour to highlight the operational performance of the Zambia Revenue Authority during the financial year
stended 31 December 2016. The report reviews tax revenue performance, the operations of the Authority and sets out the audited financial statements for the year under review.
The year 2016 was a difficult one as it continued to be characterised by a slowdown in economic activity that affected the whole sub-Sahara African (SSA) region.
2According to the International Monetary Fund (IMF) projections, the growth for the SSA region in 2016 slowed to an average of 1.5 percent, which is the region's lowest in the last 20 years, largely on account of lower commodity prices relative to previous years and a generally less supportive global economic environment.
The slowdown in both the domestic and global economy, therefore negatively affected tax revenue collection. The Authority collected K31, 243.19 million against the Parliament target of K33, 299.40 million and was therefore K2, 056.21 million or 6.2 percent below target. This underperformance was largely as a result of the economic slowdown during the year which arose from factors such as the uncertainty associated with the August 2016 election which stifled investments; the unfavourable outturn in inflation relative to the projection and persistent low supply of electricity, among other factors.
In order to give the mining sector relief in view of the low metal prices amid high operational costs, the government revised the mining tax regime by enacting a new
stgraduated mineral royalty regime with effect from 1 June 2016. This revision led to a downwards adjustment of the overall revenue target for the year to K32, 537.2 million. Therefore the revenue collection of K31, 246.2 million against this revised target registered a deficit of K1, 294.0 million or 4.0 percent. The tax revenue to GDP ratio stood at 14.4 percent in 2016 compared to 16.3 percent in 2015.
The underperformance of tax revenue was mainly on account of weak performance of domestic VAT, withholding tax, excise duties and trade taxes against their respective targets. However, despite the overall performance being below target, some tax types exceeded their targets. Specifically, company tax, PAYE, mineral royalty and export duty were all above their respective targets.
The year 2016 marked the beginning of the implementation of the 2016-2018 Corporate Strategic Plan (CSP) which was developed using the Balanced Scorecard (BSC) model. The new Plan was a shift in the orientation of the Key Performance Indicators from being 'activity' to 'result' based, which was meant to facilitate easy evaluation of the Plan. The Plan had a total of 78 Key Performance Indicators out of which 48 or 61.5 percent were fully achieved; one Key Performance Indicator or 1.3 percent was partially achieved; and 29 Key Performance Indicators or 37.2 percent were not met.
During the year, ZRA continued with active monitoring of risks through use of Key Risk Indicators for identified risks. Further, risk management was introduced at business unit
level and risk registers were developed for selected stations and units. The process of cascading down risk management to units is on-going. At operational level, risk management continued to be applied to aid decision-making processes in core business activities.
Under Business Continuity Planning, key activities undertaken during the year were the Crisis Simulation for senior management, training of business continuity coordinators and an actual recovery exercise at our Mansa Office following a fire incident which affected the station's operations. The Authority also continued to track actual disruptions that affected service delivery and responded swiftly to ensure efficient service delivery to our clients. Third party institutions were identified and partnered with for the purpose of ensuring continuity in an event of a disaster happening that could affect normal operations in tax collection and service delivery.
To address structural rigidities arising from the segmentation of our taxpayers that tended to hamper efficient and effective service delivery to our taxpayers, the Domestic Taxes Division was restructured. This restructuring established the Department for Indirect Taxes which is responsible for VAT and Excise duty and the Department of Direct Taxes responsible for all income taxes. However, the taxpayer segmentations of Large Taxpayer Office (LTO), Medium Taxpayer Office (MTO) and Small Taxpayer Office (STO) within each department have been retained. It is also my expectation that this restructuring will enhance our focus on the management of the various tax types, especially VAT and excise duty that have shown a downward trend over the years.
Further, to enhance our corporate image, the corporate communication strategy was reconfigured culminating in the setting up of a robust Public Relations Unit in the Office of the Commissioner General.
In an effort to widen the tax net and enhance compliance, TaxOnline was interfaced with the company and business registration system at PACRA. This interface has enabled the Authority to have access to the companies and businesses register in real time on company registrations, de-registrations, liquidations and receiverships which has enabled us to undertake proactive interventions such as debt collection where applicable.
2 IMF Regional Economic Outlook: Sub-Saharan Africa, October 2016

7
The interface between TaxOnline and ASYCUDAWorld was also implemented in 2016. The interface provides for automated transfer of Taxpayer Registration, Advance Income Tax compliance and VAT Deferment data from the TaxOnline System to ASYCUDAWorld. In addition, import and export data on ASYCUDA World is now shared with the TaxOnline System and subsequently used for credibility checks and validation of return declarations among other things. In addition, Domestic Taxes can now initiate appropriate tax type registration based on taxpayer import and export activities.
In order to enhance trade facilitation, the Authority revised the Central Processing Centres (CPCs) model, which entailed establishing a decentralised CPC model in order to facilitate regional centres in key customs operations such as Chirundu, Livingstone and Nakonde. The motivation was to minimise disruptions and ensure effective management of processing centres.
To ensure uninterrupted service delivery to our taxpayers, backup optic fiber links for Solwezi, Chingola, Kitwe, Choma, Livingstone and Vic Falls were installed. Further, the Authority successfully concluded the installation of Wi-Fi networks at 28 sites which were mostly customs services sites. The Authority also managed to implement optic fiber at Mpulungu Border Post.
With regard to the Mineral Value Chain Monitoring Project (MVCMP), the Mineral Production Reporting module and the Mineral Export Permit Module were developed. The piloting of the Mineral Production Reporting Module commenced in March 2016, and twelve mining companies were on this pilot. The Project also developed some minor modules such as the XRF module, for automated communication of the handheld analysers with the ASYCUDAWorld system and the quota count-off for export permit quotas in the same system. In addition, the Project commenced the development of several interfaces with other systems and the establishment of the Wi-Fi access for the XRF analysers in the areas they will be used.
In order to improve our work environment, the Authority continued to develop its physical infrastructure. With regard to housing infrastructure, the rehabilitation of a house in Mpulungu and the construction of 20 roomed student hostels at ZRA Training Centre in Lusaka, were completed. A forensic laboratory for the Investigations Department was established at Head Office while another laboratory for the Mineral Value Chain Monitoring Project was set up in Kitwe. The construction of the new Chanida Border infrastructure has also reached an advanced stage while selected offices at Head Office were rehabilitated. Other general infrastructure projects undertaken during the year included the refurbishment of the staff canteen at Mpendwa House in Ndola, construction of an auditorium with a seating capacity of 274 at the Training Centre in Lusaka and the paving of the driveway at Nakonde Border.
During the year, the Authority continued to monitor, on a quarterly basis, its performance against the set standards in the Taxpayer Charter. Like in the previous year, the performance was mixed. Despite encountering
challenges in meeting some performance bencmarks, the Authority’s performance against Charter standards was generally satisfactory.
The Authority continued to engage different stakeholders on tax matters as a way of enhancing tax compliance and dissemination of tax information. The modes of engagement were through workshops, open days, tax clinics, roadshows, agriculture and trade shows, television and radio, taxpayer training and visits, and the distribution of tax literature. Some key stakeholders engaged during the year included the Zambia Chamber of Commerce and Industries, Zambia Development Agency and the National Construction Council, the Judiciary, Parliament and the Law Association of Zambia.
In line with our corporate objective of enhancing professionalism and productivity of our employees, a total of 2,470 participants attended various capacity building programme in 2016. This was done in order to promote an effective and efficient workforce that is responsive to ZRA's mandate. The Authority's staff strategy also focused on enhancement of supervisory skills at middle and lower management levels in which 205 members of staff underwent Supervisory Management Development Training. In order to ensure high levels of integrity amongst staff and protect public resources, the ZRA Integrity Committee conducted integrity awareness workshops in 24 stations for staff and other stakeholders on the dangers of engaging in unethical behaviour.
I would like to thank the Minister of Finance Honourable Felix Mutati, MP and his officials for their support and guidance to me since my appointment as Commissioner General. I also wish to pay tribute to my predecessor Mr. Berlin Msiska for initiating several modernisation initiatives within ZRA designed to enhance revenue collection and service delivery. It is my intention to continue building on this foundation. Let me also thank the Governing Board of the Authority for its counsel and diligence in ensuring that management performs its work in a professional manner in achieving its corporate objectives.
Finally, I would like to thank both management and members of staff for their tireless effort in ensuring that we deliver on our revenue collection mandate. With the resolve exhibited in the past year, I have no doubt that working together we will surely attain higher goals in 2017.
Kingsley ChandaCommissioner General

8
Values Our commitment to serving Government, taxpayers, employees and other stakeholders is reflected in our Corporate Values:
Integrity : exhibiting the highest standards of personal probity and behaviour;
Professionalism: performing official duties with skill, care and diligence; and providing the public with service and advice in a professional manner;
Fairness : performing official duties in an impartial manner free of political, personal or other biases;
Equity : treating all taxpayers, colleagues and members of the public equitably in accordance with the provisions of legislation and procedures in force;
Courtesy : treating all taxpayers, colleagues and members of the public with courtesy and being sensitive to their rights, duties and aspirations;
Teamwork : working as a team, not only to reinforce each others' divisional functions, but also at a collegiate level in order to strengthen mutual confidence, respect and trust;
Value for Money: avoiding wastage and extravagant use of resources;
Confidentiality : upholding the highest level of secrecy in respect of information that comes to one's knowledge in the course of duty;
Goal orientation: focusing on the development and achievement of personal and
organisational goals in the course of duty;
Innovation : consistently improving on quality, quantity, timeliness and cost.


Overview of the Authority
10
The following section provides an overview of the Authority's Corporate Strategic Plan (CSP); its administration; and the Taxpayer Charter.
Corporate Strategic Plan 2016-2018
The year 2016 marked the beginning of the implementation of the 2016-2018 Corporate Strategic Plan with a new approach. The plan was developed using the Balanced Scorecard (BSC) model as opposed to the previous one which was driven by risk management. The other feature of this Plan is a shift in the orientation of the Key Performance Indicators from being 'activity' to 'result' based; which is meant to facilitate easy evaluation of the Plan.
In keeping with the BSC model, the CSP has the following four pillars with their respective Strategic Objectives (SOs) to support ZRA's Vision, Mission and Values:
·BSC Financial Results – SO 1: To optimise revenue collection
·BSC Business Processes – SO2: To improve operational efficiency and develop infrastructure
·BSC Employee Satisfaction – SO3: To enhance the professionalism and productivity of the human capital
·BSC Customer Satisfaction – SO4: To provide accurate, courteous, timely and professional services to internal and external customers
Corporate Governance and Administration of the Authority
1.0 The Governing Board
The Authority has a Governing Board which oversees its overall organisation and administration. The Board is constituted by the Minister of Finance and has representation from both the public and private sectors.
The year under review ended without the Governing Board in place following its dissolution by the Minister of Finance in November 2016.
The functions of the Board are carried out through the following Committees:
1.1 Audit Committee
The Audit Committee is responsible for overseeing and providing independent assurance and advice to the Board on the governance and risk management frameworks; effectiveness of internal controls; integrity of financial statements; compliance with relevant regulatory requirements and performance of the internal and external audit functions of ZRA.
1.2 Finance Committee
The Finance Committee is responsible for approving ZRA's financial policies, reviewing and approving guidelines that ensure proper accountability of operational funding and of revenue into the Treasury, approving policies that safeguard ZRA's assets and approving banking arrangements and guidelines.
1.3 Legal, Staff and Disciplinary Committee
The Committee provides guidance on all legal matters referred to it by management and on grievances referred to it in line with the Grievance and Disciplinary Procedures Code. The Committee also oversees issues related to the human resource which includes the recruitment of Senior Management staff, and the revision of conditions of service for staff, among others.
1.4 Customs Clearing and Forwarding Licensing Committee
The Customs Clearing and Forwarding Licensing Committee is responsible for approval of issuance and renewal of Customs Clearing and Forwarding Agent licences.
2.0 The Office of the Commissioner General
The Commissioner General, who is the Chief Executive Officer, is responsible for the day to day running of ZRA, under the direction of the Governing Board. In executing this mandate, the Commissioner General is assisted by the Senior Management
stMembers (SMM). The structure of SMM as at 31 December 2016 is depicted in Figure 1.

11
A number of changes were made to the structure during the year under review. The position of Commissioner Corporate & Board Secretary was frozen and a new position of Board Secretary introduced at Director level to take care of the secretarial functions of the Governing Board. The positions of Director Large Taxpayer Office and Director Small & Medium Taxpayer Office under Domestic Taxes Division were re-designated as Director Direct Taxes and Director Indirect Taxes respectively in order to prop up the performance of V AT and local excise duty.
Taxpayer Charter
The Taxpayer Charter prescribes the minimum standards of service that clients should expect from ZRA as it performs its mandate. The service standards outlined in the Taxpayer Charter can broadly be divided into two categories: a) Standards related to tax registration and advisory
services; and b) Standards related to the processing of tax refunds.
During the year under review, ZRA encountered challenges in meeting the performance standards with
respect to Customs Deposit refunds; Customs and VAT refunds resulting in average processing times that were above the standards stipulated in the Taxpayer Charter. The Authority, however, registered positive improvements on Income Tax refunds and thus recorded a positive score against the Charter standard. It should be noted, however, that a significant proportion of the refund claims usually have queries while others are submitted with incomplete information, resulting in delays in processing the refunds.
Notwithstanding these challenges, the Authority's performance, in respect of time in which refunds were processed, improved for Customs Deposit refunds and Income Tax refunds when compared to the 2015 performance. However, performance in respect of Customs and VAT refunds worsened in 2016. It should be further noted that, on average, only about 12.5 percent of the VAT claims submitted in 2016 were processed within the Charter standard of 30 days mainly due to logistical
3and staffing challenges that made it difficult to conclude disputed claims requiring audits, on time. The underperformance of the customs refunds standard was in part due to system challenges which affected the processing efficiency (See Figure 2).
Governing
Board
Commissioner
General
Commissioner
Customs Services
Director
Research and
Planning
Deputy
CommissionerHQ
Director
Information Technology
Director
Human Resource
Director
Direct Taxes
Director
Indirect Services
Director
Design and
Monitoring
Deputy
Commissioner
Operations
Commissioner
Domestic Taxes
Director
Project
Management
Director Internal
Audit
Director
Administration
Legal Counsel
Commissioner
Finance
Director
Treasury
Management
Director
Finance
Assistant Director
Appeals
Director
Investigations
Board Secretary
Chief Internal
Affairs Officer
Figure 1: Structure of Senior Management of the Authority as at 31st December 2016
3 Few staff to conduct audits and authorize VAT refunds

12
Figure 2: Efficiency of Tax Refunds Processing
System (average number of days) in 2016 and 2015
Performance with respect to advisory services was generally good during the year under review. Notably, Acknowledgements and Responses to Comments and Complaints were provided within 14 days in all the sampled cases. Furthermore, 98 percent of the clients surveyed indicated that they were treated in a private and confidential manner.
In addition, ZRA processed 91 percent of the tax clearance certificates within the set standard of 2 days, while 95 percent of the clients revealed that the tax information they received from ZRA was adequate. In comparison to 2015, ZRA registered service improvement in 6 out of 9 standards related to advisory services (See Figure 3). This improvement could be attributed to the increased uptake of the e-services implemented by ZRA. Further, there has been an increased use of emails to contact ZRA which makes it easy to promptly respond to taxpayers' queries. The Authority has also increased its taxpayer education activity through workshops, shows and radio presentations. This has increased tax awareness and tax knowledge among taxpayers. The setting up of a queue management system at the Lusaka Service Center has helped to significantly reduce the average waiting time for taxpayers and hence adding to improved service efficiency.
Figure 3: Effectiveness of Taxpayer Registration and
Advisory Services in 2016 and 2015
It is worth noting that during the year, performance improved for many service standards relative to the 2015 performance. Significant improvements were made with regard to Customs Declaration (from 59 percent to 80 percent) and Service Efficiency (71 percent to 78 percent) standards between 2015 and 2016. Furthermore, improvements were recorded in the percentage of complaints and comments acknowledged within 5 working days from 98 percent to 100 percent. However, the 2016 performance slackened against the 2015 performance for Tax Clearance Certificates (See Figure 3).
It is thus hoped that innovations such as the queue management systems will, in the coming year, be rolled out to other customer service centres around the country and particularly in Kitwe and Ndola so that service efficiency standards can further improve.


Priorities for the Year
14
Our strategic priorities for the year were anchored on the revised Corporate Strategic Plan (CSP) for the period 2016-2018. In line with the CSP's theme of “enhancing domestic tax revenue mobilisation,” business processes were automated and measures put in place to encourage the use of e-platforms for both return submission and payments. In order to counter base erosion through transfer pricing, the Authority prioritised among other initiatives capacity building for specialised audit skills. In order to ensure that the broad needs of taxpayers and employees are consistently and adequately given due attention, the Authority conducted surveys for both taxpayers and employees to identify and understand their critical needs with a view of inspiring our taxpayers to respond with increased voluntary compliance and motivating employees to work even harder.
Widening the Tax Net
Increasing tax collection from the Mining Sector
During the year under review, a number of milestones were achieved in the area of taxation of the mining sector. Under the Mineral Value Chain Monitoring Project (MVCMP), the major modules of the mineral monitoring framework were developed, namely the Mineral Production Reporting and the Mineral Export Permit Modules.
Piloting of the Mineral Production Reporting Module commenced in the first quarter of 2016, and twelve mining companies were on this pilot. The piloting of the Mineral Export Permit Module commenced in the fourth quarter and it targeted seven (7) of the mines that had already been on the production reporting pilot. This was specifically targeted at mineral exports.
The Project also developed some minor modules such as the XRF module, for automated communication of the handheld analysers with the ASYCUDAWorld system and the quota count-off for export permit quotas in the same system. Development of several interfaces with other systems also commenced. Training of XRF users continued and the equipment was distributed to all relevant boarder stations.
The Project further commenced the establishment of the Wi-Fi access for the XRF analysers in the areas where they will be used.
Various other trainings were offered during the year to both the Project Team members and the stakeholders in the use of the modules. The Project team members were also trained in South Africa in 'Statistical Method Validation in Analytical Laboratories' to help with the development of various policies and procedures in the management of the Laboratories yet to be established.
Several stakeholder engagement meetings and workshops were held to continue with the engagement of various relevant stakeholders in the process of the implementation of the Project.
Taxation of Small and Medium Taxpayers
The Authority continues to prioritise the taxation of the Small and Medium Enterprises (SMEs). During the year, the focus of GIZ support to SME taxation was to improve the quality of tax audits, increase public tax awareness and improve service delivery. To this effect, GIZ facilitated a mission visit of officers from the Bavarian Tax Authority in Germany for consultative meeting on capacity building. The officers held consultative meetings with the project team with the view of developing context and understanding of the audit support needed in good practice and techniques for Real Estate, Financial Services- other than Banking and Insurance and Services Sectors. Training materials have since been developed and training is expected to take place in 2017. Further training of trainers was conducted during the year in Sector Notes developed with the support of PFRMP under a capacity building initiative in audit techniques. The Notes were developed for Construction, and Wholesale and Retail Trade Sectors, which were identified as sectors holding huge revenue potential. The Notes and subsequent training will equip staff with knowledge of the sectors to enable them correctly and effectively conduct audits.
Under taxpayer awareness, the Project initiated and implemented the inclusion of tax syllabus in school curriculum from Grade one to Grade twelve. The syllabus scope and materials were developed and are now at phase 2 of the drafting process.
To assist with queue management, GIZ procured and installed an automated modern queue management system and furniture for the Taxpayer Service and Advice Centres at Head Office. This will enhance service delivery in the two offices.
In terms of filing compliance, the Small and Medium Taxpayer Office recorded filing compliance rates of 29 percent for Turnover Tax; 64.5 percent for VAT; 48.5 percent for PAYE and 18 percent for final income tax returns. This performance was still far below the CSP targets return filing rate of 40 percent; 86 percent; 60 percent and 50 percent respectively.
Enhancing revenue collection using the Block Management System
The Block Management System (BMS) has continued to be used as a tax compliance enhancing tool. In 2016, a total of K109, 000 was raised in fines for failure to use cash registers and display tax registration certificates. Furthermore, a total of 66 new registrations were made with VAT, Withholding tax, PAYE and Income Tax accounting for 5 each while 46 registrations were under Turnover Tax. The Taxpayer Population for Kamwala block stood at 309 for VAT; 352 for Income Tax; 566 for Turnover Tax and 352 for PAYE .
A total of K9.76 million in assessments was raised. When compared to 2015, the tax yield from audit assessments increased by 68 percent in 2016.

15
Mobile Compliance Enforcement Activities
In 2016, the Authority undertook various enforcement activities. The number of interceptions during the year was 9,480, representing a 228 percent increase from the previous year. Similarly, the value of these interceptions increased by 396 percent to K4, 455 million in 2016 from K899 million in 2015. The total revenue collected increased by 86 percent to K26.9 million in 2016 from K14.5 million in 2015.
The majority of cases handled in 2016 related to under-declaration, under-valuation, wrong tariff classification, forgery and smuggling of various commodities including liquor, cigarettes, semi processed tobacco, second hand clothes, cooking oil, groceries, motor vehicle spares and motor vehicles.
Improving operational efficiency
During the year under review, various projects were undertaken aimed at improving the operational efficiency of the Authority:
Physical Infrastructure Development
The following physical infrastructure projects were undertaken in the year 2016:
1. Housing Projects:
·Rehabilitation of a staff house that was burnt down by fire at Mpulungu;
·Completion of the construction of 20 roomed student hostels at ZRA Training Centre in Chelstone Lusaka
2. Office Building Projects:
·Creation of a forensic laboratory for the Investigations Department at ZRA Head Office;
·Creation of a laboratory for the Mineral Value Chain Monitoring Project (MVCMP) at Kitwe;
·Construction of the new Chanida Border infrastructure up to 97 percent completion;
·Rehabilitation of the selected offices at ZRA Head Office.
3. General Infrastructure Projects:
·Refurbishment of a staff canteen at Mpendwa House in Ndola;
·Construction of an auditorium with a seating capacity of 276 at the ZRA Training Centre in Lusaka up to 98 percent completion, and
·Paving of the driveway at Nakonde Border and construction of a guard house.
Electronic Records Management System
The implementation of the Electronic Records Management System, which aims at automating the storage and management of the Authority's records, reached an advanced stage. Additional equipment for the
Project, comprising document scanners, barcode readers and barcode printers were procured under the Public Finance Management Reform Programme (PFMRP). During the year 2016, User Acceptance Testing of the System was successfully conducted and preparations made for the Pilot roll-out of the System in 2017.
Transport
In 2016, the Authority procured a total of 11 motor vehicles to support the operations of the Authority at a total cost of K4, 362,577.56.
Enforcement and Compliance Actions
Customs Services Division
(a) Scanner Operations
The deployment of Non-Intrusive Inspection Equipment (NIIE) also known as scanners, have significantly contributed to the reduction of the customs processing time, thereby contributing to the reduction in the cost of doing business. In 2016, the use of scanners in the examination of imports and exports also continued to compliment the Authority's enforcement activities in the clearance of goods which resulted in increased compliance among importers and exporters. The proportion of the scanned trucks with discrepancies was 0.2 percent same as in 2015.
In the period under review, 83,764 trucks or 39.6 percent were scanned from a total of 211,412 that were recorded at Chanida Border Post, Chirundu One-Stop Border Post (OSBP), Kasumbalesa, Katima Mulilo, Kazungula and Mwami Border Posts. The proportion of the scanned trucks at 39.6 percent in 2016 was 17.2 percentage points higher than the 22.4 percent scanned in 2015. It should be noted, however, that very few scanning activities were undertaken at Kasumbalesa Border Post in 2016 due to the failure to secure the control room on time after the
rdbreak in on 3 July, 2016 (see Table 1 below).
Table 1: Scanner Activity Report for 2016
Port Total Truck
Traffic
Scanned Truck with discrepancies
Additional Revenue
Collected (K)
Chanida
4,419
4,419
16 40,197.2Chirundu
81,7990
46,5500
2 5,486.0Kapiri Mposhi Enforcement Centre
0 2,738,795.1
Kasumbalesa
82,474
5,643
51 266,598.5Katima Mulilo
11,249
5,821
0 0.0Kazungula
30,485
20,943
67 28,326.6Mwami
986
388
0 0.0Total 211,412 83,764 136 3,079,403.3

16
A total of one hundred and 136 trucks that were scanned at Chanida Border Post, Chirundu OSBP, Kapiri Mposhi Enforcement Centre (EC) (manual interventions mostly), Kasumbalesa and Kazungula Border Posts were found with various discrepancies and total additional revenue realised from these discrepancies amounted to K3,079,403.33. Refer to Table 1 above.
No scanning activities were undertaken at the Kapiri Mposhi Railway scanner despite it being operational due to non-availability of the goods trains.
(b) Border Enforcement
Enforcement and compliance activities are undertaken at various ports on risk based approach through inspections, road blocks and follow ups on intelligence information received from the various stakeholders. Compliance visits were also made to Bonded Warehouses and Customs Areas for inland ports.
A comparison in the value of goods detained and seized in 2016 indicates an increase of 63.1 percent compared to 2015 (See Table 2). The detentions and seizures were mostly related to the following:
·assorted alcoholic beverages, used clothing and cooking oil seized for the offence of smuggling or undervaluation;
·motor vehicles awaiting final clearance and those on expired bonding entries and expired Customs Importation Permits (CIPs);
·goods that had overstayed in Customs Areas; and
·goods pending payments.
Table 2: Detentions and Seizures in 2016 and 2015 (K'million)
Type 2016
2015
Change
% Change
Value of Detained Goods 79.1 44.0 35.1 79.8%Value of Seized Goods 23.2 18.7 4.5 23.9%Total 102.3 62.7 39.6 63.1%
Investigations
Mobile Compliance Unit
In 2016, ZRA accelerated its enforcement and compliance activities. A comparative analysis of the number and value of enforcement activities between 2016 and 2015 indicates that there was an increase of 225 percent in the number of activities undertaken and a 387.4 percent increase in value terms (See Table 3).
Table 3: Enforcement Outcomes in 2016 and 2015
Total 9,574 2,948 4,465 916 6,626 3,549 225% 387.4%
Category Number Value (K’ Mn) Variance (K’ Mn) % Variance
2016 2015 2016 2015 Number Value Number Value
Interception 9,480
2,869
4,455
899
6,611 3,556 230% 395.6%
Detentions (R.I.H)
30
41
7
9
-11 -2 -27% -22.2%
Seizures
64
38
3
8
26 -5 68% -62.5%
Investigations Unit
A total of 216 cases were handled in 2016 compared to 179 in 2015, representing an increase of 20.7 percent over the period. Of these cases, 100 were settled administratively, while 46 were prosecuted. The remaining 70 cases were carried forward to the following year.
The proportion of Customs and Excise, and Domestic taxes related cases handled during the period were 95 and 121 compared to 94 and 86 in 2015 respectively. This represents a 1.1 percent increase for Customs and Excise related cases and an increase of 40.7 percent for Domestic taxes related cases.
The total assessments from domestic taxes related cases were K211 million compared to K860 million in 2015, representing a reduction of 75.5 percent. The total assessments raised from customs-related cases were K288 million compared to K11 million in 2015, representing an increase of 2, 518.2 percent.
Domestic Taxes Division
The Authority continued with a multifaceted approach to address non-compliance during the year. The strategies included measures to foster voluntary compliance and those that seek to detect under-reporting and tax evasion so as to deter such vices.
a) Tax Audits
A total of 1, 100 comprehensive; 4, 000 issue-based and 1, 629 miscellaneous audits were conducted in the year. An amount totalling K3, 271.7 million was raised in additional taxes consisting of K2, 079.0 million; K599.8 million; and K592.9 million from these audits, respectively (see Figure 4 below).
Figure 4: Performance of Audit Activities

17
b) Block Management System
The Authority continued to use the Block Management system for compliance management of small taxpayers. In 2016, enforcement activities were concentrated in Block I (Kamwala) and Block II (Central Business District) areas. Fines amounting to K109, 000 were levied on taxpayers for failure to use cash registers and for not displaying tax registration certificates. Activities in the two areas included taxpayer education which resulted into 5 registrations each for VAT, income Tax and PAYE; 46 turnover registrations and 6 under Withholding tax. A total of K9, 765, 288 in assessments was also raised.
c) Taxpayer education
Following the enactment of the amended Constitution in 2016 which exempted gratuity and pension benefits from taxation, among others, the Authority embarked on taxpayer education surrounding the tax treatment of gratuity and pension payments. Taxpayers mostly sought to understand whether there was any distinction in terms of qualifying and non - qualifying gratuities; and the tax treatment of mid-term gratuities in view of the tax exemption provision on pensions in the Constitution. Another issue that was topical was the Insurance Premium Levy. Most Taxpayers wanted guidance on VAT registration status following the introduction of the Levy.
Business Development
Risk Management and Business Continuity Planning
Implementation of the risk management framework in line with the ZRA risk management policy remained among the priorities for the year 2016.
Following the assessment and analysis of the departmental and corporate risk profiles, active monitoring of risks was continued for the identified risks whose exposure was found to be moderate at divisional and corporate levels. The active monitoring was done through use of Key Risk Indicators for each of the risks, on which data was collected on a monthly basis for the purpose of gauging changes in exposure levels.
As a way of cascading risk management to lower levels, Risk registers were introduced at unit and station level. Unit Risk Registers were developed for Domestic Taxes Division, Customs Services Division, Corporate Services Division, Finance Division and Information Technology and Research and Planning departments. The risk training and sensitisation workshops were concluded for head office resulting in 25 out of the targeted 47 business units developing their respective unit risk registers. Risk registers for outer stations will be developed in 2017 once the budget is approved.
Further, the application of risk management at operational level continued and was conducted through the assessment and treatment of risks associated with processes in core business activities.
The Authority also sponsored a group of 18 risk managers from different divisions and departments to undertake a course in Risk and Compliance Management at University of Lusaka.
Under Business Continuity Planning, the authority undertook a number of activities aimed at assurance of its capability to 'protect against, reduce the likelihood of occurrence, prepare for, respond to, and recover from disruptive incidents when they arise'. Key among the activities were the Crisis Simulation for senior management; training for business continuity coordinators; education and awareness; and actual recovery exercises undertaken at the Mansa office after a fire incident that affected the station's operations. The Authority also continued to track actual disruptions that have been happening across the organisation which affected service delivery to the clients; the end results of which has been improvement in resolution by management and ultimate improvement in service delivery.
In the year under review, the Authority continued with the identification of third party institutions to identify continuity sites in the event of a disaster happening in any of our offices that could affect normal operations in tax collection and service delivery.
As part of the Authority's risk management activities, testing of core operating systems, including backups, continued to be a significant activity in ensuring that the organisation is able to withstand adverse happenings affecting core systems.
Implementation of TaxOnline
The major development under TaxOnline in 2016 was the roll-out of the Insurance Premium Levy module for the management of Insurance Premium Levy that was introduced in the 2015 budget to be collected by the Authority.
In order to ensure the successful roll out of the Insurance premium Levy, ZRA embarked on training for staff in Insurance Premium Levy. In addition, stakeholder engagement sessions were conducted with Insurance Companies.
ZRA has continued to conduct stakeholder engagements and open days so as to increase the uptake of e-services by taxpayers. A number of stakeholder engagements and open day sessions were held in 2016. These engagements resulted in improved usage of online services. In 2016, a total of 24, 502 new sign ups were recorded. In terms of registration, a total of 29, 360 registrations were submitted and processed electronically while 18, 525 registrations were submitted manually. With regard to return filing, a total of 853,520 returns were filed electronically while 57,357 returns were filed manually.

18
Table 4: Use of e-Services in 2015 and 2016
Description of Activity 2015 2016 % Change
1. Sign up 24,847 24,502 -1.3
2. Registrations by Type
i) Electronic 20,950 29,360 40.1
ii) Manual 27,535 18,525 -32.7
3. Return Filing by Type
i) Electronic 567,784 853,520 50.3
ii) Manual 87,876 57,357 -34.7
ASYCUDAWorld System Upgrade
A number of developments were undertaken on the ASYCUDAWorld. These included the following;
(i) The Central Processing Centre (CPC)
RemodelingThe Chirundu CPC was successfully implemented following its de-linkage from the Kabwe CPC. With this implementation, Chirundu has now been set up on its own as a CPC.
(ii) e-ManifestThe e-Manifest module was implemented at Kenneth Kaunda International Airport following the completion of the development works. This functionality was enhanced to include pre-clearance. The quality assurance and training process was also completed. Full implementation of this enhanced e-Manifest will be accomplished in 2017.
(iii) System InterfacesDuring the year the development of the interface between ASYCUDAWorld and the Mineral Output Statistical Evaluation S y s t e m ( M O S E S ) , a n d b e t w e e n ASYCUDAWorld and TaxOnline were completed and this is expected to enhance compliance.
(iv) External Email NotificationsThe functionality that enables the sending of ema i l s t o ex te rna l pa r t i es f r om ASYCUDAWorld was developed and completed during the year. Notifications can now be sent to importers and Agents to facilitate the clearance of goods.
(v) SADC Certificate of OriginThe SADC Certificate of Origin which previously was issued manually to importers to certify the origin of the goods was automated during the year and importers can now apply online for preferential consideration regarding the goods from the SADC region. This functionality has been
extended to goods originating from the COMESA region.
E-Payment
During the year, First Alliance Bank E-payment service was connec ted to p roduc t ion sys tems fo r ASYCUDAWorld and TaxOnline servers. Ecobank was also migrated to ASYCUDAWorld production, while First Capital Bank and United Bank of Africa were connected to ASYCUDAWorld and TaxOnline E-payment platforms. Furthermore Standard Chartered Bank was also connected to production TaxOnline E-payment system after a successful User Acceptance Test (UAT). All these developments are part of the Authority's continued work to enable various commercial banks provide e-payment services for taxes and duties from wherever there is connectivity.
As at the close of the year, a total of 16 commercial banks had fully rolled-out the e-payment functionalities on TaxOnline and ASYCUDAWorld. These are Access Bank, Banc ABC, Barclays Bank, Cavmont Bank, Citi Bank, EcoBank, First Alliance Bank, Finance Bank, First National Bank, First Capital Bank, Indo-Zambia Bank, Investrust Bank, Stanbic Bank, Standard Chartered Bank, United Bank of Africa and Zambia National Commercial Bank
Further, out of the above listed commercial bank, five (5) namely, Access Bank, Barclays Bank, Cavmont Bank, Finance Bank and the Zambia National Commercial Bank, had gone a step further and extended the e-payment platform to walk-in clients who are unbanked. The walk-in facility allows unbanked taxpayers to make e-payment of taxes over the counter at any of these banks.
Modernisation of Trade Logistics and Change Management Activities in 2016
The Authority continued with the implementation of strategies to improve trade facilitation by modernising trade logistics in the year under review. The following key activities were undertaken in 2016:
i) The connection of Mokambo Border Post and Ndola Port Office to the Central Processing Centre at Ndola (CPC-Ndola) while Nchelenge Border Post was connected to CPC-Kabwe in the first quarter of 2016;
ii) With the connection of the Zambia Bureau of Standards (ZABS) to the ASYCUDAWorld platform in April 2016, the pilot National electronic Single Window (NeSW) was rolled out at Chirundu OSBP;
iii) The Authority, in its capacity as a Lead Agency in the implementation of the NeSW spearheaded its official launch during the year, which was graced by the Minister of Commerce, Trade and Industry;
iv) A team led by Commissioner Customs Services

19
undertook a study tour to Uganda to appreciate how the Uganda Revenue Authority (URA) has implemented the Customs Self-Assessment (CSA);
v) Customs administrations of the Democratic Republic of Congo (DRC), the Direction General des Douanes et Accises (DGDA) and the Customs Services Division of the Zambia Revenue Authority held a second review meeting of the implementation of the action plan arising from the Memorandum of Understanding (MoU) for Customs Cooperation in Kinshasa DRC;
vi) The Authority received 24 multi-purpose electronic seals from COMESA which the team was testing before deploying them to the Stations for the continued implementation of the Electronic Cargo Tracking System (ECTS);
vii) Sensitisation workshops on the implementation
of the Customs Self-Assessment (CSA) were conducted for members of staff under the Customs Services Division while follow-up workshops for external stakeholders were also conducted during the year;
viii) Five (5) officers were sent for scanner training to
China in image analysis and container inspection courses in 2016;
ix) An UNCTAD sponsored Advanced ASYCUDA Technical training hosted by the Authority in 2016 and had a total of twenty (20) participants from seven (7) different countries;
x) Various short workshops conducted by UNCTAD on the implementation of the ASYCUDA System Performance Measurement (ASYPM) Project were also held for members of staff;
xi) Two (2) Customs officials from the Authority joined twenty (20) other participants from 11 countries in the ESA Regional for a Japan-Singapore Partnership programme on Customs Modernization for Africa training which was held in Singapore;
xii) The Authority also hosted a World Customs Organization (WCO) Transit Guidelines workshop for Eastern and Southern African (ESA) Region in October 2016;
xiii) The installation of the Nakonde Non-intrusive scanner was completed and the Final User Acceptance Testing (FUAT) was conducted and will be ready for operation once the construction of the access road is completed; and
xiv) The Risk Management and Intelligence Unit (RMIU) hosted a World Customs Organisation (WCO) Intelligence-Led Risk Management Workshop aimed at strengthening Intelligence Management capacity in ZRA. WCO guidelines
were used to form the basis for the development of the Intelligence Strategic Framework.
Stakeholder Relations
Cooperating Partners
In its quest to improve operational efficiency and service delivery, the Authority continued to collaborate with various cooperating partners during the year under review. The major cooperating partners and their areas of co-operation include the following:
The Public Financial Management Reform Programme (PFMRP)
The multi-donor support under the PFMRP administered by the World Bank continued covering a number of activities all aimed at enhancing compliance and broadening the tax base. Substantial progress was made on the Mineral Value Chain Monitoring Project (MVCMP), the Electronic Transit Monitoring System, monitoring of Balance of Payments, setting up of a forensic laboratory and the Electronic Records Management System (ERMS). Most of the procurements of surveillance tools and specialised equipment for investigations and Internal Affairs were done while the Case Management System was fully delivered. Audit sector notes for Domestic Taxes were also developed..A number of new activities were also commenced under the PFMRP support including the following: a feasibility study on electronic fiscal devices; upgrade of VSAT and LAN as well as procurement of UPS; and Customs Self-Assessment.
US Treasury - Office of Technical Assistance (OTA)
The US Treasury continued to provide technical support to the Authority in a number of areas such as the Debt Collection, Investigations, Internal Affairs and Tax Appeals focusing on the development of the right structures, business processes and procedures. Other areas included streamlining of the Authority's communication and outreach programmes in order to facilitate voluntary compliance. Support was also rendered towards enhancing the risk management capacity for Customs Services and initiation of self-assessment.
Deutsche Gesellschaft fur International Zusammenarbeit (GIZ)
During 2016, the Small and Medium Enterprise Taxation Project under the support of GIZ achieved the following milestones;
ØInstallation of the Electronic Queue Management system at the Lusaka Taxpayer Service Centre.
ØThere was a successful scoping of the curriculum for learners from primary school through to Secondary to include Tax Issues in the Zambian

20
Business curriculum.
ØCapacity building was provided for Domestic Taxes staff by the trainers from the Bavarian Tax Authority.
Local Partners
The Authority had collaborations with various governmental and non-governmental agencies on various fronts. These included the Ministry of Finance, Other Government Ministries and Departments, the Bank of Zambia, Radiation Protection Authority, Zambia Public Procurement Authority, Zambia Bureau of Standards, commercial banks, the Central Statistical Office (CSO), Zambia Development Agency (ZDA), the Anti-Corruption Commission (ACC), the Financial Intelligence Centre (FIC), the Drug Enforcement Commission (DEC), the Road Development Agency (RDA), the Road Transport and Safety Agency (RTSA), the Patents and Companies Registration Agency (PACRA) and the Zambia Police Service. The National Assembly of Zambia and the Office of the Auditor General also engaged through their oversight roles.
The Aids Health Care Foundation and CHAMP continued to support the Authority through provision of VCT, HIV test kits and related services. Vision Care/Tokyo Opticians also rendered free eye check-ups for staff. Herb Life, a wellness Company, also assisted ZRA with Wellness check-ups and related services.
Corporate Social Responsibility (CSR)
The Authority, in line with its Corporate Social Responsibility (CSR) policy continued to carry out a number of activities broadly in our four key CSR areas of: s u p p o r t t o e m p l o y e e s ; e n g a g e m e n t w i t h taxpayers/clients; support and collaboration with the community; and sustaining a healthy environment. The main activities for 2016 included the donation of a water pump to Chilelekelo Community School for the blind in Livingstone, donation of mealie meal to Kalabo District Hospital, Choongo School of the handicapped of Monze, Lubasi Orphanage and Maramba Old People's Home, both of Livingstone and also donated assorted goods to Chainama Hospital, Mental Health section as a way of commemorating the International Women's Day.
Furthermore, as a way of promoting wellness among staff, the Authority for the second year running, participated in the Southern Africa Inter-Revenue Games in Manzini, Swaziland and held a Sports Day for all employees in Lusaka. Staff Welfare and Employee Relations
HIV and AIDS
ZRA has in place an HIV and AIDS Workplace Policy which guides its strategies in the fight against the pandemic. Strategies towards mitigating the impact of HIV and AIDS in ZRA include: the HIV and AIDS Policy; the Peer Educators' Programmes; the Voluntary Support
Scheme (VSS); and the general Medical Scheme for members of staff of ZRA. However, Management is in the process of reviewing the HIV/AIDS policy to come up with the Employee Wellness Policy to encompass chronic diseases such as diabetes and cancer, among others.
As at end of December 2016, the ZRA Voluntary Support Scheme (VSS) had a membership of 621 out of a total workforce of 1,557 employees, representing 39.9percent of the total workforce. At the end of the year, 87 employees were accessing the anti-retroviral therapy (ART) under VSS, representing 5.5 percent of the total work force.
Employee Relations
During the period under review, the management-employee relations remained stable and conducive for business leading to the signing of the Collective Agreement for 2017 to 2018.


22
Trends in Domestic and Global Economic Indicators
The performance of the domestic and global economic variables such as movements in GDP, inflation, exchange rate, interest rates and commodity prices, have both direct and indirect impact on revenue performance.
Gross Domestic Product
4In 2016 Zambia's Gross Domestic Product (GDP) recorded a real growth of 3.4 percent compared to 2.9 percent in 2015. The economy came under strain in the period between 2015 and 2016 as external headwinds and domestic pressure intensified. The external headwinds the economy faced included slower regional and global growth and lower copper prices on the international market. On the other hand, the domestic pressures included the electricity crisis that intensified from mid-2015 to the end of 2016, negatively impacting all sectors of the economy.
The economic activities that recorded significant real growth in 2016 relative to 2015 include: Information and Communication; Public Administration and Defence; Compulsory Social Security; Mining and Quarrying; Financial and Insurance Activities; Construction; Education; Professional, Scientific and Technical Activities; and Administrative and support service activities.
Among the sectors that registered lower growth in 2016 than in 2015 were Financial and Insurance Activities; Construction; Transportation and storage; Electricity, Gas, Steam and Air Conditioning Supply; Arts, Entertainment and Recreation; Manufacturing and Human Health and Social Work activities which declined in real terms by 14.7 percentage points, 8.7 percentage points, 4.6 percentage points, 4.5 percentage points, 4.4 percentage points, 2.8 percentage points and 2.1 percentage points, respectively, from the 2015 level.
The structure of the economy across sectors remained fairly unchanged between 2016 and 2015 as evidenced by the sector contribution to real GDP (See Table 5). In terms of contribution, Wholesale and Retail Trade, Repair of Motor Vehicles and Motorcycles (22.2%); Construction (10.7%); Mining and Quarrying (10.5%); Manufacturing (8.1%); Education (7.6%) and Agriculture, Forestry and Fishing (7.0%) sectors were the main drivers of real GDP collectively explaining approximately 66.1 percent of the total real GDP (See Table 5 below).
Table 5: Growth and Share of Real GDP in 2016 and 2015
KIND OF ECONOMIC ACTIVITY
Percentage real growth
Percentage share of real
GDP
2016
2015
2016 2015
Agriculture, forestry and fishing
(0.5)
(7.7)
7.0 7.3
Mining and quarrying
7.0
0.2
10.5 10.2
Manufacturing
2.6
5.4
8.1 8.1
Electricity, gas, steam and air conditioning supply
(6.0)
(1.5)
1.5 1.6
Water supply; sewerage, waste management and remediation activities
(3.9)
(6.7)
0.3 0.3
Construction
9.3
18.0
10.7 10.1
Wholesale and retail trade; repair of motor vehicles and motorcycles
0.1
1.5
22.2 22.9
Transportation and storage
(4.0)
0.6
3.3 3.5
Accommodation and food service activities
1.0
(0.1)
1.8 1.9
Information and communication
18.7
2.5
4.0 3.5
Financial and insurance activities
(2.6)
12.1
3.7 3.9
Real estate activities
3.1
3.1
3.4 3.4
Professional, scientific and technical activities
5.3
1.1
1.8 1.8
Administrative and support service activities
6.8
4.0
0.9 0.9
Public administration and defense; compulsory social security
9.9 2.0 5.3 4.9
Education 5.8 0.5 7.6 7.4
Human health and social work activities
0.8 2.9 1.3 1.3
Arts, entertainment and recreation (0.6) 3.8 0.4 0.4
Real GDP Growth 3.4 2.9
Source: CSO
Inflation
The average annual inflation rate was 18.2 percent in 2016 compared to 10.0 percent recorded in 2015, thus registering an increase of 8.2 percentage points. The minimum annual inflation rate of 7.5 percent was recorded in December while the maximum annual inflation rate of 22.9 percent was posted in February 2016 (See Figure 4). The gradual fall in inflation during 2016 was a reflection of the decline in prices of both food and non-food items.
Interest Rates
Throughout 2016, the policy rate was maintained at 15.5 percent. However, commercial banks' lending rates increased to an average of 27.9 percent in 2016 from 21.0 percent in 2015 (see Figure 4).
Figure 4: Inflation and Interest Rates in 2016
Source: Bank of Zambia
4 This is the GDP series based on 2010 prices

23
Exchange Rates
During 2016, the Kwacha exchange rate appreciated against the US Dollar by 11.5 percent, with the record high exchange rate of K11.34 per US Dollar being posted in March 2016. The average exchange rate for the year depreciated to K10.31 per US Dollar from an average of K8.63 per US Dollar in 2015. This movement was largely influenced by the decline in the price of copper, the country's major foreign exchange earner, on the international market and the increased demand for US Dollars to finance electricity import bills (See Figure 5).
Figure 5: Exchange Rate Movement in 2016
Source: Bank of Zambia
Commodity Prices
In 2016, the price of copper on the London Metal Exchange (LME) at an average of US$4, 862.3 per metric tonne, was 11.6 percent lower than the average price of US$5, 500.5 per metric tonne in 2015. Similarly, the average outturn in the price of cobalt on the LME declined by 10.3 percent to US$25, 351.4 per metric tonne in 2016 from an average of US$28, 272.1 per metric tonne in 2015. Given that these metals are Zambia's major export commodities, the decline in their prices on the international market exerted pressure on the overall balance of trade. However, on the mitigating side was the favourable movement in the price of the major import commodity, crude oil, which declined by 19.2 percent to an average of US$42.2 per barrel in 2016 from an average of US $52.2 per barrel in 2015 (See Table 6).
Table 6: Commodity Prices in 2016 and 2015
Copper US$ per metric tone
Cobalt US$ per metric tone
Crude oil US$per barrel
2016
2015
2016
2015
2016 2015
Average
4,862.3
5,500.5
25,351.4
28,272.1
42.2 52.2
High
5,665.4
6,299.6
31,432.5
31,119.4
52.7 63.8
Low 4,461.9 4,628.2 22,291.7 23,821.0 29.0 35.9
Source: London Metal Exchange and Bank of Zambia
Figure 6 below depicts the monthly series of metal prices during 2016. It is observed that both the price of copper and that of cobalt tended to steadily increase during the year.
Figure 6: prices of Copper and Cobalt in 2016
Average monthly
Source: London Metal Exchange
The price of crude oil exhibited an upward trend during 2016, opening the year at US$29.0 per barrel and closing at US$52.7 per barrel (See Figure 7).
Figure 7: of Crude Oil in 2016 Average monthly price
Source: Bank of Zambia
Tax Policy Support
Tax Policy Review Committee
The Authority is a member of the Tax Policy Review Committee (TPRC) which is constituted every year by the Ministry of Finance to review tax and non-tax policy measures for possible inclusion in the national budget. The TPRC membership is one of the main avenues that ZRA uses, in line with its statutory mandate, to provide advice on tax policy to the Minister responsible for Finance. In this regard, ZRA participated in the development and design of tax policy for the 2017 national budget, including the drafting of the Budget Speech. ZRA also participated in drafting the layman's tax legislation.

24
Provision of Tax Revenue Data and Information
One of the statutory responsibilities of ZRA is to provide revenue and trade statistics to Government. Statistics provided by ZRA are used by Government to inform policy design and decision making. In this regard, ZRA provided revenue and trade data to a number of Government ministries and agencies. These included the Central Statistical Office, the National Assembly, Bank of Zambia, the Ministry of Finance, the Ministry of Commerce, Trade and Industry, and other public and private stakeholders such as universities, research institutes, students, business organisations and the media.
Budget Legislation
Parliament, in December 2016, approved the national st stbudget for the fiscal year 1 January 2017 to 31
December 2017, following its presentation to the House by the Honourable Minister of Finance in November 2016. In this regard, Parliament passed the Income Tax (Amendment) Act, the Value Added Tax (Amendment) Act and the Customs and Excise (Amendment) Act containing
stforty-six tax measures, which became effective on 1 January 2017. These included eleven income tax measures; twenty-three customs and excise measures; ten VAT measures and two cross-cutting measures.
As part of its taxpayer education programme, ZRA produced Budget Highlight Pamphlets for taxpayers and the general public, explaining the tax changes as announced by the Honourable Minister of Finance. In addition, ZRA staff were on hand to explain the budget changes at different post- budget discussion sessions held countrywide to explain the significance of the changes. Further, the Budget Highlight pamphlets, the (Amendment) Acts and the Budget Speech were posted on the ZRA Website.
Ministerial and Parliamentary Services
During the year under review, ZRA continued to interact with several stakeholders including Government Ministries, Government agencies and Parliament. ZRA appeared before the Committee on National Security and Foreign Affairs; Committee on Estimates for the 2017 Budget Estimates; and the Public Accounts Committee. ZRA also made written responses to various Government Ministries and departments.


26
Review of Revenue PerformanceStructure of the revenue system in 2016
The structure of tax revenue in 2016 was similar to that observed during the previous years, with income taxes being the largest source of revenue. In 2016, income taxes accounted for 57.7 percent of the total tax revenue, representing a 2.5 percentage point increase from the 2015 level. Value Added Tax (VAT) was the second largest source of tax revenue with a contribution of 25.5 percent to tax revenue collection in 2016. Unlike income taxes, the share of VAT in 2016 declined by 2.0 percent, largely owing to an increase in VAT refunds relative to the 2015 level. The contribution of excise duties at 10.4 percent in 2016 was marginally lower than its contribution in 2015. Customs and export duties collectively contributed 6.3 percent.
Figure 8: Proportion of Tax Types to Total Revenue 2012 – 2016
Within the income tax category, PAYE contributed the largest share at 45.1 percent with mineral royalty in second place at 22.7 percent. Company tax and withholding taxes accounted for 17.0 percent and 15.2 percent, respectively.
During 2016, net domestic VAT collections accounted for 1.2 percent of the total VAT with import VAT accounting for 98.8 percent. The contribution of customs and export duties to tax revenue collection continued to decline largely owing to the implementation of the various regional trade protocols such as those under SADC and COMESA. Within this segment, customs duty represented 98.2 percent while export duty accounted for the rest.
Tax Revenue Performance in 2016
In 2016, the Authority collected K39,217.94 million in gross taxes with the level of refunds standing at K7,974.75 million translating into a net tax collection of K31,243.19 million against the Parliament target of K33,299.40 million. Thus, the net revenue collection was K2,056.21 million or 6.2 percent below the target of K33,299.40 million.
This undesirable outturn was mainly on account of weak performance of domestic VAT, withholding tax, excise duties and trade taxes. In particular, domestic VAT, withholding tax, excise duties, import VAT and customs duty were below the Parliament target by K1, 406.9
million, K430.3 million, K392.9 million, K546.3 million and K505.9 million, respectively. However, company tax, PAYE, mineral royalty and export duty exceeded their respective Parliament targets by K804.7 million, K223.2 million, K164.0 million and K6.7 million (See Table 7 below). The tax revenue base in 2016 was generally dampened by factors external to tax policy. Key among the macroeconomic factors that negatively affected revenue performance was the economic uncertainty caused by the August 2016 general elections, unfavourable outturn in the inflation rate and the reduction in electricity supply. These factors coupled with others, resulted in the slowdown in economic growth evidenced by a reduced growth rate of 3.4 percent compared to 5.0 percent projected at the beginning of the year. During the first half of the year, most macroeconomic variables, including the exchange rate, metal prices and inflation, did not perform as initially projected, which adversely affected not only tax revenue collections but also profitability of businesses. In the first half of 2016, there was outcry from the mining industry for the need to revise the mining taxation policy, largely on account of the impact of persistent low metal prices on the international market and depreciation of the Kwacha exchange rate against the US Dollar, among other factors, which characterised the period spilling over from the second half of 2015. After a series of consultations, the Ministry of Finance approved the revision of the mining taxation
stregime effective 1 June 2016. Fundamentally, the revised regime is characterised by a sliding scale mineral royalty system as opposed to the one based on the type of mining which initially existed. Following the revision of the 2016 mining tax regime and other macroeconomic assumptions, the overall revenue profile was adjusted downwards. The revised revenue target stood at K32, 537.2 million and was K762.2 million lower than the Parliament target of K33, 299.4 million.
In the income tax category, company tax, PAYE and mineral royalty were above their respective Parliament targets by K804.7 million, K223.2 million and K164.0 million. Withholding tax was however below target by K430.3 million. In addition, the insurance premium levy was K6.8 million or 15.3 percent above target.
Domestic VAT posted a net collection of K96.5 million was K1, 406.9 million or 93.6 percent below its target.
Trade taxes and excise taxes performed below par in 2016. In particular, excise duties, import VAT and customs duty were K392.9 million, K546.3 million and K505.9 million below their respective target. On the other hand, export duty was K6.7 million or 23.6 percent above target (See Table 7 below).

27
Tax Types Actual Outturn
Target Variance of actual vs target
Percentage variance of
target
Percentage of GDP
Total Revenue 31,243.2 33,299.4 (2,056.2) (6.2)% 14.4%
I. Tax Revenue 31,188.8 33,265.7 (2,076.9) (6.2)% 14.4%
A. Income Taxes (Excluding Insurance Prem. Levy)
17,991.0 17,273.4 761.6 4.2% 8.3%
1. Company Tax 4,043.8 3,239.1 804.7 24.8% 1.9%
Non Mining Company Tax 2,754.2 1,870.7 883.6 47.2% 1.3%
Mining Company Tax 1,289.5 1,368.4 (78.9) (5.8)% 0.6%
2. PAYE
8,157.6
7,934.4
223.2
2.8%
3.8%
3. Withholding Taxes & others
2,736.5
3,166.8
(430.3)
(13.6 %)
1.3%
4. Mineral Royalty Tax
3,053.1
2,889.1
164.0
5.7%
1.4%
5. Insurance Premium Levy
50.8
44.0
6.8
15.3%
0.0%
B. Excise Taxes
3,250.7
3,643.6
(392.9)
(10.8)%
1.5%
1. Excise
Duties
1,990.9
2,543.1
(552.2)
(21.7)%
0.9%
2. Rural Electrification Levy
112.2
76.5
35.6
46.5%
0.1%
3. Fuel Levy
1,125.7
991.2
134.5
13.6%
0.5%
4. Carbon Tax
22.0
32.8
(10.7)
(32.8)%
0.0%
C. VAT on domestic goods
96.5
1,503.4
(1,406.9)
(93.6)%
0.0%
D. Trade taxes
9,799.9
10,845.3
(1,045.5)
(9.6)%
4.5%
1. VAT on imports
7,843.8
8,390.1
(546.3)
(6.5)%
3.6%
2. Customs Duty
1,920.8
2,426.7
(505.9)
(20.8)%
0.9%
3. Export Duties
35.3
28.5
6.7
23.6%
0.0%
Export Duty on Scrap metals
-
-
-
0.0%
0.0%
Export Duty on Cotton seed
1.5
1.5
-
0.0%
0.0%
Export Duty on Mineral Concentrates and Timber
33.7
28.5
5.2
18.2%
0.0%
II. Non Tax revenue
Motor Vehicle Fees
54.4
33.7
20.7
61.5%
0.0%
The performance of the individual tax types against the 2016 target and over the last five years is discussed below:
Income Taxes
Total Income taxes as a group were 4.2 percent above target in 2016. This was as a result of higher than programmed collections under company tax, PAYE and mineral royalty. When compared to collections in 2015, income tax collections increased by 9.0 percent in 2016.
Figure 9: Trend in Income Taxes 2012 – 2016
Value Added Tax
In 2016, K7, 940.3 million was collected in net VAT (domestic and import VAT) against a target of K9, 893.5 million and was K1, 953.2 million or 19.7 percent below target. Both domestic and import VAT were below their respective targets during 2016. On the domestic front, VAT collections were adversely affected by reduced consumption of products that attract VAT and also by
5increased refunds which rose by 5.0 percent in real terms from the 2015 level. Import VAT was dampened by reduced level of importation of taxable products, largely due to slowdown in economic activity during the year. As a result, VAT collections in 2016 were 3.6 percent in nominal terms below the collections recorded in 2015 (See Figure10)
5 Average inflation for 2016 was 18.2 percent as recorded by CSO.
Table 7: Tax Revenue Performance in 2016 (K' million)

28
Figure 10: Trend in VAT collections, 2012 – 2016
Excise Duties
The unfavourable performance of excise duty was largely due to declined collections of local excise duties on fuel as a result of the effect of Statutory Instrument (SI) No 21 of 2016 that suspended import excise duty on fuel leading to a reduction in uplifts from Indeni. The tax was also dampened by reduced imports of major excisable products such as motor vehicles and cigarettes, owing to the general slowdown in economic activity. In comparison to 2015, excise duty collections in 2016 marginally decreased by K3.2 million.
Figure 11: Trend in Excise Taxes Collections, 2012 – 2016 (K 'million)
Customs and Export Duties
A combination of customs and export duties recorded K1, 956.0 million in total collections against the Parliament target of K2, 455.2 million, thus posting a deficit of K499.2 million. This deficit was largely explained by lower collections under customs duty which were as a result of lower than projected importations of taxable products mainly due to the slowdown in business activity during the year. The collections of in 2016 were marginally higher than that recorded in 2015 as depicted in Figure 12 below.
Figure 12: Customs and Export Duty Collections, 2012 – 2016 (K' million)
Performance of Mining Sector Taxes
6Overall, mining tax revenues were above target by 2.1 percent. However between 2015 and 2016, mining tax revenue as a percentage of total tax revenue remained unchanged at 14.0 percent. In terms of contribution, mineral royalty accounted for 69.7 percent of the total mining tax revenue, then company tax at 29.5 percent and lastly export duty on mineral ores and concentrates at 0.8 percent. As a percentage of GDP, mining tax revenues declined to 2.0 percent in 2016 from 2.3 percent registered in 2015 (See Figure 13).
Figure 13: Tax Revenues from the Mining Sector, 2012 to 2016 (K' millions)
Contribution of Tax Types to GDP
The ratio of total tax revenue to GDP was recorded at 14.4 percent in 2016 which was 1.9 percentage point lower than the 16.3 percent posted in 2015. The reduction in the tax to GDP ratio was largely explained by reduced domestic economic activity as a result of reduced supply of electricity, low metal prices on the international market, a depreciating exchange rate, high interest rates and rising inflation.
The ratio of the main tax categories to GDP in 2016 when compared to 2015 was mixed. In particular, the ratio for income taxes decreased to 8.3 percent in 2016 from 9.0 percent in 2015. On the other hand, the ratio for domestic goods and services and trade taxes declined to 1.5 percent in 2016 from 2.6 percent in 2015 and to 4.5 percent in 2016 from 4.7 percent in 2015, respectively. Details of the ratio of individual tax types as a proportion of GDP in 2016 compared to 2015 are shown in Table 8.
Table 8: Total Revenue as Share of GDP in 2016 and 2015Tax Type Percentage
of GDP in 2016
Percentage of GDP in
2015Income Tax
8.3%
9.0%
Company Tax
1.9%
1.5%
Pay As You Earn (PAYE)
3.8%
4.1%
Withholding Tax
1.3%
1.3%
Mineral Royalty
1.4%
2.0%
Domestic Goods & Services
1.5%
2.6%
Excise Duty
1.5%
1.8%
Domestic Value-Added Tax (VAT)
0.0%
0.8%
Trade Taxes
4.5%
4.7%
Import VAT 3.6% 3.6%
Import Duty 0.9% 1.0%
Export Duty 0.0% 0.0%
Insurance Premium Levy 0.0% 0.0%
Total Revenue as % of GDP 14.4% 16.3%
GDP (K’ million) 216,826.3 183,790.4
6 Mining company tax, mineral royalty and export duty
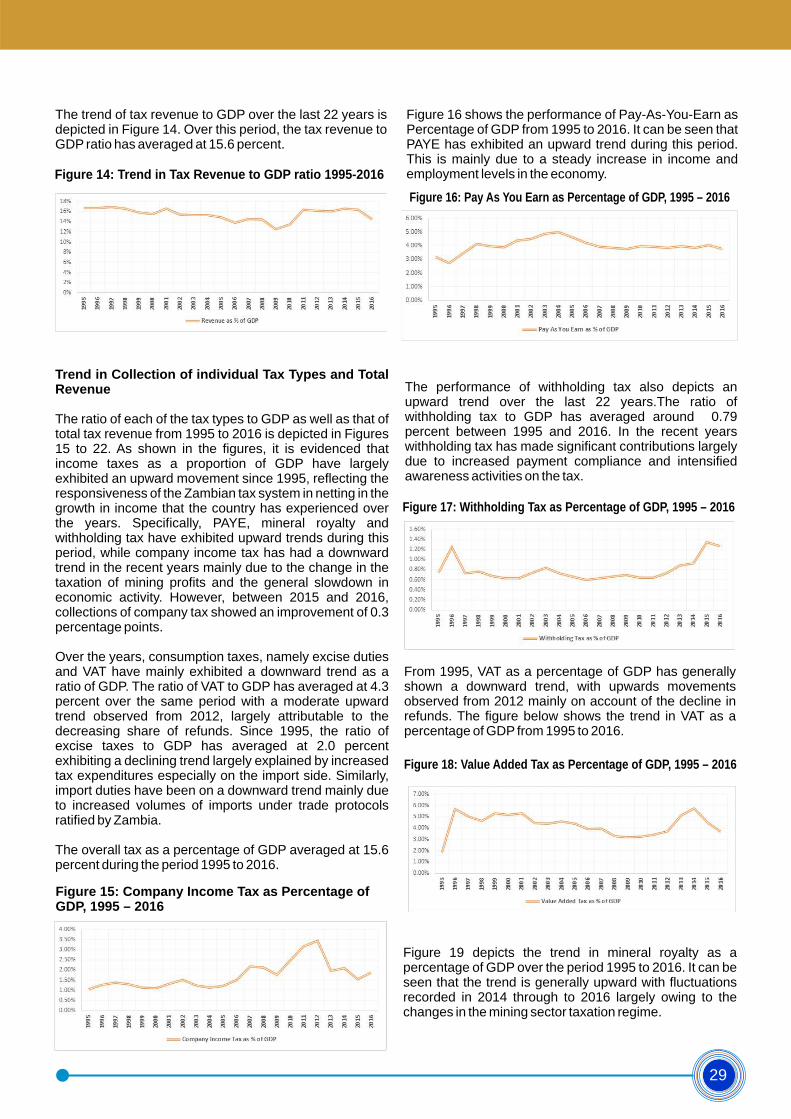
29
The trend of tax revenue to GDP over the last 22 years is depicted in Figure 14. Over this period, the tax revenue to GDP ratio has averaged at 15.6 percent.
Figure 14: Trend in Tax Revenue to GDP ratio 1995-2016
Trend in Collection of individual Tax Types and Total Revenue
The ratio of each of the tax types to GDP as well as that of total tax revenue from 1995 to 2016 is depicted in Figures 15 to 22. As shown in the figures, it is evidenced that income taxes as a proportion of GDP have largely exhibited an upward movement since 1995, reflecting the responsiveness of the Zambian tax system in netting in the growth in income that the country has experienced over the years. Specifically, PAYE, mineral royalty and withholding tax have exhibited upward trends during this period, while company income tax has had a downward trend in the recent years mainly due to the change in the taxation of mining profits and the general slowdown in economic activity. However, between 2015 and 2016, collections of company tax showed an improvement of 0.3 percentage points.
Over the years, consumption taxes, namely excise duties and VAT have mainly exhibited a downward trend as a ratio of GDP. The ratio of VAT to GDP has averaged at 4.3 percent over the same period with a moderate upward trend observed from 2012, largely attributable to the decreasing share of refunds. Since 1995, the ratio of excise taxes to GDP has averaged at 2.0 percent exhibiting a declining trend largely explained by increased tax expenditures especially on the import side. Similarly, import duties have been on a downward trend mainly due to increased volumes of imports under trade protocols ratified by Zambia.
The overall tax as a percentage of GDP averaged at 15.6 percent during the period 1995 to 2016.
Figure 15: Company Income Tax as Percentage of GDP, 1995 – 2016
Figure 16 shows the performance of Pay-As-You-Earn as Percentage of GDP from 1995 to 2016. It can be seen that PAYE has exhibited an upward trend during this period. This is mainly due to a steady increase in income and employment levels in the economy.
Figure 16: Pay As You Earn as Percentage of GDP, 1995 – 2016
The performance of withholding tax also depicts an upward trend over the last 22 years.The ratio of withholding tax to GDP has averaged around 0.79 percent between 1995 and 2016. In the recent years withholding tax has made significant contributions largely due to increased payment compliance and intensified awareness activities on the tax.
Figure 17: Withholding Tax as Percentage of GDP, 1995 – 2016
From 1995, VAT as a percentage of GDP has generally shown a downward trend, with upwards movements observed from 2012 mainly on account of the decline in refunds. The figure below shows the trend in VAT as a percentage of GDP from 1995 to 2016.
Figure 18: Value Added Tax as Percentage of GDP, 1995 – 2016
Figure 19 depicts the trend in mineral royalty as a percentage of GDP over the period 1995 to 2016. It can be seen that the trend is generally upward with fluctuations recorded in 2014 through to 2016 largely owing to the changes in the mining sector taxation regime.

30
Figure 19: Mineral Royalty as Percentage of GDP, 1995 – 2016
From 1995, excise taxes have averaged at 2.0 percent as a proportion of GDP and have continued on a declining trend largely due to increased tax concessions and increasing non-compliance arising from the large informal sector.
Figure 20: Excise Duties as Percentage of GDP, 1995 – 2016
As for import duties, the trend is similarly exhibiting a downward trend mainly due to increased volumes of imports under trade protocols ratified by Zambia which are duty free. Figure 21 below shows the performance of import tariffs as a percentage of GDP during the period 1995 to 2016.
Figure 21: Import Duties as Percentage of GDP, 1995 – 2016
Figure 22 depicts how tax revenues in nominal terms have increased since the inception of ZRA.
Figure 22: Tax Revenue (K' millions) 1995 – 2016
Performance of Operating Divisions and Corporate Initiatives
Customs Services Division
ZRA continued to pursue strategies aimed at facilitating trade by improving the management and processing of customs declarations and risk management and profiling. Customs Declarations
The registration to assessment conversion ratio indicates the volume of declared registrations that reach the assessment stage of the revenue collection process. In the year under review, 99.1 percent of the total transactions were assessed compared to 99.0 percent that were assessed in 2015. See Table 9 below.
Table 9: Registration to Assessment Conversion Ratio for all transactions in 2016 and 2015
Period Assessed Registered but not assessed
Total Percentage Assessed
Percentage registered but not assessed
2016
629,422
5,435
634,857
99.1%
0.9%2015 716,605 7,081 723,686 99.0% 1.0%
The marginal improvement in the registration to assessment conversion ratio in the period under review compared to 2015 can be attributed to the stabilisation in the operations of the Central Processing Centres (CPCs) and realisation of the expected benefit thereof.
Customs Refunds
The Authority administers a Duty Drawback Scheme that enables local manufacturers to claim back a proportion of duties paid on inputs used in the manufacture of exported goods. This Scheme is intended to make exports competitive. In addition, ZRA also administers other customs refunds arising from claims on import and export transactions.
Compared to 2015, the number of general refund claims increased by 109.6 percent with a corresponding growth in the value of refund claims of 82.6 percent (See Table 10). The major reason for the increase in the number and value of general refunds is due to the refund of export duty that was made to some mining companies after the re-exportation of the concentrate that was found unsuitable for consumption in Zambia. Furthermore, some Oil Marketing Companies (OMCs) that were claiming refunds that arose as a result of issuance of SI No.14 of 2014 and SI No. 15 of 2015 which suspended duty on fuel retrospectively continued claiming the duty they had paid before the SIs were issued.
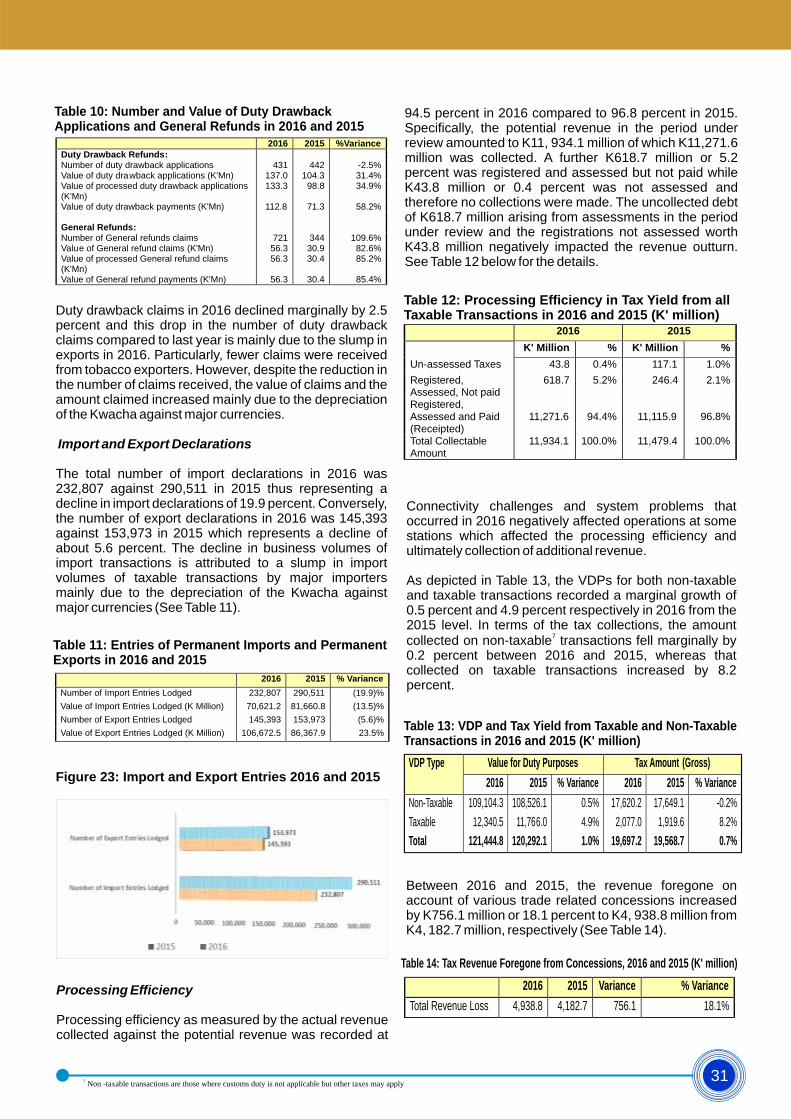
31
Table 10: Number and Value of Duty Drawback Applications and General Refunds in 2016 and 2015
2016 2015 %VarianceDuty Drawback Refunds:
Number of duty drawback applications
431
442 -2.5%
Value of duty drawback applications (K'Mn)
137.0
104.3 31.4%Value of processed duty drawback applications (K'Mn)
133.3
98.8 34.9%
Value of duty drawback payments (K'Mn)
112.8
71.3 58.2%
General Refunds:
Number of General refunds claims
721
344 109.6%Value of General refund claims (K'Mn) 56.3 30.9 82.6%Value of processed General refund claims (K'Mn)
56.3 30.4 85.2%
Value of General refund payments (K'Mn) 56.3 30.4 85.4%
Duty drawback claims in 2016 declined marginally by 2.5 percent and this drop in the number of duty drawback claims compared to last year is mainly due to the slump in exports in 2016. Particularly, fewer claims were received from tobacco exporters. However, despite the reduction in the number of claims received, the value of claims and the amount claimed increased mainly due to the depreciation of the Kwacha against major currencies.
Import and Export Declarations
The total number of import declarations in 2016 was 232,807 against 290,511 in 2015 thus representing a decline in import declarations of 19.9 percent. Conversely, the number of export declarations in 2016 was 145,393 against 153,973 in 2015 which represents a decline of about 5.6 percent. The decline in business volumes of import transactions is attributed to a slump in import volumes of taxable transactions by major importers mainly due to the depreciation of the Kwacha against major currencies (See Table 11).
Table 11: Entries of Permanent Imports and Permanent Exports in 2016 and 2015
2016 2015 % Variance
Number of Import Entries Lodged
232,807
290,511 (19.9)%
Value of Import Entries Lodged (K Million)
70,621.2
81,660.8 (13.5)%
Number of Export Entries Lodged
145,393
153,973 (5.6)%
Value of Export Entries Lodged (K Million) 106,672.5 86,367.9 23.5%
Figure 23: Import and Export Entries 2016 and 2015
Processing Efficiency
Processing efficiency as measured by the actual revenue collected against the potential revenue was recorded at
94.5 percent in 2016 compared to 96.8 percent in 2015. Specifically, the potential revenue in the period under review amounted to K11, 934.1 million of which K11,271.6 million was collected. A further K618.7 million or 5.2 percent was registered and assessed but not paid while K43.8 million or 0.4 percent was not assessed and therefore no collections were made. The uncollected debt of K618.7 million arising from assessments in the period under review and the registrations not assessed worth K43.8 million negatively impacted the revenue outturn. See Table 12 below for the details.
Table 12: Processing Efficiency in Tax Yield from all Taxable Transactions in 2016 and 2015 (K' million)
2016 2015
K' Million
%
K' Million
%
Un-assessed Taxes
43.8
0.4%
117.1
1.0%
Registered, Assessed, Not paid
618.7
5.2%
246.4
2.1%
Registered, Assessed and Paid (Receipted)
11,271.6
94.4%
11,115.9 96.8%
Total Collectable Amount
11,934.1
100.0%
11,479.4 100.0%
Connectivity challenges and system problems that occurred in 2016 negatively affected operations at some stations which affected the processing efficiency and ultimately collection of additional revenue.
As depicted in Table 13, the VDPs for both non-taxable and taxable transactions recorded a marginal growth of 0.5 percent and 4.9 percent respectively in 2016 from the 2015 level. In terms of the tax collections, the amount
7collected on non-taxable transactions fell marginally by 0.2 percent between 2016 and 2015, whereas that collected on taxable transactions increased by 8.2 percent.
Table 13: VDP and Tax Yield from Taxable and Non-Taxable Transactions in 2016 and 2015 (K' million)
VDP Type Value for Duty Purposes Tax Amount (Gross)
2016 2015 % Variance 2016 2015 % Variance
Non-Taxable 109,104.3 108,526.1 0.5% 17,620.2 17,649.1 -0.2%
Taxable 12,340.5 11,766.0 4.9% 2,077.0 1,919.6 8.2%
Total 121,444.8 120,292.1 1.0% 19,697.2 19,568.7 0.7%
Between 2016 and 2015, the revenue foregone on account of various trade related concessions increased by K756.1 million or 18.1 percent to K4, 938.8 million from K4, 182.7 million, respectively (See Table 14).
Table 14: Tax Revenue Foregone from Concessions, 2016 and 2015 (K' million)
2016 2015 Variance % Variance
Total Revenue Loss 4,938.8 4,182.7 756.1 18.1%
7 Non -taxable transactions are those where customs duty is not applicable but other taxes may apply

32
Risk Profiling Analysis
In 2016, ZRA continued to apply risk management techniques in the processing of imports and exports. This enabled ZRA to select entry declarations for different levels of scrutiny and hence allow for the effective and efficient utilisation of resources.
Table 15: 2016 Lane Analysis by Business Volume
Lane Green Blue Yellow Red Total
Number 184,135 109,351 200,045 132,726 626,257
Percentage 29.4% 17.5% 31.9% 21.2% 100.0%
Using this technique, 29.4 percent of the transactions were channelled to the green lane, hence not subjected to any scrutiny, while 17.5 percent were channelled to the blue lane requiring post clearance audits. A further 31.9 percent were channelled to the yellow lane requiring documentary check while the remaining 21.2 percent were subjected to physical inspection under the red lane (refer to Table 15).
Domestic Taxes Division
The Authority's tax administration approach is focussed on encouraging voluntary compliance, where taxpayers are expected to comply with their tax obligations without coercion. However, voluntary compliance, in a self-assessment system works better if the majority of taxpayers know what their obligations are and are able to comply with them. Therefore, an essential element of tax compliance is helping taxpayers understand their tax obligations through taxpayer education activities.
In light of this, ZRA conducted a number of taxpayer education activities and campaigns through radio programmes; workshops and seminars; presentations and mobile clinics.
Tax Registration
In 2016, ZRA continued with its tax registration activities. In this regard, a total of 48,085 registrations were done during the year compared to 49,524 in 2015. Out of this total, 17,717 were Taxpayer Identification Numbers (TPINs). Figure 24 below depicts the registration numbers from 2011 to 2016.
Figure 24: Number of Registrations 2011-2016
Registration by tax types during the year were 22,737 for various income taxes compared to 24,506 registered in 2015; 6,860 for PAYE compared to 1,274 taxpayers registered in 2015. VAT registrations were 760 compared to 835 taxpayers registered in 2015 (see figure 25). Other tax type registrations were 8 for Domestic Excise Duty; and 3 for Base Tax.
Figure 25: Registrations by Tax Type in 2016 and 2015
Return Filing
The total number of active registered taxpayers under various tax types during the year under review stood at 287,034. The number of active taxpayers under Income
8Tax , PAYE, VAT and Excise Duty was recorded at; 234,847; 37, 413; 14, 645 and 129, respectively.
A total of 249,858 tax returns were received in 2016 compared to 182,644 in 2015 representing an increase of 36.8 percent. Between 2015 and 2016, the movement in the number of filers for all tax types was favourable except for Property Transfer Tax that recorded a decline of 12.8 percent. Turnover tax (Individuals) recorded the largest increase in the number of those who filed returns at 80.4 percent; followed by corporate income tax at 55.2 percent and PAYE at 38.7 percent. The number of taxpayers filing Withholding Tax returns increased by 33.7 percent; Mineral Royalty by 11.8 percent while Property Transfer Tax return decline by 12.8 percent.
A total of 9,220 PAYE refund applications were received compared to 5,342 received in 2015 representing an increase of 72.6 percent. In monetary terms, K138.1 million was refunded in PAYE compared to K25.4 million refunded in 2015. The number of applications processed for income tax refunds drastically reduced to 247 from 1,359 in 2015 but the value increased to K181.3 million from K64.5 million in 2015 (See Table16).
Table 16: Income Tax Return Statistics
2016 2015 % Change
A.
Number of returns submitted: o/w
249,858
182,644 36.8%
Company tax
10,191
6,566 55.2%
Individuals
3,044
1,687 80.4%
PAYE for individuals
174,540
125,880 38.7%
Withholding tax
55,053
41,170 33.7%
Property Transfer Tax
4,169
4,781 -12.8%
Mineral Royalty
2,861
2,560 11.8%
B. Number of refund Applications: o/w
9,467
6,701 41.3%
PAYE for individuals 9,220 5,342 72.6%
Income Tax 247 1,359 -81.8%
C. Value of Refunds paid (K’ million):o/w 319.4 89.9 255.3%
PAYE for individuals 138.1 25.4 443.7%
Income Tax 181.3 64.5 181.1%
8 This includes those registered for corporate income tax, mineral royalty, turnover tax, insurance premium levy, presumptive tax and property transfer tax

33
With respect to VAT return submissions, 121,705 returns were received in 2016; an increase of 22.1 percent from 99,719 recorded in 2015. Of this number 51,700 were nil returns while 11,109 were repayment returns. These are significant increases of 53.0 percent and 10.3 percent respectively; compared to the numbers recorded in the previous year. Payment returns on the other hand, increased by 5.4 percent only (see Table 12).
A total of 3,081 refunds were paid out of 11,109 applications made in the year, representing a processing efficiency of 27.7 percent compared to 31.5 percent in 2015. The value of refunds processed increased to K7, 486.2 million compared to K6, 094.4 million in (See Table 17).
Table 17: VAT Return Statistics
2016 2015 % Change
A. Number of returns submitted: o/w
121,705
99,719 22.1%
Payment returns
58,896
55,863 5.4%
Nil returns
51,700
33,786 53.0%
Repayment (claims) returns
11,109
10,070 10.3%
B.
Value of returns submitted (K’ million):
Payment returns
7,698.7
8,013.9 (3.9)%
Nil returns
0
0
Repayment (claims) returns
6,848.0
6,478.7 5.7%
C.
Number of Refund Applications:
Number of Refund Applications
11,109
10,070 18.0%
Number of Refunds Processed 3,081 3,179 (32.0)%
D. Value of Refunds Paid (K’ million) 7,486.2 6,094.4 22.8%
Domestic Tax Audit Performance
Tax audits ensure that taxpayers correctly assess and report their tax obligations. Beyond this, tax audits are used as a deterrent for tax evasion as taxpayers are made aware that attempting to avoid tax will result in a high likelihood of detection and imposition of sanctions as specified in the law. In Table 18 below, the number of audits conducted and the value of associated taxes collected in 2016 are presented.
The total number of audits carried out in 2016 was 6, 729. The largest number of audits were under STO were 3, 746 audits were conducted, followed by MTO with 2, 340 audits. LTO recorded 643 audits with 270 conducted by LTO mining and 373 by Non-mining Units. Total taxes collected from these audits were K3, 271.7 million, out of which K1, 093.1 million were penalties and interest charges for non- compliance with tax regulations. Out of the total collections, Mining accounted for K1,085.6 million; Non-mining in LTO accounted for K1,720.7 million, while K344.2 million was fromr MTO and K121.2 million for STO (See Table 18).
Table 18: Audit Activity in 2016
Type of Audit Number of Audits Tax collected (K’ Mn)
Interest(K’ Mn)
Penalties(K’ Mn)
Total (K’ Mn)
Large Taxpayer Office: Mining
Income tax 9 1.4 0.3 - 1.7
PAYE
7
1.2
0.1 - 1.2
VAT
174
458.2
0.1 303.6 761.8
Integrated
80
70.2
189.1 61.5 320.9
Sub Total
270
531.0
189.6 365.1 1,085.6
Large Taxpayer Office: Non-Mining
Income tax
32
394.8
2.6 1.0 398.3
PAYE
11
16.7
1.3 - 18.0
VAT
158
294.1
5.7 48.8 348.6
Integrated
172
620.9
207.1 127.8 955.7
Sub Total
373
1,326.5
216.7 177.6 1,720.7
Medium Taxpayer Office
Income tax
530
74.7
12.9 0.0 87.6
PAYE 36 6.9 1.9 0.0 8.8
VAT 1,001 129.6 3.8 69.8 203.2
Integrated 773 36.4 4.2 4.1 44.6
Sub Total 2,340 247.5 22.8 73.9 344.2
Small Taxpayer Office
Income tax 650 31.8 26.3 - 58.0
PAYE 38 20.4 21.3 - 41.7
VAT 0 - - - -
Integrated 3,058 21.5 - - 21.5
Sub Total 3,746 73.6 47.6 - 121.2
Grand Total 6,729 2,178.6 476.6 616.5 3,271.7
The largest yield of additional taxes from audits was from VAT under the Mining Unit with collections of K458.2 million; followed by income tax and VAT under the Non-mining Unit in LTO with collections of K394.8 million and K294.1 million, respectively.
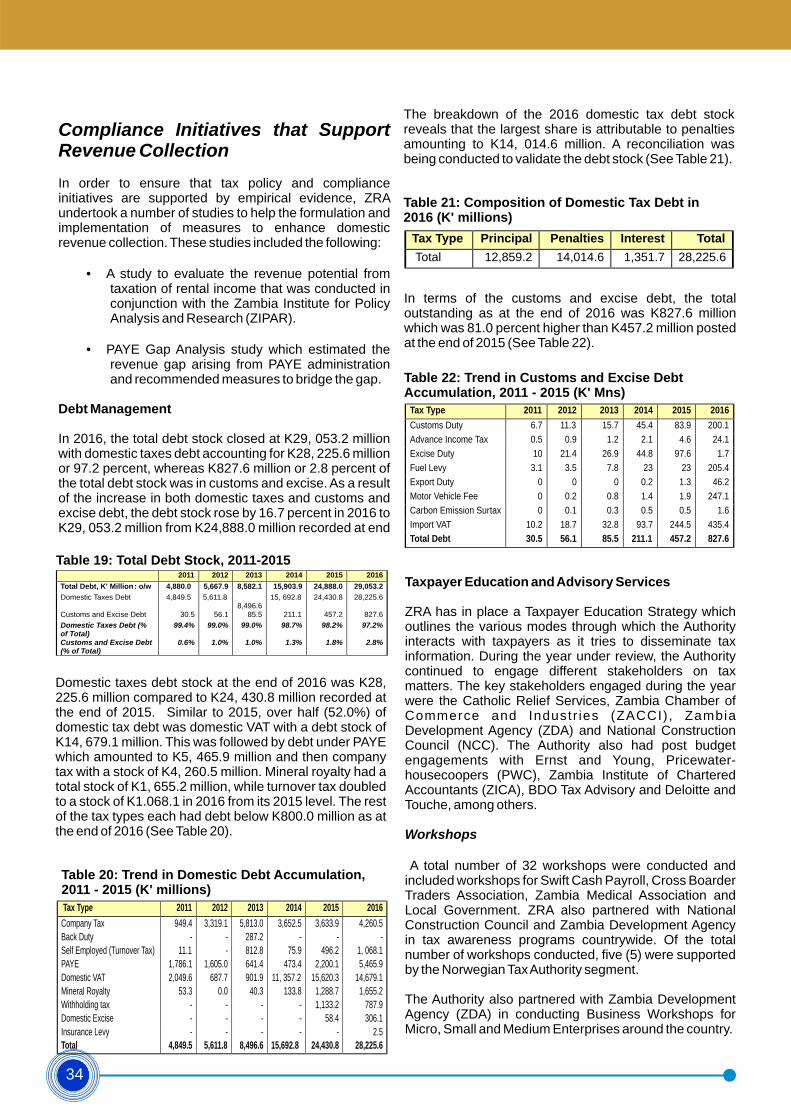
34
Table 19: Total Debt Stock, 2011-2015
2011 2012 2013 2014 2015 2016
Total Debt, K' Million:
o/w
4,880.0
5,667.9
8,582.1 15,903.9 24,888.0 29,053.2
Domestic Taxes Debt
4,849.5
5,611.8
8,496.6
15, 692.8 24,430.8 28,225.6
Customs and Excise Debt
30.5
56.1
85.5 211.1 457.2 827.6
Domestic Taxes Debt (% of Total)
99.4%
99.0%
99.0% 98.7% 98.2% 97.2%
Customs and Excise Debt (% of Total)
0.6% 1.0% 1.0% 1.3% 1.8% 2.8%
Domestic taxes debt at the end of 2016 was K28, 225.6 million compared to K24, 430.8 million recorded at the end of 2015. Similar to 2015, over half (52.0%) of domestic tax debt was domestic VAT with a debt stock of K14, 679.1 million. This was followed by debt under PAYE which amounted to K5, 465.9 million and then company tax with a stock of K4, 260.5 million. Mineral royalty had a total stock of K1, 655.2 million, while turnover tax doubled to a stock of K1.068.1 in 2016 from its 2015 level. The rest of the tax types each had debt below K800.0 million as at the end of 2016 (See Table 20).
stock
Table 20: Trend in Domestic Debt Accumulation, 2011 - 2015 (K' millions)
Tax Type 2011 2012 2013 2014 2015 2016
Company Tax 949.4 3,319.1 5,813.0 3,652.5 3,633.9 4,260.5
Back Duty
-
-
287.2 - - -
Self Employed (Turnover Tax)
11.1
-
812.8 75.9 496.2 1, 068.1
PAYE
1,786.1
1,605.0
641.4 473.4 2,200.1 5,465.9
Domestic VAT
2,049.6
687.7
901.9 11, 357.2 15,620.3 14,679.1
Mineral Royalty 53.3 0.0 40.3 133.8 1,288.7 1,655.2
Withholding tax - - - - 1,133.2 787.9
Domestic Excise - - - - 58.4 306.1
Insurance Levy - - - - - 2.5
Total 4,849.5 5,611.8 8,496.6 15,692.8 24,430.8 28,225.6
The breakdown of the 2016 domestic tax debt stock reveals that the largest share is attributable to penalties amounting to K14, 014.6 million. A reconciliation was being conducted to validate the debt stock (See Table 21).
Table 21: Composition of Domestic Tax Debt in 2016 (K' millions)
Tax Type Principal Penalties Interest Total
Total 12,859.2 14,014.6 1,351.7 28,225.6
In terms of the customs and excise debt, the total outstanding as at the end of 2016 was K827.6 million which was 81.0 percent higher than K457.2 million posted at the end of 2015 (See Table 22).
Table 22: Trend in Customs and Excise Debt Accumulation, 2011 - 2015 (K' Mns)
Tax Type 2011 2012 2013 2014 2015 2016
Customs Duty
6.7
11.3
15.7
45.4 83.9 200.1
Advance Income Tax
0.5
0.9
1.2
2.1 4.6 24.1
Excise Duty
10
21.4
26.9
44.8 97.6 1.7
Fuel Levy
3.1
3.5
7.8
23 23 205.4
Export Duty
0
0
0
0.2 1.3 46.2
Motor Vehicle Fee
0
0.2
0.8
1.4 1.9 247.1
Carbon Emission Surtax 0 0.1 0.3 0.5 0.5 1.6
Import VAT 10.2 18.7 32.8 93.7 244.5 435.4
Total Debt 30.5 56.1 85.5 211.1 457.2 827.6
Taxpayer Education and Advisory Services
ZRA has in place a Taxpayer Education Strategy which outlines the various modes through which the Authority interacts with taxpayers as it tries to disseminate tax information. During the year under review, the Authority continued to engage different stakeholders on tax matters. The key stakeholders engaged during the year were the Catholic Relief Services, Zambia Chamber of Commerce and Industr ies (ZACCI), Zambia Development Agency (ZDA) and National Construction Council (NCC). The Authority also had post budget engagements with Ernst and Young, Pricewater-housecoopers (PWC), Zambia Institute of Chartered Accountants (ZICA), BDO Tax Advisory and Deloitte and Touche, among others.
Workshops
A total number of 32 workshops were conducted and included workshops for Swift Cash Payroll, Cross Boarder Traders Association, Zambia Medical Association and Local Government. ZRA also partnered with National Construction Council and Zambia Development Agency in tax awareness programs countrywide. Of the total number of workshops conducted, five (5) were supported by the Norwegian Tax Authority segment.
The Authority also partnered with Zambia Development Agency (ZDA) in conducting Business Workshops for Micro, Small and Medium Enterprises around the country.
Compliance Initiatives that Support Revenue Collection
In order to ensure that tax policy and compliance initiatives are supported by empirical evidence, ZRA undertook a number of studies to help the formulation and implementation of measures to enhance domestic revenue collection. These studies included the following:
·A study to evaluate the revenue potential from taxation of rental income that was conducted in conjunction with the Zambia Institute for Policy Analysis and Research (ZIPAR).
·PAYE Gap Analysis study which estimated the revenue gap arising from PAYE administration and recommended measures to bridge the gap.
Debt Management
In 2016, the total debt stock closed at K29, 053.2 million with domestic taxes debt accounting for K28, 225.6 million or 97.2 percent, whereas K827.6 million or 2.8 percent of the total debt stock was in customs and excise. As a result of the increase in both domestic taxes and customs and excise debt, the debt stock rose by 16.7 percent in 2016 to K29, 053.2 million from K24,888.0 million recorded at end

35
Open Days
Open day sessions were held at various shopping malls and central business places to educate taxpayers on e-facilities and other aspects of tax administration. The sessions were held at Government complex, Manda Hill Shopping Mall, Levy Shopping Mall and East Park Shopping Mall.
Tax Clinics and Roadshows
Alongside the workshops and Open Days, tax clinics and roadshows were held for various categories of taxpayers on e-services offered through TaxOnline and ASYCUDAWorld to enable them be more conversant with the Systems. Road shows were conducted in Lusaka, Mumbwa, Chongwe, Kafue, Mazabuka, Chirundu, Siavonga and Monze. In addition, tax lectures were conducted at various learning institutions as a way of cultivating a culture of paying tax among the general populace. A total of seventy-seven tax clinics were held.
Television and Radio Programs
A total of 80 television and radio programs were produced and broadcast to various audiences. The topics covered included Income Tax, Value Added Tax, Mineral Royalty, amongst others. Both live and recorded television and radio programs were done at the national shows.
Agriculture and Trade Shows
The Authority fully participated in all national and in some provincial Trade and Agricultural Shows where taxpayer education, with emphasis on e-services, was conducted. On-site taxpayer registrations were also undertaken. In addition, ZRA used both print and electronic media to provide tax information to clients.
Taxpayer Training
A total of 236 taxpayers were engaged through the TaxOnline project. The taxpayers were engaged through training. The objective was to increase taxpayer awareness on the e-services and initiatives being implemented, demonstrates how to use the e-system, and register and sign up taxpayers online.
The trainings on e-services was also conducted in Ndola to Members of the Sawmillers Association, commercial banks, SMEs, and members of the general public.
Taxpayer Visits
A total of 29 visits to mining related businesses, sponsored by the Norwegian Tax Administration, were done during the year under review.
Table 23: Number of Taxpayer Outreach Programmes in 2016
Type of Programme 2016 2015 % Change
Lectures 64 13 392.3%
Tax presentations to stakeholders
150
205
(26.8)%
Tax Clinics
77
38
102.6%
Radios/ TV programmes
80
103
(22.3)%
Door to door campaigns
121
79
53.2%
Total 492 438 12.3%
The ZRA Website continued to provide taxpayers access to e-services and enabled them to download tax information and other tax related documents. In addition to the website, the Facebook page proved to be a popular tool for taxpayer education programmes with the number of followers rising to 20,000 in 2016 from 15,000 in 2015.
In 2016, a total of 284,159 taxpayers contacted ZRA through the Advice Centre for the purpose of seeking clarification and other services on tax matters compared to a total of 77,784 in 2015. The modes of contact were mainly walk-ins. In 2016 a total of 5,123 e-mails sent to the advice e-mail address were responded to as compared to 4,769 in 2015.
Figure 26: Taxpayer Contact in 2016 and 2015
The use of the telephone as a means of interacting with ZRA, has become more popular due to the increased use of e-services. A number of taxpayers call the National Call Centre to enquire on various issues including status of their applications, system failures and general enquiries
Tax Literature
Various tax literature was printed and distributed to taxpayers at trade shows, workshops, road shows, tax clinic, front offices and other strategic places. These included practice notes, VAT liability guide, VAT guide, Frequently asked questions, new residents rebate, and many others.
Table 23 shows the number of engagements with taxpayers in 2016 in comparison with 2015.

36
among others. The National Call Centre received a total of 31,893 phone calls in 2016 compared to 28,343 in 2015, representing an increase of 12.5 percent.
Non-Compliance and Prosecutions
ZRA enhanced its compliance initiatives through monitoring of transactions and activities of taxpayers. Where non-compliance was detected, thorough investigations were conducted leading to prosecution in some cases. Investigations
A total of 216 cases were handled by the Investigations Department in 2016 compared to 179 in 2015,
representing an increase of 21 percent over the period. Of these cases, 100 were settled administratively, while 46 were prosecuted.
The proportion of customs and excise, and domestic taxes related cases handled during the period were 95 and 121 compared to 94 and 86 in 2015 respectively. This represents a 1 percent increase for Customs and Excise related cases and an increase of 21 percent for Domestic taxes related cases.
The total Assessments from domestic taxes related cases were K211 million compared to K860 million in 2015, representing a reduction of 75 percent. The total assessments raised from customs-related cases were K288 million compared to K11 million in 2015.


38
Managing Public Confidence
Professional Excellence and Staff Integrity
During the year under review, the ZRA Integrity Committee conducted awareness workshops in 24 stations for staff and other stakeholders. In line with Government's desire for public officers to exhibit high levels of integrity, ZRA heightened the fight against corruption. In this regard, one integrity awareness workshops for stakeholders was conducted in collaboration with the Department of Immigration, Drug Enforcement Commission, the Road Transport and Safety Agency (RTSA), Zambia Bureau of Standards (ZABS), Zambia Police Service and the Anti-Corruption Commission (ACC). The workshop was held in Solwezi.
In addition, a further nine integrity awareness meetings were held with Clearing Agents and Tax Advisors at Chirundu, Kariba, Kazungula, Katima Muli lo, Kasumbalesa, Kitwe, Livingstone, Ndola, and Victoria Falls stations.
It is important to note, that the Taxpayer Charter which sets out our service delivery levels also provides our
taxpayers a platform for demanding or expecting professionalism from our employees. The Charter is a public document and thus can be used to hold the Authority to account.
Minimising Compliance Costs
Beyond the taxes that taxpayers pay, they also incur compliance costs in the form of accounting costs; reporting costs; transport costs to Tax Offices and Banks; tax inspection costs and others. In order to understand and minimise these costs, ZRA conducts field surveys to gather data that informs initiatives aimed at reducing these costs. The surveys are conducted every two years, and in 2016, the surveys were targeted at all taxpayer segments including importers and exporters. The survey results showed that, generally, tax compliance costs declined in 2016 relative to 2014, largely on account of increased uptake of e-services by taxpayers in managing their tax compliance tasks. The output from the surveys will be used to continue improving taxpayer services.


40
Corporate Governance The Governing Board oversees ZRA's overall organisation and administration. Relevant systems, processes and procedures are in place to ensure implementation of good corporate practices. The organisational structure of the Authority is as depicted in Figure 1.
Performance of the Corporate Strategic Plan
The performance of the CSP in terms of the four Balanced Score Card (BSC) quadrants is highlighted below.
a) BSC Financial Results – SO 1: To optimise revenue collection
The Authority planned to meet this objective by focusing on meeting the annual revenue target for the review period through continuous refinement of measures aimed at increasing compliance, enhancing enforcement and managing the cost of collection.
There were a total of 24 KPIs under this strategic objective out of which 15 (62.5%) were fully met while 1 KPI (4.2%), relating to a transfer price audit, was still work in progress. The remaining, 8 KPIs (33%), were not achieved, including the revenue target.
b) BSC Business Processes - SO2: To improve operat ional eff ic iency and develop infrastructure
In meeting this strategic objective, the Authority undertook to implement a total of 28 KPIs out of which 17 (60.7%) were fully met and 11 (39.3%) were not. Among the KPIs ful ly met included stabil ising TaxOnline and ASYCUDAWorld, which registered average system availability of 99.1 percent and 98.7 percent respectively.
Other efforts under this strategic objective included the increase in uptake of e-payment services from 7 percent in 2015 to 48 percent in 2016; the commissioning of the Forensic Laboratory, and the construction of the Auditorium at the Lusaka Training Centre. Other projects were still in progress such as the mineral value chain, provision of Mobile-payment solutions, Bulk Data Analysis and the electronic records management system. These projects once implemented will enhance operational efficiency in the Authority.
c) BSC Employee Satisfaction SO3: To enhance the professionalism and productivity of the human capital
The Authority planned to meet this objective by implementing a total of 17 KPIs out of which 9 (52.9%) were achieved and 8 (47.1%) were not.
The Staff Performance Management and Development System (PMDS), was well implemented resulting in 95.1 percent of staff meeting or exceeding their performance expectation in 2016.
d) BSC Customer Satisfaction – SO4: To provide accurate, courteous, timely and professional services to internal and external customers
Under this objective, the Authority managed to achieve seven (77.8%) out of a total of nine (9) KPIs while two (22.2%) were not met. The key initiatives included conducting taxpayer education and outreach programmes, providing customer care training to front office staff and improving the dispute resolution process.
In terms of overall performance, the Corporate Strategic Plan had a total of 78 KPIs out of which 48 (61.5%) were met; one KPI (1.3%) was partially met; and 29 KPIs (37.2%) were not met. See Figure 27.
Figure 27: Overall Implementation of Corporate KPIs
Divisional and Departmental Functions
The core functions of ZRA are carried out by the Customs Services Division and the Domestic Taxes Division, both of which are classified as the operating divisions. These operating divisions were supported by the following Divisions and Departments: the Corporate Services Division; the Finance Division; the Human Resource Department; the Research and Planning Department; the Project Management Department; the Internal Audit Department; the Investigations Department; the Information Technology Department and the Internal Affairs Unit.
Below is a summary of the functions of all the Divisions and Departments.
Customs Services Division
The Division is responsible for charging, collecting, and managing customs duties, import excise and other import duties as mandated by the Customs and Excise Act, Chapter 322 of the Laws of Zambia. The division also administers the collection of import VAT. Other core functions include: licensing and controlling warehouses and premises for the manufacture of certain goods; and prohibition of imports and exports in line with the Control of Goods Act - Chapter 421 of the Laws of Zambia; and implementation of customs and trade agreements.

41
Domestic Taxes Division
The Domestic Taxes Division administers and collects all domestic taxes, including domestic excise duty. The Division carries out its mandate through a number of Acts which include: the Income Tax Act, Chapter 323 of the Laws of Zambia; the Value Added Tax Act, Chapter 331 of the Laws of Zambia; and the Property Transfer Tax Act, Chapter 340 of the Laws of Zambia and the Insurance Premium Levy Act No. 21 of 2015. The Division also collects mineral royalty, as authorised under the Mines and Minerals Development Act, No. 11 of 2015. Further, the division administers the collection of the tourism levy as prescribed under the Tourism and Hospitality Act.
Corporate Services Division
The Corporate Services Division carries out the central corporate functions for ZRA. These functions include Board Secretarial functions, legal affairs, administrative issues and other support services such as transport fleet management and security, development and maintenance of infrastructure, procurement, and stores management.
Finance Division
The Finance Division manages the accounting, treasury and debt management functions of ZRA. The accounting function involves management of operational funds, while the Treasury function involves the receipting and accounting for Government revenue and controlling the flow of revenue between ZRA, the commercial banks and the Bank of Zambia.
Human Resource Department
The Human Resource Department has strategic and policy oversight on all aspects of human resource management in ZRA, with the objective of maximising the value and productivity of staff. The Department also implements the Human Resource functions which include recruitment of staff, staff development, compensation, staff welfare, and payroll management, amongst other things.
Research and Planning Department
The Research and Planning Department is responsible for research, statistical analysis and tax policy coordination between the Ministry of Finance and ZRA, coordinating taxpayer education programmes, and managing corporate communications. The Department is also responsible for the development and implementation of business continuity planning and faci l i tat ing implementation of risk management practices, as well as monitoring and reporting on organisational performance. Further, the department is responsible for coordinating corporate and departmental planning and is the custodian of the corporate strategic planning and monitoring and evaluation frameworks.
Internal Audit Department
The Internal Audit Department provides assurance to management and the Audit Committee of the Governing Board on the effectiveness and reliability of internal controls, risk management and governance processes within the Authority. In addition, the Department is responsible for continuous evaluation of the efficiency, effectiveness and prudent use of resources in the Authority's business operations, projects and programmes as well as ensuring that its assets are safeguarded.
The Department follows up and assesses, on a regular basis, the level of implementation of its various recommendations agreed upon in audit reports and also coordinates the resolution of queries and implementation of recommendations from external audit functions such as the Auditor General's Office.
Project Management Department
The Project Management Department drives efficiency and effectiveness in project implementation within ZRA. It is the custodian of the Project Management Framework, and provides expertise for the specific needs of various projects. It is the project coordination and management hub within ZRA, acting as the epicentre for project templates, tools, frameworks, documents and expertise within ZRA.
Information Technology Department
The Information Technology Department implements ZRA's ICT strategies. This includes the development of new systems and the provision of day-to-day support for ICT infrastructure and services. The Department also assists in strengthening existing information systems and coordinates the integration of business systems. Furthermore, the Department facilitates electronic interfaces with external stakeholders and is responsible for modernising communication systems.
Investigations Department
The Investigations Department investigates tax offences under the various tax and related Acts. These include the Customs and Excise Act Chapter 322, the Income Tax Act Chapter 323, the Value Added Tax Act Chapter 331 of the Laws of Zambia and all other Acts administered by the Commissioner General. The Department also conducts anti-smuggling activities. Its final goal is to prosecute offenders, thus enhance tax compliance.
Internal Affairs Unit
The Internal Affairs Unit investigates cases of corruption, fraud, and other malpractices involving ZRA employees. The key purpose is to preserve the corporate integrity of ZRA. The Unit often works with other Government entities, such as the Zambia Police Service, the Drug Enforcement Commission, and the Anti-Corruption Commission in executing its mandate.

42
Tax Appeals Unit
The Tax Appeals Office is tasked with the responsibility of reviewing selected appeals from Taxpayers to the Commissioner General arising from decisions made by the Zambia Revenue Authority under all the Acts administered by the Commissioner General. In resolving tax disputes, the office seeks to ensure timely resolution. The office also undertakes various assignments as given by the Commissioner General.
Internal and External Scrutiny
Internal Scrutiny
Internal Audit
In 2016, the Internal Audit Department undertook 31 process audits and two (2) special reviews, out of which six (6) process audits were finalised and submitted to the Audit Committee of the Governing Board, while six (6) were deferred to 2017. The special reviews were still under assessment at the end of the year. A total of 16 audits were at draft report stage or awaiting comments from client Divisions and Departments within ZRA. In addition, the Department finalised 23 audits carried forward from 2015, bringing the total number of reports tabled before the Audit Committee in 2016 to 29 (See Table 24).
Audits and Investigations 2016 2015 Number of process audits 31 33 Number of process audits finalised 6 14 Number of special reviews and investigations undertaken
2 1
Number of special reviews and investigations finalised
0 0
Number of 2015 Audits finalised in 2016
23 22
Internal Affairs
The Internal Affairs Unit recorded a total of 68 cases of fraud and misconduct amongst members of staff in 2016 compared to 80 in 2015 as illustrated in the table 25 below.
Table 25 illustrates the cases received.
Table 25: Cases of Fraud and Misconduct by Employees in 2015 and 2016Type of offence 2015 2016 % Change
Fraud 6 9 50% Breach of Code of Conduct 16 27 68% Theft
4
2
(50 %)
Bribery
12
12
0%
Abetting smuggling
14
11
(21 %)
Other
28
7
(39 %)
Total cases investigated
80
68
(15 %)
During the period under review, 22 cases were recommended for disciplinary action.
Seven (7) cases were referred to Investigations Department with recommendations to collect taxes while three (3) cases were referred to the same Department with recommendations for further Investigations and possible prosecution of agents and importers.
Seven (7) cases were referred to Credibility and Controls with recommendations to suspend or revoke clearing agency licenses.
Notable during the year under review was a case under Ndola Central Processing Centre in which 15 Officers were charged for various offences and 27 Clearing Agents being recommended for suspension of their Licenses following revelations of suspected bribery between the Officers and the named employees of the said Clearing Companies.
Staff Integrity
The ZRA Integrity Committee (ZRAIC) which is responsible for upholding staff integrity continued to receive client feedback through its Secretariat. The Secretariat receives feedback using various on communication channels such as letters, email, telephone and suggestion boxes.
Table 26: Number of Complaints and Comments Received by ZRAIC
Year Complaints Comments Total 2016 23 32 55
2015 25 41 66
The number of comments and complaints received in 2016 decreased to 55 from 66 received in 2015, representing a 20 percent reduction (See Table 26).
Table 27 shows that the nature of comments received during the year decreased by 22 percent from those received in 2015.
Table 24: Audits and Investigations Undertaken in 2016 and 2015

43
Table 27: Nature of Comments Received
Taxpayer Feedback 2016 2015 % Change
Compliments 9 8 13%
Information 7 6 17%
Queries 13 9 44%
Suggestions 3 18 (83)%
Total 32 41 (22)%
Out of the 23 complaints received in 2016, the majority were related to alleged inefficiency, which accounted for 11 or 48 percent, followed by alleged professional misconduct which accounted for 7 or 30 percent of the total complaints received. Alleged fraud cases were 2 or 9 percent of all complaints received. There were 2 allegations of corruption received (See Table 28).
Table 28: Type of Complaints Received
Taxpayer Complaints 2016 2015 % Change
Inefficiency 11 12 (8)%
Tax Evasion 0 2 (100)% Smuggling 1 0 100% Professional Misconduct 7 6 17% Corruption
2
1
100%
Theft
0
1
(100)%
Fraud
2
3
(33)%
Total
23
25
(8)%
External Scrutiny
Parliamentary Committees
The Authority is a public body and as such its operations are subject to Parliamentary scrutiny. In this regard, ZRA provided several written responses to various issues raised by the House including responses to questions raised by Honourable Members of Parliament. Furthermore, ZRA also made oral submissions before different Committees of the House on various aspects of its operations.
Auditor General
The Office of the Auditor General also performs an oversight function on the operations of ZRA. This is meant to assure the public that tax revenue collected by the Authority on behalf of the Government and funds appropriated by Parliament for the Authority's operations are properly accounted for. Consequently, in 2016, the Authority was subjected to two (2) audits by the Auditor General: one report covering Revenue Collection activities and the other covering the Financial and Operational activities. A total of twenty (20) control weaknesses were highlighted in these reports. ZRA Management is in the process of addressing and implementing solutions to these findings.
Litigation
In the course of performing its statutory mandate of revenue collection, ZRA is involved in both civil and criminal litigation. Taxpayers have over time become aware of their right to challenge the decisions of ZRA and are therefore seeking the courts intervention whenever they feel aggrieved. In this regards, litigation remains an effective avenue of enforcing tax compliance and resolving disputes.
Civil Litigation
In 2016, the number of civil cases litigated by ZRA increased to 96 from 73 handled in 2015. Out of the 96 cases litigated in 2016, 31 were High Court cases, 28 were Tax Appeals Tribunal cases, Supreme Court had 19 cases and 15 were Industrial Relations Court cases (See Table 29). The majority of these cases were under the Customs Services Division followed by Domestic Taxes and Human Resource related cases.
Table 29: Tax Related Litigation in 2016 and 2015
Type of Court 2016 2015 % Change Magistrates Court 3 2 50% High Court 31 30 3% Supreme Court 19 9 111% Tax Appeals Tribunal 28 22 27% Industrial relations court
15 10 50%
Total Cases 96 73 32%
From the 96 cases that were litigated on in 2016, 81 cases or 84 percent were on customs and excise, direct taxes and VAT. The labour-related cases were 15 cases or 26 percent. A total of 30 cases were concluded during the
year out of which 24 cases were in favour of ZRA while 6 cases were in favour of taxpayers. The remaining 66 cases were still active in the various courts and at the Tax Tribunal as at the end of the year.
Criminal Litigation ZRA prosecuted a total of 46 cases in 2016, out of which 27 convictions were secured. Further, judgments in three (3) concluded cases were being awaited. As at end of the year, seven (7) cases were still undergoing trial while another seven (7) cases were withdrawn from prosecution for various reasons.
It is worth noting that there was a marginal increase of one (1) in the total number of cases handled and a drop of two (2) in cases convicted. However, the total value of cases handled increased to K34.1 million in 2016 from K10.8 million in 2015 (See Table 30). Further, in three (3) of the customs cases handled, the trial courts ordered forfeiture of subject goods (cigarettes) which were then disposed-off by way of destruction.

44
Table 30: Type of cases by Tax Type and Values in 2016 and 2015 Seizure of Goods
In the course of investigations, the Authority seized several goods that were the subject of various offences. Some goods were forfeited to the State and auctioned or donated to needy institutions in accordance with the laid down requirements under the law to recover taxes.
Cases closed by type
Customs &Excise
Domestic Taxes Total, 2016 Total, 2015
Number
Value (K'000)
Number
Value (K'000)
Number Value (K'000)
Number Value (K'000)
a) CivilSettlement
95
288
121
211
216 499 134 871,425
b) Prosecutions
Withdrawn
3
412
4
905.0
7 1,317.0 3 395.0Conviction & Fine
6
1,021
21
42.0
27 1,063.0 29 7899.0
Acquittal 2 1,200 0 0.0 2 1,200.0 2 0.0
Awaiting Judgement 3 345 0 0.0 3 345.0 3 345.0
Trial Stage 4 1,566 3 28555.0 7 30,121.0 6 2179.0Total Prosecutions 18 4,544 28 29,502 46 34,046 43 10,818
Grand Total 113 4,832 149 29,713 262 34,545 177 882,243

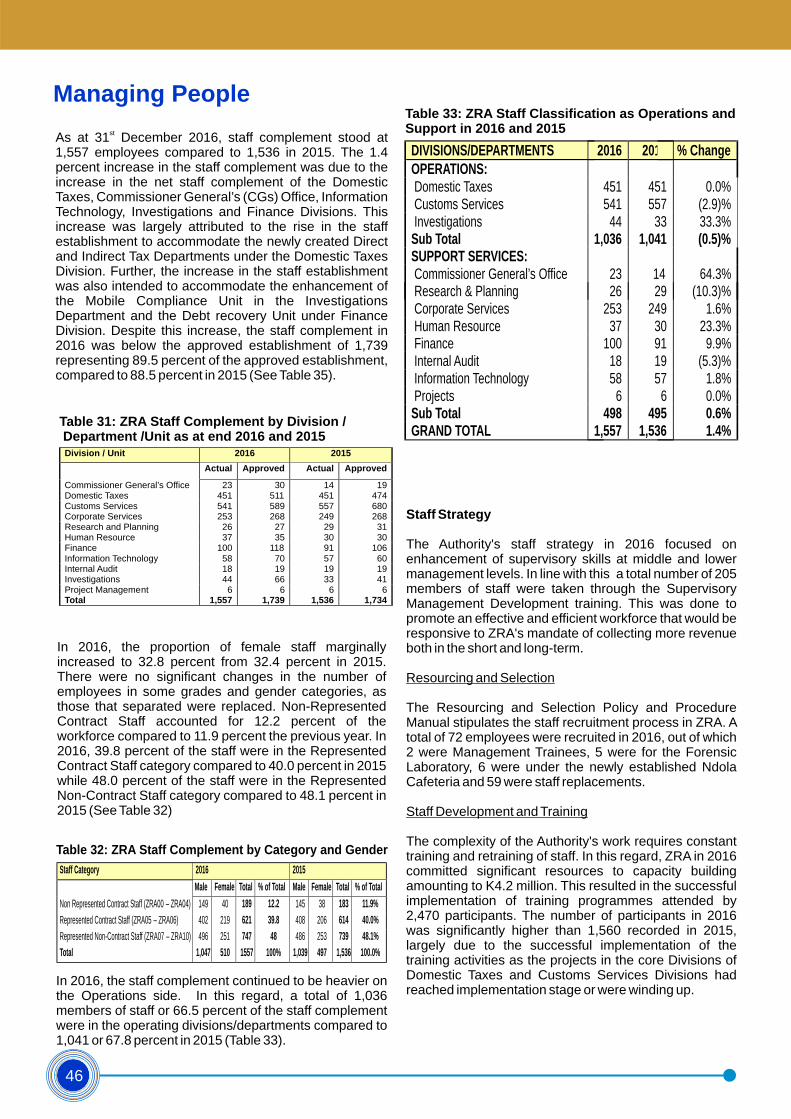
46
Managing People
stAs at 31 December 2016, staff complement stood at 1,557 employees compared to 1,536 in 2015. The 1.4 percent increase in the staff complement was due to the increase in the net staff complement of the Domestic Taxes, Commissioner General’s (CGs) Office, Information Technology, Investigations and Finance Divisions. This increase was largely attributed to the rise in the staff establishment to accommodate the newly created Direct and Indirect Tax Departments under the Domestic Taxes Division. Further, the increase in the staff establishment was also intended to accommodate the enhancement of the Mobile Compliance Unit in the Investigations Department and the Debt recovery Unit under Finance Division. Despite this increase, the staff complement in 2016 was below the approved establishment of 1,739 representing 89.5 percent of the approved establishment, compared to 88.5 percent in 2015 (See Table 35).
Table 31: ZRA Staff Complement by Division / Department /Unit as at end 2016 and 2015
Division / Unit 2016 2015
Actual
Approved
Actual Approved
Commissioner General’s Office
23
30
14 19Domestic Taxes
451
511
451 474Customs Services
541
589
557 680Corporate Services
253
268
249 268Research and Planning
26
27
29 31Human Resource
37
35
30 30Finance
100
118
91 106Information Technology
58
70
57 60Internal Audit
18
19
19 19Investigations
44
66
33 41Project Management 6 6 6 6Total 1,557 1,739 1,536 1,734
In 2016, the proportion of female staff marginally increased to 32.8 percent from 32.4 percent in 2015. There were no significant changes in the number of employees in some grades and gender categories, as those that separated were replaced. Non-Represented Contract Staff accounted for 12.2 percent of the workforce compared to 11.9 percent the previous year. In 2016, 39.8 percent of the staff were in the Represented Contract Staff category compared to 40.0 percent in 2015 while 48.0 percent of the staff were in the Represented Non-Contract Staff category compared to 48.1 percent in 2015 (See Table 32)
Table 32: ZRA Staff Complement by Category and Gender
Staff Category 2016 2015
Male Female Total % of Total Male Female Total % of Total
Non Represented Contract Staff (ZRA00 –
ZRA04)
149
40 189 12.2 145 38 183 11.9%
Represented Contract Staff (ZRA05 – ZRA06) 402 219 621 39.8 408 206 614 40.0%
Represented Non-Contract Staff (ZRA07 – ZRA10) 496 251 747 48 486 253 739 48.1%
Total 1,047 510 1557 100% 1,039 497 1,536 100.0%
In 2016, the staff complement continued to be heavier on the Operations side. In this regard, a total of 1,036 members of staff or 66.5 percent of the staff complement were in the operating divisions/departments compared to 1,041 or 67.8 percent in 2015 (Table 33).
Table 33: ZRA Staff Classification as Operations and Support in 2016 and 2015
DIVISIONS/DEPARTMENTS 2016 2015 % ChangeOPERATIONS: Domestic Taxes 451 451 0.0% Customs Services
541
557
(2.9)%
Investigations
44
33
33.3%
Sub Total
1,036
1,041 (0.5)%
SUPPORT SERVICES:
Commissioner General’s Office 23
14 64.3% Research & Planning 26 29 (10.3)%
Corporate Services
253
249
1.6%
Human Resource
37
30
23.3%
Finance
100
91
9.9%
Internal Audit
18
19
(5.3)%
Information Technology
58
57
1.8%
Projects
6
6
0.0%Sub Total
498
495
0.6%GRAND TOTAL
1,557
1,536
1.4%
Staff Strategy
The Authority's staff strategy in 2016 focused on enhancement of supervisory skills at middle and lower management levels. In line with this a total number of 205members of staff were taken through the Supervisory Management Development training. This was done to promote an effective and efficient workforce that would be responsive to ZRA's mandate of collecting more revenue both in the short and long-term.
Resourcing and Selection
The Resourcing and Selection Policy and Procedure Manual stipulates the staff recruitment process in ZRA. A total of 72 employees were recruited in 2016, out of which 2 were Management Trainees, 5 were for the Forensic Laboratory, 6 were under the newly established Ndola Cafeteria and 59 were staff replacements.
Staff Development and Training
The complexity of the Authority's work requires constant training and retraining of staff. In this regard, ZRA in 2016 committed significant resources to capacity building amounting to K4.2 million. This resulted in the successful implementation of training programmes attended by 2,470 participants. The number of participants in 2016 was significantly higher than 1,560 recorded in 2015, largely due to the successful implementation of the training activities as the projects in the core Divisions of Domestic Taxes and Customs Services Divisions had reached implementation stage or were winding up.

47
Performance Management and Development Process
During the year under review, the Performance Management and Development Process (PMDP) was fully implemented. The PMDP also acts as a first layer in identifying staff training needs. Based on the PMDP's recommendations, the 2016 training budget was prepared and successfully implemented.
Following, the annual performance reviews of the Performance Management Development Contracts (PMDCs) between members of staff and their supervisors, Human Resource Department received the performance ratings from all Divisions and Departments.
Table 34 below shows the overall performance rating results.
Table 34: Performance Management Development Contract Performance in 2016
Division/Department Expected Received Variance % Received
EXCEED MET NOT MET
NOT RATED
Human Resource 37 29 8 78.4% 15 14 0 8
Commissioner General 19 18 1 94.7% 12 6 0 1
Project Management 6 6 0 100.0% 0 6 0 0
Finance 100 98 2 98.0% 56 42 0 2
Information Technology 58 56 2 96.6% 15 41 0 2
Domestic Taxes 451 442 9 98.0% 147 292 3 6
Internal Audit 18 18 0 100.0% 5 13 0 0
Research & Planning 29 29 0 100.0% 6 23 0 0
Customs Services 541 515 26 95.2% 102 409 4 22
Investigations 44 44 0 100.0% 12 32 0 0
Corporate Services 254 232 22 91.3% 111 121 0 22
Total1,557
1,487 70 95.5% 481 999 7 63
Figure 29: Performance Management Development Contract Performance in 2016
Met
64.2%
Exceed 30.9%
Not Rated and
Not Met 0.5%
The distribution above shows that 95.1 percent of the employees either met or exceeded their performance objectives, thereby giving a positive indication of Staff commitment to ZRA’s mandate of revenue collection.
Separations
The number of employees that separated from ZRA decreased to 68 in 2016 from 108 separations in 2015 (See Table 35). The separations were on account of dismissals, resignations, retirement and death. The dismissals were mainly on account of misconduct. Findings from exit interviews indicated that resignations were largely due to career progression and better conditions of service offered elsewhere.
Table 35: Separations Recorded in 2016
Dismissal Termination of Contract/
Employment
Contract Expiry
Resignation
Retirement Medical Discharge
Death Total
2016 25 2 5 22 7 - 7 68
2015 28 1 4 36 24 3 12 108
Staff Welfare and Employee Relations
Approach to HIV/AIDS
The HIV and AIDS Workplace Policy guides ZRA’s strategies in the fight against the pandemic. In this vein, the HIV and AIDS Policy; Peer Educators' Programme; the Contributory Scheme for Anti-Retroviral Therapy known as Voluntary Support Scheme (VSS); and the general Medical Scheme for members of staff of ZRA, are among the strategies used to mitigate the HIV and AIDS pandemic in the Authority. However, Management is in the process of revising the HIV/AIDS policy to come up with the Employee Wellness Policy to encompass chronic diseases such as diabetes and cancer, among others.
The ZRA Voluntary Support Scheme (VSS) had a membership of 621 out of a total workforce of 1,557 employees, representing 39.9 percent of the total workforce as at the close of the year. In 2016, 87 employees were accessing the anti-retroviral therapy (ART) under VSS, representing 5.5% of the total work force.
Employee Relations
During the period under review, the management-employee relations remained stable and conducive for business leading to the signing of the Collective Agreement for 2017 to 2018.
Information Technology and Physical Asset Management
Asset Management
As part of ZRA's modernisation reforms, significant resources were committed to refurbishment, rehabilitation and construction of infrastructure at various stations. In

48
this regard, the total value of the infrastructure works completed and those commenced in 2015 was K22.3 million (See Table 36).
Table 36: Major Construction Projects in 2016
Project Name Contract Value (K)
Status/Comment
1 Rehabilitation of house damaged by fire at Mpulungu
139,093.4
Works completed.
2
Refurbishment of part
of 2nd Floor Revenue House
123,475.0
Works completed.
3
Construction of Auditorium At Training Centre in Chelstone
6,572,060.0
Project progressing at 85%
4
Construction of New Border Facility at Chanida
14, 390,140.3
Project progressing at 94%
5
Creation of a Cash Office at Mulungushi House
175,320.1
Project progressing at 98%
Total 7,009,948.5
The infrastructure development and rehabilitation works undertaken in 2016 were meant to make ZRA more efficient and responsive to the changing business environment in which we conduct our business as well as to make it easier for our taxpayers to comply with their tax obligations.
The Authority spent a total of K1, 649,751.52 on the procurement of assorted office furniture and equipment for its various offices.
Information and Communication Technology
During the year, the Authority was involved in various ICT activities. The TaxOnline-PACRA Interface was implemented. Using the automated interface, ZRA is now able to validate taxpayer registrations and amendments for companies and businesses against the register of companies and businesses on the PACRA system. ZRA is able to get information in real-time with respect to companies in de-registration, liquidation or under receivership and execute debt collection where applicable, before de-registering the company. PACRA is also able to receive taxpayer information from ZRA in real-time.
In 2016, the Authority commenced the development of the interface between TaxOnline and ASYCUDAWorld. The interface will provide for the automated transfer of Taxpayer Registration, Advance Income Tax compliance and VAT Deferment data from the TaxOnline System to ASYCUDAWorld. Further, the establishment of a data sharing platform for import and export data on ASYCUDAWorld with TaxOnline data, was commenced. Once deployed, this will facilitate for subsequent use in Mineral Royalty credibility checks and validation of VAT Return declarations, among others. In addition, Domestic Taxes can now initiate appropriate tax type registration based on taxpayer import and export activities.
Oracle Database Vault on the TaxOnline Database was implemented to enhance security. The Oracle Vault protects against insider threat from highly privileged users. The Export Permit Module of the Mineral Value Chain System was also finalised.
The backup optic fiber links for Solwezi, Chingola, Kitwe, Choma, Livingstone and Victoria Falls were implemented. Further, the Authority successfully concluded the installation of Wi-Fi networks at 28 sites which were mostly Customs Services sites. The Authority also managed to implement optic fiber at Mpulungu Border Post.
The Virtual Local Area Network (VLAN) installation exercise at Head Office was finalised. The Authority connected four (4) government institutions through business-to-business (B2B) under the single window project for the voucher of exemption and risk management modules. The institutions connected were Ministry of Agriculture, Ministry of Health, Ministry of Works and Supply and Cabinet Office.
The B2B link was configured to enable data exchange between PACRA and ZRA to facilitate the operation of the One Stop Shop Integration System. The implementation of System Centre Operations Manager server with an onsite Microsoft Engineer was completed. Further, the Authority enhanced connectivity by providing a platform for Clearing Agents to connect to ASYCUDAWorld through a direct link to our data Centre.
The Antivirus Security underwent an advanced upgrade to maintain security of the ICT environment.


50
Managing Resources
In 2016, ZRA operated with an income of K635.7 million out of which K441.8 million was funding appropriated by the Government. Income from ASYCUDA fees was K179.4 million in 2016 compared to K72.1 million received in 2015. Other income amounted to K6.9 million. Table 37 provides a comparative summary of our operating income and expenditure for 2016 and 2015.
Table 37: Summary of Income and Expenditure, 2016 and 2015
2016 (K) 2015 (K) Restated
Income:
Government Funding –Received 427,354,807 378,801,101
Supplementary Funding 14,466,031 50,197,570
Investment Climate Facility 291,616 382,949
Norwegian Tax Administration 2,292,280 3,501,827
Mineral Value Chain 2,633,264 8,352,848
ASYCUDA Income 179,489,151 72,123,216
Other Income 6,930,623 5,869,540
Amortisation of Capital grant 2,285,851 2,072,253
Commission on Kariba dam toll fees 3,865 4,017
Total Income 635,747,488 521,305,322
Recurrent expenses:
Staff related expenses (543,667,980) (466,279,386)
Administrative expenses (48,596,784) (58,210,117)
Operations expenses (71,538,389) (56,852,576)
Legal and professional fees (2,205,121) (1,746,291)
Depreciation and amortisation (59,872,338) (56,206,868)
Results from operating activities (90,133,124) (117,989,915)
Finance income 7,944,246 14,254,602
Finance costs 88,863,638 (258,944,817)
Net finance income 96,807,884 (244,690,215)
Deficit for the year 6,674,760 (362,680,130)
Other comprehensive income Items that will be reclassified to surplus or deficit
Revaluation of property, plant and equipment
Items that will never be reclassified to surplus or deficit
Re-measurement of defined benefit liability 39,690,000 58,856,000
Total other comprehensive income for the year 39,690,000 58,856,000
Total comprehensive income for the year 46,364,760 (303,824,130)
During the year, the financial support from Investment Climate Facility for Africa, Norwegian Tax Administration and Mineral Value Chain Monitoring Project amounted to K5.2 million. Deferred income was K2.3 million while the Authority also received commission on the Kariba Dam toll fees amounting to K3,865.00.

51
Recurrent Expenditure
During the year, staff costs accounted for the largest share of ZRA's recurrent expenditure at 74.9 percent followed by operational costs at 9.8 percent. Administrative costs accounted for 7 percent while depreciation and amortization accounted for 8.3 percent. Staff costs, in 2016, increased by 16.6 percent from the 2015 level as a result of recruitment, salary and wage adjustments. Administrative expenses declined by 16.5 percent, while other operating expenses increased by 25.8 percent over the same period.
Capital Expenditure
In addition to the above operating expenses, ZRA spent K23.4 million in capital expenditure.
The detailed financial performance based on Accrual Basis of Accounting is shown in the Financial Statements from pages 55 to 83.
Figure 30: Government funding as a percentage of collected tax revenue, 2011-2015
Which is defined as the ratio of Government funding to ZRA to the tax revenue collected
Cost of Tax Revenue Collection
During the last six (6) years, the cost of tax revenue collection ratio has averaged at 1.6 percent, with its highest being 2.0 percent recorded in 2013. Since the year 2013, the cost of tax revenue collection ratio has exhibited a downwards trend. In 2016 the cost of tax revenue collection ratio was 1.4 percent same as that recorded during the previous year.

52


54
Table of contents Page
Governing Board’s Report 55 - 56
Statement of Governing Board’s responsibilities 57
Report of the independent auditor 58 -59
Financial statements:
Statement of comprehensive income 60
Statement of financial position 61
Statement of changes in capital fund and reserves 62
Statement of cash flows 63
Notes to the financial statements 64 – 83

55
ZAMBIA REVENUE AUTHORITY
GOVERNING BOARD’S REPORT
RESULTS
2016 2015
K K
635,747,488 521,305,322
6,674,760 (362,680,130)
Mwila Lumbwe - Chairman
Wesley M. Beene
Josephs R. Akafumba
Enias Chulu
Denny Kalyaya
Exhilda Lumbwe
Kelvin Musana
Charles L. Mutemwa
Fredson K. Yamba
AVERAGE NUMBER OF EMPLOYEES AND REMUNERATION
Month Number Month Number
January 1,537 July 1,562
February 1,540 August 1,569
March 1,541 September 1,556
April 1,539 October 1,554
May 1,541 November 1,561
June 1,553 December 1,557
PRINCIPAL ACTIVITIES
The Governing Board submit their report together with the audited financial statements for the year ended 31 December
2016, which disclose the state of affairs of the Authority.
The principal activities of the Authority are to assess, charge, levy and collect revenue due to the Government of the
Republic of Zambia ("the Government") under such laws as the Minister of Finance may, by enacted legislation or
statutory instrument, specify; and to ensure that revenue collected is, as soon as reasonably practicable, credited to the
Government Treasury. The Authority is a grant aided institution.
The members who held office during the year were:
Revenue
Surplus (deficit) for the year
The surplus for the year of K6.7 million (2015: deficit of K362.7 million) has been adjusted in the capital fund.
GOVERNING BOARD
The total remuneration of employees during the year amounted to K543.7 million (2015: K466.3 million). The average
number of employees for each month of the year was as follows:
The Authority has policies and procedures to safeguard the occupational health, safety and welfare of its employees.

56
ZAMBIA REVENUE AUTHORITY
GOVERNING BOARD’S REPORT (CONTINUED)
PROPERTY AND EQUIPMENT
AUDITOR
DIRECTOR
Deloitte & Touche's term of office comes to an end at the next Annual General Meeting. A resolution proposing their re-
appointment as auditors and authorising the Directors to fix their remuneration will be put to the Annual General Meeting.
30 APRIL 2017
The Authority purchased property and equipment amounting to K23.4 million (2015: K65.6 million) during the year. In the
opinion of the directors, the carrying value of property and equipment is not more than their recoverable value.
GIFTS AND DONATIONS
The Authority made donations to charitable organisations and events during the year amounting to K144,026 (2015:
K14,920).

57
ZAMBIA REVENUE AUTHORITY
STATEMENT OF GOVERNING BOARD’S RESPONSIBILITIES
________________________________ ______________________________
DIRECTOR DIRECTOR
Nothing has come to the attention of the Governing Board to indicate that any material breakdown in the functioning of
these controls, procedures and systems has occurred during the year under review.
In the opinion of the Governing Board members, the Authority has complied with the requirements of the Act.
Signed on behalf of the Board by:
The Governing Board is also responsible for the systems of internal control. These are designed to providereasonable,
but not absolute assurance as to the reliability of the financial statements, and to adequately safeguard, verify and
maintain accountability for assets, and to prevent and detect material misstatements. The systems are implemented
and monitored by suitably trained personnel with an appropriate segregation of authority and duties.
The Zambia Revenue Authority Act, Chapter 321 of the Laws of Zambia (the “Act”) requires the Governing Board to:
assess, charge, levy and collect all revenue due to the Government of the Republic of Zambia under such laws as the Minister of Finance and National Planning may, by enacted legislation or statutory instrument, specify;
ensure that all revenue collected is, as soon as reasonably practicable, credited to the Government Treasury;
keepproperbooksofaccountandotherrecordswhichdisclosewithreasonableaccuracyatanytimethe financial position of the Authority;
safeguard the assets of the Authority and hence take reasonable steps for the prevention and detection of fraud
and other irregularities; and
prepare financial statements for each financial year which comply with Intenational Financial Reporting Standards.
The Governing Board is responsible for the maintenance of adequate accounting records and the preparation and
integrity of the annual financial statements and related information. The independent external auditors, Messrs Deloitte &
Touche, have audited the annual statements and their report, is shown on page 4 and 5.

58
PO Box 30030LusakaZambia
Deloitte & ToucheAbacusSquarePlot No. 2374/BThabo Mbeki RoadLusaka, Zambia
Tel: +(260) 211 228677/8/9Fax: +(260) 211 226915www.deloitte.co.zm
Opinion
Basis for Opinion
Other Information
Responsibilities of the Governing Board
INDEPENDENT AUDITOR'S REPORT
To the Government of Zambia through the Minister of Finance
REPORT ON THE AUDIT OF THE FINANCIAL STATEMENTS
We have audited the accompanying financial statements of the Zambia RevenueAuthority (the "Authority") as set out on
pages 6 to 30, and which comprise the statement of financial position as at 31 December 2016, the statement of
comprehensive income, the statement of changes in capital fund and reserves and the statement of cash flows for the
year then ended, and the notes to the financial statements, including a summary of significant accounting policies.
In our opinion, the financial statements present fairly, in all material respects, the financial position of the Authority as at
31 December 2016, and its financial performance and cash flows for the year then ended in accordance with International
Financial Reporting Standards (IFRSs) and in the manner required by the Zambia RevenueAuthority Act, Chapter 321 of
the Laws of Zambia.
We conducted our audit in accordance with International Standards on Auditing (ISAs). Our responsibilities under those
standards are further described in the Auditor’s Responsibilities for the Audit of the Financial Statements section of our
report. We are independent of the Authority in accordance with the International Ethics Standards Board for
Accountants’ Code of Ethics for Professional Accountants (IESBA Code) together with the ethical requirements that are
relevant to our audit of financial statements in Zambia. We have fulfilled our ethical responsibilities in accordance with
these requirements and the IESBA code. We believe that the audit evidence we have obtained is sufficient and
appropriate to provide a basis for our opinion.
The Governing Board is responsible for the preparation and fair presentation of the financial statements in accordance
with International Financial Reporting Standards and the requirements of the Zambia Revenue Authority, Chapter 321 of
the Laws of Zambia, and for such internal control as the Governing Board determine is necessary to enable the
preparation of financial statements that are free from material misstatement, whether due to fraud or error.
In preparing the financial statements, the GoverningBoard is responsible for assessing the Authority's ability to continue
as a going concern, disclosing, as applicable, matters related to going concern and using the going concern basis of
accounting unless the GoverningBoard either intend to liquidate the Authority or to cease operations, or has no realistic
alternative but to do so.
The Governing Board is responsible for the other information. The other information comprises the Governing Board's
Report, as required by the Zambia Revenue Authority Act, Chapter 321 of the Laws of Zambia and which we obtained
prior to the date of this auditor's report. The other information does not include the financial statements and our auditor’s
report thereon.
Our opinion on the financial statements does not cover the other information and we do not express an audit opinion or
any form of assurance conclusion thereon.
In connection with our audit of the financial statements, our responsibility is to read the other information and, in doing
so, consider whether the other information is materially inconsistent with the financial statements or our knowledge
obtained in the audit, or otherwise appears to be materially misstated.
If, based on the work we have performed on the other information that we obtained prior to the date of this auditor’s
report, we conclude that there is a material misstatement of this other information, we are required to report that fact.
We have nothing to report in this regard.

59
Auditor’s Responsibilities for the Audit of the Financial Statements
•
•
•
•
•
Report on other legal requirements
Our objectives are to obtain reasonable assurance about whether the financial statements as a whole are free from
material misstatement, whether due to fraud or error, and to issue an auditor’s report that includes our opinion.
Reasonable assurance is a high level of assurance, but is not a guarantee that an audit conducted in accordance with
ISAs will always detect a material misstatement when it exists. Misstatements can arise from fraud or error and are
considered material if, individually or in the aggregate, they could reasonably be expected to influence the economic
decisions of users taken on the basis of these financial statements.
The Zambia RevenueAuthority Act, Chapter 321 of the Laws of Zambia, requires that in carrying out our audit we confirm
the following:
In our opinion, the Zambia Revenue Authority has maintained proper accounting records and other records as required by
the Zambia Revenue Authority Act, Chapter 321 of the Laws of Zambia.
DELOITTE & TOUCHE
DATE:
C. CHUNGU (AUD/F000292)
PARTNER
As part of an audit in accordance with ISAs, we exercise professional judgement and maintain professional scepticism
throughout the audit. We also:
We communicate with the Governing Board regarding, among other matters, the planned scope and timing of the audit
and significant audit findings, including any significant deficiencies in internal control that we identify during our audit.
We also provide the Governing Board with a statement that we have complied with relevant ethical requirements
regarding independence, and to communicate with them all relationships and other matters that may reasonably be
thought to bear on our independence, and where applicable, related safeguards.
Identify and assess the risks of material misstatement of the financial statements, whether due to fraud or error,
design and perform audit procedures responsive to those risks, and obtain audit evidence that is sufficient and
appropriate to providea basis for our opinion. The risk of not detecting a material misstatement resulting from fraud
is higher than for one resulting from error, as fraud may involve collusion, forgery, intentional omissions,
misrepresentations, or the override of internal control.
Obtain an understanding of internal control relevant to the audit in order to design audit procedures that are
appropriate in the circumstances, but not for the purpose of expressing an opinion on the effectiveness of the
Authority's internal control.
Evaluate the appropriateness of accounting policies used and the reasonableness of accounting estimates and
related disclosures made by the Governing Board.
Conclude on the appropriateness of the GoverningBoard’s use of the going concern basis of accounting and based
on the audit evidence obtained, whether a material uncertainty exists related to events or conditions that may cast
significant doubt on the Authority's ability to continue as a going concern. If we conclude that a material uncertainty
exists, we are required to draw attention in our auditor’s report to the related disclosures in the financial statements
or, if such disclosures are inadequate, to modify our opinion. Our conclusions are based on the audit evidence
obtained up to the date of our auditor’s report. However, future events or conditions may cause the Authority to
cease to continue as a going concern.
Evaluate the overall presentation, structure and content of the financial statements, including the disclosures, and
whether the financial statements represent the underlying transactions and events in a manner that achieves fair
presentation.

60
ZAMBIA REVENUE AUTHORITY
STATEMENT OF COMPREHENSIVE INCOME
for the year ended 31 December 2016
Notes 2016 2015
K K
Revenue
Government grants 5 441,820,838 428,998,671
Asycuda processing fees 6 179,489,151 72,123,216
Other income 7 6,930,623 5,869,540
Investment Climate Facility and Norwegian Tax
Administration income 8 5,217,160 12,237,625
Deferred income 9 2,285,851 2,072,253
Commission on Kariba Dam toll fees 10 3,865 4,017
635,747,488 521,305,322
Expenditure
Personnel expenses 11 (543,667,980) (466,279,386)
Administrative expenses 12 (48,596,784) (58,210,117)
Other operating expenses 13 (73,743,510) (58,598,866)
Depreciation and amortisation 16, 17 (59,872,338) (56,206,868)
Deficit from operating activities (90,133,124) (117,989,915)
Finance income 14 7,944,246 14,254,602
Net exchange gains (losses) 15 88,863,638 (258,944,817)
Net finance income (costs) 96,807,884 (244,690,215)
Surplus (deficit) for the year 6,674,760 (362,680,130)
Other comprehensive income for the year
Items that will not be reclassified to surplus
or deficit
Surplus on defined benefit plan 22 39,690,000 58,856,000
Total other comprehensive income for the
year 39,690,000 58,856,000
Total comprehensive income (loss) for the year 46,364,760 (303,824,130)

61
ZAMBIA REVENUE AUTHORITY
STATEMENT OF FINANCIAL POSITION
at 31 December 2016
Notes 2016 2015
K K
ASSETS
Non-current assets
Property and equipment 16 558,647,993
591,421,382
Intangible assets 17 44,136,748
42,698,331
Employee loans and advances 19 8,461,355
4,283,057
611,246,096
638,402,770
Current assets
Inventories 18 2,740,372
1,166,842
Employee loans and advances 19 25,384,066
12,849,170
Other assets 20 16,134,906
7,690,366
Cash and cash equivalents 21 53,254,724
113,188,202
Customs deposit bank accounts 25 1,651,101
7,060,204
Tax refunds bank accounts 26 28,265,121
47,799,691
127,430,290
189,754,475
TOTAL ASSETS 738,676,386
828,157,245
Capital fund and reserves
Capital deficiency (324,458,520) (373,241,760)
Revaluation reserve 129,847,592 132,266,072
Net capital deficiency (194,610,928) (240,975,688)
Liabilities
Non-current liabilities
Deferred income 9 3,815,590
3,028,799 Post employment benefits 22 338,181,827
305,671,027
Borrowings 24 386,992,580
533,900,267
728,989,997
842,600,093
Current liabilities
Investment Climate Facility, Mineral Value Chain
and Norwegian Tax Administration grants 8 8,962,509
10,176,441
Deferred income 9 2,892,265
1,864,849
Post employment benefits 22 59,679,146
53,941,946
Payables 23 42,721,352
41,776,382
Borrowings 24 60,125,823
63,913,327
Customs deposit bank accounts 25 1,651,101
7,060,204
Tax refunds bank accounts 26 28,265,121
47,799,691
204,297,317
226,532,840
Total liabilities 933,287,314
1,069,132,933
TOTAL CAPITAL FUND, RESERVES AND
LIABILITIES 738,676,386
828,157,245
CAPITAL FUND, RESERVES AND LIABILITIES

62
ZAMBIA REVENUE AUTHORITY
STATEMENT OF CHANGES IN CAPITAL FUND AND RESERVES
for the year ended 31 December 2016
Capital Revaluation
deficiency reserve Total
K K K
At 1 January 2015 (71,853,610) 134,702,052 62,848,442
Deficit for the year (362,680,130) - (362,680,130)
Other comprehensive income
Gain on employee retirement benefit plan 58,856,000 - 58,856,000
Amortisation of revaluation surplus 2,435,980 (2,435,980) -
Total comprehensive loss for the year (301,388,150) (2,435,980) (303,824,130)
Balance as at 31 December 2015 (373,241,760) 132,266,072 (240,975,688)
At 1 January 2016 (373,241,760) 132,266,072 (240,975,688)
Surplus for the year 6,674,760 - 6,674,760
Other comprehensive income:
Gain on employee retirement benefit plan 39,690,000 - 39,690,000
Amortisation of revaluation surplus 2,418,480 (2,418,480) -
Total comprehensive income for the year 48,783,240 (2,418,480) 46,364,760
At 31 December 2016 (324,458,520) 129,847,592 (194,610,928)

63
ZAMBIA REVENUE AUTHORITY
STATEMENT OF CASH FLOWS
for the year ended 31 December 2016
Notes 2016 2015
K K
Cash flows from operating activities
Surplus (deficit) for the year 6,674,760
(362,680,130)
Adjustments for:
Amortisation of Investment Climate Facility and
Norwegian Tax Administration grant 8 (5,217,160)
(12,237,625)
Amortisation of capital grant 9 (2,285,851)
(2,072,253)
Depreciation and amortisation 16 59,872,338
56,206,868
Amortisation of staff benefit 17 235,561
62,298
Impairment loss on employee loans and advances 19 118,000
382,000
Gain on disposal of equipment (582,735)
(536,553)
Net exchange (gains) losses on borrowings 24 (88,528,941)
288,090,143
Net finance income (7,944,246)
(14,254,602)
Capital work in progress written off 16, 17 -
28,761,220
Defined benefit obligation expense 22 140,369,000
92,976,000
Changes in operating funds 102,710,726 74,697,366
Increase in inventories (1,573,530) (11,785) Increase in employee loans and advances (17,066,755) (5,514,579) (Increase) decrease in other assets (8,444,540) 5,148,940 Increae (decrease) in payables 944,970
(21,209,218)
Decrease in employee related liabilities 22 (62,431,000)
(19,992,000)
Net cash generated from operating activities 14,139,871
33,118,724
Cash flows from investing activities
Interest received 14 7,944,246
14,254,602
Acquisition of property and equipment and
intangibles 16, 17 (28,997,183)
(74,840,539)
Proceeds from disposal of equipment 1,042,552
698,772
Investment Climate facility and Norwegian
Tax Administration grant received 8 4,003,228
18,534,275
Capital grant received - World Bank 9 4,100,058
-
Net cash used in investing activities (11,907,099)
(41,352,890)
Cash flows from financing activities
Repayment of borrowings 24 (62,166,250)
(40,444,651)
Net cash used in financing activities (62,166,250)
(40,444,651)
Net increase in cash and cash equivalents (59,933,478)
(48,678,817)
Cash and cash equivalents at beginning of the year 113,188,202
161,867,019
Cash and cash equivalents at end of the year 21 53,254,724
113,188,202
64
ZAMBIA REVENUE AUTHORITY
1. GENERAL INFORMATION
Kabwe Roundabout
P. O. Box 35710
2.
2.1 Amendments to IFRSs that are mandatorily effective for the current year
Annual Improvements to IFRSs 2012-2014 Cycle
2.2 Standards and Interpretations in issue, not yet effective
Effective date
January 1, 2017 IAS 7 Disclosure Initiative – Amendments to IAS 7
January 1, 2018 IFRS 9 Financial Instruments
The Zambia Revenue Authority ("the Authority") was established following enactment by Parliament of the Zambia
RevenueAuthority Act, Chapter 321 of the Laws of Zambia (the "Act"), to carry out the affairs of the former Customs and
Excise Department and the Department of Income Taxes. The Act, which came into effect on 1 April 1994, also
transferred the assets and liabilities of those former departments to the Authority. The address of its registered office is:
In the current year, the Authority has applied a number of amendments to IFRSs issued by the International Accounting
Standards Board (IASB) that are mandatorily effective for an accounting period that begins on or after 1 January 2016:
Revenue
Lusaka
The amendments to IAS 7 Statement of Cash Flows are part of the IASB’s Disclosure Initiative
and require an entity to provide disclosures that enable users of financial statements to evaluate
changes in liabilities arising from financing activities, including both changes arising from cash
flows and non-cash changes. On initial application of the amendment, entities are not required to
provide comparative information for preceding periods.
The GoverningBoard anticipate that the application of the amendments will have a material impact
on the Authority as this will result in additional disclosures as mandated by the amendments.
In July 2014, the IASB issued the final version of IFRS 9 Financial Instruments that replaces IAS
39 Financial Instruments: Recognition and Measurement and all previous versions of IFRS 9. IFRS
9 brings together all three aspects of the accounting for the financial instruments project:
classification and measurement; impairment; and hedge accounting. IFRS 9 is effective for annual
periods beginning on or after 1 January 2018, with early application permitted. Except for hedge
accounting, retrospective application is required, but providing comparative information is not
compulsory. For hedge accounting, the requirements are generally applied prospectively, with
some limited exceptions.
ADOPTION OF NEW AND REVISED INTERNATIONAL FINANCIAL REPORTING STANDARDS (IFRSs)
NOTES TO THE FINANCIAL STATEMENTS
for the year ended 31 December 2016
Standard, Amendment or interpretation
At the date of authorisation of these financial statements, the following relevant Standards and Interpretations were in
issue but not yet effective:
The Annual Improvements to IFRSs 2012-2014 Cycle include a number of amendments to various IFRSs, which are
summarised below:
The amendments to IFRS 7 provide additional guidance to clarify whether a servicing contract is continuing involvement
in a transferred asset for the purpose of the disclosures required in relation to transferred assets.
The amendment to IAS 19 clarify that the rate used to discount post-employment benefit obligations should be
determined by reference to market yields at the end of the reporting period on high quality corporate bonds. The
assessment of the depth of a market for high quality corporate bonds should be at the currency level, (i.e. the same
currency as the benefits are to be paid). For currencies for which there is no deep market in such high quality
corporate bonds, the market yields at the end of the reporting period on the government bonds denominated in that
currency should be used instead.
The application of these amendments has had no effect on the Authority's financial statements.

65
ZAMBIA REVENUE AUTHORITY
NOTES TO THE FINANCIAL STATEMENTS (CONTINUED)
2.
2.2 Standards and Interpretations in issue, not yet effective (continued)
Effective date
January 1, 2018 IFRS 9 Financial Instruments (continued))
January 1, 2018
•
•
•
•
•
January 1, 2018
2.3 Summary of significant accounting policies
(a) Basis of preparation
The Governing Board anticipate that the application of IFRS 9 in the future may have a material
impact on amounts reported in respect of the Authority’s financial assets and financial liabilities.
However, it is not practicable to provide a reasonable estimate of the effect of IFRS 9 until the
Authority undertakes a detailed review.
IFRS 15 Revenue from Contracts with Customers
Identify the contract(s) with a customer;
Identify the performance obligations in the contract;
Determine the transaction price;
Allocate the transaction price to the performance obligations in the contract; and
The GoverningBoard anticipate that this standard will not have a material impact on the operations
of the Authority as the Authority has very limited leases.
Recognise revenue when (or as) the entity satisfies a performance obligation.
IFRS 15 specifies how and when an IFRS reporter will recognise revenueas well as requiring such
entities to provide users of financial statements with more informative, relevant disclosures. The
standard provides a single, principles based five-step model to be applied to all contracts with
customers. The core principle of IFRS 15 is that an entity will recognise revenue to depict the
transfer of promised goods or services to customers in an amount that reflects the consideration to
which the entity expects to be entitled in exchange for those goods or services. This core principle
is delivered in a five-step model framework:
The Governing Board of the Authority anticipate that the application of IFRS 15 in the future may
have a material impact on the amounts reported and disclosures made in the Authority’s financial
statements. However,it is not practicable to providea reasonable estimate of the effect of IFRS 15
until the Authority performs a detailed review.
IFRS 16 Leases
IFRS 16 was issued in January 2016 and it replaces IAS 17 Leases, IFRIC 4 Determining whether
an Arrangement contains a Lease, SIC-15 Operating Leases-Incentives and SIC-27 Evaluating the
Substance of Transactions Involving the Legal Form of a Lease . IFRS 16 sets out the principles
for the recognition, measurement, presentation and disclosure of leases and requires lessees to
account for all leases under a single on-balance sheet model similar to the accounting for finance
leases under IAS 17. The standard includes two recognition exemptions for lessees – leases of
’low-value’ assets (e.g., personal computers) and short-term leases (i.e., leases with a lease term
of 12 months or less). At the commencement date of a lease, a lessee will recognise a liability to
make lease payments (i.e., the lease liability) and an asset representing the right to use the
underlying asset during the lease term (i.e., the right-of-use asset). Lessees will be required to
separately recognise the interest expense on the lease liability and the depreciation expense on
the right-of-use asset.
The principal accounting policies applied in the preparation of these financial statements are set out below. These
policies have been consistently applied to all years presented, unless otherwise stated.
The financial statements have been prepared on the historical cost basis except for certain properties and financial
instruments that are measured at revalued amounts at the end of each reporting period, as explained in the accounting
policies below.
for the year ended 31 December 2016
Standard, Amendment or interpretation
ADOPTION OF NEW AND REVISED INTERNATIONAL FINANCIAL REPORTING STANDARDS (IFRSS)
(CONTINUED)

66
ZAMBIA REVENUE AUTHORITY
2.
2.3 Summary of significant accounting policies (continued)
(a) Basis of preparation (continued)
•
•
•
(b)
(c)
Government revenue grants
Rental income
The financial statements are presented in units of Zambia Kwacha.
The Authority had a capital deficiency of K324,458,520 (2015: K373,241,760) as at the reporting date, and as of that
date its current liabilities exceeded its current assets by K76,867,027 (2015: K36,778,365). On the basis that the
Authority is Grant aided and funding by the Government has continued in the subsequent period, the Governing Board
are of the opinion that the preparation of these financial statements on the going concern basis remains appropriate.
In preparing the financial statements of the Authority, transactions in currencies other than the entity's functional
currency (foreign currencies) are recognised at the rates of exchange prevailing at the dates of the transactions. At the
end of each reporting period, monetary items denominated in foreign currencies are retranslated at the rates prevailingat
that date. Non-monetary items carried at fair value that are denominated in foreign currencies are retranslated at the
rates prevailing at the date when the fair value was determined. Non-monetary items that are measured in terms of
historical cost in a foreign currency are not retranslated.
Exchange differences are recognised in income and expenditure in the year in which they arise.
Foreign currency translation
Revenue recognition
Rental income from properties is recognised in income and expenditure on a straight line basis over the term of the
relevant lease agreement.
Income represents the revenue grants receivable from the Government and other co-operating partners during the year
and is accounted for on an accruals basis. Governmentgrants are recognised when there is reasonable assurance that
they will be received and the Authority will comply with the conditions associated with the grant.
Grants that compensate the Authority for expenses incurred are recognised in income and expenditure as other income
on a systematic basis in the periods in which the expenses are recognised.
Level 3 inputs are unobservable inputs for the asset or liability.
Historical cost is generally based on the fair value of the consideration given in exchange for goods and services.
Fair value is the price that would be received to sell an asset or paid to transfer a liability in an orderly transaction
between market participants at the measurement date, regardless of whether that price is directly observable or
estimated using another valuation technique.
NOTES TO THE FINANCIAL STATEMENTS (CONTINUED)
In estimating the fair value of an asset or a liability, the Authority takes into account the characteristics of the asset or
liability if market participants would take those characteristics into account when pricing the asset or liability at the
measurement date. Fair value for measurement and/or disclosure purposes in these financial statements is determined
on such a basis, except for, leasing transactions that are within the scope of IAS 17 Leases, and measurements that
have some similarities to fair value but are not fair value, such as value in use in IAS 36 Impairment of assets.
In addition, for financial reporting purposes, fair value measurements are categorised into Level 1, 2 or 3 based on the
degree to which the inputs to the fair value measurements are observable and the significance of the inputs to the fair
value measurement in its entirety, which are described as follows:
Level 1 inputs are quoted prices (unadjusted) in active markets for identical assets or liabilities that the entity can
access at the measurement date;
Level 2 inputs are inputs, other than quoted prices included within Level 1, that are observable for the asset or
liability, either directly or indirectly; and
for the year ended 31 December 2016
ADOPTION OF NEW AND REVISED INTERNATIONAL FINANCIAL REPORTING STANDARDS (IFRSS)
(CONTINUED)
67
ZAMBIA REVENUE AUTHORITY
2.
2.3 Summary of significant accounting policies (continued)
(c)
Sale of cigarette stamps
(d)
(e)
(f)
(g)
2%
20%
20%
25%
10%
Subsequent costs are included in the asset’s carrying amount or recognised as a separate asset, as appropriate, only
when it is probable that future economic benefits associated with the item will flow to the Authority and the cost of the
item can be measured reliably. The carrying amount of the replaced part is derecognised. All other repairs and
maintenance are charged to profit or loss during the financial period in which they are incurred.
Increases in the carrying amount arising on revaluationof land and buildings are credited to other comprehensive income
and shown as revaluation reserve in equity. Decreases that offset previous increases of the same asset are charged in
other comprehensive income and debited against the revaluation reserve, all other decreases are charged to profit or
loss. Each year the difference between depreciation based on the revalued carrying amount of the asset (the
depreciation charged to profit or loss) and depreciation based on the asset’s original cost is transferred from the
revaluation reserve to retained earnings.
Leasehold land is not depreciated. Depreciation on other assets is calculated using the straight-line method to allocate
their cost or revalued amounts to their residual values over their estimated useful lives, as follows:
Other income is recognised on an accruals basis in accordance with the substance of the relevant agreements.
Interest income is recognised using the effective interest method.
Other income
Buildings
Office equipment, furniture, fixtures and fittings
Furniture, fixtures and fittings
Motor vehicles
Equipment
Capital grants
Capital grants are recognised initially as deferred income at fair value where there is reasonable assurance that they will
be received and the Authority will comply with the conditions associated with the grant, and are then recognised in the
income and expenditure as other income on a systematic basis over the useful life of the asset. Specifically, government
grants whose primary condition is that the Authority should purchase, construct or otherwise acquire non-current assets
are recognised as deferred revenue in the statement of financial position and transferred to surplus or deficit on a
systematic and rational basis over the useful lives of the related assets.
Property and equipment
Leasehold land and buildings are shown at fair value, based on valuations by external independent valuers, less
subsequent depreciation for buildings. Valuations are performedwith sufficient regularity to ensure that the fair value of a
revalued asset does not differ materially from its carrying amount. Any accumulated depreciation at the date of
revaluation is eliminated against the gross carrying amount of the asset and the net amount is restated to the revalued
amount of the asset.
All other property, plant and equipment are stated at historical cost less depreciation. Historical cost includes
expenditure that is directly attributable to the acquisition of the items.
Interest income
Revenue is recognised when the significant risks and rewards of ownership have been transferred to the customer,
recovery of the consideration is probable, the associated costs and possible return of goods can be estimated reliably,
there is no continuing management involvementwith the goods, and the amount of revenue can be measured reliably.
Revenue is measured net of returns, trade discounts and volume rebates.
NOTES TO THE FINANCIAL STATEMENTS (CONTINUED)
for the year ended 31 December 2016
ADOPTION OF NEW AND REVISED INTERNATIONAL FINANCIAL REPORTING STANDARDS (IFRSS)
(CONTINUED)
Revenue recognition (continued)

68
ZAMBIA REVENUE AUTHORITY
2.
2.3 Summary of significant accounting policies (continued)
(g)
(h) Leases
(i) Inventories
(j)
(k)
Impairment of intangible assets
Gains and losses on disposals are determined by comparing the proceeds with the carrying amount and are included in
income and expenditure. When revaluedassets are sold, the amounts included in the revaluationreserve relating to that
asset are transferred to retained earnings.
An item of property, plant and equipment is derecognised upon disposal or when no future economic benefits are
expected to arise from the continued use of the asset. Any gain or loss arising on the disposal or retirement of an item
of property, plant and equipment is determined as the difference between the sales proceeds and the carrying amount of
the asset and is recognised in profit or loss.
At each reporting date, the Authority reviews the carrying amounts of its tangible assets to determine whether there is
any indication that those assets have suffered an impairment loss. If any such indication exists, the recoverableamount
of the asset is estimated in order to determine the extent of the impairment loss (if any).
If the recoverableamount of an asset is estimated to be less than its carrying amount, the carrying amount of the asset
is reduced to its recoverable amount. Impairment losses are recognised as an expense immediately, unless the
relevantasset is leasehold land or buildings, other than investment property, carried at a revalued amount, in which case
the impairment loss is treated as a revaluation decrease.
If an impairment loss subsequently reverses, the carrying amount of the asset is increased to the revised estimate of its
recoverableamount, but only to the extent that the increased carrying amount does not exceed the carrying amount that
would have been determined had no impairment loss been recognised for the asset in prior years. A reversal of an
impairment loss is recognised as income immediately, unless the relevant asset is carried at a revalued amount, in
which case the reversal of the impairment loss is treated as a revaluation increase.
Provisions are recognised when the Authority has a present obligation (legal or constructive) as a result of a past event,
for which it is probable that the Authority will be required to settle the obligation, and a reliable estimate can be made of
the amount of the obligation.
Leases in which a significant portion of the risks and rewards of ownership are retained by the lessor are classified as
operating leases. Payments made under operating leases (net of any incentives received from the lessor) are charged to
profit or loss on a straight-line basis over the period of the lease.
Inventoriesare stated in the statement of financial position at the lower of cost and net realisable value. Cost comprises
direct material costs. Cost includes all costs that have been incurred in bringing the inventories to their present location
and condition. Net realisable value takes into account all directly related costs to be incurred in marketing, selling and
distribution. Provision is made where necessary, for defective, slow moving and obsolete inventories.
The assets’ residual values and useful lives are reviewed, and adjusted if appropriate, at the end of each reporting period.
Property and equipment are reviewed for impairment whenever events or changes in circumstances indicate that the
carrying amount may not be recoverable.An impairment loss is recognised for the amount by which the asset’s carrying
amount exceeds its recoverable amount. The recoverableamount is the higher of an asset’s fair value less costs to sell
and value in use. For the purposes of assessing impairment, assets are grouped at the lowest levels for which there are
separately identifiable cash flows (cash-generating units). Non-financial assets that suffered impairment are reviewedfor
possible reversal of the impairment at each reporting date.
NOTES TO THE FINANCIAL STATEMENTS (CONTINUED)
for the year ended 31 December 2016
ADOPTION OF NEW AND REVISED INTERNATIONAL FINANCIAL REPORTING STANDARDS (IFRSS)
(CONTINUED)
Provisions
Property and equipment (continued)

69
ZAMBIA REVENUE AUTHORITY
2.
2.3 Summary of significant accounting policies (continued)
(k)
(l)
(i)
(a)
(b)
•
•
•
•
Financial instruments
The amount recognised as a provision is the best estimate of the consideration required to settle the present obligation
at the reporting date, taking into account the risks and uncertainties surrounding the obligation. Where a provision is
measured using the cash flows estimated to settle the present obligation, its carrying amount is the present value of
those cash flows.
When some or all of the economic benefits required to settle a provision are expected to be recovered from a third party,
the receivable is recognised as an asset if it is virtually certain that reimbursement will be received and the amount of the
receivable can be measured reliably.
Financial assets and financial liabilities are recognised when the Authority becomes a party to the contractual provisions
of the instrument.
NOTES TO THE FINANCIAL STATEMENTS (CONTINUED)
for the year ended 31 December 2016
ADOPTION OF NEW AND REVISED INTERNATIONAL FINANCIAL REPORTING STANDARDS (IFRSS)
(CONTINUED)
Provisions
If, in a subsequent period, the amount of the impairment loss decreases and the decrease can be related objectively to
an event occurring after the impairment was recognised, the previously recognised impairment loss is reversedthrough
profit or loss to the extent that the carrying amount of the investment at the date the impairment is reversed does not
exceed what the amortised cost would have been had the impairment not been recognised.
For certain categories of financial assets, such as receivables, assets that are assessed not to be impaired individually
are, in addition, assessed for impairment on a collective basis. Objective evidence of impairment for a portfolio of
receivables could include the Authority's past experience of collecting payments, an increase in the number of delayed
payments in the portfolio past the average credit period of one year, as well as observablechanges in national or local
economic conditions that correlate with default on receivables.
Financial assets
Receivables
Effective interest rate method
Financial assets are classified as employee loans and advances and other receivables.
The effective interest method is a method of calculating the amortised cost of a financial instrument and of allocating
interest income over the relevant period. The effective interest rate is the rate that exactly discounts estimated future
cash receipts (including all fees and points paid or received that form an integral part of the effective interest rate,
transaction costs and other premiums or discounts) through the expected life of the financial instrument, or, where
appropriate, a shorter period, to the net carrying amount on initial recognition.
the disappearance of an active market for that financial asset because of financial difficulties.
Impairment of financial assets
Financial assets that are measured at amortised cost are assessed for indicators of impairment at the end of each
reporting period. Financial assets are considered to be impaired when there is objective evidence that, as a result of one
or more events that occurred after the initial recognition of the financial asset, the estimated future cash flows of the
financial asset have been affected.
Objective evidence of impairment could include:
For financial assets carried at amortised cost, the amount of the impairment loss recognised is the difference between
the asset's carrying amount and the present value of estimated future cash flows, discounted at the financial asset's
original effective interest rate.
Receivables are non-derivativefinancial assets with fixed or determinable payments that are not quoted in an active
market. Receivables (including trade and other receivables, bank balances and cash) are measured at amortised cost
less any impairment.
significant financial difficulty of the issuer or counterparty; or
default or delinquency in interest or principal payments; or
it becoming probable that the borrower will enter bankruptcy or financial re-organisation; or
DRAFTDRAFT

70
ZAMBIA REVENUE AUTHORITY
2.
2.3 Summary of significant accounting policies (continued)
(ii) De-recognition of financial assets
(iii)
(m)
(n)
(o) Borrowing costs
(p)
i)
(a)
Income intended to compensate costs overa period of time is deferredand released to the profit or loss over the periods
necessary to match it with the costs for which it is intended to compensate.
NOTES TO THE FINANCIAL STATEMENTS (CONTINUED)
for the year ended 31 December 2016
ADOPTION OF NEW AND REVISED INTERNATIONAL FINANCIAL REPORTING STANDARDS (IFRSS)
(CONTINUED)
Deferred income
The Authority derecognises a financial asset only when the contractual rights to the cash flows from the asset expire, or
it transfers the financial asset and substantially all the risks and rewards of ownership of the asset to another entity. If
the Authority neither transfers nor retains substantially all the risks and rewards of ownership and continues to control
the transferred asset, the Authority recognises its retained interest in the asset and an associated liability for amounts it
may have to pay. If the Authority retains substantially all the risks and rewards of ownership of a transferred financial
asset, the Authority continues to recognise the financial asset and also recognises a collateralised borrowing for the
proceeds received.
On derecognition of a financial asset measured at amortised cost, the difference between the asset's carrying amount
and the sum of the consideration received and receivable is recognised in the statement of comprehensive income.
Financial liabilities are classified as payables, other liabilities and borrowings.
All financial liabilities are initially recognised at fair value and subsequently measured at amortised cost using the
effective interest method.
The effective interest method is a method of calculating the amortised cost of a financial liability and of allocating interest
expense over the relevant period. The effective interest rate is the rate that exactly discounts estimated future cash
payments through the expected life of the financial liability, or (where appropriate) a shorter period, to the net carrying
amount on initial recognition.
Financial liabilities
Retirement benefit obligations
Employee benefits
Pension obligations
The Authority operates various post-employment schemes, including both defined benefit and defined contribution
pension plans.
A defined contribution plan is a pension plan under which the Authority pays fixed contributions into a separate entity.
The Authority has no legal or constructive obligations to pay further contributions if the fund does not hold sufficient
assets to pay all employees the benefits relating to employee service in the current and prior periods. A defined benefit
plan is a pension plan that is not a defined contribution plan.
Typically defined benefit plans define an amount of pension benefit that an employee will receive on retirement, usually
dependent on one or more factors such as age, years of service and compensation.
Trade payables
Trade payables are obligations to pay for goods or services that have been acquired in the ordinary course of business
from suppliers. Accounts payable are classified as current liabilities if payment is due within one year or less (or in the
normal operating cycle of the business if longer). If not, they are presented as non-current liabilities. Trade payables are
recognised initially at fair value and subsequently measured at amortised cost using the effective interest method.
Borrowing costs directly attributable to the acquisition, construction or production of qualifying assets, which are assets
that necessarily take a substantial period of time to get ready for their intended use or sale, are added to the cost of
those assets, until such time as the assets are substantially ready for their intended use or sale.
All other borrowing costs are recognised in profit or loss in the year in which they are incurred.

71
2.
2.3 Summary of significant accounting policies (continued)
(p)
i)
(a)
(b)
3.
For defined contribution plans, the Authority pays contributions to publicly administered pension insurance plans on a
mandatory basis. The Authority has no further payment obligations once the contributions have been paid. The
contributions are recognised as employee benefit expense when they are due.
Estimates and judgements are continually evaluated and are based on historical experience and other factors, including
experience of future events that are believed to be reasonable under the circumstances.
The Authority makes estimates and assumptions concerning the future. The resulting accounting estimates will, by
definition, seldom equal the related actual results. The estimates and assumptions that have a significant risk of causing
a material adjustment to the carrying amounts of assets and liabilities within the next financial year are addressed
below.
Retirement benefit obligations
The present value of the pension obligations depends on a number of factors that are determined on an actuarial basis
using a number of assumptions. The assumptions used in determining the net cost (income) for pensions include the
discount rate. Any changes in these assumptions will impact the carrying amount of pension obligations.
Critical accounting estimates and assumptions
The Authority determines the appropriate discount rate at the end of each year. This is the interest rate that should be
used to determine the present value of estimated future cash outflows expected to be required to settle the pension
obligations. In determining the appropriate discount rate, the Authority considers the interest rates of governmentbonds
that are denominated in the currency in which the benefits will be paid, and that have terms to maturity approximating
the terms of the related pension obligation.
ZAMBIA REVENUE AUTHORITY
CRITICAL ACCOUNTING ESTIMATES AND JUDGEMENTS
The Authority and all its employees also contribute to the appropriate National Social Security Fund, which is a defined
contribution scheme.
for the year ended 31 December 2016
ADOPTION OF NEW AND REVISED INTERNATIONAL FINANCIAL REPORTING STANDARDS (IFRSS)
(CONTINUED)
NOTES TO THE FINANCIAL STATEMENTS (CONTINUED)
Past-service costs are recognised immediately in income.
The liability recognised in the statement of financial position in respect of defined benefit pension plans is the present
value of the defined benefit obligation at the end of the reporting period less the fair value of plan assets. The defined
benefit obligation is calculated annually by independent actuaries using the projected unit credit method. The present
value of the defined benefit obligation is determined by discounting the estimated future cash outflows using interest
rates of high-quality corporate bonds that are denominated in the currency in which the benefits will be paid, and that
have terms to maturity approximating to the terms of the related pension obligation. In countries where there is no deep
market in such bonds, the market rates on government bonds are used.
Actuarial gains and losses arising from experience adjustments and changes in actuarial assumptions are charged or
credited to equity in other comprehensive income in the period in which they arise.
Employee benefits (continued)
Retirement benefit obligations (continued)
Pension obligations (continued)
Termination benefits
Termination benefits are payable when employment is terminated by the Authority before the normal retirement date, or
whenever an employee accepts voluntary redundancy in exchange for these benefits. The Authority recognises
termination benefits at the earlier of the following dates: (a) when the Authority can no longer withdraw the offer of those
benefits; and (b) when the entity recognises costs for a restructuring that is within the scope of IAS 37 and involvesthe
payment of termination benefits. In the case of an offer made to encourage voluntary redundancy, the termination
benefits are measured based on the number of employees expected to accept the offer. Benefits falling due more than
12 months after the end of the reporting period are discounted to their present value.
Other key assumptions for pension obligations are based in part on current market conditions.

72
4.
Less than 1 Between 1
year and 5 years Over 5 years
K K K
54,489,803
212,925,510
179,703,090
42,721,352
- -
55,800,275
259,714,459
82,346,239
153,011,430
472,639,969
262,049,329
63,913,327
310,791,350
194,594,657
41,776,382
- -
50,435,967
234,747,047
74,429,959
156,125,676 545,538,397 269,024,616
- payables
- employee benefits
At 31 December 2015:
- borrowings
- payables
- employee benefits
ZAMBIA REVENUE AUTHORITY
The Authority’s activities expose it to a variety of financial risks: credit risk and liquidity risk. The Authority’s overall risk
management programme focuses on the unpredictability of financial markets and seeks to minimise potential adverse
effects on its financial performance. The Authority does not hedge any of its risk exposures.
Financial risk management is carried out by the finance department under policies approved by the Governing Board.
The GoverningBoard provides written principles for overall risk management, as well as written policies covering specific
areas such as credit risk and investment of excess liquidity.
FINANCIAL RISK MANAGEMENT OBJECTIVES AND POLICIES
NOTES TO THE FINANCIAL STATEMENTS (CONTINUED)
for the year ended 31 December 2016
Credit risk
Credit risk arises from cash and cash equivalents and deposits with banks and financial institutions, as well as
credit exposure to customers, including outstanding receivables. The Authority does not have significant
concentrations of credit risk. The Authority’s credit controller assesses the credit quality of each customer, taking
into account its financial position, past experience and other factors. Individualrisk limits are set based on internal
or external ratings in accordance with limits set by the Governing Board. The utilisation of credit limits is regularly
monitored.
The table below analyses the Authority’s financial liabilities that will be settled on a net basis into relevantmaturity
groupings based on the remaining period at the reporting date to the contractual maturity date. The amounts
disclosed in the table below are the contractual undiscounted cash flows.
At 31 December 2016:
- borrowings
For cash and cash equivalentbalances, the Authority’s exposure and credit ratings of counterparties are regularly
monitored and the aggregate value of transactions spread amongst approved financial institutions. The Authority
actively seeks to limit the amount of credit exposure to any one financial institution and credit exposure is
controlled by counterparty limits that are reviewedand approvedby the Authority Treasury. For banks and financial
institutions, only independently rated parties with a minimum rating of ‘A’ for International and regional banks with
a local presence are accepted.
No credit limits were exceeded during the reporting period, and the Governing Board do not expect any losses
from non-performance by these counterparties.
Liquidity risk
Liquidity risk is the risk that the Authority will not be able to meet its financial obligations as they fall due. Prudent
liquidity risk management includes maintaining sufficient cash balances, and the availability of funding from an
adequate amount of committed credit facilities. Due to the dynamic nature of the underlying businesses, the
finance department maintains flexibility in funding by maintaining availability under committed credit lines.
Management performs cash flow forecasting and monitor rolling forecasts of the Authority’s liquidity requirements
to ensure it has sufficient cash to meet its operational needs while maintaining sufficient headroom on its undrawn
committed borrowing facilities (Note 25) at all times so that the Authority does not breach borrowing limits or
covenants (where applicable) on any of its borrowing facilities. The Authority's approach when managing liquidity is
to ensure, as far as possible, that it will always have sufficient liquidity to meet its liabilities when due, without
incurring unacceptable losses or risking damage to the Authority's reputation.

73
4.
Carrying value Fair value Carrying value Fair value
2016 2016 2015 2015
Financial assets
Employee loans and advances 33,845,421
33,845,421
17,132,227
17,132,227
Other assets 16,968,754
16,968,754
7,690,366
7,690,366
Customs deposit bank
account 1,840,140
1,840,140
7,060,204
7,060,204
Tax refunds bank accounts 374,988,766
374,988,766
47,799,691
47,799,691
Financial liabilities
Borrowings 447,118,403
447,118,403
597,813,594
597,813,594
Trade and other payables 42,721,352
42,721,352
41,776,382
41,776,382
Customs deposit bank
accounts 1,840,140
1,840,140
7,060,204
7,060,204
Tax refund bank accounts 374,988,766
374,988,766
47,799,691
47,799,691
Fair value Hierarchy as at 31
December 2016
Level 1 Level 2 Level 3 Total
Financial assets
Employee loans and advances - - 33,845,421
33,845,421
Other assets - - 16,968,754
16,968,754
Customs deposit bank account - - 1,840,140
1,840,140
Tax refunds bank accounts - - 374,988,766
374,988,766
Financial liabilities
Borrowings - - 447,118,403
447,118,403
Trade and other payables - - 42,721,352
42,721,352
Customs deposit bank
accounts - - 1,840,140
1,840,140
Tax refund bank accounts - - 374,988,766
374,988,766
There were no financial assets and liabilities that are measured at fair value on a recurring basis during the period.
Fair value of financial assets and financial liabilities that are not measured at fair value on a recurring
basis (but fair value disclosures are required)
Except as detailed in the following table, the directors consider that the carrying amounts of financial assets and
financial liabilities recognised in the financial statements approximate their fair values.
Capital management
The Authority’s objectives when managing capital are to safeguard the Authority’s ability to continue as a going
concern. Adequacy of the capital of the Authority is maintained by the Authority on a regular basis. As and when
required the Authority will request supplementary funding from the Ministry of Finance.
Fair value of the Authority’s financial assets and financial liabilities that are measured at fair value on a
recurring basis.
Fair value measurements
This hierarchy requires the use of observable market data when available. The Authority considers relevant and
observable market prices in its valuations where possible.
FINANCIAL RISK MANAGEMENT OBJECTIVES AND POLICIES (CONTINUED)
NOTES TO THE FINANCIAL STATEMENTS (CONTINUED)
for the year ended 31 December 2016
ZAMBIA REVENUE AUTHORITY

74
5. 2016 2015
K K
427,354,807
378,801,101
Supplementary funding 14,466,031
50,197,570
441,820,838
428,998,671
6.
7.
2,010,390 315,722 1,929,102
2,002,172
1,772,761
1,662,436
1,218,370
1,889,211
6,930,623
5,869,541
8.
10,176,441
3,879,790
4,003,228
18,534,276
(5,217,160)
(12,237,625)
8,962,509
10,176,441
4,736,177
7,369,441
4,006,136
2,295,188
220,196
511,812
8,962,509
10,176,441
Rental income arises from the excess office space that is let to third
parties.
INVESTMENT CLIMATE FACILITY AND NORWEGIAN
Tax Administration grants
Norwegian Tax Administration (NTA)
Mineral Value Chain Monitoring project (MVCMP)
At end of the year
for the year ended 31 December 2016
Annual budgetary allocation
OTHER INCOME
Asycuda processing fees are derived from the charge of K324.50 per
transaction for the processing of imported goods at the borders. This
income is partly used to maintain the scanners that process imported
goods.
GOVERNMENT GRANTS
ZAMBIA REVENUE AUTHORITY
NOTES TO THE FINANCIAL STATEMENTS (CONTINUED)
The Authority has an existing memorandum of understanding with the Royal Norwegian Government for
strengthening of Tax Administration through the Norwegian Tax Administration (NTA) agreement. In addition, an
agreement exists for the strengthening of mining monitoring and mining tax administration through the Mineral Value
Chain Monitoring Project. Under the Investment Climate Facility for Africa (ICF) and ZRA bilateral agreement, the
former made part contribution to the software for the Tax Online which was mainly financed by Government, in
particular phase 1 dealing with e- services and change management activities.
Supplementary funding mainly comprises K10 million accrued GRZ
counterpart funding for the Mineral Value Chain Monitoring Project, K3.5
million supplementary funding for VAT audits and revenue mobilisation.
ASYCUDA PROCESSING FEES
Gain on disposal of property and equipment
Cigarette stamps sales proceeds
Broken down as follows:
Investment Climate Facility (ICF)
Receipts during the year
Recognised in statement of comprehensive income
At beginning of the year
Rental income
Sundry income
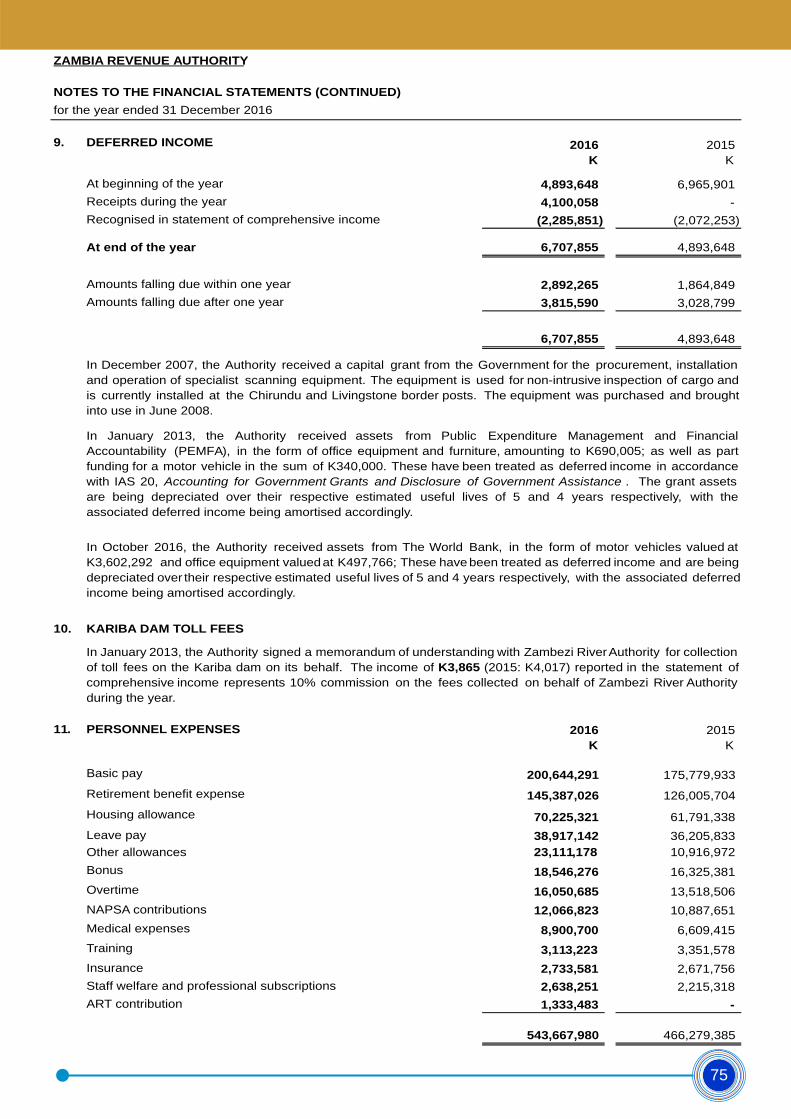
75
9. DEFERRED INCOME 2016 2015
K K
At beginning of the year 4,893,648
6,965,901
Receipts during the year 4,100,058
-
Recognised in statement of comprehensive income (2,285,851)
(2,072,253)
At end of the year 6,707,855
4,893,648
Amounts falling due within one year 2,892,265
1,864,849
Amounts falling due after one year 3,815,590
3,028,799
6,707,855
4,893,648
10. KARIBA DAM TOLL FEES
11. PERSONNEL EXPENSES 2016 2015
K K
Basic pay 200,644,291
175,779,933
Retirement benefit expense 145,387,026
126,005,704
Housing allowance 70,225,321
61,791,338
Leave pay 38,917,142
36,205,833
Other allowances 23,111,178
10,916,972
Bonus 18,546,276
16,325,381
Overtime 16,050,685
13,518,506
NAPSA contributions 12,066,823
10,887,651
Medical expenses 8,900,700
6,609,415
Training 3,113,223
3,351,578
Insurance 2,733,581
2,671,756
Staff welfare and professional subscriptions 2,638,251
2,215,318
ART contribution 1,333,483
-
543,667,980
466,279,385
In January 2013, the Authority received assets from Public Expenditure Management and Financial
Accountability (PEMFA), in the form of office equipment and furniture, amounting to K690,005; as well as part
funding for a motor vehicle in the sum of K340,000. These have been treated as deferred income in accordance
with IAS 20, Accounting for Government Grants and Disclosure of Government Assistance . The grant assets
are being depreciated over their respective estimated useful lives of 5 and 4 years respectively, with the
associated deferred income being amortised accordingly.
In January 2013, the Authority signed a memorandum of understanding with Zambezi RiverAuthority for collection
of toll fees on the Kariba dam on its behalf. The income of K3,865 (2015: K4,017) reported in the statement of
comprehensive income represents 10% commission on the fees collected on behalf of Zambezi River Authority
during the year.
In December 2007, the Authority received a capital grant from the Government for the procurement, installation
and operation of specialist scanning equipment. The equipment is used for non-intrusive inspection of cargo and
is currently installed at the Chirundu and Livingstone border posts. The equipment was purchased and brought
into use in June 2008.
for the year ended 31 December 2016
NOTES TO THE FINANCIAL STATEMENTS (CONTINUED)
ZAMBIA REVENUE AUTHORITY
In October 2016, the Authority received assets from The World Bank, in the form of motor vehicles valued at
K3,602,292 and office equipment valuedat K497,766; These have been treated as deferred income and are being
depreciated over their respective estimated useful lives of 5 and 4 years respectively, with the associated deferred
income being amortised accordingly.

76
12. ADMINISTRATIVE EXPENSES 2016 2015
K K
Repairs and maintenance - buildings 9,476,793
15,130,771
Printing and stationery 5,961,077
3,599,816
Travel expenses 5,503,968
6,863,120
Subscriptions and publications 3,806,724
3,260,797
Advertising and public relations 3,596,670
4,415,833
Electricity, water and rates 3,421,571
2,423,522
Motor vehicle repairs 3,105,866
2,769,752
Postage and telephones 2,772,210
2,080,025
Fuel 2,478,680
2,121,968
Office rentals 1,636,266
596,466
Corporate social responsibility 1,619,446
630,056
Staff uniforms 1,531,738 525,995
Board expenses 1,449,316 1,158,900
Motor vehicle insurance and licence 1,249,171 1,638,257
Audit expenses 713,869 455,000
Insurance 657,745 392,995
Bank charges 447,457 482,085 Impairment of other assets (831,783) 9,664,759
48,596,784
58,210,117
13. OTHER OPERATING EXPENSES
Repairs and maintenance - IT 32,733,193
16,062,796
Travel/relocation 14,302,852
19,828,187 Security 12,524,232
9,811,413
Advertising/promotional material and conferences 3,762,558
3,662,295
Legal and professional expenses 2,205,121
1,746,291
Field work - fuel 2,195,365
2,190,204
Scanner operations 1,904,257
2,036,695
Printing and stationery 1,602,675
1,354,252
Cigarette stamps 1,407,844
1,171,388
Other professional fees 1,105,413
735,344
73,743,510
58,598,865
14. FINANCE INCOME
Relates to interest income on short term bank deposits.
15. NET EXCHANGE GAINS (LOSSES)
The movements in the US Dollar exchange rates
during the year were as follows:
Mid market exchange rate at 1 January 11.1 6.4
Mid market exchange rate at 31 December 9.8 10.9
Average appreciation (depreciation) 11.4% (70.3%)
The Zambian Kwacha appreciated against the US Dollar and other major convertible foreign currencies during the
year. The impact of the appreciation of the Zambian Kwacha during the year is that the Authority earned net
unrealised exchange gains on its foreign currency denominated monetary liabilities.
NOTES TO THE FINANCIAL STATEMENTS (CONTINUED)
for the year ended 31 December 2016
ZAMBIA REVENUE AUTHORITY

77
ZA
MB
IA R
EV
EN
UE
AU
TH
OR
ITY
16
.P
RO
PE
RT
Y A
ND
EQ
UIP
ME
NT
Le
as
eh
old
lan
d
Le
as
eh
old
bu
ild
ing
s
Pla
nt
an
d
ma
ch
ine
ry
Off
ice
eq
uip
me
nt
Mo
tor
ve
hic
les
Fu
rnit
ure
fix
ture
s a
nd
fitt
ing
s
Ca
pit
al w
ork
in
pro
gre
ss
To
tal
KK
KK
KK
KK
Ye
ar
en
de
d 3
1 D
ec
em
be
r 2
01
5
Op
en
ing
ca
rryi
ng
am
ou
nt
32
,80
9,9
00
17
3,6
03
,50
0
31
3,5
09
,85
0
22
,79
5,5
03
9,9
83
,52
6
4,3
85
,98
0
30
,50
6,4
11
58
7,5
94
,67
0
Ad
diti
on
s7
2,0
00
-1
8,3
00
12
,87
6,9
04
3,4
67
,65
2
2,3
14
,12
5
46
,86
6,4
91
65
,61
5,4
72
Tra
nsf
ers
-6
,91
5,7
96
--
--
(6,9
15
,79
6)
-
Write
off
--
--
--
(8,7
68
,22
2)
(8
,76
8,2
22
)
Dis
po
sals
--
-(2
3,2
45
)
(2
,87
9,5
59
)
(42
,14
5)
-
(2,9
44
,94
9)
Elim
ina
ted
on
dis
po
sal
-3
23
,90
0
-
17
5
2
,41
6,5
11
4
2,1
45
-
2,7
82
,73
1
De
pre
cia
tion
ch
arg
e-
(3,0
26
,59
1)
(35
,98
9,4
55
)
(7
,48
4,2
35
)
(4
,74
7,1
60
)
(1,6
10
,87
9)
-(5
2,8
58
,32
0)
Clo
sin
g c
arr
yin
g a
mo
un
t3
2,8
81
,90
0
1
77
,81
6,6
05
27
7,5
38
,69
5
2
8,1
65
,10
2
8,2
40
,97
0
5
,08
9,2
26
6
1,6
88
,88
4
59
1,4
21
,38
2
At
31
De
ce
mb
er
20
15
Co
st o
r va
lua
tion
32
,88
1,9
00
1
84
,90
8,5
57
36
7,5
50
,44
4
6
9,4
61
,41
3
38
,73
4,3
59
1
2,9
41
,72
0
6
1,6
88
,88
4
76
8,1
67
,27
7
A
ccu
mu
late
d d
ep
reci
atio
n-
(7
,09
1,9
52
)
(90
,011
,74
9)
(4
1,2
96
,311
)
(3
0,4
93
,38
9)
(7,8
52
,49
4)
-(1
76
,74
5,8
95
)
Ca
rryi
ng
am
ou
nt
32
,88
1,9
00
1
77
,81
6,6
05
27
7,5
38
,69
5
2
8,1
65
,10
2
8,2
40
,97
0
5
,08
9,2
26
6
1,6
88
,88
4
59
1,4
21
,38
2
Ye
ar
en
de
d 3
1 D
ec
em
be
r 2
01
6
Op
en
ing
ca
rryi
ng
am
ou
nt
32
,88
1,9
00
1
77
,81
6,6
05
27
7,5
38
,69
5
2
8,1
65
,10
2
8,2
40
,97
0
5
,08
9,2
26
6
1,6
88
,88
4
59
1,4
21
,38
2
A
dd
itio
ns
-
-
1
28
,99
7
2
,70
7,7
35
7,1
18
,18
2
1
,17
2,5
57
1
2,3
11,2
72
23
,43
8,7
43
D
isp
osa
ls-
-
-
(1
43
,04
3)
(4,2
00
,84
8)
(93
,20
1)
-
(4
,43
7,0
92
)
T
ran
sfe
rs-
10
,04
3,4
37
41
5,9
17
-
-
-
(10
,45
9,3
54
)
-
D
ep
reci
atio
n c
ha
rge
-
(5,0
65
,28
3)
(35
,99
1,2
92
)
(8,9
07
,93
1)
(3,9
11,7
91
)
(1,8
76
,01
8)
-
(55
,75
2,3
15
)
Elim
ina
ted
on
dis
po
sal
-
-
-
92
,78
2
3,8
84
,49
3
-
-
3,9
77
,27
5
Clo
sin
g c
arr
yin
g a
mo
un
t3
2,8
81
,90
0
18
2,7
94
,75
9
24
2,0
92
,31
7
21
,91
4,6
45
11,1
31
,00
6
4,2
92
,56
4
63
,54
0,8
02
55
8,6
47
,99
3
A
t 3
1 D
ec
em
be
r 2
01
6
Co
st o
r va
lua
tion
32
,88
1,9
00
19
4,2
74
,09
3
36
8,0
95
,35
8
72
,22
3,3
07
43
,57
1,6
93
14
,02
1,0
77
63
,54
0,8
01
78
8,6
08
,22
9
A
ccu
mu
late
d d
ep
reci
atio
n-
(11
,47
9,3
34
)
(12
6,0
03
,04
1)
(50
,30
8,6
62
)
(32
,44
0,6
87
)
(9,7
28
,51
2)
-
(22
9,9
60
,23
6)
Ca
rryi
ng
am
ou
nt
32
,88
1,9
00
18
2,7
94
,75
9
24
2,0
92
,31
7
21
,91
4,6
45
11,1
31
,00
6
4,2
92
,56
5
63
,54
0,8
01
55
8,6
47
,99
3
NO
TE
S T
O T
HE
FIN
AN
CIA
L S
TA
TE
ME
NT
S (
CO
NT
INU
ED
)
for
the
ye
ar
en
de
d 3
1 D
ece
mb
er
20
16

78
ZAMBIA REVENUE AUTHORITY
16. PROPERTY AND EQUIPMENT (CONTINUED)
•
•
•
2016 2015
K K
Cost 113,979,452
104,613,915 Accumulated depreciation (13,405,115)
(12,928,084)
Carrying amount 100,574,337
91,685,831
17. INTANGIBLE ASSETS
Software
Capital works in
progress Total
K K K
Year ended 31 December 2015
Opening carrying amount 26,942,353
29,872,458
56,814,811
Additions 9,225,067
-
9,225,067
Transfers 5,970,715
(5,970,715)
-
Capital work in progress written off -
(19,992,998)
(19,992,998)
Amortisation charge for the year (3,348,549)
-
(3,348,549)
Closing carrying amount 38,789,586
3,908,745
42,698,331
At at 31 December 2015
Cost 45,766,894
3,908,745
49,675,639
Accumulated amortisation (6,977,308)
-
(6,977,308)
Carrying amount 38,789,586
3,908,745
42,698,331
Level 2 fair values were derivedusing comparable value of similar buildings adjusted for differences in key attributes
such as property size and condition. The most significant input into this valuation is the price per square metre.
If buildings were stated on the historical cost basis, the amounts would be as follows:
Level 2: inputs other than quoted prices that are observable for the asset or liability, either directly (for
example, as prices) or indirectly (for example, derived from prices).
Level 3: inputs for the asset or liability that are not based on observable market data.
The buildings are all classified as Level 2 and are recurring fair value measurements with significant observable
inputs. There were no transfers between different levels during the year.
Valuation techniques to derive Level 2 fair values
for the year ended 31 December 2016
NOTES TO THE FINANCIAL STATEMENTS (CONTINUED)
The Authority holds title to the Revenue House and an institutional house. However, the Governmentholds title to
all other properties transferred to the Authority in 1994.
Fair values of buildings
An independent valuation of the Authority’s buildings was performed by valuers, Bitrust Real Estate Limited to
determine the fair value of the land buildings. The last valuation was performed in 2013. The revaluation surplus is
credited to other comprehensive income and is shown in revaluation reserves' in capital fund and reserves. The
Authority carries out valuation every five years to ensure that the carrying amount of the buildings does not
significantly differ from the fair value.
The different levels have been defined as follows:
Level 1: quoted prices (unadjusted) in active markets for identical assets or liabilities.

79
ZAMBIA REVENUE AUTHORITY
17. INTANGIBLE ASSETS (CONTINUED)
Software
Capital works in
progress Total
K K K
Year ended 31 December 2016
Opening carrying amount 45,766,894
3,908,745
49,675,639
Additions -
5,558,440
5,558,440
Amortisation brought forward (6,977,308)
-
(6,977,308)
Amortisation charge for the year (4,120,023)
-
(4,120,023)
Closing carrying amount 34,669,563
9,467,185
44,136,748
At at 31 December 2016
Cost 45,766,894
9,467,185
55,234,079
Accumulated amortisation(11,097,331)
-
(11,097,331)
Carrying amount 34,669,563
9,467,185
44,136,748
Capital works in progress relate to Tax Online System.
18. INVENTORIES 2016 2015
K K
517,402 577,310 1,431,574 487,220
531,219
-
260,177
102,312
2,740,372
1,166,842
19.
11,224,712
6,555,664
6,860,772
4,712,066
6,884,150
3,755,463
1,228,686
1,937,021
8,147,101
554,013
34,345,421
17,514,227
(500,000)
(382,000)
33,845,421
17,132,227
25,384,066
12,849,170
8,461,355
4,283,057
33,845,421
17,132,227
Interest is charged at 5% per annum for all employee loans.
Home ownership loans
Vehicle ownership loans
Total employee loans and advances
Amounts falling due within one year
Amounts falling due after one year
The cost of inventories recognised in operating expenditure during the
year was K2.7 million (2015: K1.1 million).
No allowance has been made for obsolescence and slow moving inventory
( 2015: Nil).
Uniforms
Other consumables
NOTES TO THE FINANCIAL STATEMENTS (CONTINUED)
for the year ended 31 December 2016
Stationery
Cigarette stamps
EMPLOYEE LOANS AND ADVANCES
Other loans
Personal loans
Impairment allowance
Advances against gratuity

80
ZAMBIA REVENUE AUTHORITY
19. 2016 2015
K K
Staff loans marked to market
17,514,227
12,061,947
19,104,773
5,514,578
(2,773,579)
(62,298)
33,845,421
17,514,227
% %
Personal loan 5 5
Personal Development loan 5 5
House 5 5
Car loan 5 5
382,000
-
Recognised as an expense in current year 118,000
382,000
Balance at end of the year 500,000
382,000
20.
10,000,000 1,692,810 6,101,456 3,114,088
867,298
6,695,357
(833,848)
(3,811,889)
16,134,906
7,690,366
3,811,889
-
Utilisation of provision (2,978,041)
3,811,889
Balance at end of the year 833,848
3,811,889
21.
53,254,724
113,188,202
45,659,216
107,598,125
4,696,362
1,443,267
1,866,430
2,997,851
563,783
595,541
415,718
524,393
10,000
-
9,760
-
9,065
9,725
8,840
9,900
8,800
-
6,750
9,400
53,254,724 113,188,202
Amortisation to profit or loss
Current year fair value
At beginning of year
NOTES TO THE FINANCIAL STATEMENTS (CONTINUED)
for the year ended 31 December 2016
EMPLOYEE LOANS AND ADVANCES (CONTINUED)
Cash on hand
Employee loans and advances are offered on concessionary rates. House, Car and personal development loans are
enhanced by collateral of landed property and in the case of car loans, the vehicle registration certificate is
endorsed with the Authority as absolute owner.
Where staff loans are issued to members of staff at concessionary rates, fair value is calculated based on market
rates. This will result in the long term staff loans benefit as shown above.
The maximum exposure to credit risk at the reporting date is the carrying value of each class of receivables
mentioned above.
OTHER ASSETS
Prepayments
Stanbic Bank
Movement in the impairment allowance
At beginning of year
The prevailing interest rates on staff loans were as follows :
Funding receivable from GRZ
Impairment allowance
Movement in the impairment allowance
At beginning of year
The carrying amounts of the other receivables approximate to their fair values. None of the aboveassets are past
due or impaired.
Total cash and cash equivalents
Cash at bank and in hand
Other receivables
Held as follows:
CASH AND CASH EQUIVALENTS
First National
Indo Zambia
Eco Bank
Zambia National Commercial Bank
Bank of Zambia ( Asycuda Fees)
Finance Bank Zambia
Citi Bank
Standard Chartered Bank
Bank ABC

81
ZAMBIA REVENUE AUTHORITY
22. 2016 2015
K K
117,492,120
116,608,736
280,368,853
243,004,237
397,860,973
359,612,973
59,679,146
53,941,946
338,181,827
305,671,027
397,860,973
359,612,973
359,612,973
345,484,973
(62,431,000)
(19,992,000)
59,143,000
14,459,000
81,226,000
78,517,000
(39,690,000)
(58,856,000)
397,860,973 359,612,973
59,143,000 14,459,000
81,226,000 78,517,000
140,369,000 92,976,000
Retirement End of contract Retirement End of contract
benefits gratuities benefits gratuities
23.5% 23.5% 15.5% 18.0%
11.0% 11.0% 11.0% 11.0%
15.0% 18.0% 11.0% 11.0%
Change in
assumption
Increase in
assumption
Decrease in
assumption
0.50% Decrease by 3.2% Increase by 2%
0.50% Increase by 3.4%Decrease by
3.3%
Benefits paid by the plan
31 December 2015
The significant actuarial assumptions were as follows:
31 December 2016
Impact on defined benefit obligation
Discount Rate
Inflation
Future Salary Increases
Assumptions regarding future experience are set on actual advice in accordance with actuaries.
The sensitivity of the defined benefit obligation to changes in the weighted principal assumptions is:
The above sensitivity analysis are based on a change in an assumption while holding all other assumptions
constant. In practice, this is unlikely to occur, and changes in some of the assumptions may be correlated. When
calculating the sensitivity of the defined benefit obligation to significant actuarial assumptions the same method
(present value of the defined benefit obligation calculated with the projected unit credit method at the end of the
reporting period) has been applied as when calculating the pension liability recognised within the statement of
financial position.
Expense recognised in deficit or surplus
Amounts falling due within one year
Amounts falling due after one year
Defined benefit obligations at 1 January
NOTES TO THE FINANCIAL STATEMENTS (CONTINUED)
for the year ended 31 December 2016
EMPLOYEE BENEFITS
Discount rate
Salary growth rate
End of contract gratuity
Service costs
Interest costs
Retirement benefits
Actuarial gains
Movement in the present value of the defined benefit
Service costs
Interest cost
obligations:
Defined benefit obligation at end of year

82
ZAMBIA REVENUE AUTHORITY
23. 2016 2015
K K
24,699,763
25,451,428
13,052,249
13,598,123
4,969,340
2,726,831
42,721,352
41,776,382
24.
447,118,403
597,813,594
60,125,823 63,913,327
386,992,580 533,900,267
447,118,403 597,813,594
597,813,594 350,168,102 (62,166,250)
(40,444,651)
(88,528,941)
288,090,143
447,118,403
597,813,594
25.
26.
27,011,660
29,564,461
1,268,711
1,415,102
(15,250)
16,820,128
28,265,121
47,799,691
The tax refunds bank accounts relate to monies from the Government
being amounts payable to tax payers on their claims for tax paid. The
corresponding liability to refund tax payers is shown as a payable.
At beginning of year
Paid during the year
Loan from Ministry of Finance
BORROWINGS
PAYABLES
The carrying amounts of the above payables and accrued expenses
approximate to their fair values.
Amounts falling due within one year
Net exchange (gains) losses during the year
In 2012, the Authority assumed a subsidiary loan which the Government
of the Republic of Zambia secured from the People’s Republic of China
for procurement, installation and operation of 8 non-intrusive scanning
equipment from Exim Bank.
The loan is for a duration of 13 years at a fixed interest rate of 2% per
annum. Under the terms of this loan, the Authority is to pay annual
interest amounts in two instalments starting 2013, while principal
repayments commenced in 2015. As the loan is denominated in
Chinese Yuen (CYN), the Authority is exposed to exchange rate risk.
TAX REFUNDS BANK ACCOUNTS
Customs deposits bank accounts
The Customs deposits bank accounts relate to monies held on behalf of
importers pending assessments. The Customs and Excise Act,
Chapter 322 of the Laws of Zambia requires that after 30 days any
monies not refunded to importers must be returned to the Government.
The corresponding liability to refund importers is included as a payable.
Value Added Tax (VAT) refund
Income tax refund
Customs refund
CUSTOMS DEPOSITS BANK ACCOUNTS
Amounts falling due after one year
NOTES TO THE FINANCIAL STATEMENTS (CONTINUED)
for the year ended 31 December 2016
Accrued leave pay
Accrued expenses
Trade payables

83
ZAMBIA REVENUE AUTHORITY
27.
28. 2016 2015K K
13,000,000 32,000,000
1,106,565 1,523,398 2,213,130 3,046,797
3,319,694 4,570,195
29.
427,354,807 428,998,671
62,166,250 40,444,649
489,521,057 469,443,320
17,696,960 16,204,521
4,973,590 4,125,604
1,020,862 655,570
23,691,412 20,985,695
3,520,049
237,389
Key management personnel compensation
The Authority leases various properties under non-cancellable operating
lease. The lease terms are between 1 and 5 years, and the majority of
the lease agreements are renewable at the end of the lease period at
market rates.
The future aggregate minimum lease payments under non-cancellable
operating leases are as follows:
Not later than 1 year
Later than 1 year and not later than 5 years
RELATED PARTY TRANSACTIONS
Funding received from Government
Scanner loan repayments to Government
Transactions with Government
Salaries and other short-term employment benefits
Post-employment benefits
Directors Fees
Key management includes Governing Board and members of senior
management. The compensation paid or payable to key management
for employee services is shown below:
The Authority has been providing short term loans to key management
personel at rates below avarage commercial rates of interest. The loans
are unsecured.
Operating lease commitments
Capital expenditure contracted for at the end of the reporting period but
not recognised in the financial statements is as follows:
Property, plant and equipment
Loans to Commissioners
Loans and advances
There were legal proceedings outstanding against the Authority, which
were awaiting ruling/judgment by the courts of law as at 31 December
2016. In the opinion of the Governing Board, these claims and lawsuits
in aggregate will not have a significant adverse effect on the financial
statements. All tax related litigation claims will be funded by the
Government if they materialise.
COMMITMENTS
NOTES TO THE FINANCIAL STATEMENTS (CONTINUED)
for the year ended 31 December 2016
Capital commitments
CONTINGENT LIABILITIES

84


