Download - Lindero Mine Production New Scenario
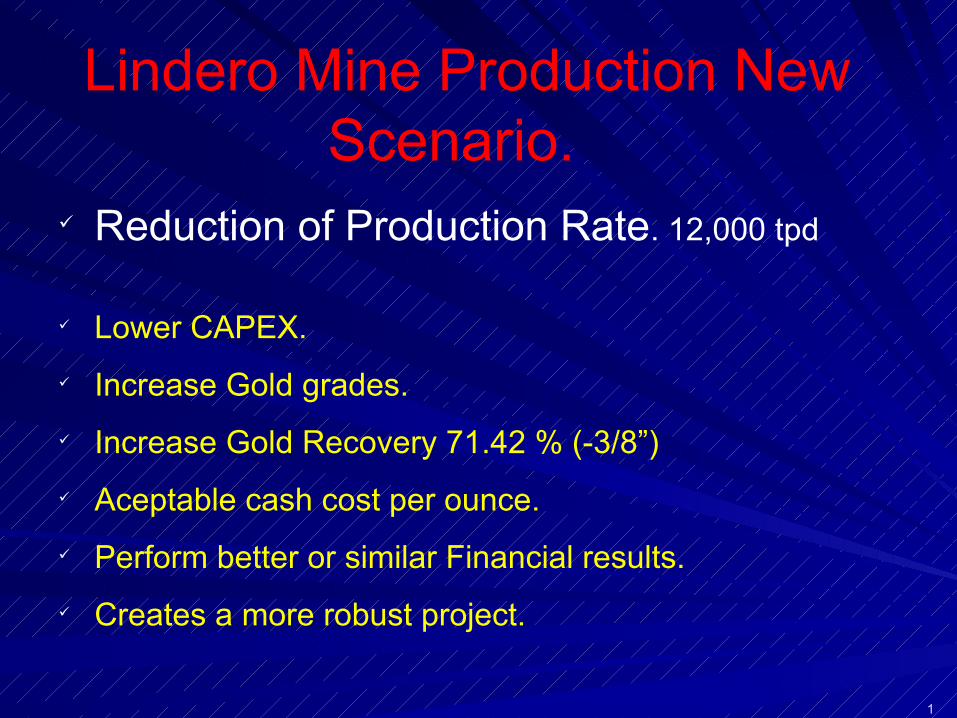
Lindero Mine Production New Scenario.
1
ü Reduction of Production Rate. 12,000 tpd
ü Lower CAPEX.
ü Increase Gold grades.
ü Increase Gold Recovery 71.42 % (-3/8”)
ü Aceptable cash cost per ounce.
ü Perform better or similar Financial results.
ü Creates a more robust project.
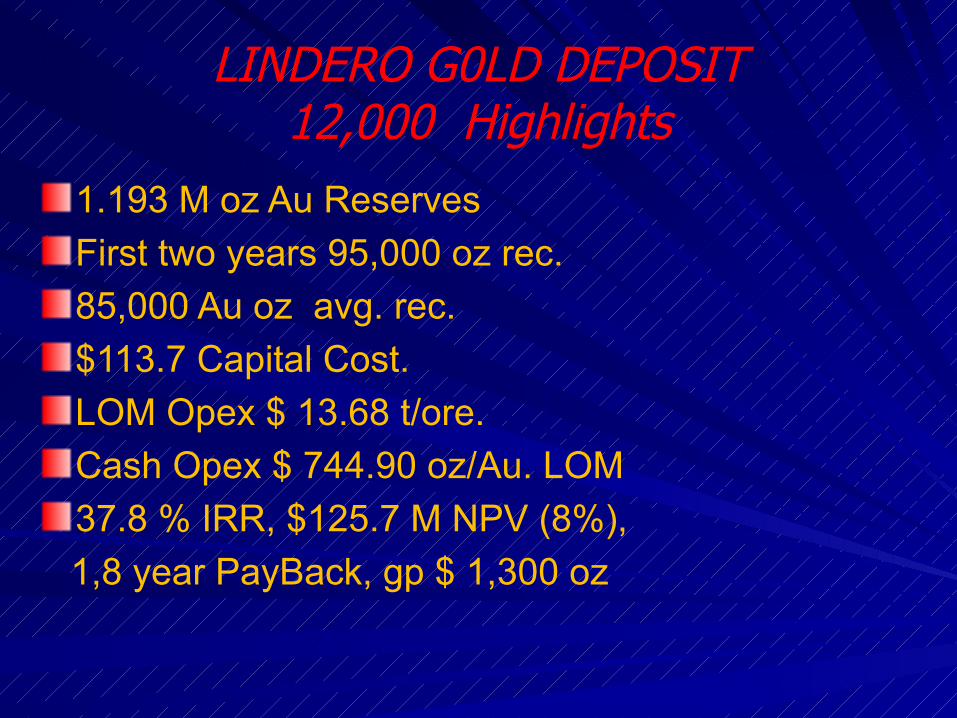
LINDERO G0LD DEPOSIT12,000 Highlights
1.193 M oz Au Reserves
First two years 95,000 oz rec.
85,000 Au oz avg. rec.
$113.7 Capital Cost.
LOM Opex $ 13.68 t/ore.
Cash Opex $ 744.90 oz/Au. LOM
37.8 % IRR, $125.7 M NPV (8%),
1,8 year PayBack, gp $ 1,300 oz
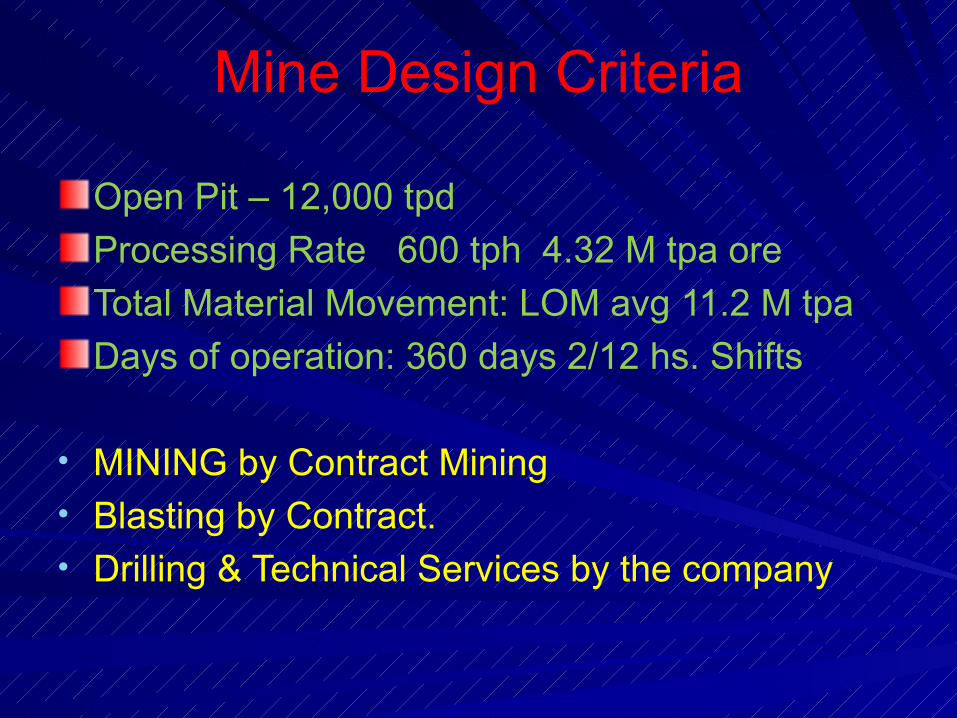
Mine Design Criteria
Open Pit – 12,000 tpd
Processing Rate 600 tph 4.32 M tpa ore
Total Material Movement: LOM avg 11.2 M tpa
Days of operation: 360 days 2/12 hs. Shifts
• MINING by Contract Mining • Blasting by Contract.• Drilling & Technical Services by the company
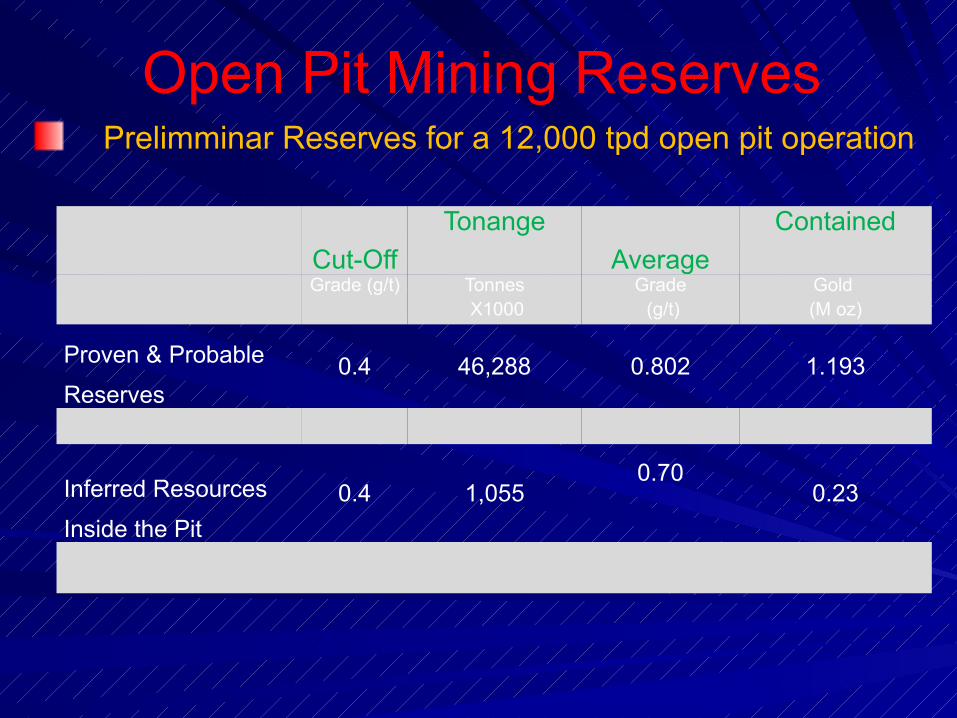
Open Pit Mining Reserves Prelimminar Reserves for a 12,000 tpd open pit operation
Cut-Off
Tonange
Average
Contained
Grade (g/t) Tonnes X1000
Grade (g/t)
Gold (M oz)
Proven & Probable
Reserves0.4 46,288 0.802 1.193
Inferred Resources
Inside the Pit
0.4 1,0550.70
0.23
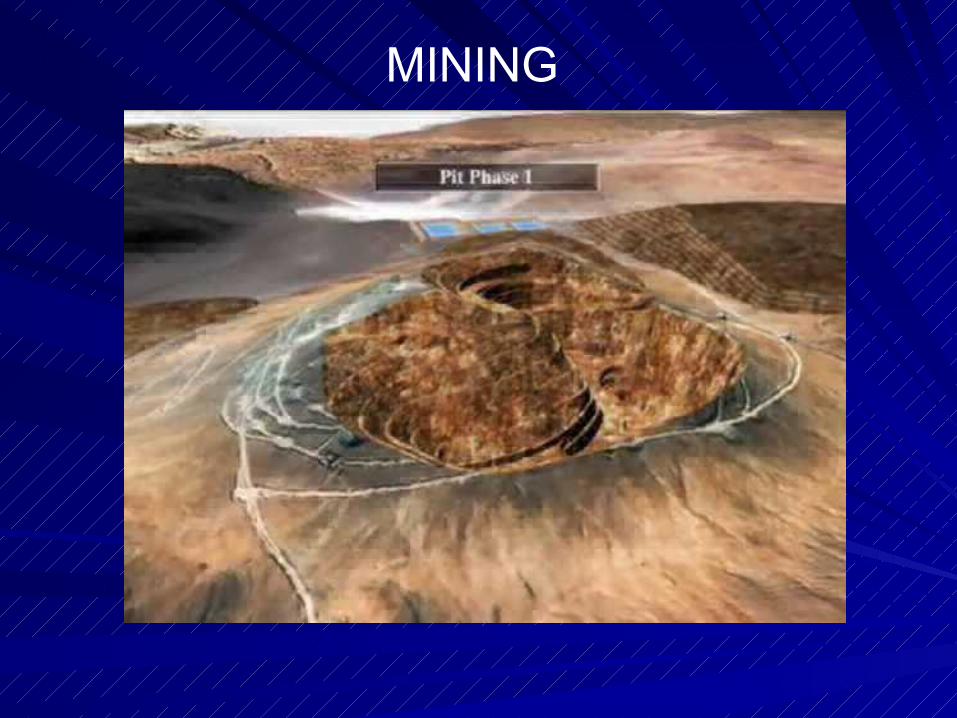
MINING

Plant Design Criteria
ØCrushing and Materials HandlingTwo Crushing Stages
Crushing-
Cone Crushing
& HPGR
Conveyors Belts
to Fine Stockpile.
Grain Size -3/4”
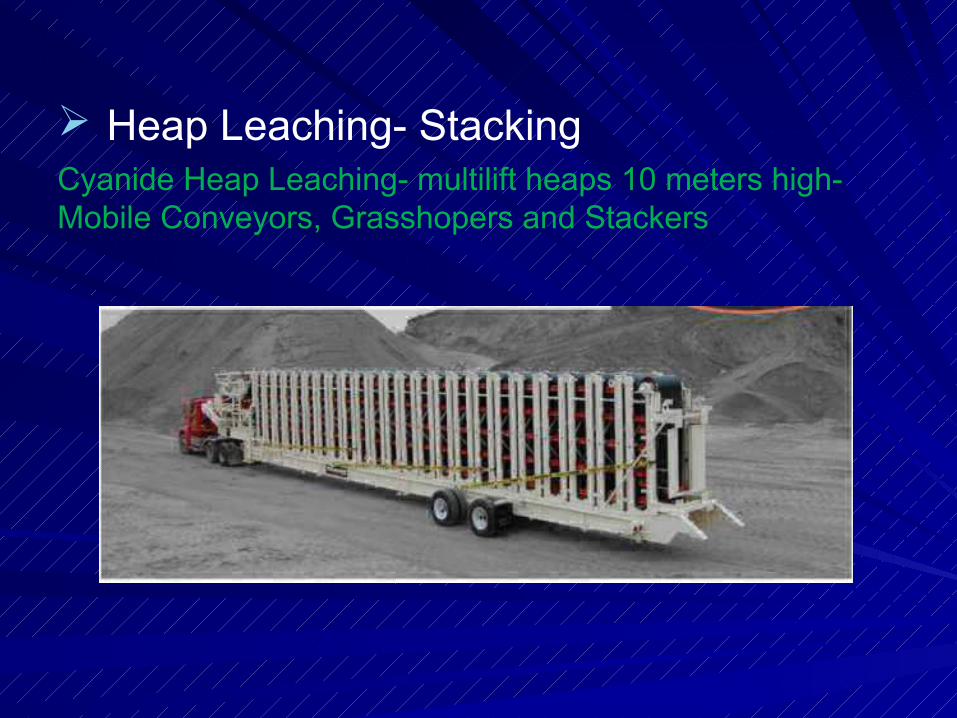
Ø Heap Leaching- Stacking Cyanide Heap Leaching- multilift heaps 10 meters high- Mobile Conveyors, Grasshopers and Stackers
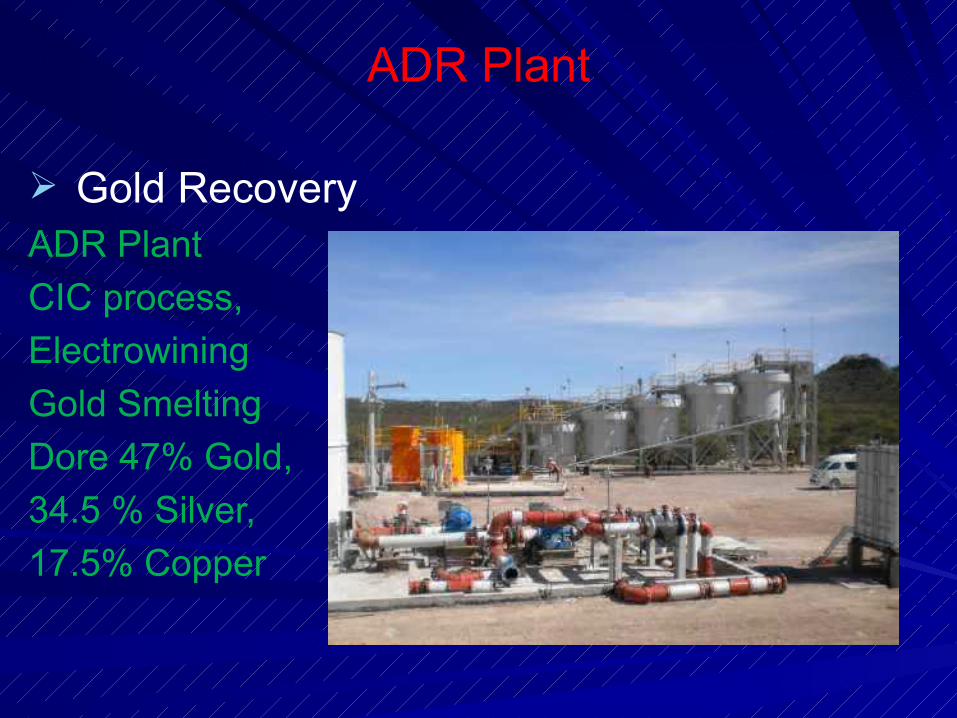
ADR Plant
Ø Gold RecoveryADR Plant
CIC process,
Electrowining
Gold Smelting
Dore 47% Gold,
34.5 % Silver,
17.5% Copper
Infrastructure Power Generation by NG power Plant
NG transported by Trucks 160 km away.
Water source nearby, two new spots.
Office, Living quarters at site.
Railway line 70 km away.
Air Strip nearby.
Port facilities 550 km by road.
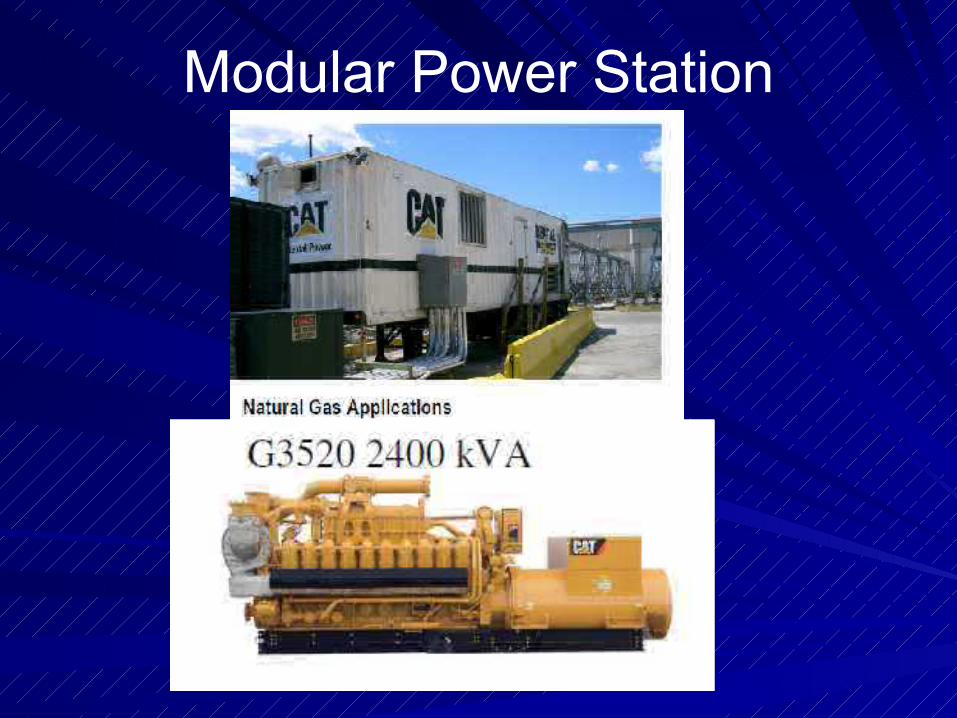
Modular Power Station
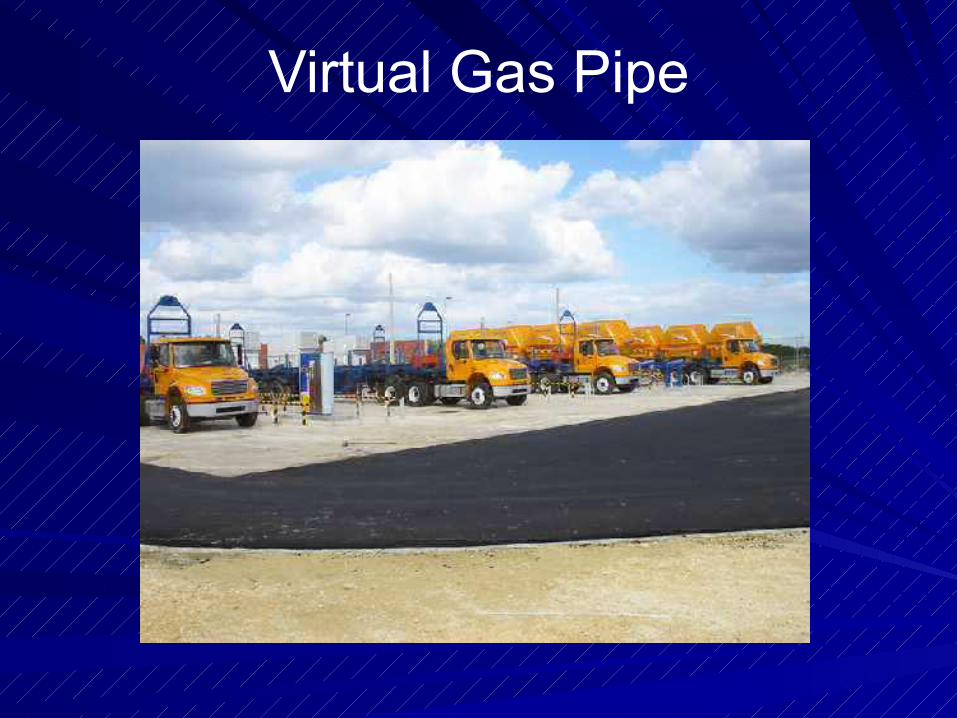
Virtual Gas Pipe
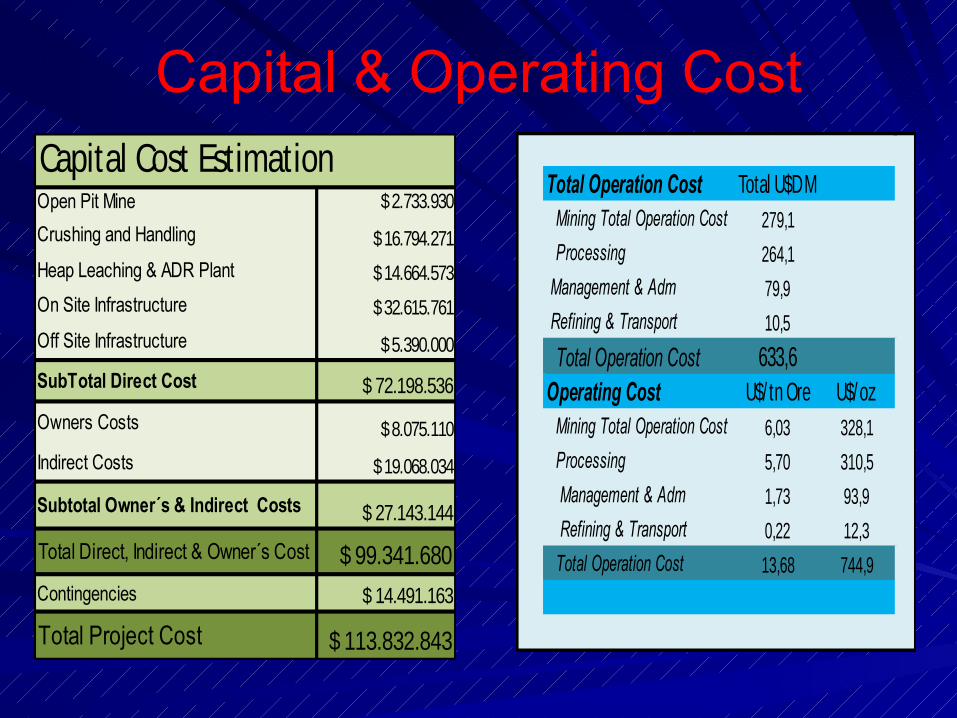
Capital & Operating CostCapital Cost EstimationOpen Pit Mine $ 2.733.930
Crushing and Handling $ 16.794.271
Heap Leaching & ADR Plant $ 14.664.573
On Site Infrastructure $ 32.615.761
Off Site Infrastructure $ 5.390.000
SubTotal Direct Cost $ 72.198.536
Owners Costs $ 8.075.110
Indirect Costs $ 19.068.034
Subtotal Owner´s & Indirect Costs $ 27.143.144
Total Direct, Indirect & Owner´s Cost $ 99.341.680Contingencies $ 14.491.163
Total Project Cost $ 113.832.843
Total Operation Cost Total U$D MMining Total Operation Cost 279,1
Processing 264,1
Management & Adm 79,9
Refining & Transport 10,5
Total Operation Cost 633,6Operating Cost U$/ tn Ore U$/oz
Mining Total Operation Cost 6,03 328,1
Processing 5,70 310,5
Management & Adm 1,73 93,9
Refining & Transport 0,22 12,3
Total Operation Cost 13,68 744,9
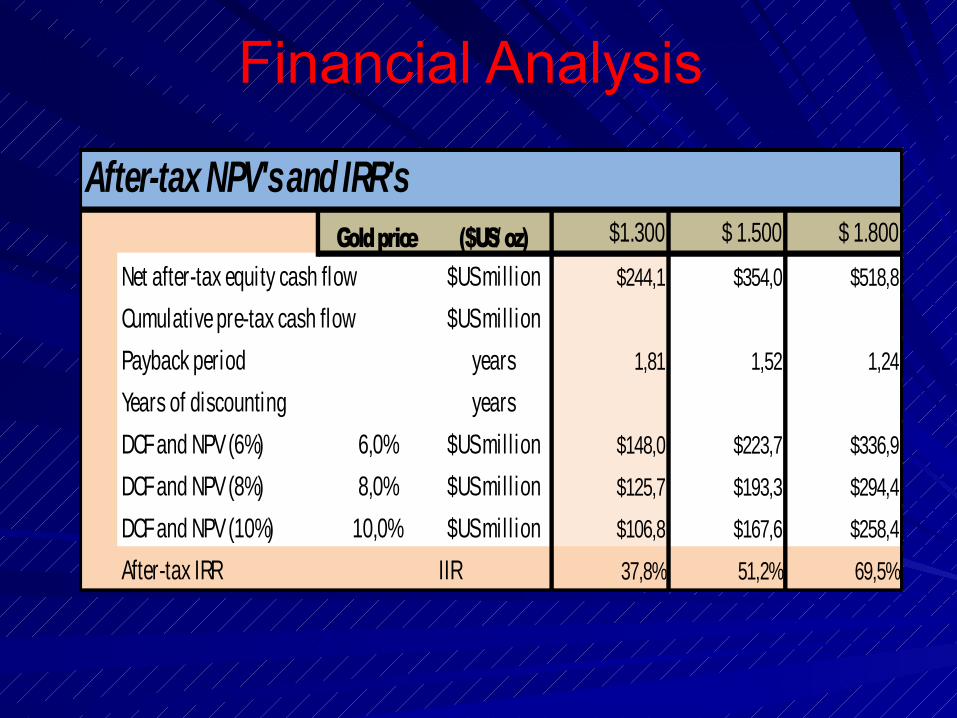
Financial Analysis
After-tax NPV's and IRR'sGold price ($US/ oz) $1.300 $ 1.500 $ 1.800
Net after-tax equity cash flow $US mil l ion $244,1 $354,0 $518,8
Cumulative pre-tax cash flow $US mil l ion
Payback period years 1,81 1,52 1,24
Years of discounting years
DCF and NPV (6%) 6,0% $US mil l ion $148,0 $223,7 $336,9
DCF and NPV (8%) 8,0% $US mil l ion $125,7 $193,3 $294,4
DCF and NPV (10%) 10,0% $US mil l ion $106,8 $167,6 $258,4
After-tax IRR IIR 37,8% 51,2% 69,5%

PROJECT PERMITTING PROCESS
The project approval process consists in two phases
Environment Impact Assestment Study
(Approved in Nov. 2011)
Sector Permits.
The permitting process as well as regulatory activities
during development and operations is managed by the
province.

Let´s Start Mining Lindero

Mansfield Minerals Inc.
LINDERO GOLD DEPOSITTO PRODUCTION
Muchas Gracias


