Linkage disequilibrium levels and allele frequency distribution in BlancoOrejinegro and Romosinuano Creole cattle using medium density SNP chipdata
Diego Bejarano1, Rodrigo Martínez1, Carlos Manrique2, Luis Miguel Parra1, Juan Felipe Rocha3 , Yolanda
Gómez1, Yesid Abuabara4 and Jaime Gallego5
1Corporación Colombiana de Investigación Agropecuaria - Corpoica. Centro de Investigación Tibaitatá,
Cundinamarca, Colombia.2Universidad Nacional de Colombia. Bogotá, Colombia.3Corporación Colombiana de Investigación Agropecuaria - Corpoica. Centro de Investigación Obonuco,
Nariño, Colombia.4Corporación Colombiana de Investigación Agropecuaria - Corpoica. Centro de Investigación Turipaná,
Córdoba, Colombia.5Corporación Colombiana de Investigación Agropecuaria - Corpoica. Centro de Investigación El Nus,
Antioquia, Colombia.
Abstract
The linkage disequilibrium (LD) between molecular markers affects the accuracy of genome-wide association stud-ies and genomic selection application. High-density genotyping platforms allow identifying the genotype of thou-sands of single nucleotide polymorphisms (SNPs) distributed throughout the animal genomes, which increases theresolution of LD evaluations. This study evaluated the distribution of minor allele frequencies (MAF) and the level ofLD in the Colombian Creole cattle breeds Blanco Orejinegro (BON) and Romosinuano (ROMO) using a mediumdensity SNP panel (BovineSNP50K_v2). The LD decay in these breeds was lower than those reported for othertaurine breeds, achieving optimal LD values (r2
� 0.3) up to a distance of 70 kb in BON and 100 kb in ROMO, which ispossibly associated with the conservation status of these cattle populations and their effective population size. Theaverage MAF for both breeds was 0.27 � 0.14 with a higher SNP proportion having high MAF values (� 0.3). The LDlevels and distribution of allele frequencies found in this study suggest that it is possible to have adequate coveragethroughout the genome of these breeds using the BovineSNP50K_v2, capturing the effect of most QTL related withproductive traits, and ensuring an adequate prediction capacity in genomic analysis.
Keywords: Creole breeds, BovineSNP50, linkage disequilibrium, minor allele frequency.
Received: December 20, 2016; Accepted: September 20, 2017.
Introduction
Gene alleles which are physically close in a chromo-
some are inherited in an interconnected manner by inheri-
tance properties, and these are not passed to the offspring
independently but as blocks of alleles or haplotypes pro-
vided by each parent (Ardlie et al., 2002; Pérez O’Brien et
al., 2014a). This condition creates a level of correlation
among the alleles that is known as linkage disequilibrium
(LD), and this concept can be extended to any nucleotide in
the genome, as well as to any type of genetic molecular
marker, such as single nucleotide polymorphisms (SNP)
(Pérez O’Brien et al., 2014a). Therefore, the concept of LD
between molecular markers reflects the correlation that ex-
ists between the genotypes of two markers or the degree of
nonrandom association between their alleles (Porto-Neto et
al., 2014). This correlation is mainly derived from the phys-
ical proximity, although it may also be influenced by sev-
eral evolutionary processes and historical events that have
occurred in the population (Reich et al., 2001; Ardlie et al.,
2002; Khatkar et al., 2008).
Knowledge of the LD decay magnitude and pattern
along the bovine genome has important implications on a
large number of methodologies based on genomic data that
are currently used in genetics and animal breeding, as the
genome-wide association studies (GWAS) (Ardlie et al.,
2002), prediction and genomic selection (Meuwissen et al.,
Genetics and Molecular Biology, 41, 2, 426-433 (2018)
Copyright © 2018, Sociedade Brasileira de Genética. Printed in Brazil
DOI: http://dx.doi.org/10.1590/1678-4685-GMB-2016-0310
Send correspondence to Juan Felipe Martínez Rocha. ColombianCorporation for Agricultural Research, Tibaitatá Research Center,km 14 via Bogota, 250047 Mosquera, Colombia. E-mail:[email protected].
Research Article
2001; The Bovine Genome Sequencing and Analysis Con-
sortium et al., 2009), genomic markers imputation (Piccoli
et al., 2014), marker-assisted selection (MAS), quantitative
trait loci (QTL) mapping, parentage testing, genomic mark-
ers-based disease testing, among others. Most of these tools
are routinely applied in animal breeding programs, and
their implementation success is inherently dependent on
the LD levels present between markers, and between mark-
ers and their surrounding genomic regions (Pérez O’Brien
et al., 2014a).
The LD is the foundation that supports gene mapping
and genome-wide association studies (GWAS), which are
important tools for the exploration of the genetic basis that
regulates the expression of economically important traits in
cattle (McKay et al., 2007; Espigolan et al., 2013). More-
over, the LD is also a useful tool for exploring the degree of
diversity among races, inferring the crossing-over distribu-
tion, and identifying genome regions that have been subject
to different selection pressures (McKay et al., 2007; Boh-
manova et al., 2010; Porto-Neto et al., 2014). Likewise,
high resolution LD maps have also provided useful infor-
mation for high density SNP design panels that are used in
genomic selection (GS) (Matukumalli et al., 2009; Wig-
gans et al., 2009; Bohmanova et al., 2010).
The level of LD present in different populations and
cattle breeds directly affects the results found in GWAS as
well as the accuracy of genomic breeding value estimates,
since this analysis explores the existing LD among the
markers, under the assumption that the effects of chromo-
somal segments will be the same throughout the popula-
tion. This assumes that the markers are in LD with the
genes that are responsible for the expression of the trait of
interest (QTL) (Meuwissen et al., 2001). Therefore, the
markers density to be used must be high enough to ensure
that all QTLs of interest are in LD with at least one or more
markers (Meuwissen et al., 2001; Meuwissen, 2009; Espi-
golan et al., 2013). Previous studies that used SNP markers
to describe the LD decay patterns in cattle at the whole ge-
nome level (McKay et al., 2007; Khatkar et al., 2008;
Gibbs et al., 2009; Bohmanova et al., 2010; Beghain et al.,
2013; Hozé et al., 2013), have suggested that between
30,000 and 300,000 SNPs are required to carry out a
GWAS, and this depends on the trait evaluated and the sta-
tistical power desired (McKay et al., 2007; Khatkar et al.,
2008).
Quantification of the LD extent in the genomes of cat-
tle breeds is a necessary first step to establish if the number
of markers included in the genotyping panel is sufficient to
obtain good results in QTL mapping by GWAS (Goldstein,
2001; Carlson et al., 2004; McKay et al., 2007), and to im-
plement genomic selection strategies (Meuwissen et al.,
2001; Khatkar et al., 2008; Sargolzaei et al., 2008; Qanbari
et al., 2010). However, its importance is often neglected,
creating biases in any analysis performed. For this reason,
the aim of this study was to evaluate the distribution of mi-
nor allele frequencies (MAF) and the LD level across the
genome in two Colombian Creole cattle breeds, using a me-
dium density SNP panel (50K).
Materials and Methods
Animals and genotypes
A total of 866 individuals of the Creole cattle breeds
Blanco Orejinegro (BON) (n=500) and Romosinuano
(ROMO) (n=366) were used in this study. These were
genotyped for 54,609 SNPs using the BeadChip Bovi-
neSNP50K_v2 (Illumina Inc., 2016), and DNA samples
were extracted from blood or semen and genotyped at the
Molecular Genetics Laboratory of Corpoica, Tibaitatá Re-
search Center, following the Infinium HD Assay Protocol
(Illumina Inc., San Diego, CA, USA). To obtain the geno-
types each chip was scanned using HiScan®, and then the
data base was analyzed using the Illumina GenomeStudio
software (Illumina Inc.).
Genotype quality control
Quality control (QC) procedures were applied to SNP
genotype data independently for each racial group accord-
ing to the rules described by Wiggans et al. (2010), using
the PLINK v1.9 software (http://pngu.mgh.har-
vard.edu/purcell/plink/) (Purcell et al., 2007). The SNP
data was removed either when their call rate was less than
90%, when these had pedigree errors, or when they showed
an extreme departure from the Hardy-Weinberg equilib-
rium (e.g., SNPs on autosomal chromosomes with both ho-
mozygous genotypes and no observation of heterozygotes).
Additionally, the SNPs were also removed when these had
unknown genomic positions, if they were located on sex
chromosomes, and if the MAF was lower than or equal to
0.03.
Minor allele frequency estimation
After performing QC, PLINK was used to estimate
the minor allele frequency (MAF) for all autosomal mark-
ers included in the two data sets. According to the distribu-
tion of allele frequencies, five categories were established
representing the proportion of SNPs with MAF values that
fall within the following ranges: � 0.03 to < 0.1, � 0.1 to <
0.2, � 0.2 to < 0.3, � 0.3 to < 0.4 and � 0.4 to � 0.5. Note that
values that fell less than 0.03 were eliminated. The results
of the comparison between the two breeds were plotted us-
ing R.
Linkage disequilibrium (LD) analysis
The square of the correlation coefficient between two
loci (r2) was used as the LD measure, indicating the ability
of the alleles present in a marker to predict the presence of
alleles on a second marker located on a certain genetic dis-
tance measured in base pairs (Ke et al., 2004). The r2 value
based on the genotype frequencies of each SNP was coded
Bejarano et al. 427
as 0, 1, or 2 copies of allele B, and was calculated using
PLINK (Purcell et al., 2007). This was carried out for all
possible combinations of SNP pairs separated by a maxi-
mum distance of up to 1 mega base (Mb) within each chro-
mosome. Using the values of r2� 0.1, the LD decay was
analyzed for two different maximum distances between
SNP pairs, defined as �200 kb and �1 Mb. To show the av-
erage trend in the LD decay, r2 was calculated for all the
possible SNP comparisons included within the different
size windows, i.e. 1 kb, 10 kb and 100 kb, depending on the
distance between markers. The trend in the LD decay for
each breed was plotted through the whole genome and by
chromosome (BTA).
Results
A total of 40,555 autosomal SNPs were identified af-
ter carrying out quality control on BON cattle (74.26%),
and 40,421 autosomal SNP on ROMO cattle (74.02%). The
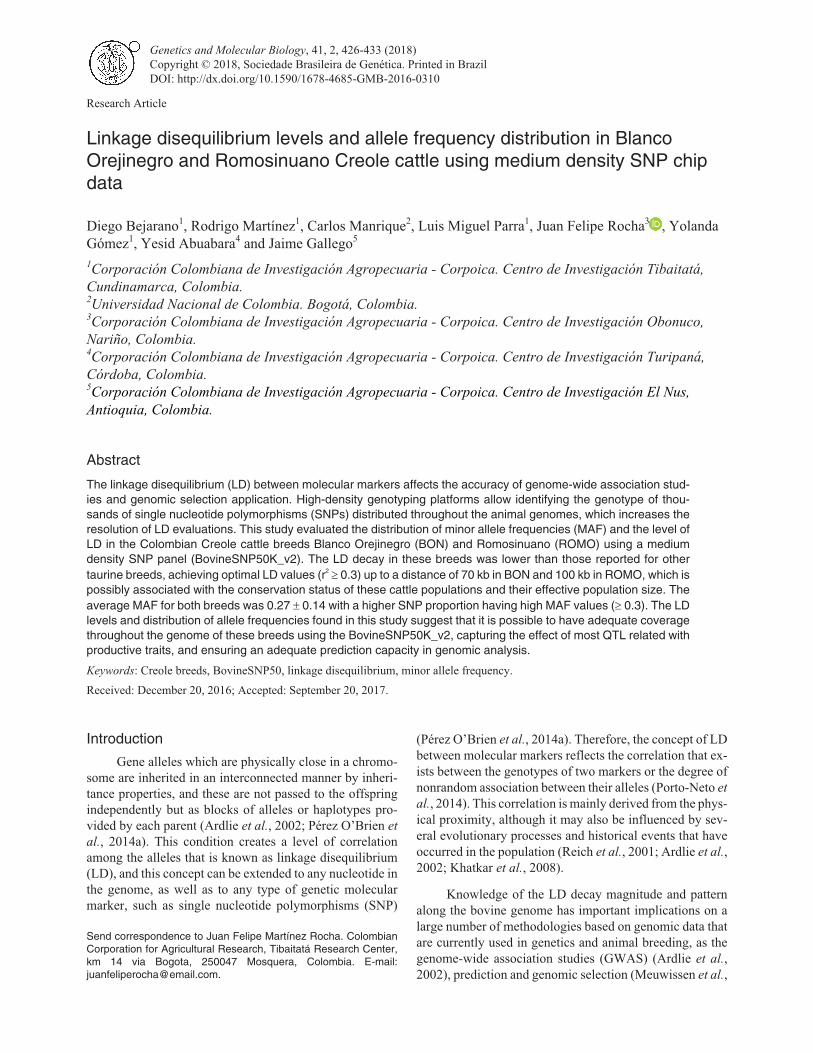
distribution of MAF shows a similar trend in both breeds. A
higher proportion of SNPs had high MAF values with ap-
proximately 45% of the SNPs falling into the last two cate-
gories (MAF � 0.3), and a lower percentage were classified
in the first categories, with 32 to 33% of the SNPs showing
a MAF value lower than 0.2 (Figure 1).
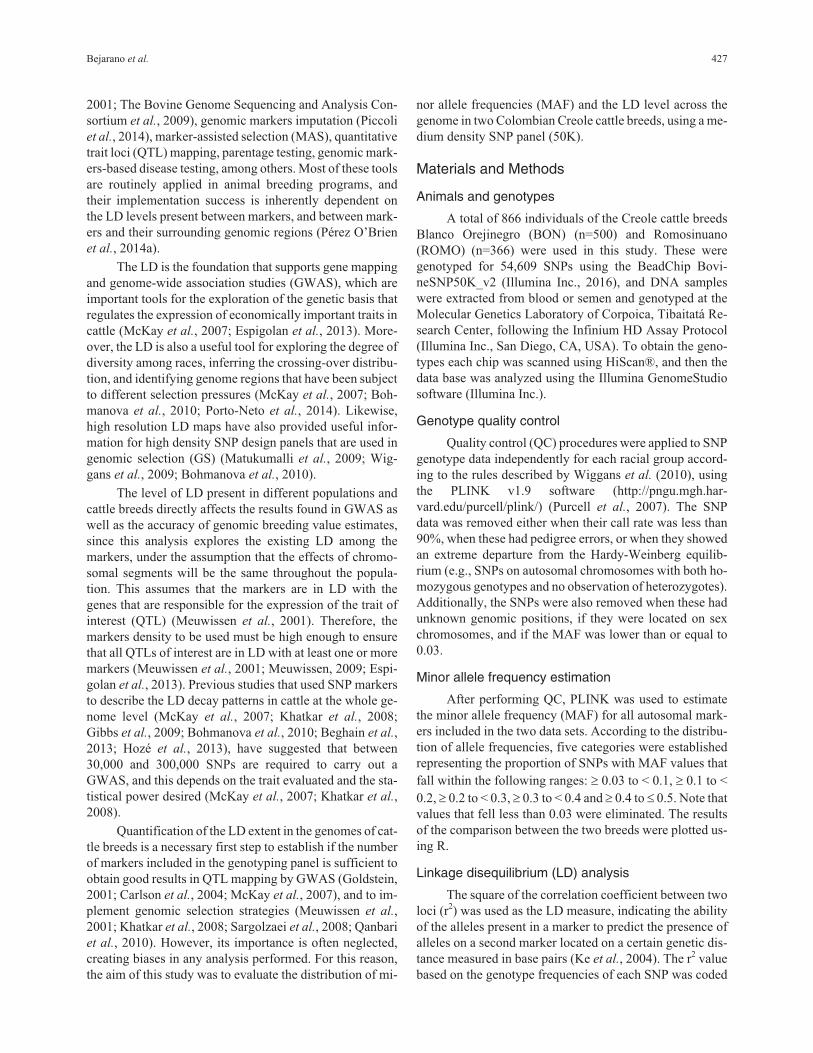
Overall, all chromosomes followed the same trend in
both breeds with a higher proportion of SNPs located in the
last two categories (MAF � 0.3) (Figure 2a,b). In the case of
BON, chromosomes BTA18, BTA19 and BTA23 showed a
higher SNPs proportion in the last category (MAF � 0.4). In
428 Linkage disequilibrium in Colombian Creole cattle breeds
Figure 1 - Minor Allele Frequencies (MAF) distribution for each breed.
Proportion of SNPs (Y axis) included in the Bovine SNP50K v2 (Illumina
Inc. 2016), found within each category of MAF (X axis) for each breed.
Figure 2 - Proportion of SNPs for various categories of minor allele frequencies (MAF) calculated for each autosomal chromosome in ROMO (a) and
BON (b) breeds.
ROMO, chromosomes with a larger number of SNPs with
MAF � 0.4, were BTA14 (27.2%), BTA21 (26.5%) and
BTA10 (25.6%). With regards to the category that includes
SNPs with � 0.03 and < 0.1 values, chromosomes with a
higher SNPs proportion in BON were BTA20 (15.4%),
BTA16 (14.2%) and BTA17 (13.7%). In ROMO, chromo-
somes with the largest number of SNPs with MAF values of
less than 0.1 were BTA22 (14.4%) and BTA20 (14.2%).
After attaining autosomal SNPs through a QC pro-
cess, the level of LD between autosomal markers was as-
sessed using a correlation coefficient between two loci (r2).
In order to consider all possible SNP pairs with a distance
of less than or equal to 100 kb between markers, 28,830
SNP combinations pairs were obtained to estimate LD
across the 29 autosomes in the BON breed, and 28,924 SNP
combinations pairs in the ROMO breed. Up to a distance of
�1 Mb, the number of combinations of SNP pairs (r2� 0.1)
increased to 177,395 in the BON breed and to 222,480 in
the ROMO breed.
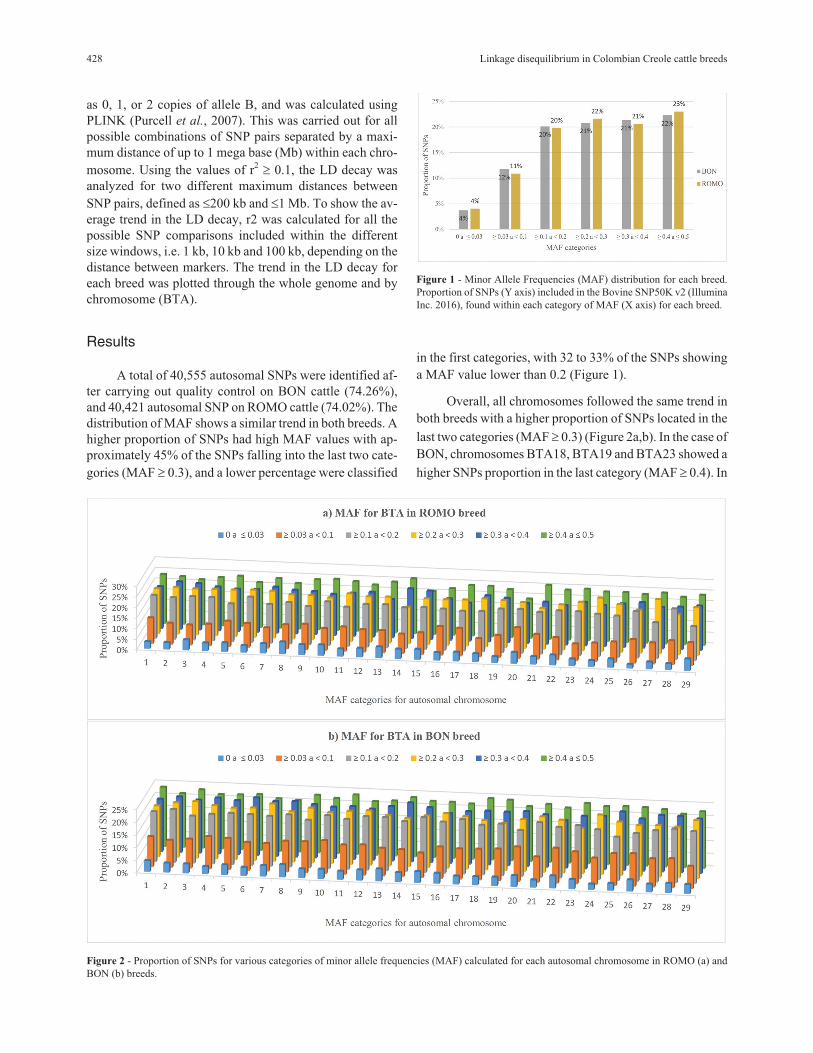
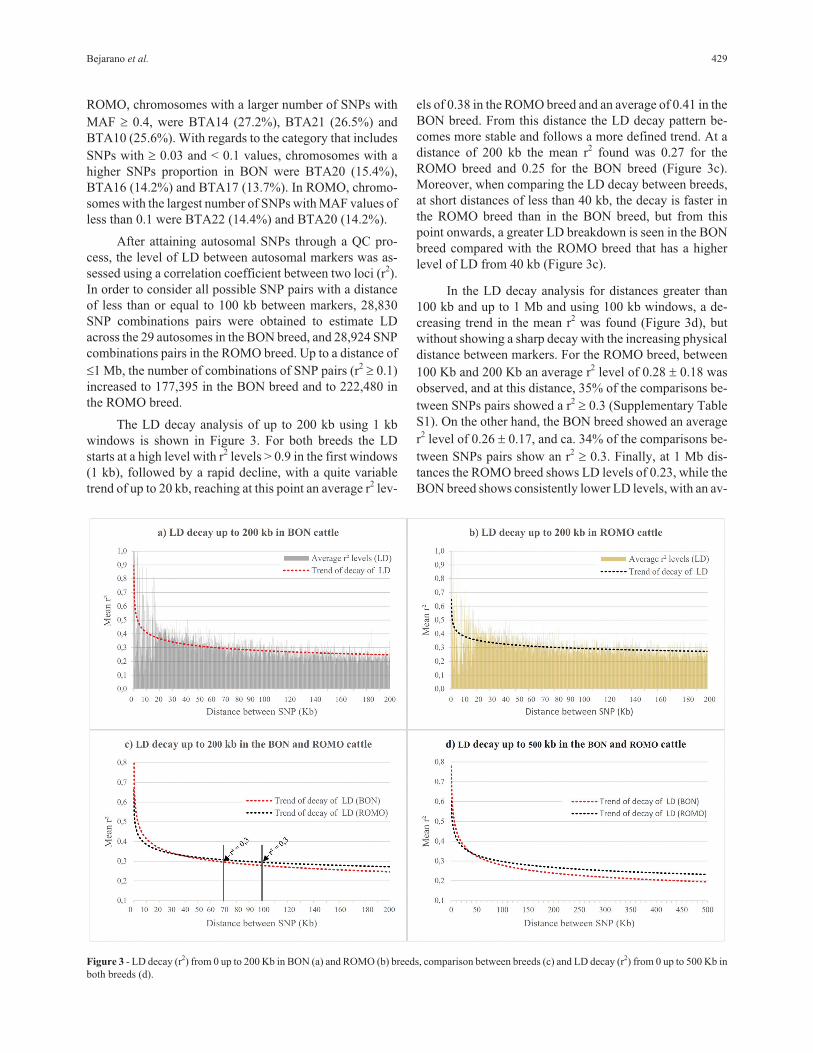
The LD decay analysis of up to 200 kb using 1 kb
windows is shown in Figure 3. For both breeds the LD
starts at a high level with r2 levels > 0.9 in the first windows
(1 kb), followed by a rapid decline, with a quite variable
trend of up to 20 kb, reaching at this point an average r2 lev-
els of 0.38 in the ROMO breed and an average of 0.41 in the
BON breed. From this distance the LD decay pattern be-
comes more stable and follows a more defined trend. At a
distance of 200 kb the mean r2 found was 0.27 for the
ROMO breed and 0.25 for the BON breed (Figure 3c).
Moreover, when comparing the LD decay between breeds,
at short distances of less than 40 kb, the decay is faster in
the ROMO breed than in the BON breed, but from this
point onwards, a greater LD breakdown is seen in the BON
breed compared with the ROMO breed that has a higher
level of LD from 40 kb (Figure 3c).
In the LD decay analysis for distances greater than
100 kb and up to 1 Mb and using 100 kb windows, a de-
creasing trend in the mean r2 was found (Figure 3d), but
without showing a sharp decay with the increasing physical
distance between markers. For the ROMO breed, between
100 Kb and 200 Kb an average r2 level of 0.28 � 0.18 was
observed, and at this distance, 35% of the comparisons be-
tween SNPs pairs showed a r2� 0.3 (Supplementary Table
S1). On the other hand, the BON breed showed an average
r2 level of 0.26 � 0.17, and ca. 34% of the comparisons be-
tween SNPs pairs show an r2� 0.3. Finally, at 1 Mb dis-
tances the ROMO breed shows LD levels of 0.23, while the
BON breed shows consistently lower LD levels, with an av-
Bejarano et al. 429
Figure 3 - LD decay (r2) from 0 up to 200 Kb in BON (a) and ROMO (b) breeds, comparison between breeds (c) and LD decay (r2) from 0 up to 500 Kb in
both breeds (d).
erage r2 level of 0.19 at a distance of 1 Mb between pairs of
SNPs (Table S1).
Discussion
On average the MAF for both breeds was 0.27 � 0.14,
with the highest SNPs proportion (23% for BON and 24%
for ROMO) showing high MAF values (> 0.4) (Figure 1).
These results are consistent with the values reported for
other taurine breeds (McKay et al., 2007; Matukumalli et
al., 2009; Pérez O’Brien et al., 2014a). However, these
were higher compared to average MAF values found in
indicine breeds (Bos indicus), i.e. between 0.19 and 0.20
(Silva et al., 2010; Espigolan et al., 2013; Pérez O’Brien et
al., 2014a). Usually indicine breeds have an opposite trend
in MAF levels compared to taurine cattle (Bos taurus), with
a higher proportion of low allele frequencies (< 0.2) (Gibbs
et al., 2009; Matukumalli et al., 2009; Villa-Angulo et al.,
2009; Pérez O’Brien et al., 2014b). This has been associ-
ated with a greater genetic diversity in indicine populations
obtained from sequencing data (Gibbs et al., 2009; Murray
et al., 2010). Likewise, this could also be attributed to the
fact that the results obtained with the BeadChip
BovineSNP50K_v2 used Bos taurus breed sequence data,
which is genetically distinct from the Bos indicus breeds.
Hence, the ascertainment bias leads to a higher proportion
of low-MAF SNPs in Bos indicus breeds. According to
Khatkar et al. (2008), the MAF threshold directly affects
the LD distribution and extent within the population, since
there is a significant association between high levels of LD
and a higher proportion of SNPs with high MAF values, es-
pecially at short distances (Uimari et al., 2005; Sargolzaei
et al., 2008; Pérez O’Brien et al., 2014a).
The LD decay analysis of up to 200 kb using 1 kb
windows is shown in Figure 3a,b for both breeds evaluated.
A rather erratic behavior in the LD decay was observed in
the first 20 kb, probably due to a low number of compari-
sons established between SNPs pairs with distances less
than or equal to 20 kb (Table S1). These results suggest that
using the set of SNPs contained in the BovineSNP50K_v2
chip, there is no consistency in the LD levels that can be ex-
pected for genomic distances of less than 20 kb. These re-
sults are however, consistent with those reported by Pérez
O’Brien et al. (2014a), on a LD analysis conducted in dif-
ferent taurine and indicine breeds. Moreover, in that same
study they found that in order to evaluate the LD on a short
distance, it is more efficient to use the high-density
BovineHD BeadChip® (Illumina Inc., 2010) that reaches
an average distance between SNPs of ~ 5 kb compared to
the BovineSNP50K_v2 that reaches an average distance
between SNPs of ~ 49 kb (Matukumalli et al., 2009).
Authors such as Kruglyak (1999), Meuwissen et al.
(2001) and Ardlie et al. (2002) reported as useful levels of
LD r2 values larger than 0.3, and this was considered as the
minimum required level to develop reliable association
studies and to obtain accurate genomic predictions. In this
study the ROMO breed presented an average value of r2 =
0.3 up to a distance of 100 kb, while the BON breed showed
a faster decay, reaching the same value up to a distance of
70 kb. These results differ from the average LD levels re-
ported in other taurine breeds by Pérez O’Brien et al.
(2014a), which showed that taurine breeds such as Angus,
Holstein, Brown Swiss and Fleckvieh reach an average of
r2=0.3 up to a distance of 40 to 50 kb, while indicine breeds
as Gyr and Nelore show a faster LD breakdown, reaching
the same r2 value up to a distance of about 20 kb. Similar re-
sults were found in other taurine dairy and beef breeds that
reached similar r2 values for distances less than or equal to
30 kb (Bolormaa et al., 2011; Larmer et al., 2014). How-
ever, in Holstein cattle in North America (Canada and the
United States) Sargolzaei et al. (2008) found optimal LD
values (r2� 0.3) at distances close to 100 kb, which is simi-
lar to our results. On the other hand, at distances of 1 Mb the
ROMO breed showed LD levels of 0.23, while the BON
breed showed an average r2 levels of 0.19 (Table S1), and
these values differ from those reported for other cattle
breeds that generally show r2 levels below 0.1 at distances
of 1 Mb (Gautier et al., 2007; McKay et al., 2007; de Roos
et al., 2008; Villa-Angulo et al., 2009; Qanbari et al., 2010;
Lu et al., 2012; Pérez O’Brien et al., 2014a).
The highest LD level found in the Creole breeds as-
sessed was due to the fact that the individuals evaluated in
this study belong to a conservation core population of
Creole cattle breeds in Colombia (Vásquez et al., 2007),
which are related to a small effective population size. How-
ever, LD studies in livestock populations have shown that
the LD is much more extensive in these populations than in
other species (e.g. humans), and this is mainly due to a
smaller effective population size, and in some circum-
stances, due to stronger selection pressure that has recently
been carried out in livestock populations (McRae et al.,
2002; McKay et al., 2007; Khatkar et al., 2008). Yet, an ex-
ception to this effect/condition in livestock animals is
found in rabbits, where the LD declines sharply at short dis-
tances due to their rich genetic variability and large effec-
tive population size (Carneiro et al., 2014).
Since the average distance between markers that has
been reported for the 50 K chip is 49.4 kb (Illumina Inc.
2016), the LD levels found in this study suggest that using
the BovineSNP50K_v2 chip as genotyping platform, it is
possible to have an adequate coverage throughout the
breeds’ genome. In this way, the effect of most QTL related
with productive traits would be captured, and an adequate
accurate in genomic analysis (GWAS, GS) would be en-
sured (Kizilkaya et al., 2010). This premise has also been
supported in other studies developed in dairy taurine popu-
lations, which have shown that the density increase using
the 50 K chip compared to using the HD chip has resulted in
only increasing slightly the accuracy of genomic predic-
tions (Erbe et al., 2012; Su et al., 2012; VanRaden et al.,
430 Linkage disequilibrium in Colombian Creole cattle breeds
2013). Thus, according to Pérez O’Brien et al. (2014a) this
impact ought to be higher for indicine populations with
lower LD levels in shorter distances.
The highest LD levels observed in BON and ROMO
breeds compared to reports for similar LD distances (kb) in
other cattle breeds, can be related to one or more of the fol-
lowing factors: a higher ancestral relatedness (Purfield et
al., 2012), a historically smaller effective population size
(founder effect) (Villa-Angulo et al., 2009), or a recent
population reduction due to a bottleneck event and genetic
drift (Reich et al., 2001; Purfield et al., 2012), which proba-
bly occurred in these Creole breeds. In fact, during the last
decades these have registered a strong population reduction
due to the import of selected and other exotic breeds
adapted to tropical conditions (indicine breeds), which has
resulted in the widespread displacement of the local Creole
cattle. The increase of LD levels can also be a result of the
selection pressure in search of productive traits (Thévenon
et al., 2007). However, the selection pressure on Creole cat-
tle populations has been minimal (Martínez et al., 2011).
Various authors have proven that effective population
sizes have an inverse relationship with LD levels, so usu-
ally racial groups with large effective population sizes have
lower LD values (Sölkner et al., 1998; Khatkar et al., 2008;
Pausch et al., 2013). This condition has been evidenced in
indicine breeds which are characterized by having a large
effective population size, with a faster LD decay, reaching
an average r2 value of � 0.3 for a distance of up to 20 kb. On
the contrary, taurine breeds have smaller effective popula-
tion sizes with optimal LD values (r2� 0.3) at distances be-
tween 40 to 50 kb (Pérez O’Brien et al., 2014a). Moreover,
Ferencakovic et al. (2013) found that in populations with
higher inbreeding levels as dairy breeds, the LD is stronger.
The results of our study indicate that BON and ROMO
Creole cattle show high LD values due to a lower effective
population size, but also possibly associated with a de-
crease of the genetic variability within these populations.
In GWAS the proximity and the existence of LD
among the markers used will increase the probability of
finding QTLs and chromosomal regions of smaller physi-
cal size that are less affected by crossing over (Pérez
O’Brien et al., 2014a). Many QTLs have segregated exclu-
sively in one population meanwhile others can be shared
across different breeds. However, when considering the va-
lidity of the results among breeds it is important to remem-
ber the differences in LD that exists among different
breeds, even in cases where there are similar levels of LD
with the possibility to find different LD phases in each
breed (Bolormaa et al., 2013). Previous studies have found
that the LD phase to be preserved among cattle breeds at
only small distances (less than 10 kb) (de Roos et al., 2008)
might differ completely between cattle subspecies (Bolor-
maa et al., 2013). This implies that the association of QTLs
and genetic markers through different breeds is only likely
to remain when the marker is very close to the QTL, and
only for races of the same subspecies (Pérez O’Brien et al.,
2014a). The Colombian cattle breeds share a similar origin
and have close genetic distances among them (Martínez et
al., 2011). Moreover, according with the results from the
present study, these breeds have similar LD levels, and
therefore, it could be expected that these breeds also share
common SNP’s and QTLs of economic importance.
Conclusion
In BON and ROMO Creole breeds a high proportion
of SNPs (45%) with high values of MAF (� 0.3) were
found, and this may be related with high LD levels found in
these populations. These values were superior to those re-
ported in other taurine breeds and reached optimal LD lev-
els (r2� 0.3) in a distance of up to 70 kb for the BON breed,
and 100 kb for the ROMO breed, which is possibly associ-
ated with several issues: their status as a closed population,
having a reduced effective population size, and being sub-
ject to a limited occurrence of recent genetic introgression
events. The LD levels and allele frequencies distribution
found in this study suggests that using the Bovi-
neSNP50K_v2 chip as a genotyping platform can result in
an adequate coverage throughout the genome for this type
of Creole cattle. This in turn may allow capturing the effect
of most of the QTLs associated with productive traits and in
this way an adequate prediction capacity in the genomic
analysis (GWAS, GS) can be ensured.
Acknowledgement
This project was supported by the Ministry of Agri-
culture and Rural Development of Colombia (MADR).
References
Ardlie KG, Kruglyak L and Seielstad M (2002) Patterns of link-
age disequilibrium in the human genome. Nat Rev Genet
3:299–309.
Beghain J, Boitard S, Weiss B, Boussaha M, Gut I and Rocha D
(2013) Genome-wide linkage disequilibrium in the Blonde
d’Aquitaine cattle breed. J Anim Breed Genet 130:294–302.
Bohmanova J, Sargolzaei M and Schenkel FS (2010) Characteris-
tics of linkage disequilibrium in North American Holsteins.
BMC Genomics 11:421.
Bolormaa S, Hayes BJ, Savin K, Hawken R, Barendse W, Arthur
PF, Herd RM and Goddard ME (2011) Genome-wide asso-
ciation studies for feedlot and growth traits in cattle. J Anim
Sci 89:1684–1697.
Bolormaa S, Pryce JE, Kemper KE, Hayes BJ, Zhang Y, Tier B,
Barendse W, Reverter A and Goddard ME (2013) Detection
of quantitative trait loci in Bos indicus and Bos taurus cattle
using genome-wide association studies. Genet Sel Evol
45:43.
Carlson CS, Eberle MA, Kruglyak L and Nickerson DA (2004)
Mapping complex disease loci in whole-genome association
studies. Nature 429:446–452.
Carneiro M, Rubin C-J, Di Palma F, Albert FW, Alföldi J, Barrio
AM, Pielberg G, Rafati N, Sayyab S, Turner-Maier J et al.
Bejarano et al. 431
(2014) Rabbit genome analysis reveals a polygenic basis for
phenotypic change during domestication. Science
345:1074–1079.
de Roos APW, Hayes BJ, Spelman RJ and Goddard ME (2008)
Linkage disequilibrium and persistence of phase in Hol-
stein-Friesian, Jersey and Angus cattle. Genetics
179:1503–1512.
Erbe M, Hayes BJ, Matukumalli LK, Goswami S, Bowman PJ,
Reich CM, Mason BA and Goddard ME (2012) Improving
accuracy of genomic predictions within and between dairy
cattle breeds with imputed high-density single nucleotide
polymorphism panels. J Dairy Sci 95:4114–4129.
Espigolan R, Baldi F, Boligon AA, Souza FR, Gordo DG, Tonussi
RL, Cardoso DF, Oliveira HN, Tonhati H, Sargolzaei M et
al. (2013) Study of whole genome linkage disequilibrium in
Nellore cattle. BMC Genomics 14:305.
Feren�akovi� M, Hamzi� E, Gredler B, Solberg TR, Klemetsdal
G, Curik I and Sölkner J (2013) Estimates of autozygosity
derived from runs of homozygosity: empirical evidence
from selected cattle populations. J Anim Breed Genet
130:286–293.
Gautier M, Faraut T, Moazami-Goudarzi K, Navratil V, Foglio M,
Grohs C, Boland A, Garnier J-G, Boichard D, Lathrop GM
et al. (2007) Genetic and haplotypic structure in 14 Euro-
pean and African cattle breeds. Genetics 177:1059–1070.
Gibbs RA, Taylor JF, Van Tassell CP, Barendse W, Eversole KA,
Gill CA, Green RD, Hamernik DL, Kappes SM, Lien S et al.
(2009) Genome-wide survey of SNP variation uncovers the
genetic structure of cattle breeds. Science 324:528–532.
Goldstein DB (2001) Islands of linkage disequilibrium. Nat Genet
29:109–11.
Hozé C, Fouilloux M-N, Venot E, Guillaume F, Dassonneville R,
Fritz S, Ducrocq V, Phocas F, Boichard D and Croiseau P
(2013) High-density marker imputation accuracy in sixteen
French cattle breeds. Genet Sel Evol 45:33.
Ke X, Hunt S, Tapper W, Lawrence R, Stavrides G, Ghori J,
Whittaker P, Collins A, Morris AP, Bentley D et al. (2004)
The impact of SNP density on fine-scale patterns of linkage
disequilibrium. Hum Mol Genet 13:577–588.
Khatkar MS, Nicholas FW, Collins AR, Zenger KR, Cavanagh
JAL, Barris W, Schnabel RD, Taylor JF and Raadsma HW
(2008) Extent of genome-wide linkage disequilibrium in
Australian Holstein-Friesian cattle based on a high-density
SNP panel. BMC Genomics 9:187.
Kizilkaya K, Fernando RL and Garrick DJ (2010) Genomic pre-
diction of simulated multibreed and purebred performance
using observed fifty thousand single nucleotide polymor-
phism genotypes. J Anim Sci 88:544–551.
Kruglyak L (1999) Prospects for whole-genome linkage disequi-
librium mapping of common disease genes. Nat Genet
22:139–44.
Larmer SG, Sargolzaei M and Schenkel FS (2014) Extent of link-
age disequilibrium, consistency of gametic phase, and impu-
tation accuracy within and across Canadian dairy breeds. J
Dairy Sci 97:3128–41.
Lu D, Sargolzaei M, Kelly M, Li C, Vander Voort G, Wang Z,
Plastow G, Moore S and Miller SP (2012) Linkage disequi-
librium in Angus, Charolais, and Crossbred beef cattle.
Front Genet 3:152.
Martínez R, Gallego J, Onofre G, Pérez J and Vasquez R (2011)
Evaluación de la variabilidad y potencial genético de pobla-
ciones de bovinos criollos colombianos. Anim Genet Resour
Inf 44:57–66.
Matukumalli LK, Lawley CT, Schnabel RD, Taylor JF, Allan MF,
Heaton MP, O’Connell J, Moore SS, Smith TPL, Sonstegard
TS et al. (2009) Development and characterization of a high
density SNP genotyping assay for cattle. PLoS One 4:e5350.
McKay SD, Schnabel RD, Murdoch BM, Matukumalli LK, Aerts
J, Coppieters W, Crews D, Dias Neto E, Gill CA, Gao C et
al. (2007) Whole genome linkage disequilibrium maps in
cattle. BMC Genet 8:74.
McRae AF, McEwan JC, Dodds KG, Wilson T, Crawford AM
and Slate J (2002) Linkage disequilibrium in domestic
sheep. Genetics 160:1113–22.
Meuwissen THE (2009) Accuracy of breeding values of “unre-
lated” individuals predicted by dense SNP genotyping.
Genet Sel Evol 41:35.
Meuwissen THE, Hayes BJ and Goddard ME (2001) Prediction of
total genetic value using genome-wide dense marker maps.
Genetics 157:1819–1829.
Murray C, Huerta-Sanchez E, Casey F and Bradley DG (2010)
Cattle demographic history modelled from autosomal se-
quence variation. Philos Trans R Soc Lond B Biol Sci
365:2531–9.
Pausch H, Aigner B, Emmerling R, Edel C, Götz K-U and Fries R
(2013) Imputation of high-density genotypes in the
Fleckvieh cattle population. Genet Sel Evol 45:3.
Pérez O’Brien AM, Mészáros G, Utsunomiya YT, Sonstegard TS,
Garcia JF, Van Tassell CP, Carvalheiro R, da Silva MVB
and Sölkner J (2014a) Linkage disequilibrium levels in Bos
indicus and Bos taurus cattle using medium and high density
SNP chip data and different minor allele frequency distribu-
tions. Livest Sci 166:121–132.
Pérez O’Brien AM, Utsunomiya YT, Mészáros G, Bickhart DM,
Liu GE, Van Tassell CP, Sonstegard TS, Da Silva MVB,
Garcia JF and Sölkner J (2014b) Assessing signatures of se-
lection through variation in linkage disequilibrium between
taurine and indicine cattle. Genet Sel Evol 46:19.
Piccoli ML, Braccini J, Cardoso FF, Sargolzaei M, Larmer SG
and Schenkel FS (2014) Accuracy of genome-wide imputa-
tion in Braford and Hereford beef cattle. BMC Genet
15:1275.
Porto-Neto LR, Kijas JW and Reverter A (2014) The extent of
linkage disequilibrium in beef cattle breeds using high-
density SNP genotypes. Genet Sel Evol 46:22.
Purcell S, Neale B, Todd-Brown K, Thomas L, Ferreira MAR,
Bender D, Maller J, Sklar P, de Bakker PIW, Daly MJ et al.
(2007) PLINK: A tool set for whole-genome association and
population-based linkage analyses. Am J Hum Genet
81:559–75.
Purfield DC, Berry DP, McParland S and Bradley DG (2012)
Runs of homozygosity and population history in cattle.
BMC Genet 13:70.
Qanbari S, Pimentel ECG, Tetens J, Thaller G, Lichtner P, Sharifi
AR and Simianer H (2010) The pattern of linkage disequi-
librium in German Holstein cattle. Anim Genet 41:346–56.
Reich DE, Cargill M, Bolk S, Ireland J, Sabeti PC, Richter DJ,
Lavery T, Kouyoumjian R, Farhadian SF, Ward R et al.
(2001) Linkage disequilibrium in the human genome. Na-
ture 411:199–204.
432 Linkage disequilibrium in Colombian Creole cattle breeds
Sargolzaei M, Schenkel FS, Jansen GB and Schaeffer LR (2008)
Extent of linkage disequilibrium in Holstein cattle in North
America. J Dairy Sci 91:2106–2117.
Silva CR, Neves HHR, Queiroz SA, Sena JAD and Pimentel ECG
(2010) Extent of linkage disequilibrium in Brazilian Gyr
dairy cattle based on genotypes of AI sires for dense SNP
markers. In: Proc 9th World Congr Genet Appl to Livest
Prod 1-6 August 2010; Leipzig 1–29.
Sölkner J, Filipcic L and Hampshire N (1998) Genetic variability
of populations and similarity of subpopulations in Austrian
cattle breeds determined by analysis of pedigrees. Anim Sci
67:249–256.
Su G, Brøndum RF, Ma P, Guldbrandtsen B, Aamand GP and
Lund MS (2012) Comparison of genomic predictions using
medium-density (~54,000) and high-density (~777,000) sin-
gle nucleotide polymorphism marker panels in Nordic Hol-
stein and Red Dairy Cattle populations. J Dairy Sci
95:4657–65.
The Bovine Genome Sequencing and Analysis Consortium, Elsik
CG, Tellam RL, Worley KC, Gibbs RA, Muzny DM,
Weinstock GM, Adelson DL, Eichler EE, Elnitski L et al.
(2009) The genome sequence of taurine cattle: A window to
ruminant biology and evolution. Science 324:522–528. doi:
10.1126/science.1169588.
Thévenon S, Dayo GK, Sylla S, Sidibe I, Berthier D, Legros H,
Boichard D, Eggen A and Gautier M (2007) The extent of
linkage disequilibrium in a large cattle population of west-
ern Africa and its consequences for association studies.
Anim Genet 38:277–86.
Uimari P, Kontkanen O, Visscher PM, Pirskanen M, Fuentes R
and Salonen JT (2005) Genome-wide linkage disequilib-
rium from 100,000 SNPs in the East Finland founder popu-
lation. Twin Res Hum Genet 8:185–97.
VanRaden PM, Null DJ, Sargolzaei M, Wiggans GR, Tooker ME,
Cole JB, Sonstegard TS, Connor EE, Winters M, van Kaam
JBCHM et al. (2013) Genomic imputation and evaluation
using high-density Holstein genotypes. J Dairy Sci
96:668–78.
Vásquez R, Martínez R, Rodríguez O, Ballesteros H, Ossa G,
Abuabara Y, Pérez J, Neira J, Onofre G, Polanco N et al.
(2007) Manual de conservacion, multiplicacion y mejo-
ramiento de las razas bovinas criollas colombianas, 1ra ed.
Produmedios, Mosquera (Cundinamarca).
Villa-Angulo R, Matukumalli LK, Gill CA, Choi J, Van Tassell
CP and Grefenstette JJ (2009) High-resolution haplotype
block structure in the cattle genome. BMC Genet 10:19.
Wiggans GR, Sonstegard TS, VanRaden PM, Matukumalli LK,
Schnabel RD, Taylor JF, Schenkel FS and Van Tassell CP
(2009) Selection of single-nucleotide polymorphisms and
quality of genotypes used in genomic evaluation of dairy
cattle in the United States and Canada. J Dairy Sci
92:3431–6.
Wiggans GR, VanRaden PM, Bacheller LR, Tooker ME,
Hutchison JL, Cooper TAa and Sonstegard TS (2010) Selec-
tion and management of DNA markers for use in genomic
evaluation. J Dairy Sci 93:2287–2292.
Internet ResourcesIllumina Inc. (2016) BovineSNP50 Genotyping BeadChip,
https://www.illumina.com/Documents/prod-
ucts/datasheets/datasheet_bovine_snp5O.pdf (May 24,
2017).
Illumina Inc. (2010) BovineHD Genotyping BeadChip,
https://www.illumina.com/Documents/prod-
ucts/datasheets/datasheet_bovineHD.pdf (May 24, 2017).
Supplementary material
The following online material is available for this article:
Table S1 – Linkage disequilibrium (r2) between pairs (N) of
SNPs across all autosomes.
Associate Editor: Bertram Brenig
License information: This is an open-access article distributed under the terms of theCreative Commons Attribution License (type CC-BY), which permits unrestricted use,distribution and reproduction in any medium, provided the original article is properly cited.
Bejarano et al. 433


