Download - Lmh43 - British Columbia
L A N D M A N A G E M E N T H A N D B O O K
Estimating the Abundance ofArboreal Forage Lichens: User’s Guide
A Guide for Users of Estimating the Abundance of Arboreal ForageLichens, Land Management Handbook Field Guide Insert 7
1 9 9 8
Ministry of ForestsResearch Program
43
Ministry of ForestsResearch Program
Estimating the Abundance ofArboreal Forage Lichens: User’s Guide
A Guide for Users of Estimating the Abundance of Arboreal Forage Lichens,Land Management Handbook Field Guide Insert 7
Susan K. Stevenson, Art N. Lance, and Harold M. Armleder

ii
Canadian Cataloguing in Publication Data
Stevenson, S.K.Estimating the Abundance of Arboreal Forage Lichens: User’s Guide
(Land Management Handbook; 43)
A Guide for Users of Estimating the Abundance of Arboreal Forage Lichens,Land Management Handbook Field Guide Insert 7, B.C. Ministry of Forests.
Includes bibliographical references: p.ISBN 0-7726-3549-8
1. Lichens – British Columbia. 2. Caribou – Feeding and feeds – British Columbia.3. Caribou – Habitat – British Columbia. 4. Forest management – British Columbia.I. Lance, Art N. II. Armleder, H.M. III. British Columbia. Ministry of Forests.Research Branch. IV. Series.QK587.7.B7S73 1998 579.7 C98-960122-6
Prepared by
Susan K. Stevenson R.P.Bio.Silvifauna Research101 Burden St.Prince George, BC v2m 2g8
Art N. Lance R.P.Bio.Industrial Forestry Service Ltd.1595 Fifth Ave.Prince George, BC v2l 3l9
Harold M. Armleder R.P.F. R.P.Bio.Cariboo Forest RegionSuite 200 – 640 Borland St.Williams Lake, BC v2g 4t1
for
B.C. Ministry of ForestsCariboo Forest RegionSuite 200 – 640 Borland St.Williams Lake, BC v2g 4t1
Published by
B.C. Ministry of ForestsForestry Division Services BranchProduction Resources595 Pandora AvenueVictoria, BC v8w 3e7
© 1998 Province of British Columbia
Copies of this and other Ministry of Foreststitles are available from:Crown Publications Inc.521 Fort StreetVictoria, BC v8w 1e7

iii
HOW USERS CAN CONTRIBUTE TO ADAPTIVE MANAGEMENT
The recommendations in this handbook are based on studies ofarboreal lichen datasets collected from various sites in three regions ofeast-central British Columbia. Although these data proved to be fairlydiverse, they represent only a small portion of the variety that occurs inmountain caribou ranges. Data from additional sites would help to fillin the picture of natural variation in arboreal lichen abundance. Thiswould improve future recommendations for sampling and for manage-ment. Users of the lichen Field Guide are encouraged to assist thisprocess by sharing the data they obtain using the methods recom-mended here. A form for submitting this information is found at theback of the handbook.

iv
ACKNOWLEDGEMENTS
Preparation of this handbook was funded by the British ColumbiaMinistry of Forests (Cariboo Forest Region), Forest Renewal Plan ofBritish Columbia, and the Habitat Silviculture Protection Fund adminis-tered by the British Columbia Ministry of Environment, Lands andParks (Omineca-Peace Region). We thank Dave King (Ministry ofEnvironment, Lands and Parks) for his support of the project, RonOsland (Cariboo Forest Region) for his advice on timber cruisingprocedures, and Vera Sit (Ministry of Forests, Victoria) for her com-ments on statistics. Michaela Waterhouse (Cariboo Forest Region), WesBieber (Weyerhaeuser Canada Ltd.), Brian Harding (Northwood Pulpand Timber Ltd.), and Jocelyn Campbell (University of Northern BritishColumbia) allowed us to use their data. Dave King, Mark Phinney, andMichaela Waterhouse reviewed earlier versions of the manuscript, andthe proofs were edited by Fran Aitkens. Graphics and layout wereproduced by The Borealis Communications Group.

v
CONTENTS
How Users can Contribute to Adaptive Management ........................................................................................... iii
Acknowledgements ..................................................................................................................................................................... iv
. Purpose of the Handbook ..............................................................................................................................................
Background ..............................................................................................................................................................................
Who is the handbook for? ................................................................................................................................................
Where can it be used? ..........................................................................................................................................................
. Why Assess Lichen Abundance? ...................................................................................................................................
Caribou depend on lichens for winter forage ........................................................................................................
Information about lichens may be required for approval of plans ...........................................................
. Using the Field Guide to Assess Individual Trees ..............................................................................................
Basic procedures ....................................................................................................................................................................
Questions and answers .......................................................................................................................................................
. Basic Characteristics of Lichen Datasets ...............................................................................................................
. Using the Field Guide for Reconnaissance ...........................................................................................................
Reconnaissance objectives for lichen assessment ...............................................................................................
Sampling methods ...............................................................................................................................................................
Defining the sampling domain ......................................................................................................................................
Determining the sample size ...........................................................................................................................................
Laying out the sample ........................................................................................................................................................
Compiling the data ..............................................................................................................................................................
Analyzing the data .................................................................................................................................................................
Mapping the data ..................................................................................................................................................................
Using the data to manage caribou habitat ..............................................................................................................
. Using the Field Guide for Planning at the Block Level ..................................................................................
Block-level objectives for lichen assessment .........................................................................................................
Sampling methods ...............................................................................................................................................................
Compiling the data ..............................................................................................................................................................
Planning the prescription ................................................................................................................................................
. Using the Field Guide to Improve Adaptive Management ..........................................................................
What is adaptive management? .....................................................................................................................................
Contributing to the knowledge base on lichen abundance ...........................................................................
Monitoring the effects of selection harvesting on lichen abundance ......................................................
. Using the Field Guide for Research and Inventory ..........................................................................................
Research .....................................................................................................................................................................................
Inventory ...................................................................................................................................................................................
. Conclusion ...............................................................................................................................................................................
Data Registration Form ...........................................................................................................................................................

vi
TABLES
. Frequency distribution of Lichen Class scores, with associated information ....................................................
. Stand table for subalpine fir by Lichen Class .......................................................................................................................
. Stand table for spruce by Lichen Class .....................................................................................................................................
. Lichen biomass summary for subalpine fir and spruce based on Tables 2 and 3 ............................................
. Pre-harvest summary by species based on Tables 2, 3, and 4 ......................................................................................
. Lichen biomass summary table for a single-tree selection prescription,for subalpine fir and spruce based on Tables 2 and 3 ......................................................................................................
. Post-harvest summary by species, based on Table 6 .........................................................................................................
FIGURES
. Range of caribou in British Columbia ....................................................................................................................................
. How to use the scale to adjust lichen scores ........................................................................................................................
. Frequency distribution of the difference between Lichen Class basedon measured samples and Lichen Class assessed by an observer .............................................................................
. Frequency distribution of Alectoria and Bryoria biomass in thelower canopy of trees in an ESSF stand ....................................................................................................................................
. Frequency distribution of Lichen Class scores, based on the samedataset as Figure 4 ................................................................................................................................................................................
. Lichen score-frequencies (trees > 7.5 cm dbh) at two sites used asmountain caribou winter range ....................................................................................................................................................
. Lichen score-frequencies (trees > 7.5 cm dbh) at two sites not usedas mountain caribou winter range ..............................................................................................................................................
. Lichen plots at random distances along two transect paths planned to covera mountainside survey area of about 1000 ha ......................................................................................................................
. Lichen abundance zones based on the distribution of lichen plot scores in the surveyarea shown in Figure 8 .......................................................................................................................................................................
.Trees per hectare by Lichen Class based on Tables 2 and 3 ...........................................................................................
. Lichen plot scores in a group selection block, and harvest openings planned tomaximize lichen retention after the first harvest entry ...................................................................................................
. Trees per hectare in Lichen Classes 1–5 before and after a single-tree selection harvest .............................
. Effects of two selection harvesting prescriptions on post-harvest lichen abundance and losses ............

1 PURPOSE OF THE HANDBOOK
Background
Arboreal lichens—lichens that grow on trees—are critically importantwinter forage for caribou in parts of British Columbia. Arboreal lichensgrow abundantly on some old trees, but are generally sparse on youngtrees. Forest managers can make better decisions about whether, where,and how to log in caribou habitat if they have information about theabundance of these lichens.
The Field Guide, Estimating the Abundance of Arboreal Forage Lichens,
describes a method of estimating lichen abundance on individual trees.The Field Guide presents a series of photos of trees with known amountsof lichen below 4.5 m, which is the part of the tree within reach ofcaribou in winter. The user compares the tree being assessed to thephotos, and scores it as belonging in Lichen Class 0–5. The Field Guide isquick and relatively simple to use, can give similar results when used bydifferent people, and produces assessments that are related to actuallichen biomass.
The Field Guide, however, does not offer direction on how lichenassessments fit into planning and data collection processes. It does notdiscuss how to sample or what to do with the data collected. This hand-book is intended to fill those gaps, and help managers use the FieldGuide as a tool for planning in caribou habitat. The Field Guide also hasresearch and inventory applications, and can be used to monitor theeffects of forestry practices on lichen abundance.
This handbook is based on analysis of several datasets collectedduring the first two years after the Field Guide was published. Theseinclude data from one reconnaissance-level project, in which severalsampling methods were compared, and several block-level datasetscollected for research or operational forestry purposes. The data werecollected in the Engelmann Spruce–Subalpine Fir (ESSF) biogeoclimaticzone in three Ministry of Forests Regions. As more data become avail-able from more places, the characteristics of lichen data can be describedmore fully. The recommendations in this handbook may then be ex-tended and refined.
Armleder, H.M., S.K. Stevenson, and S.D. Walker. 1992. Estimating the Abundance ofArboreal Forage Lichens. B.C. Ministry of Forests, Land Management HandbookField Guide Insert 7. Victoria, B.C.
Meidinger, D. and J. Pojar. 1991. Ecosystems of British Columbia. B.C. Ministry ofForests, Special Rep. Ser. No. 6. Victoria, B.C.
Who is the handbook for?
This handbook is intended for people who plan forestry activities incaribou habitat.
At the reconnaissance level, it is intended for people who:• design fieldwork for plans such as Forest Development Plans,
Landscape Unit Plans, Total Resource Use Plans, or LocalResource Use Plans
• compile and interpret data for those plans
At the block level, it is intended for people who:• plan timber cruising or data collection for Silviculture Prescriptions• develop Silviculture Prescriptions for selection harvesting blocks
in caribou habitat
At both levels, it is for people who:• train and supervise crews that collect resource data
It may also be used by researchers studying the distribution and abun-dance of arboreal lichens, or the impacts of management activities on thelichens.
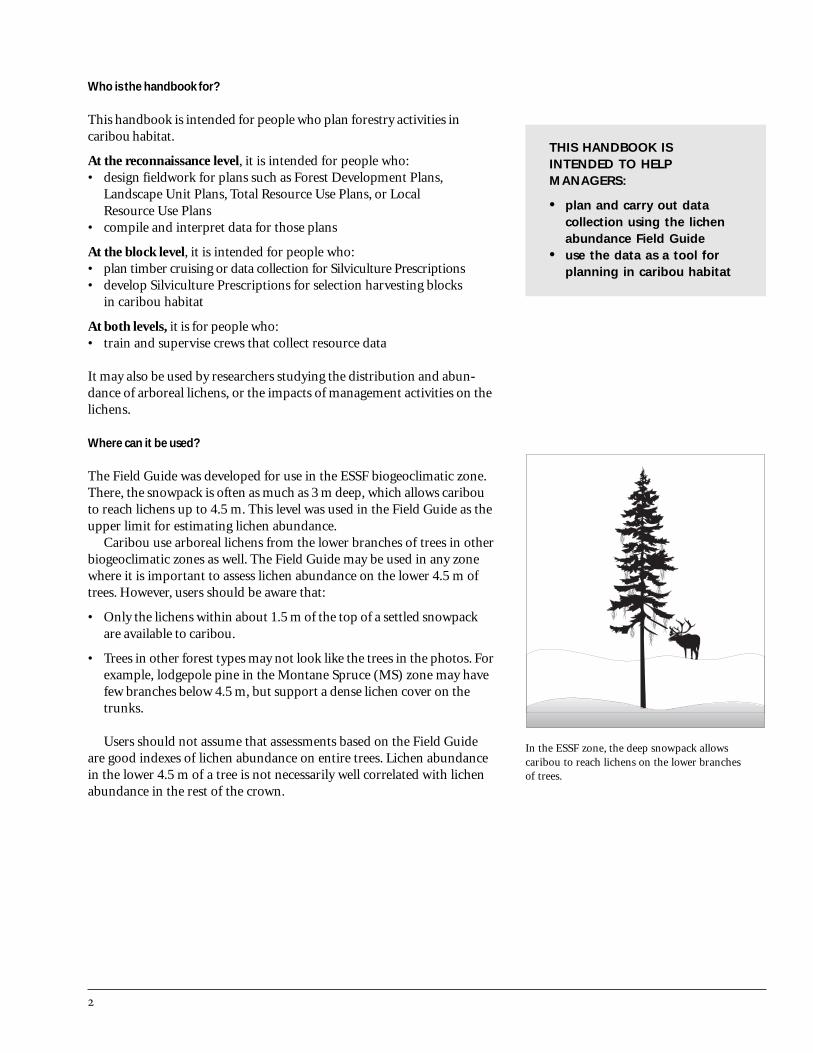
Where can it be used?
The Field Guide was developed for use in the ESSF biogeoclimatic zone.There, the snowpack is often as much as 3 m deep, which allows caribouto reach lichens up to 4.5 m. This level was used in the Field Guide as theupper limit for estimating lichen abundance.
Caribou use arboreal lichens from the lower branches of trees in otherbiogeoclimatic zones as well. The Field Guide may be used in any zonewhere it is important to assess lichen abundance on the lower 4.5 m oftrees. However, users should be aware that:
• Only the lichens within about 1.5 m of the top of a settled snowpackare available to caribou.
• Trees in other forest types may not look like the trees in the photos. Forexample, lodgepole pine in the Montane Spruce (MS) zone may havefew branches below 4.5 m, but support a dense lichen cover on thetrunks.
Users should not assume that assessments based on the Field Guideare good indexes of lichen abundance on entire trees. Lichen abundancein the lower 4.5 m of a tree is not necessarily well correlated with lichenabundance in the rest of the crown.
THIS HANDBOOK ISINTENDED TO HELPMANAGERS:
• plan and carry out datacollection using the lichenabundance Field Guide
• use the data as a tool forplanning in caribou habitat
In the ESSF zone, the deep snowpack allowscaribou to reach lichens on the lower branchesof trees.

The Field Guide wasdeveloped for use in theESSF, but it may be usedin any zone where it isimportant to assess lichenabundance on the lower4.5 m of trees.
2 WHY ASSESS LICHEN ABUNDANCE?
Caribou depend on lichens for winter forage
Arboreal lichens form part of the winter diet of caribou in many parts ofBritish Columbia. The caribou of southeastern and east-central BritishColumbia, known as mountain caribou, are especially dependent onarboreal lichens. For caribou living elsewhere in British Columbia, oftencalled northern caribou, arboreal lichens are one of several importantwinter foods. The two types of caribou belong to the same species, butoccupy different winter habitats (Figure 1).
With their well-insulated coats and large hooves, caribou are welladapted to cold weather and deep snow. Mountain caribou have anunusual strategy for surviving the long, snowy winters. Unlike mooseand deer, which seek out shallow snow, mountain caribou spend muchof the winter in high-elevation forests. Deep snowpacks at high elevationsbury other forage that caribou might use but also create a platform thatallows the caribou to reach higher into the trees. This strategy of spendingwinter at high elevations has the advantage of separating the caribou frommoose, deer, and wolves most of the time, but it does make them depend-ent on a single type of forage—arboreal lichens.
Mountain caribou do not necessarily spend the entire winter in thehigh-elevation ESSF zone. In some areas they also use the lower-elevationInterior Cedar–Hemlock (ICH) zone, especially during early winterwhen the snow is fresh and soft. In the ICH zone, caribou usually cannotreach many lichens on the lower branches of trees, and instead eatlichens that have fallen onto the snow or are available on fallen branchesor fallen trees. They also eat the leaves of low evergreen shrubs such asfalsebox or bunchberry. Unlike moose and deer, caribou browse verylittle on woody parts of shrubs. Assessment of winter forage for caribouin the ICH zone should include litterfall lichens, lichens on fallen trees,and vascular forage, as well as lichens in the lower canopy.
Elsewhere in British Columbia, where the snowpack is not as deep,northern caribou can scrape away snow to get at other types of forageduring winter—in particular, terrestrial (ground) lichens, grasses, andsedges. Northern caribou use arboreal lichens too, but not as regularlyas do mountain caribou. Terrestrial vegetation may become inaccessiblewhen the snow is deep or crusted, and northern caribou then move toforest types where they can feed mainly on arboreal lichens. Sometimesnorthern caribou switch back and forth between terrestrial vegetationand arboreal lichens in a single forest type.
People sometimes wonder whether it makes any difference to caribouif the lichen supply is reduced by logging, since arboreal lichens seem tobe abundant and widespread in caribou range. Most studies of caribouin British Columbia have concluded that caribou numbers are notdirectly limited by the amount of food available to them. What seems tobe more important is the amount of suitable habitat available at differenttimes of the year. During winter, caribou tend to range over large areas,moving frequently and unpredictably. This behaviour makes it difficultfor predators to find them. The amount of space they need to avoid
In the MS zone, more lichens may be available tocaribou on the trunk of lodgepole pine than on thebranches.

predators is probably greater than the amount they need just for foraging.However, to serve as suitable habitat for avoiding predators, an area mustalso provide accessible food. Accessibility varies with depth and density ofsnow. To maintain caribou populations, managers must ensure thatlarge areas with accessible forage are available in the right places at theright times.
Information about lichens may be required for approval of plans
Increasingly, the B.C. Ministry of Environment, Lands and Parks isrequiring that caribou habitat be considered in forest management plans.Information on lichen abundance is an important input to manage-ment decisions in a planning area that includes caribou range. Insome areas, information about lichens may be requested before a man-agement plan is submitted, or may increase the likelihood that the planwill be approved.
In several regions, Ministry of Environment, Lands and Parks guide-lines call for use of selection silvicultural systems to maintain caribouhabitat in certain areas. Some land-use plans now specify partial cuttingor “modified” harvesting instead of clearcutting in caribou range. In suchcases, information on lichen abundance may be essential to the design ofsuitable Silviculture Prescriptions.
In the ICH zone, more lichens may be available onfallen trees or branches than are within reach onstanding trees.
figure Range of caribou in British Columbia.
3 USING THE FIELD GUIDE TO ASSESS INDIVIDUAL TREES
Basic procedures
The Field Guide is easy to use, but it is important that it be used in thesame way from day to day and by all crew members.
• Practice together to develop consistency. At the beginning of aproject, all users should practice together until their results areconverging. As there will always be trees at the borderline betweenLichen Classes, there will always be some discrepancies between thescores given by different observers. If training and practice have beenadequate, it is reasonable to expect that most observers will give thesame tree the same score, and that scores that do differ will not differby more than one Lichen Class.
• Know the sampling scheme and follow it rigorously. To avoid bias,users must score all the sample trees, and only those trees. Dying anddead sample trees are also assessed. Unusual trees that occur outsidethe plot or transect may be described in the field notes, but must notbe added to the data.
• Walk around the tree to find the best viewing position. The lichenestimate applies to the entire lower portion of the tree, not just to oneside. Lichen abundance may look different from different angles. Thephotographs in the Field Guide were taken from the angle that bestrevealed the lichens. The best viewing position is the one from whichyou can see the lichens best, with the least interference from othertrees. If you cannot see all the lichens from one viewing position, youmust adjust your estimate to account for the additional lichens viewedfrom a different position.
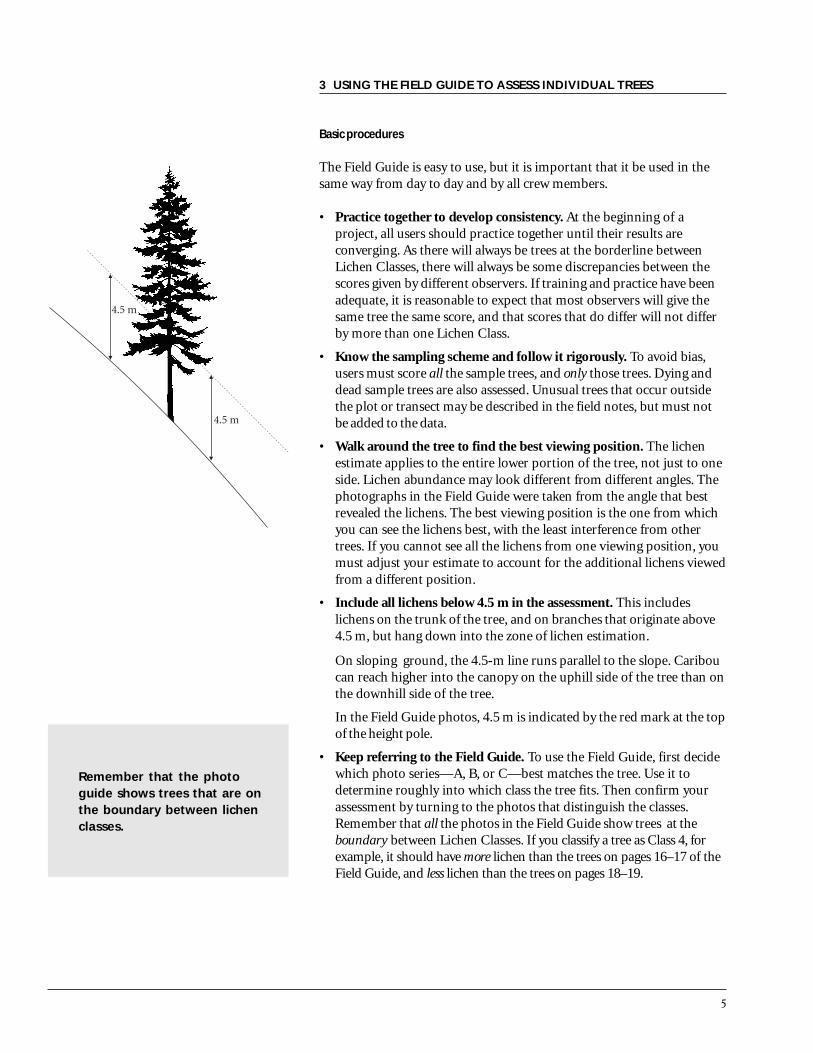
• Include all lichens below 4.5 m in the assessment. This includeslichens on the trunk of the tree, and on branches that originate above4.5 m, but hang down into the zone of lichen estimation.
On sloping ground, the 4.5-m line runs parallel to the slope. Cariboucan reach higher into the canopy on the uphill side of the tree than onthe downhill side of the tree.
In the Field Guide photos, 4.5 m is indicated by the red mark at the topof the height pole.
• Keep referring to the Field Guide. To use the Field Guide, first decidewhich photo series—A, B, or C—best matches the tree. Use it todetermine roughly into which class the tree fits. Then confirm yourassessment by turning to the photos that distinguish the classes.Remember that all the photos in the Field Guide show trees at theboundary between Lichen Classes. If you classify a tree as Class 4, forexample, it should have more lichen than the trees on pages 16–17 of theField Guide, and less lichen than the trees on pages 18–19.
Remember that the photoguide shows trees that are onthe boundary between lichenclasses.

When you have some experience, you may be able to skip the first photoseries A–C and go directly to the second set of photos. However, toprevent your estimates from “wandering,” it is important to confirm yourassessment by referring to the photos. Even experienced users shouldrefer to the photo guide several times a day, and more frequently wherelichen abundance is especially variable.
Questions and answers
Can lichen assessments be done at any time of year?
Lichen assessments are best done during the snowfree season. As the4.5-m point is always located relative to the forest floor, it is easiest toidentify when there is no snowpack. Also, assessments can be difficultwhen fresh snow has accumulated on branches.
Some of these trees have hardly any lichens on them. Do I haveto assess them?
Yes. The aim is to find out how many trees are present in each LichenClass, not just to look for trees with a lot of lichen. To avoid biasing theresults, each tree that is identified as a sample tree must be assessed,regardless of how much lichen is on it.
If you are assessing trees with very little lichen, remember that a treewith only a wisp of lichen belongs in Class 1, not Class 0. Lichen Class 0is reserved for trees with no lichen at all. This is extremely rare in moststands where lichen assessments are done. Class 0 is included in thescheme because it is logical to allow for the possibility of trees with nolichen at all, and because there are some occasions when it is actuallyneeded.
figure 2 How to use the scale to adjust lichen scores.
Amount of Lichen (grams)
There are more lichens on one side of the tree than the other.Which side do I look at when I assess the tree?
It helps to understand that the Field Guide photographs were taken sothat as many of the lichens as possible would be visible. Some of thelichens that could not be seen were removed before the photos weretaken. Thus, the lichens that make up the biomass values given on page21 in the Field Guide are all, or nearly all, visible in the photos.
Usually, it is adequate to position yourself so that you can see as muchof the lichen as possible, and score the tree on the basis of what you see.If a substantial amount of lichen cannot be seen from that position, youmay need to adjust the class upward. Suppose, for example, you areassessing a tree that looks like a high Class 3, but your estimate does nottake into account some branches that were invisible from your viewingposition. You estimate that those branches support about one-third asmuch lichen as the portion of the tree you have already estimated. Usethe scale on pages 4–5 of the Field Guide to determine whether theadditional lichen will move your estimate to Class 4 (Figure 2).
Sometimes it is necessary to make allowances for a tree with anasymmetrical crown. Again, use the scale on pages 4–5 of the FieldGuide to make the adjustment.
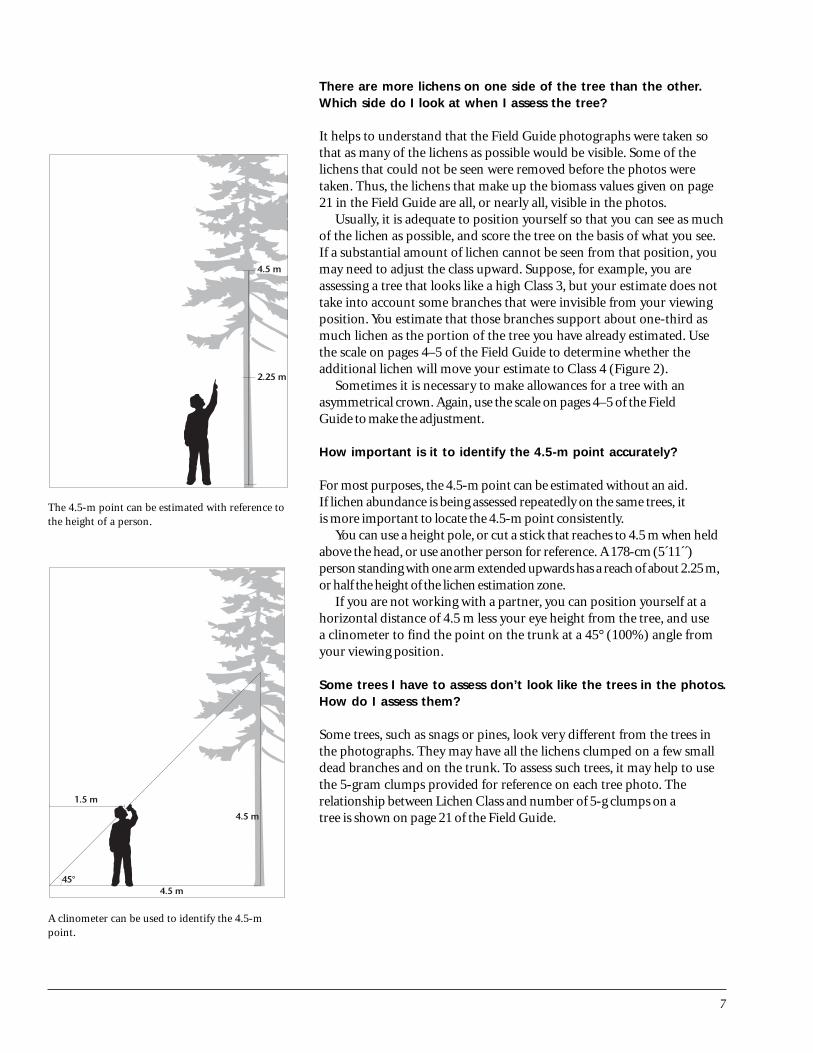
How important is it to identify the 4.5-m point accurately?
For most purposes, the 4.5-m point can be estimated without an aid.If lichen abundance is being assessed repeatedly on the same trees, itis more important to locate the 4.5-m point consistently.
You can use a height pole, or cut a stick that reaches to 4.5 m when heldabove the head, or use another person for reference. A 178-cm (5´11´´)person standing with one arm extended upwards has a reach of about 2.25 m,or half the height of the lichen estimation zone.
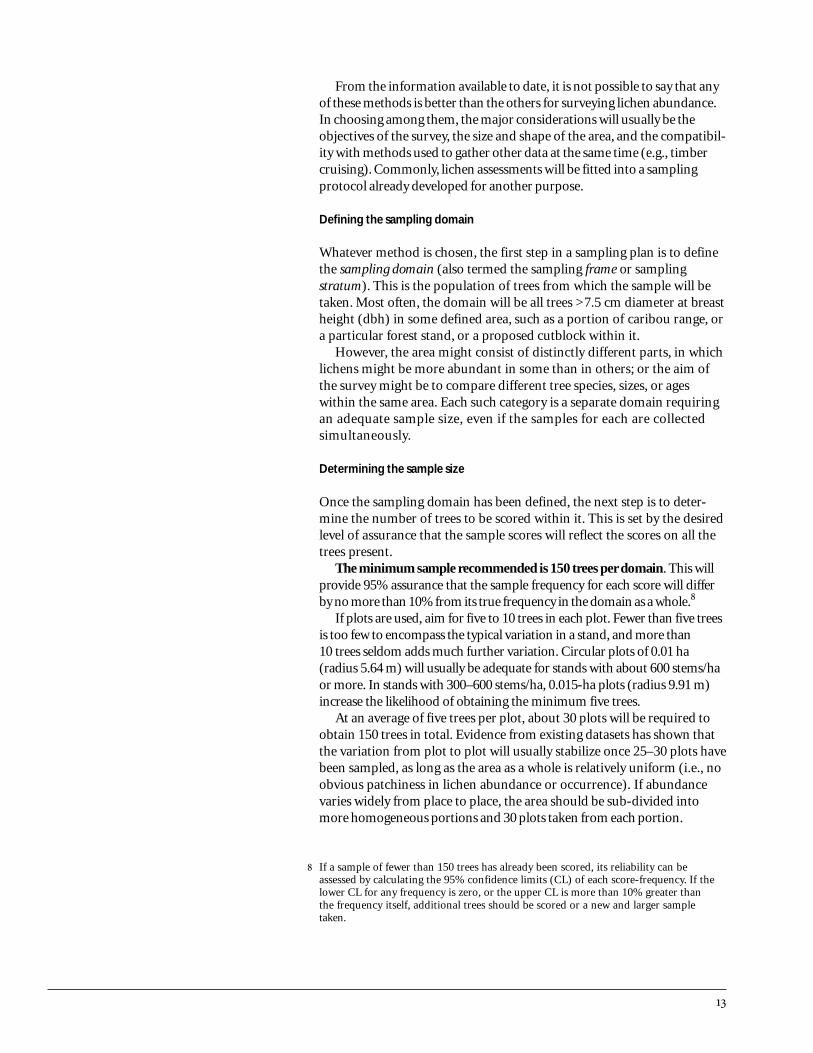
If you are not working with a partner, you can position yourself at ahorizontal distance of 4.5 m less your eye height from the tree, and usea clinometer to find the point on the trunk at a 45° (100%) angle fromyour viewing position.
Some trees I have to assess don’t look like the trees in the photos.How do I assess them?
Some trees, such as snags or pines, look very different from the trees inthe photographs. They may have all the lichens clumped on a few smalldead branches and on the trunk. To assess such trees, it may help to usethe 5-gram clumps provided for reference on each tree photo. Therelationship between Lichen Class and number of 5-g clumps on atree is shown on page 21 of the Field Guide.
The 4.5-m point can be estimated with reference tothe height of a person.
A clinometer can be used to identify the 4.5-mpoint.

It is hard to tell the difference between Classes 1, 2, and 3 fromthe photographs. Is there any other way to classify trees with lowlichen abundance?
Trees with low lichen abundance, as well as trees that do not look likethe ones in the photos, can be assessed by counting the number of5-g clumps that are present below 4.5 m. Page 21 of the Field Guideshows photos of 5-g clumps, and relates the number of clumps toLichen Class.
How do we know how much lichen is really on the trees in thephotographs?
The lichens on the trees in the photos were removed in stages, air-driedto room temperature, and weighed. First, some of the branches andlichens that were invisible to the camera were removed, and the tree wasphotographed. Then, a portion of the remaining lichens was removedfrom each part of the tree, bagged, and labelled, and the tree was photo-graphed again. This process was repeated until a series of photographshad been taken, and all the lichens had been removed. The lichens in thebags were weighed, and the information used to calculate the biomass ofthe lichens present on the tree in each photo.
How accurately can observers classify lichen abundance on trees?
This question is being answered as part of an ongoing study of arboreallichen ecology near Prince George. An experienced observer used theField Guide to assess lichen abundance on 27 Engelmann spruce andsubalpine fir trees. Lichen abundance in the assessment zone of each treewas then determined through detailed sampling and weighing. Figure 3shows how the Lichen Class assigned by the observer compared to theLichen Class based on biomass sampling.
Although most trees were classified correctly, the errors that didoccur were nearly all underestimates rather than overestimates. Thispattern is consistent with the results of other studies in which estimatesof lichen biomass have been related to actual measurements. It probablyoccurs because people are more likely to miss seeing lichens that arepresent than to imagine lichens that are not there. To some extent,observers can compensate for this tendency by being aware of it.
How much lichen must a tree have for caribou to use it?
Research into the foraging behaviour of caribou indicates that caribouare more likely to feed from trees with abundant lichens than trees onwhich lichen is sparse. The Field Guide was not used to assess lichenabundance on the trees in those studies. Based on their experience,
figure 3 Frequency distribution of thedifference between Lichen Classbased on measured samples andLichen Class assessed by anobserver.
Terry, E. 1994. Winter habitat selection and foraging patterns of mountain caribou.MSc thesis. University of British Columbia, Vancouver, B.C.;Rominger, E.M., C.T. Robbins, and M.A. Evans. 1996. Winter foraging ecology ofwoodland caribou in northeastern Washington. J. Wildl. Manage. 60(4):719–728.

however, the researchers judged that trees in Lichen Classes 0, 1, and 2 inthe Field Guide were likely to be passed by, whereas trees in Lichen Class 3or higher were potential feeding sites.
Should I collect information on the types of lichens that arepresent, and if so, how?
There are important differences between the two types of forage lichen—Alectoria and Bryoria—that can affect forest management in caribouhabitat. First, the two types seem to prefer different combinations oflight and moisture, and Bryoria is likely to respond more positively thanAlectoria when stands are opened up by partial cutting. Second, there isgrowing evidence that caribou choose Bryoria rather than Alectoria whenboth are available. Information collected on the types of lichens presentwill contribute to a knowledge base that can be used to improve manage-ment.
For most purposes, it is adequate to classify the sample trees into oneof three categories, such as:
• A — mainly Alectoria (more than 70% Alectoria)• AB — mixed Alectoria and Bryoria• B — mainly Bryoria (more than 70% Bryoria)
The photographs on page 3 of the Field Guide will help.If more detailed assessments are needed, genus composition may be
estimated to the nearest 10%. Genus composition is usually recordedonly for trees of Lichen Class 2 or more.
How can I tell Alectoria and Bryoria from other lichens?
In the ESSF zone, Alectoria and Bryoria are the dominant beard-likelichens growing on trees. In other zones, you are more likely to encoun-ter lichens that could be confused with Alectoria and Bryoria.
Bryoria species are brownish, greyish, or almost black, with branchesthat are round in cross-section, not flattened. Several reddish brownspecies have recently been renamed as Nodobryoria; they should beincluded with Bryoria in lichen assessments.
Alectoria sarmentosa is yellow-green to grey-green. Some Usnea specieslook similar, but have a tough central cord that is noticeable when afragment is gently pulled apart. Ramalina thrausta looks similar, but thebranches have hook-shaped tips.
Most often, users of the Field Guide will not need to carry out de-tailed lichen identification. Similar-looking species may be lumped withAlectoria and Bryoria for the purposes of determining Lichen Classes.Users who would like to learn more about lichen identification may consulta Field Guide.
Rominger, E.M., C.T. Robbins, and M.A. Evans. 1996. Winter foraging ecology ofwoodland caribou in northeastern Washington. J. Wildl. Manage. 60(4):719–728.
McCune, B. and T. Goward. 1995. Macrolichens of the northern Rocky Mountains.Mad River Press Inc., Eureka, Calif.; Vitt, D.H., J.E. Marsh, and R.B. Bovey. 1988.Mosses, lichens and ferns of northwest North America. Lone Pine, Edmonton, Alta.
4 BASIC CHARACTERISTICS OF LICHEN DATASETS
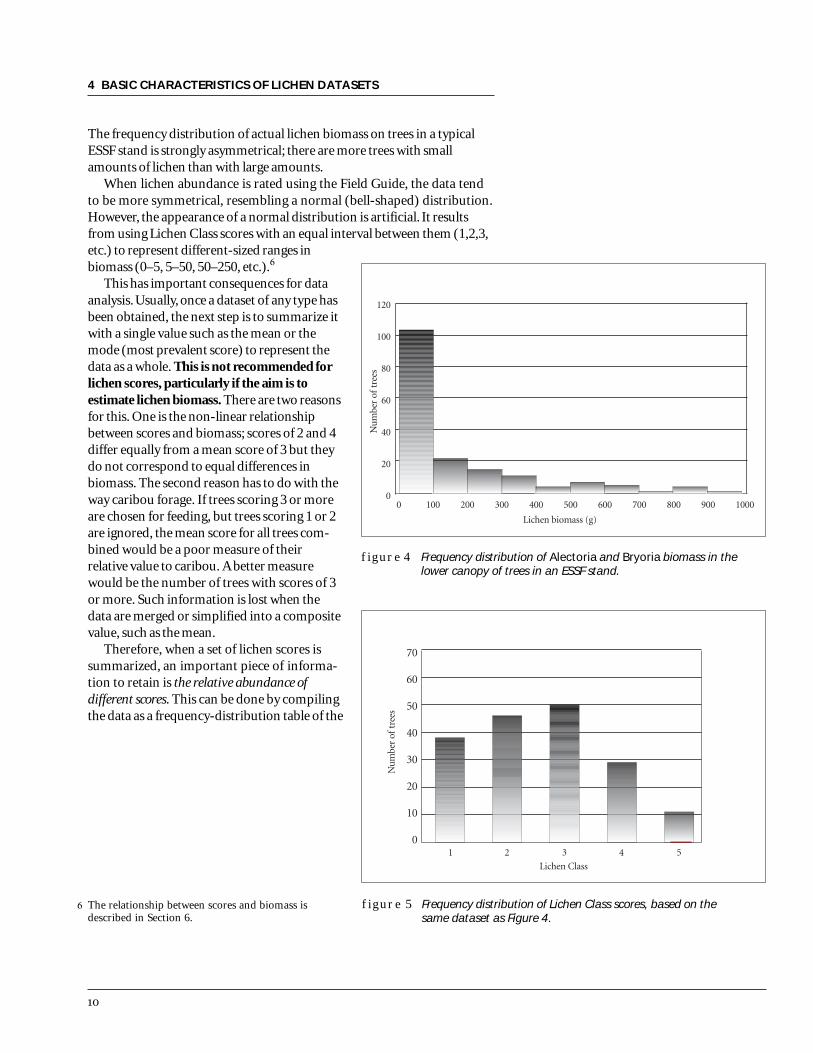
The frequency distribution of actual lichen biomass on trees in a typicalESSF stand is strongly asymmetrical; there are more trees with smallamounts of lichen than with large amounts.
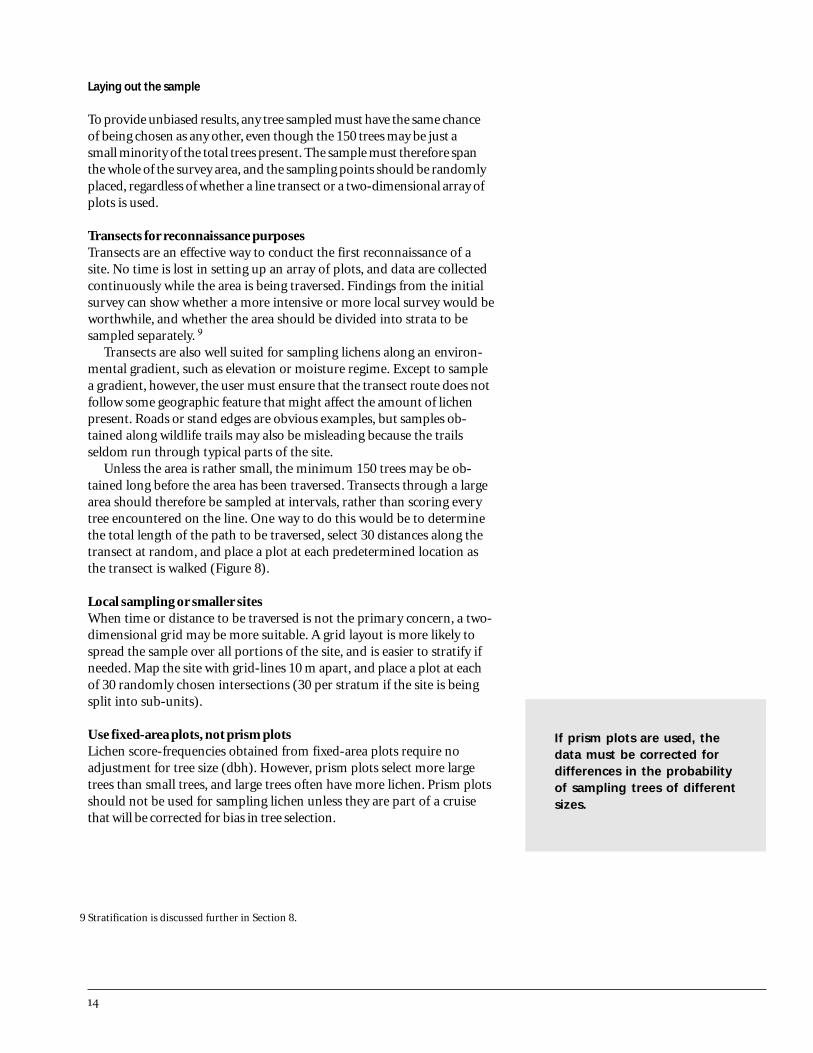
When lichen abundance is rated using the Field Guide, the data tendto be more symmetrical, resembling a normal (bell-shaped) distribution.However, the appearance of a normal distribution is artificial. It resultsfrom using Lichen Class scores with an equal interval between them (1,2,3,etc.) to represent different-sized ranges inbiomass (0–5, 5–50, 50–250, etc.).
This has important consequences for dataanalysis. Usually, once a dataset of any type hasbeen obtained, the next step is to summarize itwith a single value such as the mean or themode (most prevalent score) to represent thedata as a whole. This is not recommended forlichen scores, particularly if the aim is toestimate lichen biomass. There are two reasonsfor this. One is the non-linear relationshipbetween scores and biomass; scores of 2 and 4differ equally from a mean score of 3 but theydo not correspond to equal differences inbiomass. The second reason has to do with theway caribou forage. If trees scoring 3 or moreare chosen for feeding, but trees scoring 1 or 2are ignored, the mean score for all trees com-bined would be a poor measure of theirrelative value to caribou. A better measurewould be the number of trees with scores of 3or more. Such information is lost when thedata are merged or simplified into a compositevalue, such as the mean.
Therefore, when a set of lichen scores issummarized, an important piece of informa-tion to retain is the relative abundance ofdifferent scores. This can be done by compilingthe data as a frequency-distribution table of the
The relationship between scores and biomass isdescribed in Section 6.
figure 4 Frequency distribution of Alectoria and Bryoria biomass in thelower canopy of trees in an ESSF stand.
figure 5 Frequency distribution of Lichen Class scores, based on thesame dataset as Figure 4.

following type, here representing two hypothetical sites to becompared:
Lichen Class scores
0 1 2 3 4 5 Total
Site 1 no. of trees: 1 13 23 31 19 1 88Site 2 no. of trees: 0 11 20 29 20 2 82
Bar graphs based on frequency distributions are useful tools for assessingwhether sites are similar or different, and whether they have high or low
levels of lichen abundance. Figure 6 shows thefrequency distribution of Lichen Classes at twosites used regularly by mountain caribou inwinter. The frequencies are plotted as percent-ages of each sample. Both sites have a highproportion of trees in the classes thought to beuseful to caribou—67% of scores > 3 at Site 1and 57% at Site 2. In contrast, Figure 7 showsthe frequency distribution of Lichen Classes attwo ESSF sites that have low lichen abundanceand are not used as winter range by mountaincaribou. Only 7 and 9% of the two samples,respectively, have lichen scores of Class 3 orhigher.
Although graphing the data is often enoughfor basic comparisons such as these, the differ-ences may not always be as distinct as betweenFigures 6 and 7, or the sample sizes may besmall, raising the possibility that the result isdue to chance. Then, a statistical test may berequired, as discussed in Section 5.
All the information needed for formal testson score-distributions is contained in thefrequency table. However, the user may alsowish to assess how scores are distributed overdifferent parts of the site, or how much lichenis present per unit area. For these purposes
A frequency-distribution tableis a better summary of lichendata than the mean score.
figure 7 Lichen score-frequencies (trees > 7.5 cm dbh) at two sites not usedas mountain caribou winter range.
When sample sizes differ, as at these sites, thescore-counts should be plotted as percentages.When compared by statistical methods (described inSection 5), the counts themselves are used; unequalsample sizes are automatically taken into account.
figure 6 Lichen score-frequencies (trees > 7.5 cm dbh) at two sites used asmountain caribou winter range.

further information is required. To examine spatial variation, it is necessaryto record the location of each score. To estimate total amounts of lichen,conversion factors are required (Section 5) to express the scores as biomassequivalents. Biomass equivalents are especially useful for planning andevaluating harvesting prescriptions at the block level.
5 USING THE FIELD GUIDE FOR RECONNAISSANCE
Reconnaissance objectives for lichen assessment
Lichen assessments at the reconnaissance level are usually made forone or all of the following objectives:
• to classify areas into broad categories of lichen abundance• to identify and roughly map discontinuities in lichen abundance• to determine the dominant lichen genus in an area (e.g., mainly
Alectoria, mixed Alectoria and Bryoria, or mainly Bryoria)
For operational reconnaissance purposes, the Field Guide will nor-mally be used in areas where site conditions make stands suitable aswinter range for caribou. In addition to lichen abundance, two of themost important site conditions affecting caribou use are:
• Slope and topography. Caribou use areas with moderatetopography more than areas with rugged topography. Theyuse slopes <45% more than steeper slopes.
• Stand structure. Caribou seem to prefer stands open enough so they cansee around them. This may be one reasonthey avoid dense young stands.
The following recommendations also apply to sampling for otherpurposes, such as management planning at the stand or block level(Section 6), and research or inventory (Section 8).
Sampling methods
Various sampling methods can be used at the reconnaissance level.Some methods that have given comparable results are:
• plots at intervals along line transects• selectively located plots within strata predetermined for
other purposes• plots at regular spacings on a grid• line or belt transects in which every tree on the transect
is sampled
Often, bar graphs are all thatis needed to tell whethersites are similar or different inlichen abundance.
From the information available to date, it is not possible to say that anyof these methods is better than the others for surveying lichen abundance.In choosing among them, the major considerations will usually be theobjectives of the survey, the size and shape of the area, and the compatibil-ity with methods used to gather other data at the same time (e.g., timbercruising). Commonly, lichen assessments will be fitted into a samplingprotocol already developed for another purpose.
Defining the sampling domain
Whatever method is chosen, the first step in a sampling plan is to definethe sampling domain (also termed the sampling frame or samplingstratum). This is the population of trees from which the sample will betaken. Most often, the domain will be all trees >7.5 cm diameter at breastheight (dbh) in some defined area, such as a portion of caribou range, ora particular forest stand, or a proposed cutblock within it.
However, the area might consist of distinctly different parts, in whichlichens might be more abundant in some than in others; or the aim ofthe survey might be to compare different tree species, sizes, or ageswithin the same area. Each such category is a separate domain requiringan adequate sample size, even if the samples for each are collectedsimultaneously.
Determining the sample size
Once the sampling domain has been defined, the next step is to deter-mine the number of trees to be scored within it. This is set by the desiredlevel of assurance that the sample scores will reflect the scores on all thetrees present.
The minimum sample recommended is 150 trees per domain. This willprovide 95% assurance that the sample frequency for each score will differby no more than 10% from its true frequency in the domain as a whole.
If plots are used, aim for five to 10 trees in each plot. Fewer than five treesis too few to encompass the typical variation in a stand, and more than10 trees seldom adds much further variation. Circular plots of 0.01 ha(radius 5.64 m) will usually be adequate for stands with about 600 stems/haor more. In stands with 300–600 stems/ha, 0.015-ha plots (radius 9.91 m)increase the likelihood of obtaining the minimum five trees.
At an average of five trees per plot, about 30 plots will be required toobtain 150 trees in total. Evidence from existing datasets has shown thatthe variation from plot to plot will usually stabilize once 25–30 plots havebeen sampled, as long as the area as a whole is relatively uniform (i.e., noobvious patchiness in lichen abundance or occurrence). If abundancevaries widely from place to place, the area should be sub-divided intomore homogeneous portions and 30 plots taken from each portion.
If a sample of fewer than 150 trees has already been scored, its reliability can beassessed by calculating the 95% confidence limits (CL) of each score-frequency. If thelower CL for any frequency is zero, or the upper CL is more than 10% greater thanthe frequency itself, additional trees should be scored or a new and larger sampletaken.
Laying out the sample
To provide unbiased results, any tree sampled must have the same chanceof being chosen as any other, even though the 150 trees may be just asmall minority of the total trees present. The sample must therefore spanthe whole of the survey area, and the sampling points should be randomlyplaced, regardless of whether a line transect or a two-dimensional array ofplots is used.
Transects for reconnaissance purposesTransects are an effective way to conduct the first reconnaissance of asite. No time is lost in setting up an array of plots, and data are collectedcontinuously while the area is being traversed. Findings from the initialsurvey can show whether a more intensive or more local survey would beworthwhile, and whether the area should be divided into strata to besampled separately.
Transects are also well suited for sampling lichens along an environ-mental gradient, such as elevation or moisture regime. Except to samplea gradient, however, the user must ensure that the transect route does notfollow some geographic feature that might affect the amount of lichenpresent. Roads or stand edges are obvious examples, but samples ob-tained along wildlife trails may also be misleading because the trailsseldom run through typical parts of the site.
Unless the area is rather small, the minimum 150 trees may be ob-tained long before the area has been traversed. Transects through a largearea should therefore be sampled at intervals, rather than scoring everytree encountered on the line. One way to do this would be to determinethe total length of the path to be traversed, select 30 distances along thetransect at random, and place a plot at each predetermined location asthe transect is walked (Figure 8).
Local sampling or smaller sitesWhen time or distance to be traversed is not the primary concern, a two-dimensional grid may be more suitable. A grid layout is more likely tospread the sample over all portions of the site, and is easier to stratify ifneeded. Map the site with grid-lines 10 m apart, and place a plot at eachof 30 randomly chosen intersections (30 per stratum if the site is beingsplit into sub-units).
Use fixed-area plots, not prism plotsLichen score-frequencies obtained from fixed-area plots require noadjustment for tree size (dbh). However, prism plots select more largetrees than small trees, and large trees often have more lichen. Prism plotsshould not be used for sampling lichen unless they are part of a cruisethat will be corrected for bias in tree selection.
If prism plots are used, thedata must be corrected fordifferences in the probabilityof sampling trees of differentsizes.
9 Stratification is discussed further in Section 8.
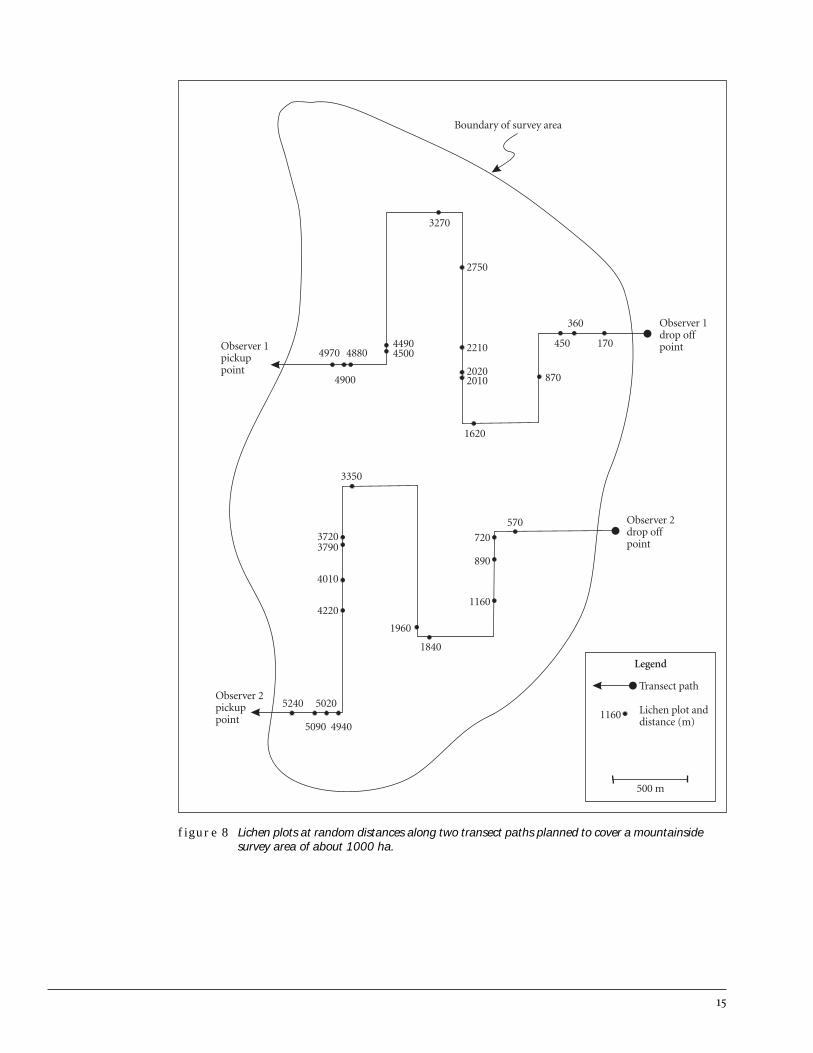
figure 8 Lichen plots at random distances along two transect paths planned to cover a mountainsidesurvey area of about 1000 ha.
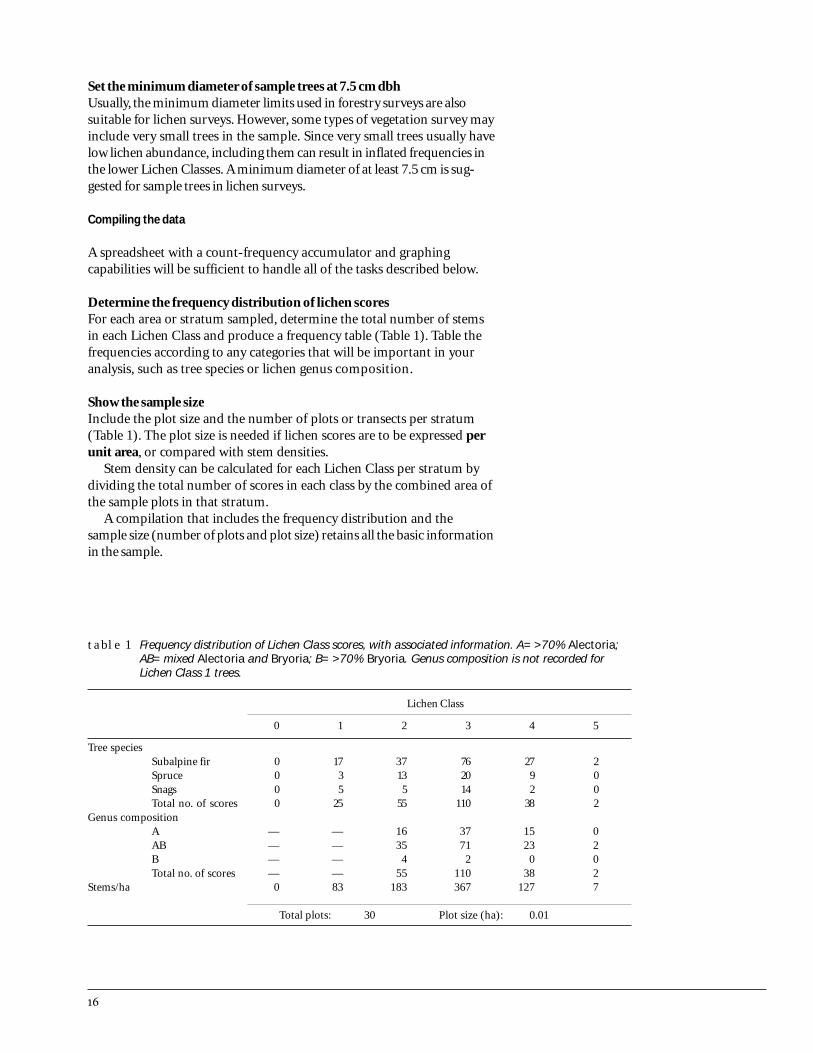
table 1 Frequency distribution of Lichen Class scores, with associated information. A= >70% Alectoria;AB= mixed Alectoria and Bryoria; B= >70% Bryoria. Genus composition is not recorded forLichen Class 1 trees.
Lichen Class
0 1 2 3 4 5
Tree speciesSubalpine fir 0 17 37 76 27 2Spruce 0 3 13 20 9 0Snags 0 5 5 14 2 0Total no. of scores 0 25 55 110 38 2
Genus compositionA — — 16 37 15 0AB — — 35 71 23 2B — — 4 2 0 0Total no. of scores — — 55 110 38 2
Stems/ha 0 83 183 367 127 7
Total plots: 30 Plot size (ha): 0.01
Set the minimum diameter of sample trees at 7.5 cm dbhUsually, the minimum diameter limits used in forestry surveys are alsosuitable for lichen surveys. However, some types of vegetation survey mayinclude very small trees in the sample. Since very small trees usually havelow lichen abundance, including them can result in inflated frequencies inthe lower Lichen Classes. A minimum diameter of at least 7.5 cm is sug-gested for sample trees in lichen surveys.
Compiling the data
A spreadsheet with a count-frequency accumulator and graphingcapabilities will be sufficient to handle all of the tasks described below.
Determine the frequency distribution of lichen scoresFor each area or stratum sampled, determine the total number of stemsin each Lichen Class and produce a frequency table (Table 1). Table thefrequencies according to any categories that will be important in youranalysis, such as tree species or lichen genus composition.
Show the sample sizeInclude the plot size and the number of plots or transects per stratum(Table 1). The plot size is needed if lichen scores are to be expressed perunit area, or compared with stem densities.
Stem density can be calculated for each Lichen Class per stratum bydividing the total number of scores in each class by the combined area ofthe sample plots in that stratum.
A compilation that includes the frequency distribution and thesample size (number of plots and plot size) retains all the basic informationin the sample.
Analyzing the data
Lichen abundance can be assessed for a site, or compared among sites,or compared among strata by:
• the differences in the relative frequencies of different scores• the differences in the percentage of scores above a certain limit• the cumulative score-total(s) or biomass total(s) for the site(s) or
categories• the total or average biomass per plot
These are not the only possibilities. However, the first step in any ofthese analyses should be to produce bar graphs showing the number ofscores per Lichen Class, for each category of interest. Bar graphs quicklyindicate the main features of each sample, such as the most commonscore, how typical it is for the sample as a whole, and how it compares tothe most common score in other samples.
If these features are distinct and the sample sizes are adequate, a graphwill often be enough to answer the basic question of interest; for example,whether two sites differ in lichen abundance. But if the samples are smallor the difference between them does not appear distinct, a more formalstatistical test may be required.
The common purpose of the statistical tests described below is togauge the likelihood that the results observed could have occurred bychance instead of representing a real biological effect. The calculationsrequired are not complex. A spreadsheet is sufficient for handling them,and procedures can be found in most statistical texts.
Comparing relative differences in lichen abundanceTo find out whether the number of scores differs significantly amongLichen Classes, their relative frequencies can be compared. This can bedone for a single sample (comparing class with class) or for two or moresamples (comparing all classes jointly).
If the data are compiled as raw frequencies with no further conversion(as in Table 1), they should be regarded as samples from a multinomialdistribution, and analyzed using methods for dealing with proportionsor counts. “Contingency” methods (chi-square or log-likelihood ratio G)are traditional ways for doing this.
Frequency distributionsshould be analyzed bymethods designed forproportions or counts.
Various pre-programmed routines (e.g., SYSTAT®, SPSS®, and SAS®) further reducethe task by generating probability levels internally, thus avoiding the need to refer toprobability tables.

For assessing a single set of scores, a “one-way” chi-square or G-test canshow the level of probability that the score-frequencies differ non-ran-domly from Class to Class. The confidence limits of each frequency (seefootnote 8, Section 5) can show which particular frequencies differ signifi-cantly from each other (e.g., the number of Lichen Class 3s versus thenumber of Class 2s). If one or more frequency is near zero (as is often thecase with Score 4s or 5s) the confidence limits will indicate whether itdiffers from zero by more than random chance.
For comparing two sets of scores, a “two-way” chi-square or G-test canbe used. Typically this would be to compare two sites. Either test can alsobe used for comparing a single set of scores with a pre-defined “target”distribution. An example might be to compare observed scores with adesired distribution of scores, such as from a stand management pre-scription (see Section 6).
Chi-square tests are familiar and easy to use. G-tests are less commonbut just as easy to calculate. Both tests can also be applied to summarizeddata, such as the number of high or low scores, if the full array of scoresis unavailable. The chi-square method has an important limitation,however. Small score-frequencies at the upper or lower tail of the distri-bution may distort the X 2 statistic and give unreliable results. When oneor more frequencies is <5, the usual advice is to combine them with thenext adjoining class (e.g., Lichen Class 1 with Class 2, or Class 5 withClass 4). However, the number of high or low scores may be the factorthat differs most between one sample and another, and if score classes arecombined, this information is lost.
The G-test is considered more robust to this limitation than the chi-square test. For a G-test, frequencies <5 do not need to be combined,especially if G is adjusted as G/q. For this reason, the G-test is the betterchoice.
The most powerful test for use with either one or two score-frequencydistributions is the Kolmogorov-Smirnov (K-S) test. For a K-S test,unlike chi-square, small frequencies at the tails do not have to be com-bined––indeed, it is disadvantageous to do so––since the K-S test issensitive to any difference in asymmetry of samples that are similar inother respects.
Unfortunately, K-S tests are restricted to just one sample or two, butchi-square and G-tests can easily be extended to three or more. For thechi-square test, however, the limitation at small scores still applies. Thus,for comparing three or more frequency distributions simultaneously, therecommended method is the log-likelihood ratio, G.
Differences in stem densityThe tests described above compare only the relative numbers of scores ineach Lichen Class. Thus, a G or K-S test will show no difference betweensites with the same ratios of scores, even if one of the sites has a muchlarger total number of scores than the other.
Sokal, R.R. and Rohlf, J.F. 1995. Biometry. Freeman & Company, New York, N.Y.The factor q is defined in this reference.

Sites with similar score-ratios might differ in score-totals for either ofthe following reasons:
• more plots were sampled at one site than the other; or• the two sites differed in stem density.
In comparing score-ratios, the number of plots is immaterial except todetermine the sample size for a G or K-S test. However, a difference instem density would mean a difference in the amount of lichen per unitarea, even if each site has the same amount of lichen per tree.
Thus, when samples differ in total number of scores, they should beexamined for possible differences in stem density. Since each scorerepresents one tree, stem density is simply the number of scores recordedper plot divided by plot size. If plot size is the same at each site, it can beignored and the comparison can be based directly on the number ofscores, plot by plot. Two tests suitable for comparing stem densitiesbetween different samples are:
• Kruskal-Wallis ANOVA (Analysis of Variance) for two or moreindependent samples (e.g., samples from different sites)
• Friedman ANOVA for related samples (e.g., samples from the samesite before and after a management treatment)
The Kruskal-Wallis test and the Friedman test have a similar rationale,and are performed on the ranks of the lichen estimates, rather than theestimates themselves.
Comparing absolute differences in lichen abundanceThere may be situations in which users wish to calculate lichen abun-dance on an absolute basis. Lichen abundance expressed as biomass perunit area integrates the effects of lichen abundance and stem density intoa single measure. Expressions of biomass per unit area make it easy tocompare overall lichen abundance between sites, but not to determinewhether differences are due to lichen scores, stem density, or both.
To compare lichen abundance per unit area between sites, convert thescore-value for each tree to its biomass equivalent, using the conversionfactors given in Section 6. Using these values, calculate the total lichenbiomass for each plot. The outcome may look like a dataset with aninfinite range of possible values that could be analyzed using parametricANOVA or Student’s-t test. The appearance of continuity is misleading,however, since each score-class spans a range of lichen abundance buthas only a single biomass conversion factor. The range of possible valuesin any one sample is restricted rather than infinite, and its distribution isdisjunct rather than continuous. Therefore, lichen data expressed inbiomass equivalents are best analyzed by non-parametric methods. TheKruskal-Wallis test for independent samples and the Friedman test forrelated samples are suitable non-parametric tests for comparing lichenbiomass at the plot level.
Lichen scores expressed asbiomass do not meet theassumptions of parametricstatistics, and should beanalyzed using non-parametric methods.

A remark on the use of statistical testsStatistical tests are a helpful analytical tool, but final judgement rests withthe user, not on the test alone. Other considerations should be taken intoaccount. For example, perhaps the samples are small, but do they differdistinctly nonetheless, as in Figures 6 and 7? How big is the risk that thedifference is due to chance? By convention in statistical tests, a risk greaterthan 5% (i.e., p >.05) is considered “high”. But if the risk is only 6 or 7%,or even 10%, a greater likelihood still exists that the difference is genuine.Lastly, differences at the higher Lichen Classes may be biologically signifi-cant even if not statistically significant, and they may also differ spatiallyeven if not in other respects. The internal structure of the samples shouldnot be ignored.
Mapping the data
Lichen score-frequencies often vary between different parts of a site.When this is suspected, the data should be mapped and examined forsigns of clustering. A multiple frequency distribution cannot feasibly bemapped, and so some form of data reduction or summarization isneeded. The percentage of trees per plot with Lichen Class scores > 3, orthe number per ha or km, are mappable attributes. A threshold LichenClass of 3 is suggested because of evidence that caribou are more likelyto perceive trees of Lichen Class 3 or greater as a food source (Section 3).Since these counts or percentages focus on the upper end of the abundancescale, they are more biologically meaningful than averages based on thewhole scale (i.e., including low-scoring trees that caribou ignore). Figure 9shows how mapped lichen scores could be used to stratify a heterogeneoussurvey area into two lichen-abundance zones.
Using the data to manage caribou habitat
At present, not enough information is available on patterns of lichenabundance in caribou range to specify how much lichen must be presentfor a stand to be useful as winter foraging habitat. Current research willhelp to address this question. In addition, users who collect lichenabundance data operationally in areas of known caribou habitat can helpby registering their projects in a central data registry and contributingdata to the information base if asked to do so. A data registration formcan be found at the back of this handbook.
Where site conditions (slope, topography, and stand structure) aresuitable for caribou winter range, lichen abundance data can be used torank stands for importance as potential foraging areas for caribou. Thisinformation can be used to guide decisions about whether a particularstand should be harvested, and what silvicultural systems should beconsidered.
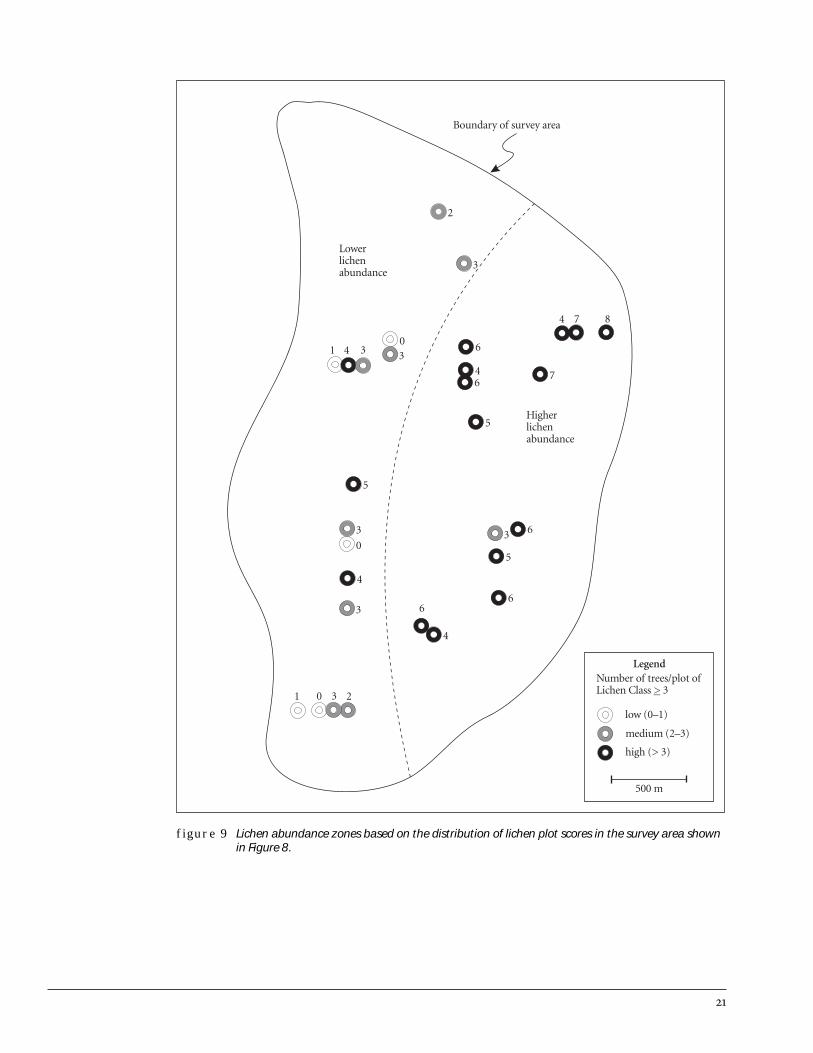
figure 9 Lichen abundance zones based on the distribution of lichen plot scores in the survey area shownin Figure 8.

Lichen abundance is only one factor that affects how caribou use an areain winter, and it is only one factor to consider in planning forest manage-ment. Some of the other factors that affect caribou use are:
• Access. Road access into caribou ranges can make caribou morevulnerable to legal and illegal hunting and can increase the likelihoodof disturbance. Ploughed roads or packed trails can increase access bywolves at times when the snowpack is soft.
• Disturbance. Caribou have abandoned some winter ranges thatbecame heavily used by snowmobilers. Heli-skiing and cross-countryskiing may also be significant disturbance factors.
• Predation risk. The strategies of spacing themselves out over largeareas, using different winter ranges in different years, and movingextensively within ranges in a single winter, probably help caribouavoid predation. Caribou may avoid using ranges where the risk ofpredation is high.
• Habitat fragmentation. Parts of some ranges may not be used becausethey have become isolated from other parts, or because the amount ofsuitable habitat has shrunk.
Forest management in caribou habitat should be planned so that largeareas are in a suitable condition for use by caribou, and are free fromroads and (if possible) snowmobile access. Abundant arboreal lichensdo not in themselves make an area suitable habitat, but without them anarea cannot be used as winter range by mountain caribou.
6 USING THE FIELD GUIDE FOR PLANNING AT THE BLOCK LEVEL
Block-level objectives for lichen assessment
Usually, the purpose of lichen assessment at the block level is to providethe information needed to select a silvicultural system and to plan aprescription. Some of the objectives might be:
• To quantify overall lichen biomass in the block. Overall lichenabundance is an indicator of the importance of the stand as potentialwinter range for caribou.
• To identify and map discontinuities in lichen abundance.Information on the spatial patterning of lichen abundance and ofgenus composition can be used to plan harvest block locations andboundaries.
• To identify the dominant lichen genus, and map discontinuities ingenus composition if they exist. Alectoria and Bryoria differ in theirecological tolerances, and are likely to respond somewhat differentlyto treatments that open the canopy.

• To determine the contribution of dead trees to lichen abundance. Ifdead trees are an important substrate for available lichen in the stand,then a harvesting method should be selected that will permit retentionof some of those trees without endangering workers.
• To relate lichen abundance to tree species and diameter. A table thatrelates lichen abundance to tree species and diameter can be used topredict the effects of various possible selection harvesting prescrip-tions on lichen abundance in the residual stand.
Sampling methods
Lichen assessments at the block level are best done in conjunction witha timber cruise. Both kinds of data needed for a block-level analysis canthen be obtained at the same time and compiled jointly. Lichen scorestend to vary considerably from plot to plot and from tree to tree. Gener-ally, 25–30 plots of 5–10 trees each have been found adequate to charac-terize a homogeneous area, regardless of size. If a block is heterogeneousin lichen abundance, it should be stratified into sampling units that aremore homogeneous within than between, and each stratum should thenbe sampled separately. More detailed information about samplingmethods is found in Section 5.
Prism plots may be used, provided the lichen data are compiled so asto correct for differences in the probability of sampling trees of differentsizes, as described below. If the assessments are not being done togetherwith a timber cruise, then fixed-area plots are recommended. As at thereconnaissance level, 0.01-ha (radius 5.64 m) plots are recommended forstands with more than 600 stems/ha, and 0.015-ha (radius 9.91 m) plotsfor stands with 300–600 stems/ha.
The cruise tally sheet does not provide a column for Lichen Classes.The Ministry of Forests recommends that the scores be recorded inColumn 60. However, because the numbers 1–7 have already beenassigned to another use in that column, alphabetic codes should besubstituted for Lichen Class numeric codes as follows:
Lichen Class Enter in Column 60
0 A1 B2 C3 D4 E5 F
This substitution will ensure that there is no confusion with other codes,which could affect appraisal values. The use of Lichen Class codes inColumn 60 should be noted under “Remarks.”
Compiling the data
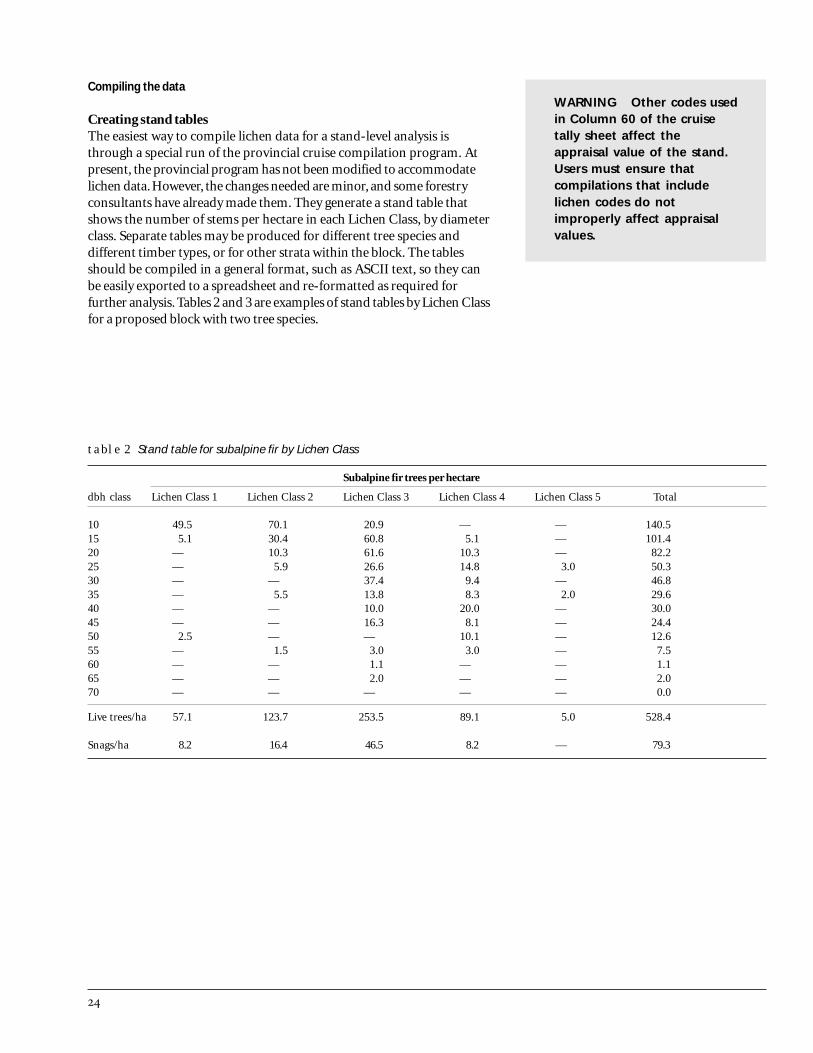
Creating stand tablesThe easiest way to compile lichen data for a stand-level analysis isthrough a special run of the provincial cruise compilation program. Atpresent, the provincial program has not been modified to accommodatelichen data. However, the changes needed are minor, and some forestryconsultants have already made them. They generate a stand table thatshows the number of stems per hectare in each Lichen Class, by diameterclass. Separate tables may be produced for different tree species anddifferent timber types, or for other strata within the block. The tablesshould be compiled in a general format, such as ASCII text, so they canbe easily exported to a spreadsheet and re-formatted as required forfurther analysis. Tables 2 and 3 are examples of stand tables by Lichen Classfor a proposed block with two tree species.
WARNING Other codes usedin Column 60 of the cruisetally sheet affect theappraisal value of the stand.Users must ensure thatcompilations that includelichen codes do notimproperly affect appraisalvalues.
table 2 Stand table for subalpine fir by Lichen Class
Subalpine fir trees per hectare
dbh class Lichen Class 1 Lichen Class 2 Lichen Class 3 Lichen Class 4 Lichen Class 5 Total
10 49.5 70.1 20.9 — — 140.515 5.1 30.4 60.8 5.1 — 101.420 — 10.3 61.6 10.3 — 82.225 — 5.9 26.6 14.8 3.0 50.330 — — 37.4 9.4 — 46.835 — 5.5 13.8 8.3 2.0 29.640 — — 10.0 20.0 — 30.045 — — 16.3 8.1 — 24.450 2.5 — — 10.1 — 12.655 — 1.5 3.0 3.0 — 7.560 — — 1.1 — — 1.165 — — 2.0 — — 2.070 — — — — — 0.0
Live trees/ha 57.1 123.7 253.5 89.1 5.0 528.4
Snags/ha 8.2 16.4 46.5 8.2 — 79.3
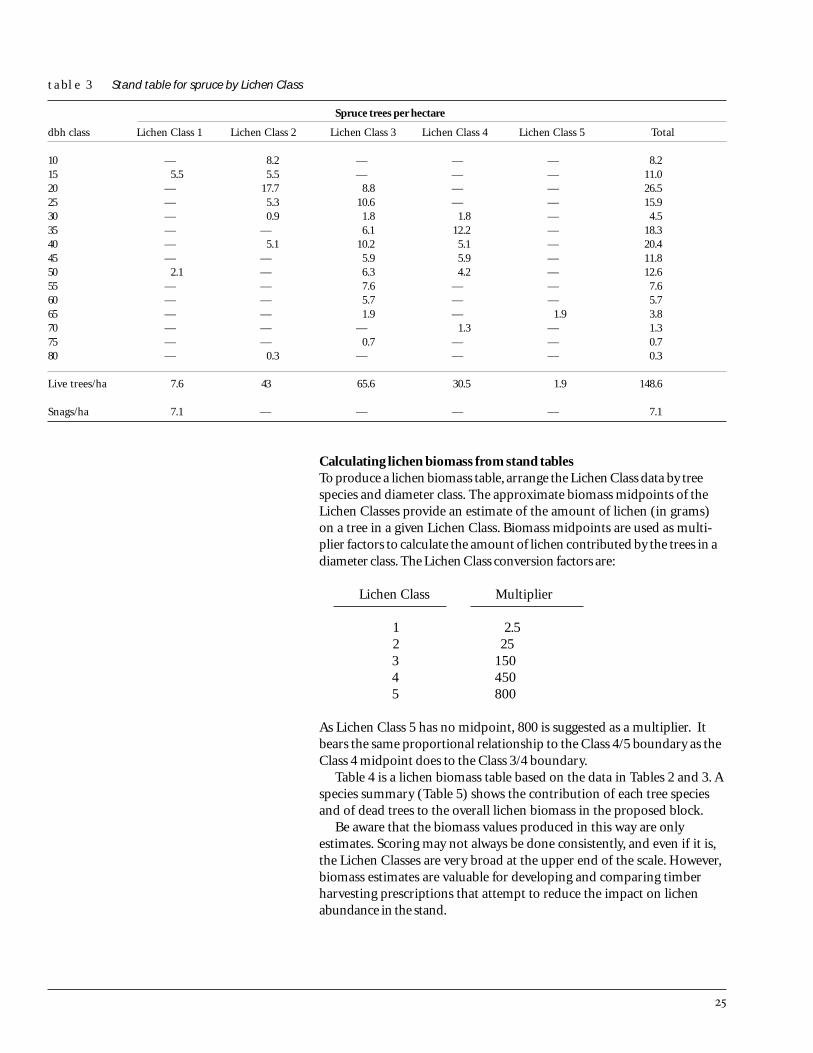
table 3 Stand table for spruce by Lichen Class
Spruce trees per hectare
dbh class Lichen Class 1 Lichen Class 2 Lichen Class 3 Lichen Class 4 Lichen Class 5 Total
10 — 8.2 — — — 8.215 5.5 5.5 — — — 11.020 — 17.7 8.8 — — 26.525 — 5.3 10.6 — — 15.930 — 0.9 1.8 1.8 — 4.535 — — 6.1 12.2 — 18.340 — 5.1 10.2 5.1 — 20.445 — — 5.9 5.9 — 11.850 2.1 — 6.3 4.2 — 12.655 — — 7.6 — — 7.660 — — 5.7 — — 5.765 — — 1.9 — 1.9 3.870 — — — 1.3 — 1.375 — — 0.7 — — 0.780 — 0.3 — — — 0.3
Live trees/ha 7.6 43 65.6 30.5 1.9 148.6
Snags/ha 7.1 — — — — 7.1
Calculating lichen biomass from stand tablesTo produce a lichen biomass table, arrange the Lichen Class data by treespecies and diameter class. The approximate biomass midpoints of theLichen Classes provide an estimate of the amount of lichen (in grams)on a tree in a given Lichen Class. Biomass midpoints are used as multi-plier factors to calculate the amount of lichen contributed by the trees in adiameter class. The Lichen Class conversion factors are:
Lichen Class Multiplier
1 2.52 253 1504 4505 800
As Lichen Class 5 has no midpoint, 800 is suggested as a multiplier. Itbears the same proportional relationship to the Class 4/5 boundary as theClass 4 midpoint does to the Class 3/4 boundary.
Table 4 is a lichen biomass table based on the data in Tables 2 and 3. Aspecies summary (Table 5) shows the contribution of each tree speciesand of dead trees to the overall lichen biomass in the proposed block.
Be aware that the biomass values produced in this way are onlyestimates. Scoring may not always be done consistently, and even if it is,the Lichen Classes are very broad at the upper end of the scale. However,biomass estimates are valuable for developing and comparing timberharvesting prescriptions that attempt to reduce the impact on lichenabundance in the stand.

table 4 Lichen biomass summary for subalpine fir (B) and spruce (S) based on Tables 2 and 3
Lichen Class 1 Lichen Class 2 Lichen Class 3 Lichen Class 4 Lichen Class 5 All Lichen Classesdbh B S Total Total B S Total Total B S Total Total B S Total Total B S Total Total Total Totalclass s/ha* s/ha* s/ha* g/ha s/ha* s/ha* s/ha* g/ha s/ha* s/ha* s/ha* g/ha s/ha* s/ha* s/ha* g/ha s/ha* s/ha* s/ha* g/ha g/ha s/ha*
10 49.5 0.0 49.5 123.8 70.1 8.2 78.3 1,957.5 20.9 0.0 20.9 3,135.0 0.0 0.0 0.0 0.0 0.0 0.0 0.0 0.0 5,216.3 148.7
15 5.1 5.5 10.6 26.5 30.4 5.5 35.9 897.5 60.8 0.0 60.8 9,120.0 5.1 0.0 5.1 2,295.0 0.0 0.0 0.0 0.0 12,339.0 112.4
20 0.0 0.0 0.0 0.0 10.3 17.7 28.0 700.0 61.6 8.8 70.4 10,560.0 10.3 0.0 10.3 4,635.0 0.0 0.0 0.0 0.0 15,895.0 108.7
25 0.0 0.0 0.0 0.0 5.9 5.3 11.2 280.0 26.6 10.6 37.2 5,580.0 14.8 0.0 14.8 6,660.0 3.0 0.0 3.0 2,400.0 14,920.0 66.2
30 0.0 0.0 0.0 0.0 0.0 0.9 0.9 22.5 37.4 1.8 39.2 5,880.0 9.4 1.8 11.2 5,040.0 0.0 0.0 0.0 0.0 10,942.5 51.3
35 0.0 0.0 0.0 0.0 5.5 0.0 5.5 137.5 13.8 6.1 19.9 2,985.0 8.3 12.2 20.5 9,225.0 2.0 0.0 2.0 1,600.0 13,947.5 47.9
40 0.0 0.0 0.0 0.0 0.0 5.1 5.1 127.5 10.0 10.2 20.2 3,030.0 20.0 5.1 25.1 11,295.0 0.0 0.0 0.0 0.0 14,452.5 50.4
45 0.0 0.0 0.0 0.0 0.0 0.0 0.0 0.0 16.3 5.9 22.2 3,330.0 8.1 5.9 14.0 6,300.0 0.0 0.0 0.0 0.0 9,630.0 36.2
50 2.5 2.1 4.6 11.5 0.0 0.0 0.0 0.0 0.0 6.3 6.3 945.0 10.1 4.2 14.3 6,435.0 0.0 0.0 0.0 0.0 7,391.5 25.2
55 0.0 0.0 0.0 0.0 1.5 0.0 1.5 37.5 3.0 7.6 10.6 1,590.0 3.0 0.0 3.0 1,350.0 0.0 0.0 0.0 0.0 2,977.5 15.1
60 0.0 0.0 0.0 0.0 0.0 0.0 0.0 0.0 1.1 5.7 6.8 1,020.0 0.0 0.0 0.0 0.0 0.0 0.0 0.0 0.0 1,020.0 6.8
65 0.0 0.0 0.0 0.0 0.0 0.0 0.0 0.0 2.0 1.9 3.9 585.0 0.0 0.0 0.0 0.0 0.0 1.9 1.9 1,520.0 2,105.0 5.8
70 0.0 0.0 0.0 0.0 0.0 0.0 0.0 0.0 0.0 0.0 0.0 0.0 0.0 1.3 1.3 585.0 0.0 0.0 0.0 0.0 585.0 1.3
75 0.0 0.0 0.0 0.0 0.0 0.0 0.0 0.0 0.0 0.7 0.7 105.0 0.0 0.0 0.0 0.0 0.0 0.0 0.0 0.0 105.0 0.7
80 0.0 0.0 0.0 0.0 0.0 0.3 0.3 7.5 0.0 0.0 0.0 0.0 0.0 0.0 0.0 0.0 0.0 0.0 0.0 0.0 7.5 0.3
Total 57.1 7.6 64.7 161.8 123.7 43.0 166.7 4,167.5 253.5 65.6 319.1 47,865.0 89.1 30.5 119.6 53,820.0 5.0 1.9 6.9 5,520.0 111,534.3 677.0
* stems/ha
Lichen Class Multiplier
1 2.52 253 1504 4505 800
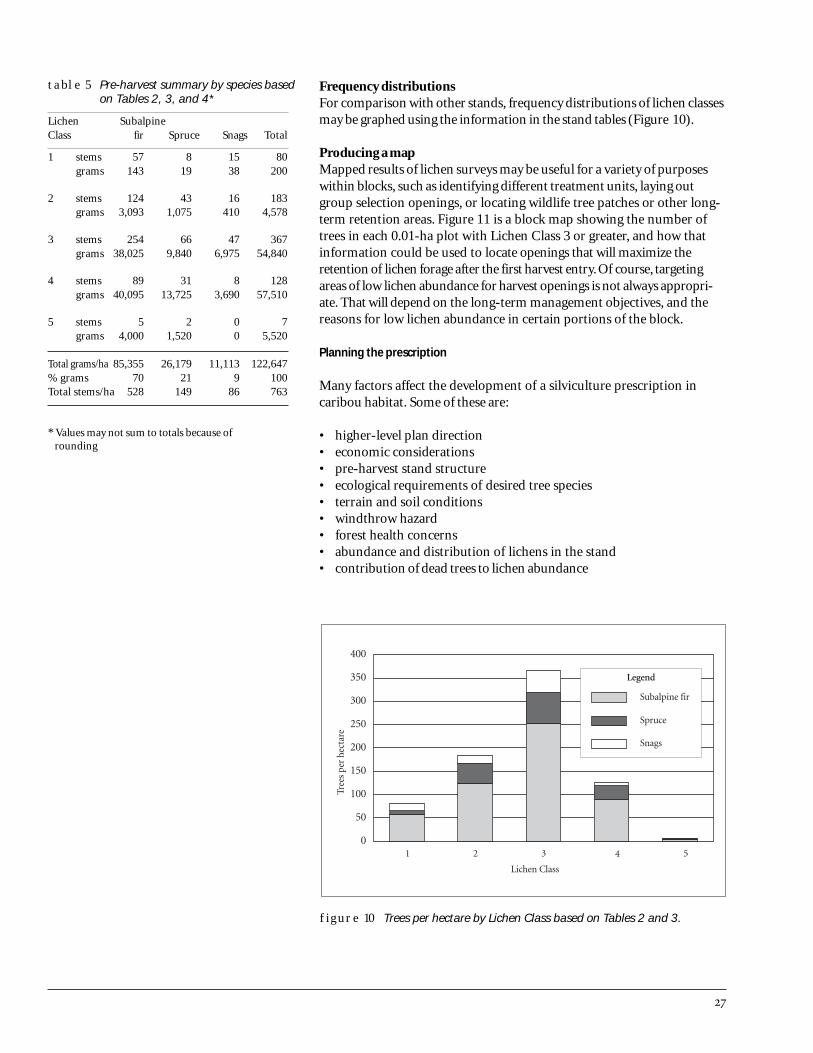
Frequency distributionsFor comparison with other stands, frequency distributions of lichen classesmay be graphed using the information in the stand tables (Figure 10).
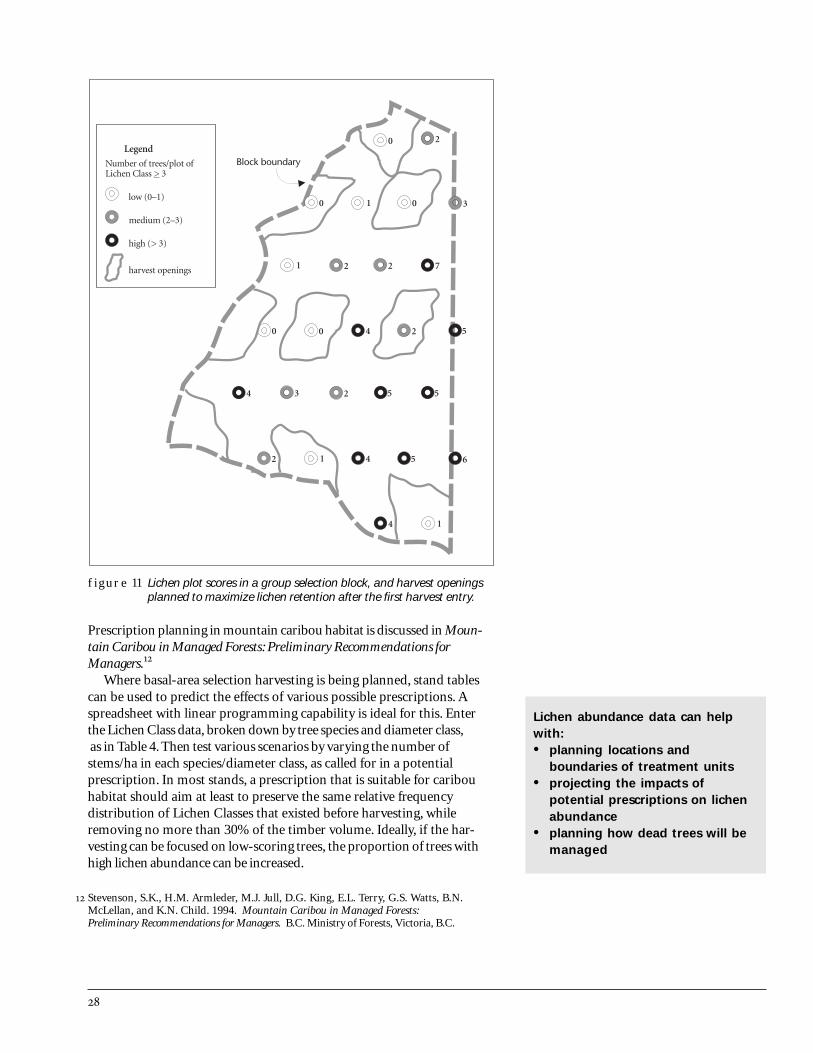
Producing a mapMapped results of lichen surveys may be useful for a variety of purposeswithin blocks, such as identifying different treatment units, laying outgroup selection openings, or locating wildlife tree patches or other long-term retention areas. Figure 11 is a block map showing the number oftrees in each 0.01-ha plot with Lichen Class 3 or greater, and how thatinformation could be used to locate openings that will maximize theretention of lichen forage after the first harvest entry. Of course, targetingareas of low lichen abundance for harvest openings is not always appropri-ate. That will depend on the long-term management objectives, and thereasons for low lichen abundance in certain portions of the block.
Planning the prescription
Many factors affect the development of a silviculture prescription incaribou habitat. Some of these are:
• higher-level plan direction• economic considerations• pre-harvest stand structure• ecological requirements of desired tree species• terrain and soil conditions• windthrow hazard• forest health concerns• abundance and distribution of lichens in the stand• contribution of dead trees to lichen abundance
table 5 Pre-harvest summary by species basedon Tables 2, 3, and 4*
Lichen SubalpineClass fir Spruce Snags Total
1 stems 57 8 15 80grams 143 19 38 200
2 stems 124 43 16 183grams 3,093 1,075 410 4,578
3 stems 254 66 47 367grams 38,025 9,840 6,975 54,840
4 stems 89 31 8 128grams 40,095 13,725 3,690 57,510
5 stems 5 2 0 7grams 4,000 1,520 0 5,520
Total grams/ha 85,355 26,179 11,113 122,647% grams 70 21 9 100Total stems/ha 528 149 86 763
figure 10 Trees per hectare by Lichen Class based on Tables 2 and 3.
* Values may not sum to totals because of rounding
Prescription planning in mountain caribou habitat is discussed in Moun-tain Caribou in Managed Forests: Preliminary Recommendations forManagers.
Where basal-area selection harvesting is being planned, stand tablescan be used to predict the effects of various possible prescriptions. Aspreadsheet with linear programming capability is ideal for this. Enterthe Lichen Class data, broken down by tree species and diameter class, as in Table 4. Then test various scenarios by varying the number ofstems/ha in each species/diameter class, as called for in a potentialprescription. In most stands, a prescription that is suitable for caribouhabitat should aim at least to preserve the same relative frequencydistribution of Lichen Classes that existed before harvesting, whileremoving no more than 30% of the timber volume. Ideally, if the har-vesting can be focused on low-scoring trees, the proportion of trees withhigh lichen abundance can be increased.
figure 11 Lichen plot scores in a group selection block, and harvest openingsplanned to maximize lichen retention after the first harvest entry.
Lichen abundance data can helpwith:• planning locations and
boundaries of treatment units• projecting the impacts of
potential prescriptions on lichenabundance
• planning how dead trees will bemanaged
Stevenson, S.K., H.M. Armleder, M.J. Jull, D.G. King, E.L. Terry, G.S. Watts, B.N.McLellan, and K.N. Child. 1994. Mountain Caribou in Managed Forests:Preliminary Recommendations for Managers. B.C. Ministry of Forests, Victoria, B.C.
Lichen Class Multiplier
1 2.52 253 1504 4505 800
table 6 Lichen biomass summary table for a single-tree selection prescription for subalpine fir (B) and spruce (S), based on Tables 2 and 3
Lichen Class 1 Lichen Class 2 Lichen Class 3 Lichen Class 4 Lichen Class 5 All Lichen Classesdbh B S total total B S total total B S total total B S total total B S total total total totalclass s/ha* s/ha* s/ha* g/ha s/ha* s/ha* s/ha* g/ha s/ha* s/ha* s/ha* g/ha s/ha* s/ha* s/ha* g/ha s/ha* s/ha* s/ha* g/ha g/ha s/ha*
10 49.5 0.0 49.5 123.8 70.1 8.2 78.3 1,957.5 20.9 0.0 20.9 3,135.0 0.0 0.0 0.0 0.0 0.0 0.0 0.0 0.0 5,216.3 148.7
15 5.1 5.5 10.6 26.5 30.4 5.5 35.9 897.5 60.8 0.0 60.8 9,120.0 5.1 0.0 5.1 2,295.0 0.0 0.0 0.0 0.0 12,339.0 112.4
20 0.0 0.0 0.0 0.0 6.9 11.8 18.7 467.5 41.2 5.9 47.1 7,065.0 6.9 0.0 6.9 3,105.0 0.0 0.0 0.0 0.0 10,637.5 72.7
25 0.0 0.0 0.0 0.0 5.0 4.5 9.5 237.5 22.6 9.0 31.6 4,740.0 12.6 0.0 12.6 5,670.0 2.5 0.0 2.5 2,000.0 12,647.5 56.2
30 0.0 0.0 0.0 0.0 0.0 0.8 0.8 20.0 21.6 1.5 23.1 3,465.0 7.9 1.5 9.4 4,230.0 0.0 0.0 0.0 0.0 7,715.0 33.3
35 0.0 0.0 0.0 0.0 3.8 0.0 3.8 95.0 9.5 4.2 13.7 2,055.0 5.7 8.4 14.1 6,345.0 1.4 0.0 1.4 1,120.0 9,615.0 33.0
40 0.0 0.0 0.0 0.0 0.0 2.6 2.6 65.0 5.0 5.2 10.2 1,530.0 10.1 2.6 12.7 5,715.0 0.0 0.0 0.0 0.0 7,310.0 25.5
45 0.0 0.0 0.0 0.0 0.0 0.0 0.0 0.0 8.6 3.2 11.8 1,770.0 4.3 3.2 7.5 3,375.0 0.0 0.0 0.0 0.0 5,145.0 19.3
50 1.5 1.3 2.8 7.0 0.0 0.0 0.0 0.0 0.0 3.8 3.8 570.0 6.1 2.5 8.6 3,870.0 0.0 0.0 0.0 0.0 4,447.0 15.2
55 0.0 0.0 0.0 0.0 1.5 0.0 1.5 37.5 3.0 7.6 10.6 1,590.0 3.0 0.0 3.0 1,350.0 0.0 0.0 0.0 0.0 2,977.5 15.1
60 0.0 0.0 0.0 0.0 0.0 0.0 0.0 0.0 1.1 5.7 6.8 1,020.0 0.0 0.0 0.0 0.0 0.0 0.0 0.0 0.0 1,020.0 6.8
65 0.0 0.0 0.0 0.0 0.0 0.0 0.0 0.0 2.0 1.9 3.9 585.0 0.0 0.0 0.0 0.0 0.0 1.9 1.9 1,520.0 2,105.0 5.8
70 0.0 0.0 0.0 0.0 0.0 0.0 0.0 0.0 0.0 0.0 0.0 0.0 0.0 1.3 1.3 585.0 0.0 0.0 0.0 0.0 85.0 1.3
75 0.0 0.0 0.0 0.0 0.0 0.0 0.0 0.0 0.0 0.7 0.7 105.0 0.0 0.0 0.0 0.0 0.0 0.0 0.0 0.0 105.0 0.7
80 0.0 0.0 0.0 0.0 0.0 0.3 0.3 7.5 0.0 0.0 0.0 0.0 0.0 0.0 0.0 0.0 0.0 0.0 0.0 0.0 7.5 0.3
Total 56.1 6.8 62.9 157.3 117.7 33.7 151.4 3,785.0 196.3 48.7 245.0 36,750.0 61.7 19.5 81.2 36,540.0 3.9 1.9 5.8 4,640.0 81,872.3 546.3
* stems/ha
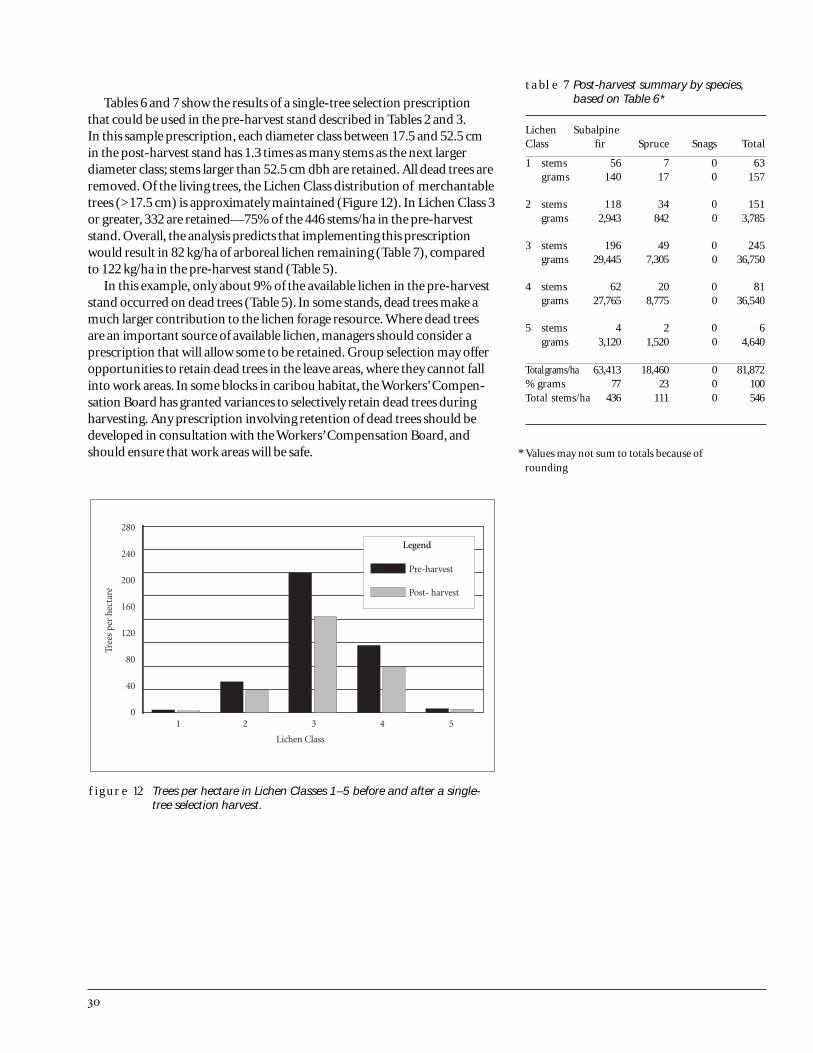
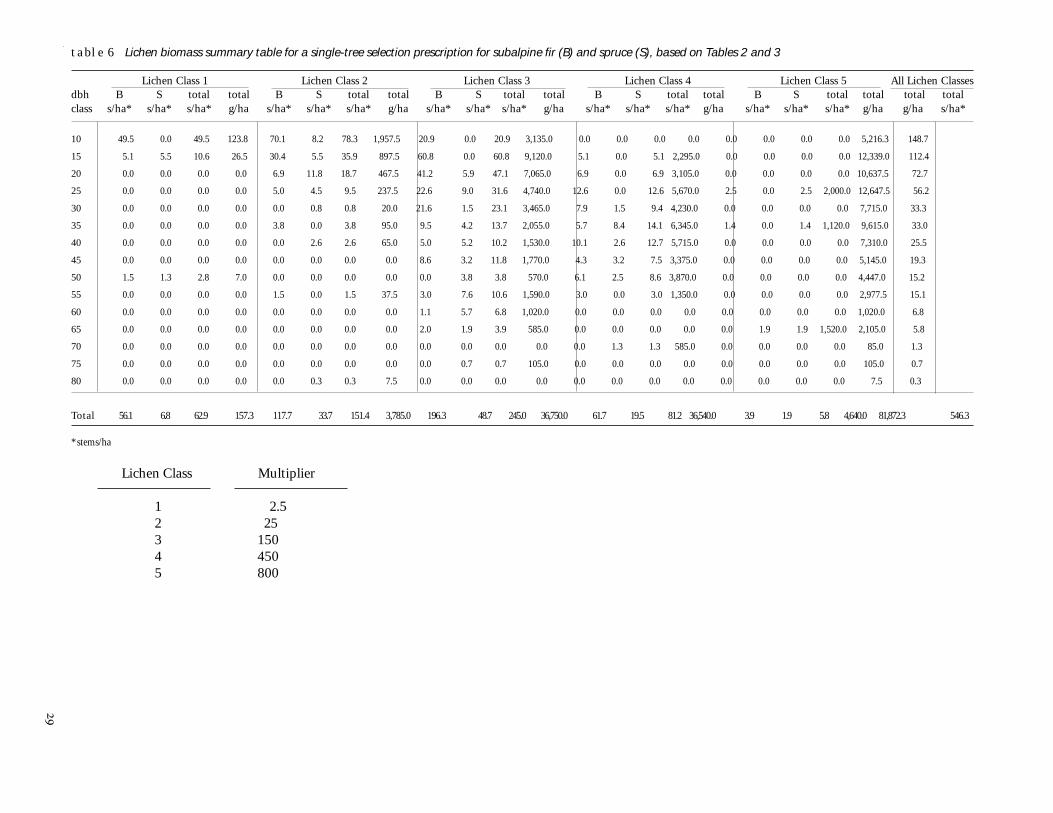
Tables 6 and 7 show the results of a single-tree selection prescriptionthat could be used in the pre-harvest stand described in Tables 2 and 3.In this sample prescription, each diameter class between 17.5 and 52.5 cmin the post-harvest stand has 1.3 times as many stems as the next largerdiameter class; stems larger than 52.5 cm dbh are retained. All dead trees areremoved. Of the living trees, the Lichen Class distribution of merchantabletrees (>17.5 cm) is approximately maintained (Figure 12). In Lichen Class 3or greater, 332 are retained—75% of the 446 stems/ha in the pre-harveststand. Overall, the analysis predicts that implementing this prescriptionwould result in 82 kg/ha of arboreal lichen remaining (Table 7), comparedto 122 kg/ha in the pre-harvest stand (Table 5).
In this example, only about 9% of the available lichen in the pre-harveststand occurred on dead trees (Table 5). In some stands, dead trees make amuch larger contribution to the lichen forage resource. Where dead treesare an important source of available lichen, managers should consider aprescription that will allow some to be retained. Group selection may offeropportunities to retain dead trees in the leave areas, where they cannot fallinto work areas. In some blocks in caribou habitat, the Workers’ Compen-sation Board has granted variances to selectively retain dead trees duringharvesting. Any prescription involving retention of dead trees should bedeveloped in consultation with the Workers’ Compensation Board, andshould ensure that work areas will be safe.
table 7 Post-harvest summary by species,based on Table 6*
Lichen SubalpineClass fir Spruce Snags Total
1 stems 56 7 0 63grams 140 17 0 157
2 stems 118 34 0 151grams 2,943 842 0 3,785
3 stems 196 49 0 245grams 29,445 7,305 0 36,750
4 stems 62 20 0 81grams 27,765 8,775 0 36,540
5 stems 4 2 0 6grams 3,120 1,520 0 4,640
Total grams/ha 63,413 18,460 0 81,872% grams 77 23 0 100Total stems/ha 436 111 0 546
figure 12 Trees per hectare in Lichen Classes 1–5 before and after a single-tree selection harvest.
* Values may not sum to totals because of rounding

7 USING THE FIELD GUIDE TO IMPROVE ADAPTIVE MANAGEMENT
What is adaptive management?
Adaptive management is a structured process for learning from theresults of operational activities so that future management can be im-proved. There is much to be learned about the potential of uneven-agedsilviculture systems to maintain caribou habitat. Monitoring the results ofmanagement trials is an important part of the learning process.
Contributing to the knowledge base on lichen abundance
The recommendations in this manual are based on analysis of only a fewdatasets. A larger database would serve two important functions:
• It would provide the basis for more complete recommendations abouthow to use the lichen abundance Field Guide as a tool.
• It would improve knowledge of the abundance and distributionpatterns of arboreal lichens in caribou habitat.
Monitoring the effects of selection harvesting on lichen abundance
The Field Guide can be used as a monitoring tool as well as a planningtool. Assessments based on the Field Guide can be expected to detect onlyrelatively large changes in lichen abundance. Changes that result fromdamage to trees during logging, or wind-scouring of trees after logging,should be detectable. Changes that result from faster or slower growthrates after logging would probably not be detectable, at least not for a longtime.
To monitor lichen abundance in operational situations, carry out pre-harvest lichen assessments as usual. Permanently mark the plot ortransect locations and the assessed trees so they can be relocated. Ifpossible, mark and assess trees in an adjacent control area that will notbe harvested. Wait at least a year after harvest to re-assess the trees.
Data resulting from lichen reassessment may be used to determinethe effects of the harvesting on abundance in each Lichen Class. Statisti-cal methods as described in Section 5 may be used to determine whetherthe prescription succeeded in maintaining the pre-harvest frequencydistribution of lichen scores. If it did, statistical analysis should show nosignificant difference between frequency distributions before and afterharvesting.
It is also important to assess the impact of the harvesting on overalllichen abundance. A simple way to do this is to compare the number oftrees per hectare pre-and post-harvest in Lichen Classes > 3. This type ofinformation will help managers to know what relative change in lichenabundance to expect from various harvesting prescriptions. To express thechange in absolute terms, lichen scores may be converted to biomassequivalents (Section 6) and plot totals calculated. It is also possible to trackthe fate of the lichens in a harvested block by identifying the sources of the
Users can help improveadaptive management incaribou habitat bycontributing their data to acentral registry, and bymonitoring lichen abundancein selection harvesting blocks.
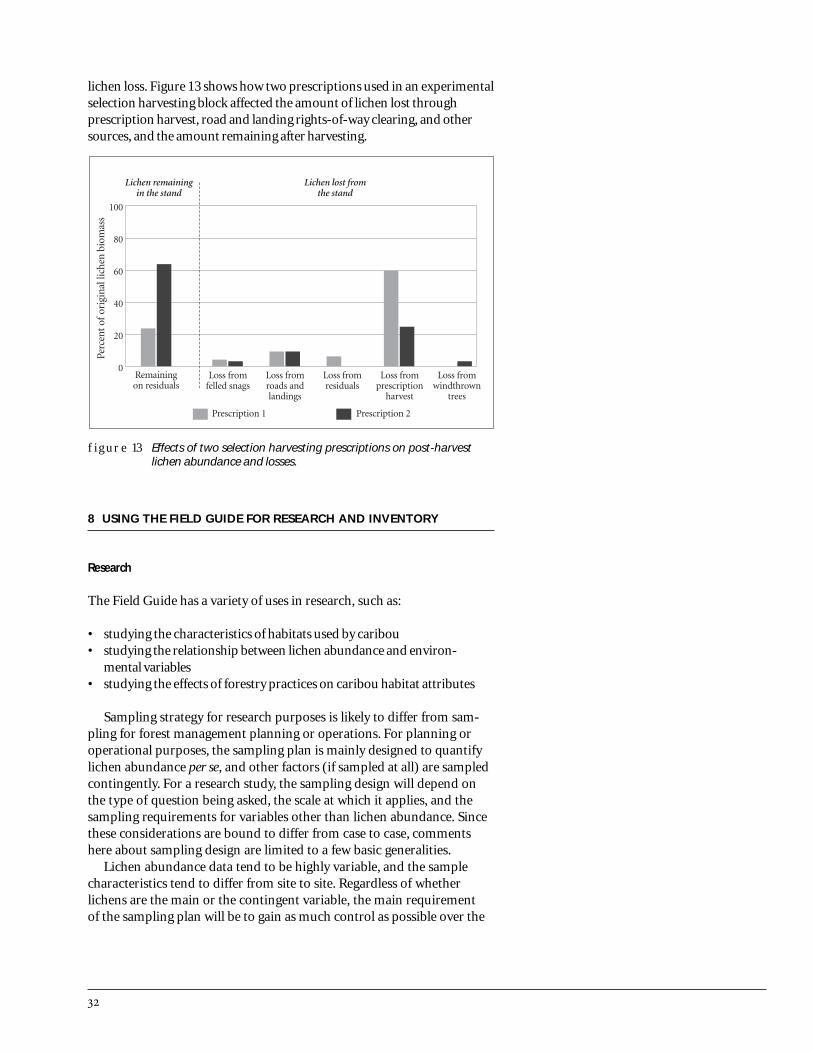
lichen loss. Figure 13 shows how two prescriptions used in an experimentalselection harvesting block affected the amount of lichen lost throughprescription harvest, road and landing rights-of-way clearing, and othersources, and the amount remaining after harvesting.
8 USING THE FIELD GUIDE FOR RESEARCH AND INVENTORY
Research
The Field Guide has a variety of uses in research, such as:
• studying the characteristics of habitats used by caribou• studying the relationship between lichen abundance and environ-
mental variables• studying the effects of forestry practices on caribou habitat attributes
Sampling strategy for research purposes is likely to differ from sam-pling for forest management planning or operations. For planning oroperational purposes, the sampling plan is mainly designed to quantifylichen abundance per se, and other factors (if sampled at all) are sampledcontingently. For a research study, the sampling design will depend onthe type of question being asked, the scale at which it applies, and thesampling requirements for variables other than lichen abundance. Sincethese considerations are bound to differ from case to case, commentshere about sampling design are limited to a few basic generalities.
Lichen abundance data tend to be highly variable, and the samplecharacteristics tend to differ from site to site. Regardless of whetherlichens are the main or the contingent variable, the main requirementof the sampling plan will be to gain as much control as possible over the
figure 13 Effects of two selection harvesting prescriptions on post-harvestlichen abundance and losses.

sources of this variation at the site in question. When each site differs, useof a “standard sampling plan” with a pre-ordained layout, sample size, andsampling method (transect or plot) is unlikely to achieve this.
Existing datasets have shown that much of the sample variation at anyparticular site is related to differences in spatial scale. Even when the sitein general is rich in lichens, abundance often varies greatly at a local level.Differences from tree to tree within a single plot may be as large as betweenneighbouring plots, and not much less than the variation over the site as awhole.
Thus, if the study is to include broad-scale factors such as elevation orforest cover type, a total sample well in excess of 150 trees may berequired if the role of these factors is to be detectable among local effects.The same may be true for the converse aim of detecting local effects (e.g.,site class or light regime) if the sample has to be spread over a wide areato obtain enough trees in each category of interest.
At sites that are poor in lichens, on the other hand, plots tend to bemore internally homogeneous, neighbouring plots more often resembleone another, and most of the variation is at a broader scale. Thus, fewersample trees or plots may be needed per unit area; the more importantfactor will be their dispersion. Therefore, whenever practicable, a pilotsurvey of the site is advisable (see Section 5), to gauge the level of varia-tion at different spatial scales before deciding how to distribute thesample among them.
If a reconnaissance confirms that the site is highly variable, stratifyingthe sample by tree types or classes may also help to reduce extraneousvariation, provided that good strata can be defined. This is an importantqualification, since strata that are mismatched to actual sources ofvariation will yield less efficient estimates than a simple random sample.From datasets that have been examined so far, few good stratificationcriteria have emerged. Some of the more consistent ones are:
• tree species• wildlife tree class• tree size (dbh class)• age class (tree or stand)
Differences in such variables as tree characteristics within plots oftenaccount for much of the variation among plots. If sampling strata cannotbe identified beforehand, post-stratification by these factors may befeasible, provided the resulting strata are not too small and the variationwithin them is less than the variation among them.13
To compile the data for analysis, the same basic steps described inSections 4 and 5 apply. However, analyzing the data for research pur-poses is likely to extend beyond comparing sites or parts of sites, andthe analytical methods will be more complex. To control for the multi-dimensional variation in lichen scores, log-linear modelling may be themethod of choice, and for comparing lichen scores with external vari-ables, logistic regression will be appropriate.
13 See: Yates, F. 1981. Sampling methods for censuses and surveys. Griffin, London, U.K.;or Cochran, W.G. 1977. Sampling Techniques. Wiley, New York, N.Y.

Inventory
The Field Guide methods have been incorporated into the vegetationinventory proceduresof the Resources Inventory Committee. If lichensare routinely included in surveys where caribou are known or suspectedto occur, a large body of data may eventually result. This will increaseknowledge of lichen abundance and distribution in more caribou rangesthan at present.
9 CONCLUSION
Since the late 1980s, forest managers and researchers have been experi-menting with timber harvesting methods that will better maintainarboreal lichens in mountain caribou habitat. Developing forestrypractices that will allow timber harvesting and also maintain habitat forcaribou is a large-scale and long-term undertaking. To a great extent, itssuccess will depend on the willingness of managers to apply the princi-ples of adaptive management. These include recognizing the present lackof knowledge about the effectiveness of various forestry practices inmaintaining caribou habitat, deliberately designing experiments to testnew practices, and using the results to modify management practicesthereafter.
Using lichen abundance data for planning and monitoring purposesin caribou habitat areas is one way that managers can contribute to theprocess. The Field Guide for assessing lichen abundance was publishedfor that purpose. It has been widely adopted, but users have experiencedsome frustration in trying to apply the assessments described in it.Although there are many unknowns still to be overcome, this handbookis an important step in making the Field Guide a more useful tool forassessing lichen abundance.
Vegetation Inventory Working Group. 1997. Vegetation resources inventoryground sampling procedures. B.C. Ministry of Forests, Resources InventoryBranch. Victoria, B.C. Draft, March 31, 1997.

Organization:
Address:
Contact person:
Telephone: Fax: E-mail:
Name and location of project area
NTS: UTM:
Biogeoclimatic subzone(s):
Purpose of project:
reconnaissance (caribou habitat)
cutblock planning (caribou habitat)
cutblock monitoring
research Specify:
inventory Specify:
other Specify:
Area sampled (e.g., three 40- to 60-ha blocks; 5,000-ha watershed):
Brief description of sampling scheme (e.g., prism plots systematically located in each of two strata):
Total number of plots or transects:
Year(s) and season(s) of sampling:
Assessor’s previous experience with lichen Field Guide:
no previous lichen surveys – previous lichen surveys or more previous lichen surveys
Did you collect data on the types of lichens present? yes no
Data format:
field cards
electronic spreadsheet Specify type:
electronic database Specify type:
cruise compilation
other Specify:
If requested, would you release your data to a central database? (Credit will be given if data are used.)
Comments:
Please mail or fax to: Research Wildlife Habitat Ecologist or Wildlife Section HeadMinistry of Forests Ministry of Environment, Lands and ParksCariboo Forest Region Omineca-Peace Region200 - 640 Borland Street 1011 Fourth AvenueWilliams Lake, BC V2G 4T1 Prince George, BC V2L 3H9Fax: (250) 398-4406 Fax: (250) 565-6629
DATA REGISTRATION FORM


