MinEx Consulting Strategic advice on mineral economics & exploration
- Gloom or Boom ?
Richard SchoddeManaging Director, MinEx Consulting
Adjunct Professor, University of Western Australia
Geological Society of South AfricaGeoForum 2013 Conference2nd – 5th July 2013, Johannesburg

MinEx Consulting Strategic advice on mineral economics & exploration
Overview: Gloom or Boom?
1. Trends in global exploration spendForecast future spend out to 2020 & financing issues for Junior Companies
2. Trends in discovery ratesWhere were the discoveries made? Current “Hot Spots” for exploration
3. Trends in discovery performanceWhich Regions did better? Factors impacting on discovery performance
4. Trends in the types of exploration methods usedGeophysics versus geochemistry versus “nearology”
5. Trends in discovery costsUnit discovery costs ($/oz, c/lb) are rising
6. Are we finding enough metal?To be sustainable we need to find enough to replace what we mine
7. Conclusions
2
MinEx Consulting Strategic advice on mineral economics & exploration
Exploration expenditures reached an all-time high in 2012
3

MinEx Consulting Strategic advice on mineral economics & exploration
Exploration expenditures: Worldby Commodity : 1975-2012
$0
$5
$10
$15
$20
$25
$30
1975 1980 1985 1990 1995 2000 2005 2010
Other Bulk
Coal
Iron Ore
Other
Diamonds
Uranium
Base Metals
Gold
4
2012 US$ billion
Sources: MinEx Consulting estimates © April 2013, based ondata from ABS, NRCan, MLR (China), OECD and MEG SNL
$29.4Bin 2012
$2.9Bin 2002
$7.9Bin 1997
Spend is at anall-time high
Spend is at anall-time high
10x real increasein the last decade

MinEx Consulting Strategic advice on mineral economics & exploration
Exploration expenditures: Worldby Commodity : 1975-2012
0%
20%
40%
60%
80%
100%
1975 1980 1985 1990 1995 2000 2005 2010
5
Percentage of total spend
34%
23%
3%2%
13%
14%
11%
1%
Gold continuesto be the main
target
Gold continuesto be the main
target
Other - Bulk
Iron Ore
Coal
Other – Non Bulk
UraniumBase Metals(Cu, Ni, Zn, Pb)
Gold
Diamonds
Major increase inspend on Bulk
Minerals
Major increase inspend on Bulk
Minerals
Sources: MinEx Consulting estimates © April 2013, based ondata from ABS, NRCan, MLR (China), OECD and MEG SNL
MinEx Consulting Strategic advice on mineral economics & exploration
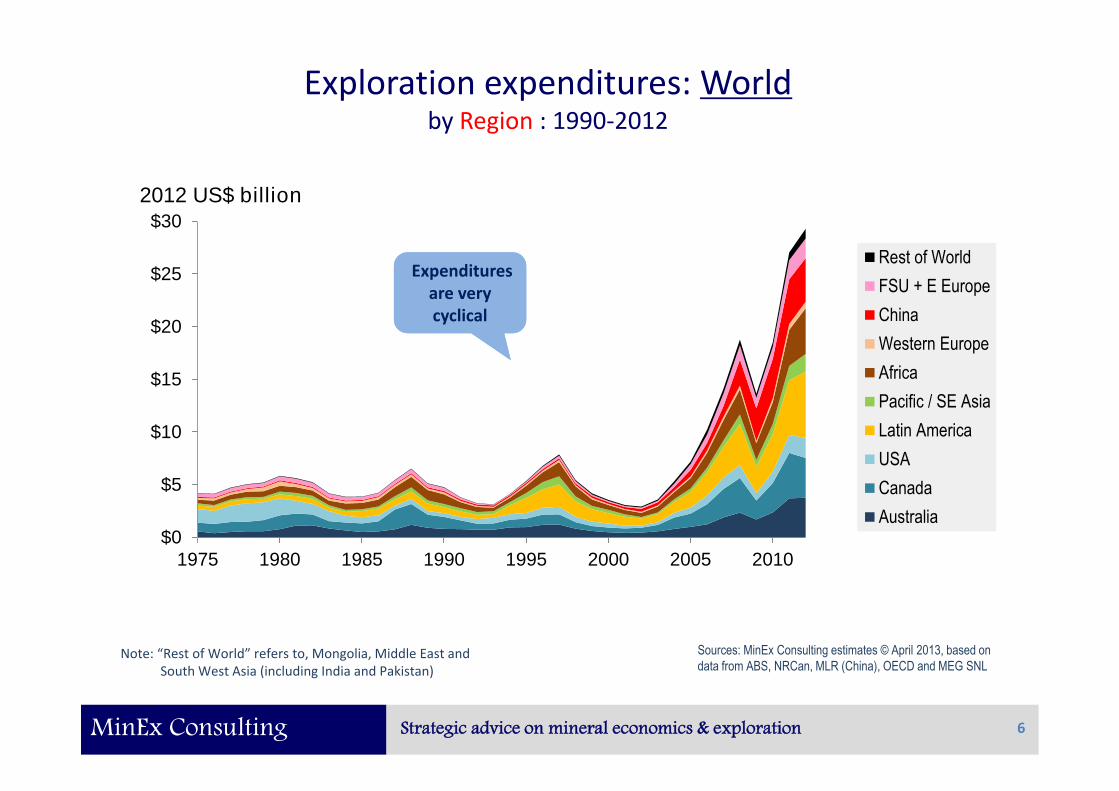
Exploration expenditures: Worldby Region : 1990-2012
$0
$5
$10
$15
$20
$25
$30
1975 1980 1985 1990 1995 2000 2005 2010
Rest of World
FSU + E Europe
China
Western Europe
Africa
Pacific / SE Asia
Latin America
USA
Canada
Australia
6
2012 US$ billion
Expendituresare verycyclical
Expendituresare verycyclical
Note: “Rest of World” refers to, Mongolia, Middle East andSouth West Asia (including India and Pakistan)
Sources: MinEx Consulting estimates © April 2013, based ondata from ABS, NRCan, MLR (China), OECD and MEG SNL

MinEx Consulting Strategic advice on mineral economics & exploration
Exploration expenditures: Worldby Region : 1990-2012
0%
20%
40%
60%
80%
100%
1975 1980 1985 1990 1995 2000 2005 2010
Rest of World
FSU + E Europe
China
Western Europe
Africa
Pacific / SE Asia
Latin America
USA
Canada
Australia
7
Note: “Rest of World” refers to, Mongolia, Middle East andSouth West Asia (including India and Pakistan)
Percentage of total spend
13%
13%
7%
21%
6%
15%
2%
14%
6%
3%
China spends moreon exploration thanany other country in
the World
China spends moreon exploration thanany other country in
the World
Can+USA+Ausmarket share has
halved in the last 2decades
Can+USA+Ausmarket share has
halved in the last 2decades
Sources: MinEx Consulting estimates © April 2013, based ondata from ABS, NRCan, MLR (China), OECD and MEG SNL

MinEx Consulting Strategic advice on mineral economics & exploration
Exploration spend is closely linked to commodity pricesWorld gold exploration expenditures versus gold price
$0
$400
$800
$1,200
$1,600
$2,000
$2,400
$0
$2,000
$4,000
$6,000
$8,000
$10,000
$12,000
1975 1980 1985 1990 1995 2000 2005 2010 2015 2020
8
Exploration Expenditures(June 2012 US$m)
Gold Price(June 2012 US$/oz)
Gold Price(RHS>)
ExplorationSpend (<LHS)
Source: MinEx Consulting © July 2013Forecasts from Consensus Economics © June 2013
BrokersForecasts(June 13)
BrokersForecasts(June 13)
Since 1990s there hasbeen a strong correlationbetween Gold Price and
Exploration Spend
Since 1990s there hasbeen a strong correlationbetween Gold Price and
Exploration Spend
See a similar trendfor other metals

MinEx Consulting Strategic advice on mineral economics & exploration
Forecast exploration expenditures: Worldby Commodity : 1975-2020
$0
$5
$10
$15
$20
$25
$30
1975 1980 1985 1990 1995 2000 2005 2010 2015 2020
Other
Coal
Iron Ore
Uranium
Base Metals
Gold
9
2012 US$ billion
Note: Forecast based on a Multiple-Regression analysis of datafrom 1997-2012 with R2 = 0.95
Gold is projected tofall the most
Gold is projected tofall the most
Source: MinEx Consulting estimates © July 2013, based oncommodity price forecasts from Consensus Economics June 2013
$29Bin 2012
$19Bin 2020
Down35%
Spend on uranium isprojected to increaseSpend on uranium isprojected to increase
Forecast

MinEx Consulting Strategic advice on mineral economics & exploration
$0
$5
$10
$15
$20
$25
$30
1975 1980 1985 1990 1995 2000 2005 2010 2015 2020
FSU + EE + ROW
China
Western Europe
Africa
Pacific / SE Asia
Latin America
USA
Canada
Australia
Forecast exploration expenditures: Worldby Region : 1975-2020
10
2012 US$ billion$29B
in 2012
Note: “Rest of World” refers to, Mongolia, Middle East andSouth West Asia (including India and Pakistan)
$19Bin 2020
Down35%
CAUTION:Forecast assumes nochange in Country Riskand tax rules
Source: MinEx Consulting estimates © July 2013, based oncommodity price forecasts from Consensus Economics June 2013

MinEx Consulting Strategic advice on mineral economics & exploration
The Junior sector is facing severe funding problems. This willmost felt in-terms of reduced “money into the ground”
Cash and Expenditures for the MEDIAN Australian Junior company: 1998-2012r
$0
$1
$2
$3
$4
$5
Dec-98 Dec-00 Dec-02 Dec-04 Dec-06 Dec-08 Dec-10 Dec-12
11
June 2012 A$ Million(annualised basis)
Source: MinEx Consulting © February 2013based on Quarterly Reports to the ASX
Note: Expenditure data is reported on a Quarterly basis, but has beenannualised to be comparable with Cash Reserves
Administration Costs
Exploration + Development Costs
Cash Funds atend of Quarter
Large amount of fundsraised in 2006-2007
Large amount of fundsraised in 2006-2007
Funding dried up duringthe GFC. To preserve
cash, Junior Companiesseverely cut back on
expenditures in the field
Funding dried up duringthe GFC. To preserve
cash, Junior Companiesseverely cut back on
expenditures in the field
The 2013 “bust”could be moresevere than the
2008 GFC
The 2013 “bust”could be moresevere than the
2008 GFC
Funding dried up againin 2012. Key problem isthat the starting cash
reserves are low
Funding dried up againin 2012. Key problem isthat the starting cash
reserves are low
Because ofthis …

MinEx Consulting Strategic advice on mineral economics & exploration
Exploration expenditures reached an all-time high in 2012
12

MinEx Consulting Strategic advice on mineral economics & exploration
Number of deposits found each year – by RegionMineral deposits# found in the World: 1975-2012
13
0
20
40
60
80
100
1975 1980 1985 1990 1995 2000 2005 2010
China+FSU+EE+ME
Western Europe
Africa
Pacific / SE Asia
Latin America
USA
Canada
Australia
Number
N = 2161
Source: MinEx Consulting © July 2013
Note: # Discoveries are for deposits >0.1 Moz Au, >5 kt U3O8, >10 kt Ni, >0.1 Mt Cu-equivExcludes satellite deposits within existing CampsExcludes bulk mineral discoveries
Caution:Incomplete data inrecent years
Due to delays in reporting ofdiscoveries, expect the final
number to be 2-3x larger
Due to delays in reporting ofdiscoveries, expect the final
number to be 2-3x larger

MinEx Consulting Strategic advice on mineral economics & exploration
Number of deposits found each year – by RegionMineral deposits# found in the World: 1975-2012
14
0%
20%
40%
60%
80%
100%
1975 1980 1985 1990 1995 2000 2005 2010
China+FSU+EE+ME
Western Europe
Africa
Pacific / SE Asia
Latin America
USA
Canada
Australia
Share of discoveries made
Note: # Discoveries are for deposits >0.1 Moz Au, >5 kt U3O8, >10 kt Ni, >0.1 Mt Cu-equivExcludes satellite deposits within existing CampsExcludes bulk mineral discoveries
Caution:Incomplete data inrecent years
Source: MinEx Consulting © July 2013

MinEx Consulting Strategic advice on mineral economics & exploration
Tier 1, 2 & 3 discoveries in the world: 2002-Present
15
Au BaseMetal
U3O8 Other
Tier 2
Tier 3
Tier 1
Alaska/Yukon NorthernOntario
Latin America
Ten current“Hot Spots”Ten current“Hot Spots”
West AfricaCentral Africa
China
Australia
Far EastRussia
Saskatchewan(Uranium)
SW USA/ Mexico
Source: MinEx Consulting © July 2013

MinEx Consulting Strategic advice on mineral economics & exploration
Spend & performance by Region: 2003-12
Region ExplorationSpend (2012 $b)
Number ofDiscoveries #
Tier 1+2Discoveries
Australia $12 (10%) 83 (16%) 13 (15%)
Canada $22 (18%) 65 (12%) 16 (19%)
USA $9 (8%) 20 (4%) 9 (10%)
Latin America $28 (23%) 118 (23%) 15 (17%)
Pacific / SE Asia $6 (5%) 23 (4%) 2 (3%)
Africa $17 (14%) 116 (22%) 19 (22%)
Western Europe $3 (3%) 22 (4%) 1 (1%)
China+FSU+EE+RoW $22 (19%) 77 (15%) 11 (13%)
----- ------- ------ -------- ------ --------
TOTAL $116 (100%) 524 (100%) 86 (100%)
16
Africaperformed
the best
Africaperformed
the best
Note: # Discoveries are for deposits >0.1 Moz Au, >5 kt U3O8, >10 kt Ni, >0.1 Mt Cu-equivExcludes satellite deposits within existing CampsExcludes bulk mineral discoveries Source: MinEx Consulting © July 2013
MinEx Consulting Strategic advice on mineral economics & exploration
Due to rising input costs and deeper targets It is become more expensiveto make a discovery
17

MinEx Consulting Strategic advice on mineral economics & exploration
Discovery rate versus spendWestern World non-ferrous exploration spend and discoveries
18
$0
$5
$10
$15
$20
0
50
100
150
200
1975 1980 1985 1990 1995 2000 2005 2010
Estimated No of unreported discoveries
Number of Discoveries
Exploration Expenditures
Number of Discoveries
Note: Excludes expenditures and discoveries for Bulk MineralsDiscoveries are for deposits >0.1 Moz Au, >5 kt U3O8, >10 kt Ni, >0.1 Mt Cu-equiv
2012 US$ Billion
Even after adjusting forunreported discoveries , inthe last 5 years a large gap
has opened up betweenexpenditures and number of
deposits found
Even after adjusting forunreported discoveries , inthe last 5 years a large gap
has opened up betweenexpenditures and number of
deposits found
Estimate
… Gap due to higherinput costs (labour,drilling and admin)
Source: MinEx Consulting © July 2013
Between 2002 & 2012 WWspend went up 8x anddiscovery rate up ~3x
Between 2002 & 2012 WWspend went up 8x anddiscovery rate up ~3x
$2.4b
$18.5b

MinEx Consulting Strategic advice on mineral economics & exploration
Input costs for exploration have doubledin the last decade
2000nominal
2000real
2012real
% realincrease
$ of the Day 2012 $ 2012$
Average Diamond Drilling Cost (US$/metre)- Canada- Australia
$84$77
$112$102
$210$229
88%125%
Average salary for an Exploration Manager(US$ per annum)- Canada- Australia
$70,000$75,000
$93,000$100,000
$170,000$250,000
83%150%
Median Administration Cost for a JuniorExploration Company (US$m per annum)- Australia $0.34 $0.44 $1.19 170%
19
Source: MinEx Consulting © July 2013

MinEx Consulting Strategic advice on mineral economics & exploration
Higher costs impact on the amount of drilling doneExploration spend and drilling in Canada and Australia: 1997-2012
-3
2
7
12
$0$1$2$3$4$5$6
1997 2002 2007 2012
20
(2012 US$ Billion)
Data: NRCan, ABS
(million metres)
-3
2
7
12
$0$1$2$3$4$5$6
1997 2002 2007 2012
Canada
Australia
Metres Drilled
Metres Drilled
Exploration Expenditures
Exploration Expenditures
Between 2002-2011,Expenditures rose 8.0x
but drilling only rose 3.9x
Between 2002-2011,Expenditures rose 8.0x
but drilling only rose 3.9x
Between 2002-2012,Expenditures rose 9.3x
but drilling only rose 2.4x
Between 2002-2012,Expenditures rose 9.3x
but drilling only rose 2.4x

MinEx Consulting Strategic advice on mineral economics & exploration
… and we are exploring under deeper coverDepth of cover for Gold and Base Metal discoveries in the World: 1900-2012
0
500
1000
1500
2000
1900 1920 1940 1960 1980 2000 2020
21
Discovery Year
Depth of Cover (Metres)
Note: Excludes satellite deposits within existing CampsExcludes gold deposits in South Africa
It is difficult to finddeposits under deep
cover
It is difficult to finddeposits under deep
cover
… end-result is that wehave to drill more metres
per discovery
… end-result is that wehave to drill more metres
per discovery
Source: MinEx Consulting © July 2013

MinEx Consulting Strategic advice on mineral economics & exploration
Average depth of cover for discoveries - all metalsWestern World: 2003-2012
204
126122
9882
68
3212
74
0
50
100
150
200
250
55
22
AverageLatinAm
Africa(excl Sth Africa) Aust
WEurope Canada USA
PacificSE Asia
Restof WW
Metres
If you exclude SouthAfrica, the average
depth of cover falls from55 to 12 metres
If you exclude SouthAfrica, the average
depth of cover falls from55 to 12 metres
Note: Based on deposits >0.1 Moz Au, >5 kt U3O8, >10 kt Ni, >0.1 Mt Cu-equivExcludes bulk mineral discoveries Source: MinEx Consulting © July 2013

MinEx Consulting Strategic advice on mineral economics & exploration
There have been several innovations in the exploration tools used tomake discoveries
23

MinEx Consulting Strategic advice on mineral economics & exploration
Trends in exploration methods
The preferred search method used varies by commodity type,
depth of cover and “scale”
24
Continental-Scale
Province-Scale
District-Scale
Project-Scale
Prospect-ScaleMinEx has carried out a detailedanalysis of the discovery history of1750 deposits at these two scales
MinEx has carried out a detailedanalysis of the discovery history of1750 deposits at these two scales

MinEx Consulting Strategic advice on mineral economics & exploration
Primary search method used at the project-scaleGOLD discoveries (>0.1 Moz) in the World: 1900-2012
0%
20%
40%
60%
80%
100% Serendipity
Prospector
Other
Visual
Conceptual/Geological
Geological Mapping
Extrapolated from KnownMineralisationGeochem
Geophysics + Geochem
Geophysics
25
Percentage of total discoveries
Note: Analysis based on detailed analysis of 993 gold projects (out of 1779 known discoveries)
ie What method wasused to decide where
to peg the leases
ie What method wasused to decide where
to peg the leases
Source: MinEx Consulting © July 2013
MinEx Consulting Strategic advice on mineral economics & exploration
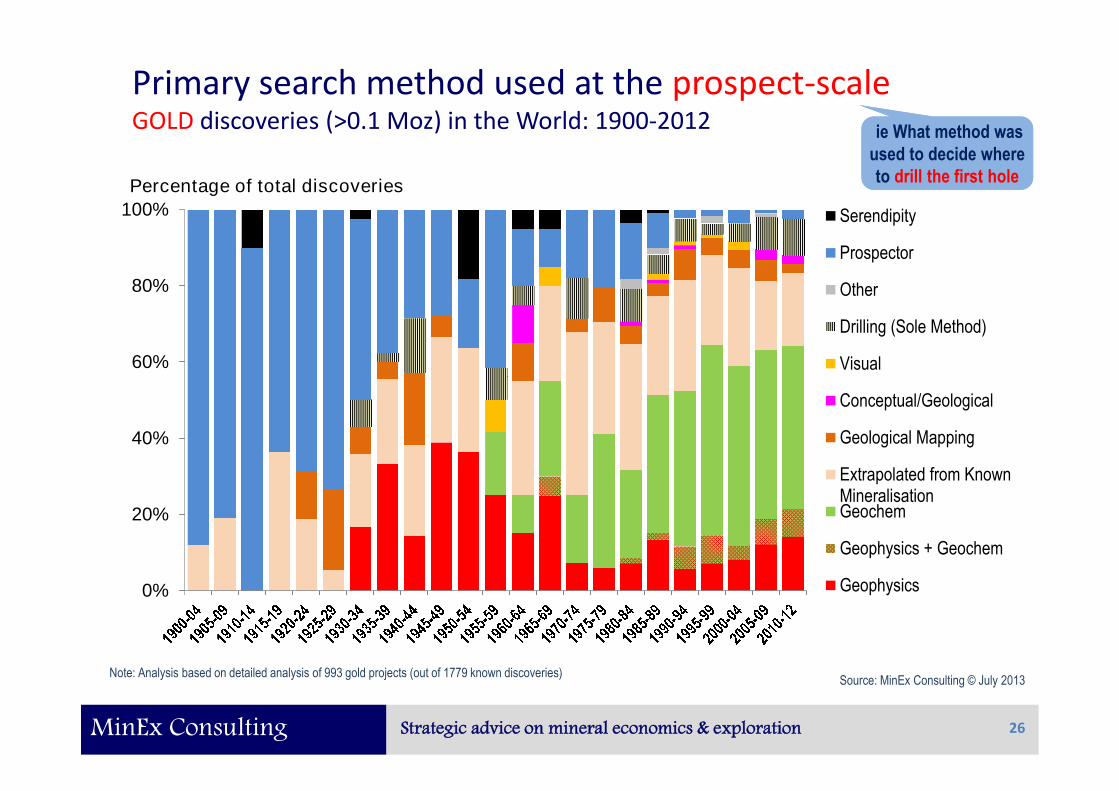
Primary search method used at the prospect-scaleGOLD discoveries (>0.1 Moz) in the World: 1900-2012
0%
20%
40%
60%
80%
100% Serendipity
Prospector
Other
Drilling (Sole Method)
Visual
Conceptual/Geological
Geological Mapping
Extrapolated from KnownMineralisationGeochem
Geophysics + Geochem
Geophysics
26
Percentage of total discoveries
Note: Analysis based on detailed analysis of 993 gold projects (out of 1779 known discoveries)
ie What method wasused to decide whereto drill the first hole
ie What method wasused to decide whereto drill the first hole
Source: MinEx Consulting © July 2013

MinEx Consulting Strategic advice on mineral economics & exploration
Primary search method used at the project-scaleBASE METAL discoveries (>0.1 Mt Cu-eq) in the World: 1900-2012
0%
20%
40%
60%
80%
100% Serendipity
Prospector
Other
Visual
Conceptual/Geological
Geological Mapping
Extrapolated from KnownMineralisationGeochem
Geophysics + Geochem
Geophysics
27
Percentage of total discoveries
Note: Analysis based on detailed analysis of 757 Cu+Ni+Zn+Pb projects (out of 1344 known discoveries)
ie What method wasused to decide where
to peg the leases
ie What method wasused to decide where
to peg the leases
Source: MinEx Consulting © July 2013

MinEx Consulting Strategic advice on mineral economics & exploration
Primary search method used at the prospect-scaleBASE METAL discoveries (>0.1 Mt Cu-eq) in the World: 1900-2012
0%
20%
40%
60%
80%
100% Serendipity
Prospector
Other
Drilling (Sole Method)
Visual
Conceptual/Geological
Geological Mapping
Extrapolated from KnownMineralisationGeochem
Geophysics + Geochem
Geophysics
28
Percentage of total discoveries
Note: Analysis based on detailed analysis of 757 Cu+Ni+Zn+Pb projects (out of 1344 known discoveries)
ie What method wasused to decide whereto drill the first hole
ie What method wasused to decide whereto drill the first hole
Source: MinEx Consulting © July 2013
MinEx Consulting Strategic advice on mineral economics & exploration
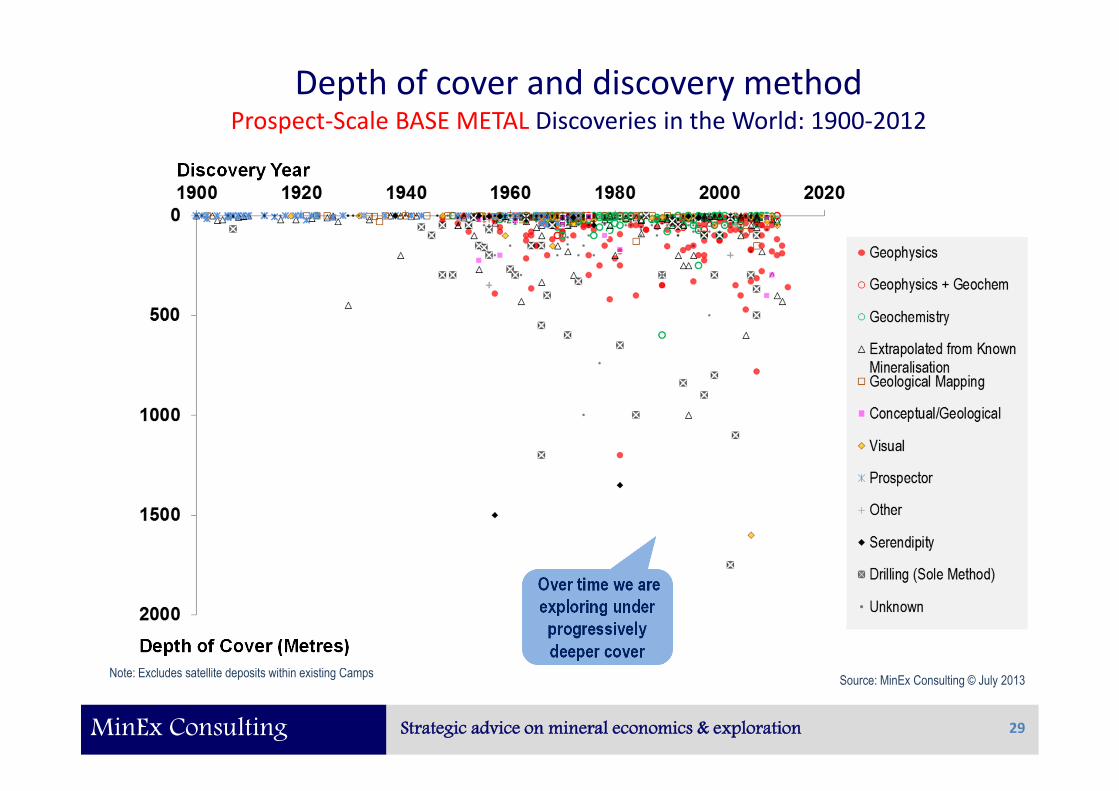
Depth of cover and discovery methodProspect-Scale BASE METAL Discoveries in the World: 1900-2012
29
Discovery Year
Depth of Cover (Metres)
Note: Excludes satellite deposits within existing Camps
Over time we areexploring underprogressivelydeeper cover
Over time we areexploring underprogressivelydeeper cover
Source: MinEx Consulting © July 2013

MinEx Consulting Strategic advice on mineral economics & exploration
Depth of cover and discovery methodProspect-Scale GOLD Discoveries in the World: 1900-2012
30
Discovery Year
Depth of Cover (Metres)
Note: Excludes satellite deposits within existing CampsSource: MinEx Consulting © July 2013

MinEx Consulting Strategic advice on mineral economics & exploration
Depth of cover and discovery methodProspect-Scale GOLD Discoveries in the World: 1900-2012
31
EXCLUDING South Africa
Discovery Year
Depth of Cover (Metres)
Note: Excludes satellite deposits within existing Camps
Gold exploration is generallydone under shallower cover …
only because we don’t have anygood tools to look deep !!
Gold exploration is generallydone under shallower cover …
only because we don’t have anygood tools to look deep !!
Source: MinEx Consulting © July 2013

MinEx Consulting Strategic advice on mineral economics & exploration
The cost per unit of metal found has been rising
32

MinEx Consulting Strategic advice on mineral economics & exploration
Exploration expenditures and amount of copper foundPrimary copper deposits >0.5 Mt Cu-eq found in Western World: 1950-2012
33
$0
$1
$2
$3
$4
$5
0
50
100
150
200
1950 1960 1970 1980 1990 2000 2010
Exploration Expenditures
Estimate
Western World Discoveries
Mt Cu-eq
Note: Estimate includes adjustments for deposits with no discovery yearand deposits missing from the database
Expenditures (2012 US$B)
Source: MinEx Consulting © June 2013

MinEx Consulting Strategic advice on mineral economics & exploration
Until recently, copper discovery costs were fairly steadyUnit discovery costs for primary copper in the Western World: 1950-2012
34
US Cents per lb Cu-eq in 2012$
3 Year rolling average
Estimate
# Equal to 3.0 ¢/lbexcluding by-product credits
Assume 2.5 ¢/lb # Cu-eqgoing forward
Assume 2.5 ¢/lb # Cu-eqgoing forward
1995-2005 Average= 0.9 ¢/lb Cu-eq
1995-2005 Average= 0.9 ¢/lb Cu-eq
Source: MinEx Consulting © June 2013

MinEx Consulting Strategic advice on mineral economics & exploration
Gold exploration expenditures and ounces foundPrimary gold found in the Western World: 1950-2011
35
$0
$2
$4
$6
$8
$10
0
100
200
300
1950 1960 1970 1980 1990 2000 2010
Exploration Expenditures
Estimate
Western World Discoveries
Moz Expenditures (2012 US$B)
Source: MinEx Consulting © June 2012

MinEx Consulting Strategic advice on mineral economics & exploration
Discovery costs for gold are risingUnit discovery costs for primary gold in the Western World: 1950-2011
36
Estimate
Discovery Cost (June 2012 US$/oz)
1995-2005Average = $25/oz
1995-2005Average = $25/oz
Assume $32/ozgoing forwardAssume $32/ozgoing forward
3 Year rolling average
$113
Source: MinEx Consulting © June 2012

MinEx Consulting Strategic advice on mineral economics & exploration
Average discovery costs for uranium are risingUnit discovery costs for uranium in the Western World: 1950-2011
37
Discovery Cost (US$/lb U3O8)
5 Year rolling average
Estimate
Assume $2.50/lbgoing forward
Assume $2.50/lbgoing forward
1995-2005Average = $1.63/lb
1995-2005Average = $1.63/lb
$11.09
Source: MinEx Consulting © June 2012

MinEx Consulting Strategic advice on mineral economics & exploration
6. ARE WE FINDING ENOUGH METAL ?
For the industry to be sustainable it needs to replace what it mines
38
MinEx Consulting Strategic advice on mineral economics & exploration
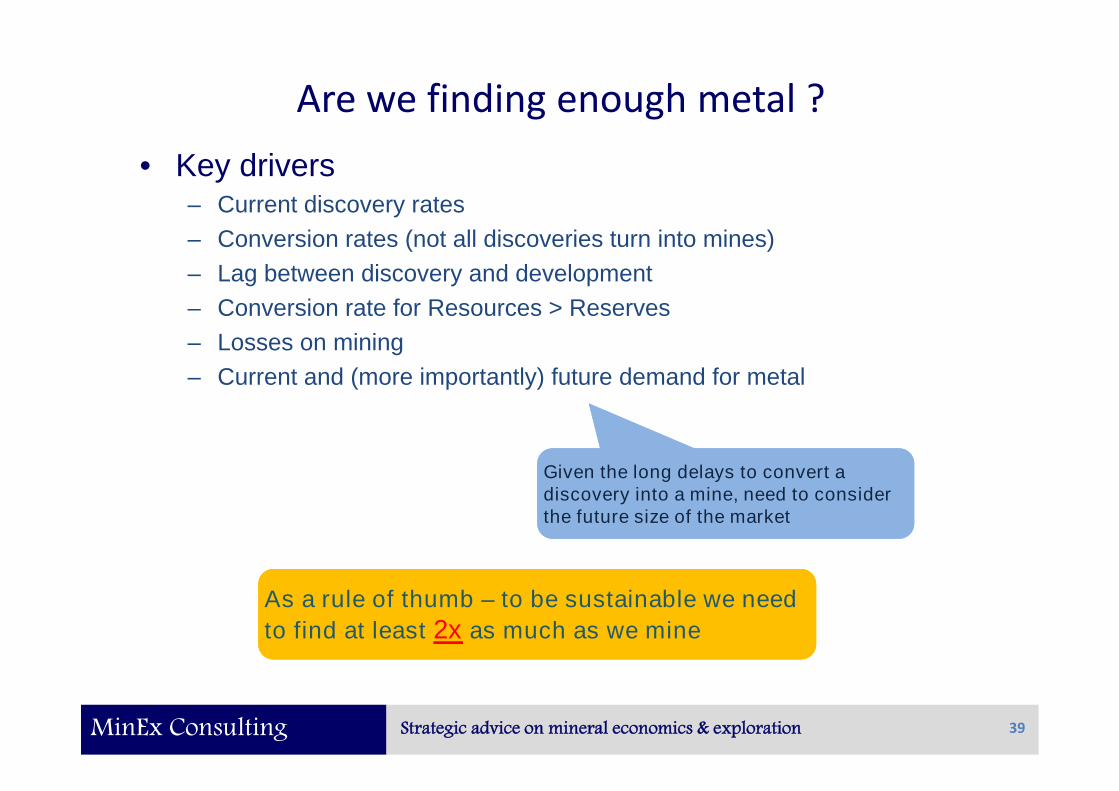
Are we finding enough metal ?
• Key drivers– Current discovery rates
– Conversion rates (not all discoveries turn into mines)
– Lag between discovery and development
– Conversion rate for Resources > Reserves
– Losses on mining
– Current and (more importantly) future demand for metal
39
Given the long delays to convert adiscovery into a mine, need to considerthe future size of the market
Given the long delays to convert adiscovery into a mine, need to considerthe future size of the market
As a rule of thumb – to be sustainable we need
to find at least 2x as much as we mine
As a rule of thumb – to be sustainable we need
to find at least 2x as much as we mine

MinEx Consulting Strategic advice on mineral economics & exploration
Mining & discovery rates for goldAmount of gold found and mined in the World: 1950-2010
40
0
100
200
300
400
1950 1960 1970 1980 1990 2000 2010
Discoveries
World Production
Estimate
Moz
Note: Chart include minor adjustment for deposits missing from the databaseIs based on discoveries > 0.1 Moz
Sources: MinEx Consulting © Nov 2011.Production data from USGS
Exploration Spend $
Unit Discovery Costs
Total Metal Found
Future Mine Production
Discovery/Prodn Ratio in 2026 1.5x
“Tight”“Tight”
Outlook

MinEx Consulting Strategic advice on mineral economics & exploration
Mining & discovery rates for copperAmount of primary copper found and mined in the World: 1950-2011
41
0
20
40
60
80
100
120
140
160
1950 1960 1970 1980 1990 2000 2010
Discoveries - Estimated
Discoveries - By-Product
Discoveries - Primary
Mine Production
Mt Cu
Estimate
Exploration Spend $
Unit Discovery Costs
Total Metal Found
Future Mine Production
Discovery/Prodn Ratio in 2026 1.7x
Note: By-Product metal refers to copper found in Ni, Au and Zn/Pb depositsSource: MinEx Consulting © March 2012
“in-Balance”“in-Balance”
Outlook

MinEx Consulting Strategic advice on mineral economics & exploration
Mining & discovery rates for uraniumAmount of Primary U3O8 found and mined in the World: 1950-2010
0
200
400
600
1950 1960 1970 1980 1990 2000 2010
Discoveries
World Production
Note: Chart excludes Olympic Dam (Cu-U-Au deposit) found in 1975 – contains 2545 kt U3O8
kt U3O8
Estimate
Note: Chart include minor adjustment for deposits missing from the databaseIs based on discoveries > 0.5 kt U3O8
Sources: MinEx Consulting © July 2012Production data from USGS
42
Exploration Spend $
Unit Discovery Costs
Total Metal Found
Future Mine Production
Discovery/Prodn Ratio in 2026 2.0x
“in-Balance”“in-Balance”
Outlook

MinEx Consulting Strategic advice on mineral economics & exploration
Mining & discovery rates for zincAmount of Primary Zinc found and mined in the World: 1950-2011
43
0
10
20
30
40
50
1950 1960 1970 1980 1990 2000 2010
Discoveries - Estimated
Discoveries - Known
Mine Production
Mt Zn
Estimate
Exploration Spend $
Unit Discovery Costs
Total Metal Found
Future Mine Production
Discovery/Prodn Ratio in 2026 0.7x
Sources: MinEx Consulting © Feb 2012Production data from USGS
“Major Shortfall”“Major Shortfall”
Outlook
MinEx Consulting Strategic advice on mineral economics & exploration
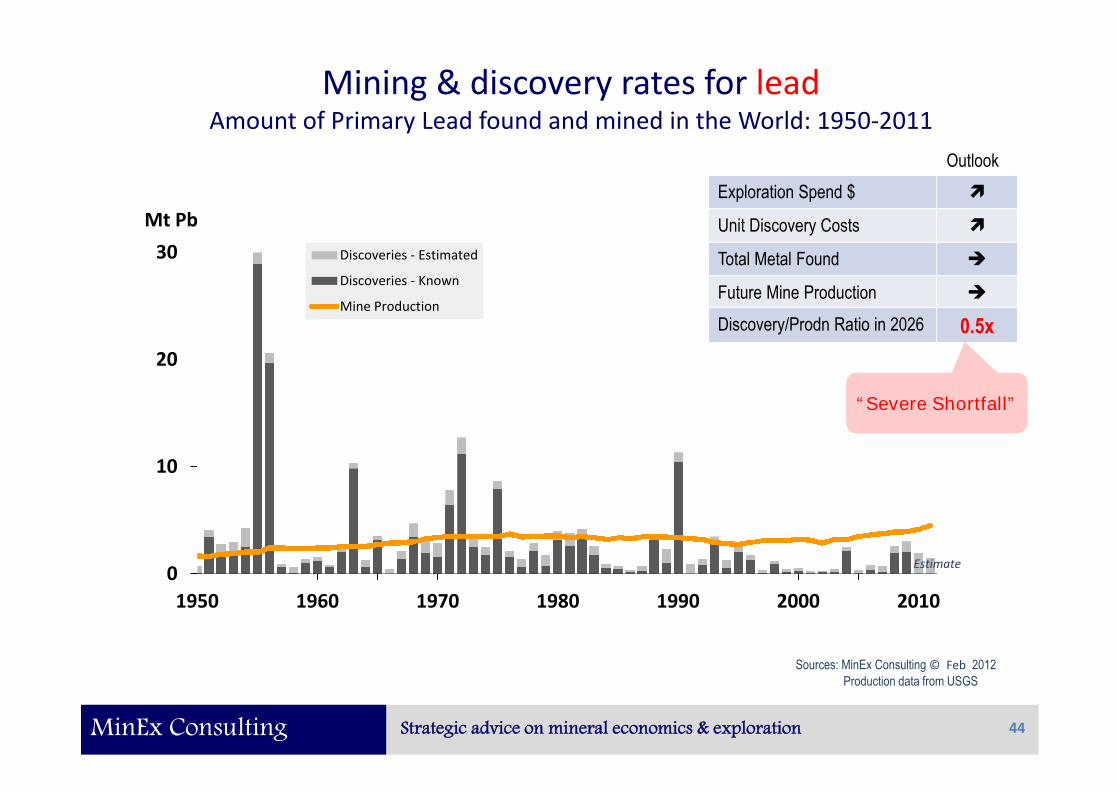
Mining & discovery rates for leadAmount of Primary Lead found and mined in the World: 1950-2011
44
0
10
20
30
1950 1960 1970 1980 1990 2000 2010
Discoveries - Estimated
Discoveries - Known
Mine Production
Mt Pb
Estimate
Exploration Spend $
Unit Discovery Costs
Total Metal Found
Future Mine Production
Discovery/Prodn Ratio in 2026 0.5x
Sources: MinEx Consulting © Feb 2012Production data from USGS
“Severe Shortfall”“Severe Shortfall”
Outlook

MinEx Consulting Strategic advice on mineral economics & exploration
7. CONCLUSIONS
The industry is facing a number of challenges and opportunities
45

MinEx Consulting Strategic advice on mineral economics & exploration
Conclusions: Gloom or Boom? [1/3]
1. Trends in global exploration spend– Over last decade world exploration spend rose from $2.9b to $29.4b
– Exploration spend reached an all-time high in 2012
– Due to lower commodity prices, exploration spend is forecast to drop 20% in2013, with a further 15% out to 2020
– Junior Companies facing a cash-crisis. Expect a big cut-back on “money-in-the-ground” until the situation stabilises
2. Trends in discovery rates– Over the last decade industry spend $116b (in 2012$) and found
524 significant deposits, including 86 Tier 1&2 deposits
– The are currently ten “Hot Spots” for exploration around the world.Two of those are in Africa (Central Africa and West Africa)
46
Industry has gonethrough a “boom”Industry has gonethrough a “boom”
“Industry faces severalyears of “gloom”
“Industry faces severalyears of “gloom”
Good opportunitiesstill available
Good opportunitiesstill available

MinEx Consulting Strategic advice on mineral economics & exploration
Conclusions: Gloom or Boom? [2/3]
3. Trends in discovery performance– In terms of bang-per-buck, Africa was the best Region. Over the last decade
it accounted for 14% of global spend and found 22% of the deposits.
– Even though non-ferrous spending in the Western world rose by x8 over thelast decade, the discovery rate only rose ~3x. This was due to a doubling inthe cost of drilling, staff and admin. Industry is also having to exploreunder deeper cover.
4. Trends in the types of exploration methods used– Varies by commodity, scale and depth of cover. Even so, brownfields
exploration (i.e. “nearology”) and geophysics are becoming much moreimportant.
47
In terms of discovery,Africa is “the place to be”
In terms of discovery,Africa is “the place to be”
Input costs should fall in medium term. The challenge of being ableto explore under deeper cover will get more severe
Input costs should fall in medium term. The challenge of being ableto explore under deeper cover will get more severe
Innovations in geophysics, computing and drilling willhelp boost discovery performance
Innovations in geophysics, computing and drilling willhelp boost discovery performance
MinEx Consulting Strategic advice on mineral economics & exploration
Conclusions: Gloom or Boom? [3/3]
5. Trends in discovery costs– Unit discovery costs for all commodities has been rising - going forward
assume $32/oz Au, 3 ¢/lb Cu and $2.50/lb U3O8
6. Are we finding enough metal?– To be sustainable industry need to find 2x as much as we mine.
– Taking into account, forecast exploration & unit discovery costs, andfuture growth in mine production, it appears that uranium and copper are“in-balance”, gold is “tight” and zinc & lead face major shortfalls.
48
In the longer term, industry needs to spend more onexploration to meet future metal demand. Either
that or commodity prices will need to rise !!
In the longer term, industry needs to spend more onexploration to meet future metal demand. Either
that or commodity prices will need to rise !!
MinEx Consulting Strategic advice on mineral economics & exploration 49
Contact details
Richard SchoddeManaging DirectorMinEx ConsultingMelbourne, Australia
Email: [email protected]: MinExConsulting.com
Copies of this and other similarpresentations can be downloaded
from my website
Copies of this and other similarpresentations can be downloaded
from my website

MinEx Consulting Strategic advice on mineral economics & exploration
APPENDIX – ESTIMATED FUTURE MINEPRODUCTION AND DISCOVERY RATES
Background data for assessing the sustainability of the mining industry
50

MinEx Consulting Strategic advice on mineral economics & exploration
How much metal do we need to find ?
51
To ensure no supply interruptions in the longer term the industryneeds to be finding at least 2x as much metal as it currently minesTo ensure no supply interruptions in the longer term the industry
needs to be finding at least 2x as much metal as it currently mines

MinEx Consulting Strategic advice on mineral economics & exploration
Estimated Discovery/Production ratios
Gold Copper Uranium
Unit discovery costs ~$32/oz ~3 c/lb ~$2.50/lb
World exploration spend rate(2012 US$m pa)
[A] = $5100m[P] = $9980m[F] = $4400m
[A] = $2280m[P] = $4870m[F] = $2800m
[A] = $680m[P] = $1110m[F] = $1500m
Expected amount of metal tobe found [F] = 138 Moz [F] = 42 Mt [F] = 270 kt
Mine Production(in 15 years time)
2011 = 84 Moz2026 = 95 Moz
2011 = 16 Mt2026 = 25 Mt
2011 = 64 kt2026 = 133 kt
Discovery/Production Ratios [F] [F] [F]
At 2011 Production Rate 1.6x 2.6x 4.2x
At 2026 Production Rate 1.5x 1.7x 2.0x
52
Target is >2xTarget is >2x
Source: MinEx Consulting © July 2013
[A] = Average exploration spending rate over last decade (2003-12)[P] = Peak exploration spending rate (in the last decade)[F] = Forecast spend in 2020, based on June 2013 Consensus Economics commodity price forecast

MinEx Consulting Strategic advice on mineral economics & exploration
Estimated Discovery/Production ratiosZinc Lead Comments
Unit discovery costs ~3 USc/lb Actually refers to Zn-eq
World exploration spendrate (2012 US$m pa)
[A] = $650m[P] = $1040m[F] = $1100m
Assumes that FSU+China makeup 15% of total world spend
Expected amount of metalto be found [F] = 12.2 Mt [F] = 2.7 Mt
Assumes that the Zn-eq is madeup of 67% zinc, 16% lead and17% other by-product credits
Mine Production 2011 = 12.4 Mt2026 = 16.7 Mt
2011 = 4.5 Mt2026 = 5.2 Mt
Assumes 2% & 1% pa growth
Discovery/ProductionRatios
[F] [F]
At 2011 Production Rate 1.0x 0.6x
At 2026 Production Rate 0.7x 0.5x Target is > 2x
53
[A] = Average exploration spending rate over last decade (2003-12)[P] = Peak exploration spending rate (in the last decade)[F] = Forecast spend in 2020, based on June 2013 Consensus Economics commodity price forecast
Required for industryto be sustainable
Required for industryto be sustainable
Source: MinEx Consulting © July 2013


