
January 19, 2012
Research Report: Sector update
Davy on Airlines
Low-cost carriers will continue to outperform but network airlines will struggle
www.davy.ie Bloomberg: DAVY<GO> Research: +353 1 6148997 Institutional Equity Sales: +353 1 6792816 Davy Research
g
Stephen Furlong [email protected] / +353 1 6148924
Joshua Goldman, PhD [email protected] / +353 1 6148997
Low-cost carriers (LCCs) are preferred play in a weak eurozone environment
• We see real pricing power for market leaders Ryanair and easyJet. As we look into Q1 and Q2, capacity conditions appear beneficial for both airlines and competitive pressures are benign.
• We expect further cost benefits for Ryanair as capacity is reallocated to favourable airport locations.
• easyJet should gain from 'easy' comparables and from the group's strategy overview to be presented at its capital markets day on January 31st.
• Cash returns are a key feature in 2012: easyJet will provide a 11.5% dividend yield; Ryanair has c.€1bn pre-capex free cash flow, which allows for significant returns to shareholders.
Network airlines face many challenges due to uncontrollable cost increases; premium traffic the biggest risk
• The network airlines are experiencing slowing volumes and declines in load factors. Although supply is adjusting somewhat to suppressed demand, it is difficult to envisage a scenario in which there is pricing power.
• Leading indicators (freight and manufacturing PMIs) suggest that premium traffic could turn negative.
• With large cost increases (fuel and taxes), 2012 is shaping up to be a very challenging year for the network airlines.
Valuation multiples low but earnings momentum key
• Having made some adjustments to our forecasts (upwards in the case of Ryanair and downwards for Lufthansa), we are now 10-15% below consensus for the networks and at or above consensus for the LCCs.
• Our top picks remain Ryanair and easyJet based on profit growth and cash returns to shareholders. We are increasing our price target for Ryanair to €5.
• We are downgrading Aer Lingus to 'neutral' and expect the networks to 'underperform' until the macro environment improves. For balance sheet and valuations reasons, we retain Lufthansa's rating as 'neutral'.
Please refer to important disclosures at the end of this report.
J&E Davy, trading as Davy, is regulated by the Central Bank of Ireland. Davy is a member of the Irish Stock Exchange, the London Stock Exchange and Euronext. For branches in the UK, Davy is authorised by the Central Bank of Ireland and subject to limited regulation by the Financial Services Authority. Details about the extent of our regulation by the Financial Services Authority are available from us on request. All prices are as of close of January 17th. All authors are Research Analysts unless otherwise stated. For the attention of US clients of Davy Securities, this third-party research report has been produced by our affiliate, J & E Davy.
Calendar of upcoming events
January 26th
easyJet Q1 IMS
January 30th
Ryanair Q3 results
January 31st
easyJet capital markets day
February 28th
Aer Lingus FY results
February 29th
IAG FY results
March 7th
Air France-KLM FY results
March 15th
Lufthansa FY results
Ratings Aer Lingus Neutral (19/01/12) Previous Outperform (23/04/10) Air France-KLM Underperform (19/01/12) Previous Neutral (09/09/11) easyJet Outperform (22/07/11) Previous Neutral (19/04/11) IAG Underperform (19/01/12) Previous Neutral (09/09/11) Lufthansa Neutral (09/09/11) Previous Outperform (21/03/11) Ryanair Outperform (07/12/09) Previous Neutral (02/11/09)
For full details of current and previous ratings see www.davy.ie/ratings.
Price targets
Aer Lingus 0.75c 19/01/12
Previous 100c 09/09/11
Air France-KLM 380c 19/01/12
Previous 700c 09/09/11
easyJet (£) 475p 05/08/11
Previous 350p 19/04/11
IAG 140c/115p 19/01/12
Previous 230c/200p 09/09/11
Lufthansa 900c 19/01/12
Previous 1200c 09/09/11
Ryanair 500c 19/01/12
Previous 450c 19/04/11

Research Report: Davy on Airlines January 19, 2012
2 Davy Research
Contents
Key themes for 2012 3
Current estimates 5
Capacity update 6 Intra-EU capacity remains below peak and should help support yields; in
contrast, to/from EU is showing steady growth 6 Q1 planned capacity for the network airlines has been adjusted downwards,
but is it enough? 7
Early indicators signal upcoming weakness in premium traffic; potential significant impact on earnings 9
Rise in uncontrollable costs will prove challenging for network airlines 12 Fuel remains stubbornly high, even as network airlines' operating profit declines 12 Effects of the UK APD 16 EU ETS has greater impact on the network airlines 16
Second wave of consolidation should benefit specific players 17
Stock views 20 Valuations are low but earnings at risk for networks; LCCs remain attractive 20 easyJet – special dividends and business focus 24 Ryanair – cash machine to be further illustrated in 2012 26 Aer Lingus – needs to break out from 'value trap' in 2012 28 IAG – constrained by capex and cash flow 30 Lufthansa – challenges ahead in current environment 33 Air France-KLM – needs to deliver on turnaround plan 37 Announces ambitious turnaround plan 37 Scenario analysis – rights issue likely if plan not delivered 39
Appendix 1: Price to book 42
Appendix 2: Price/peak EPS 44
Appendix 3: Cyclically adjusted P/E 45
Appendix 4: Forward EBIT FY 2011 versus share price performance 46
Appendix 5: Forward EBIT FY 2012 versus share price performance 47
Appendix 6: EV/sales 48
Appendix 7: IATA summary forecasts 49
Appendix 8: Sector valuations and company analysis 50
Important disclosures 58

Research Report: Davy on Airlines January 19, 2012
3 Davy Research
Key themes for 2012 Capacity is decelerating, but further cuts are needed given PMI signals and freight volume declines
Capacity, which had grown in 2011, is adjusting downwards. The capacity data for December show an increase of 0.2% in the number of flights to/from Europe and a rise of 2% in offered seats. Within Europe, flight operations and seats have decreased by 2% and 0.4% respectively.
Long-haul traffic is more reliant on global GDP growth. All the major European airlines have signalled decelerating capacity growth but no contraction as of yet. Such contraction may be required if the economic picture continues to worsen.
Signals of a sharp slowdown in premium travel are evident in the Purchasing Managers Index (PMI) of business confidence, averaged across major economies. Business confidence has been a good early warning indicator of movement in premium travel growth, leading changes by up to six months.
The two main low-cost airlines have either flat capacity growth (easyJet) or negative capacity growth (Ryanair) this winter. We would expect further consolidation, particularly in short haul, as weaker network airlines, smaller LCCs and tour operators contract operations.
Air freight volumes, which tend to be a leading indicator of air passenger volumes, continue to show mid-single-digit declines that began in June.
In the freight market, we are witnessing capacity reductions by some express/cargo airlines on the Asia-Europe trade lane.
Operating leverage works in both directions; some uncontrollable costs rising
Companies, particularly those in the airline industry, are facing the challenge of pushing through higher input costs to end-users. IAG commented on this as follows: "the challenge and opportunity of recovery though revenue remains, but should take at least another 12 months". This is likely to make 2012 a challenging year, particularly as economic conditions worsen and the fuel price remains at elevated levels.
– Unwinding of fuel hedges is still likely to lead to double-digit increases in yoy fuel costs.
– In addition, other parties in the value chain (notably governments) are still raising taxes (e.g. the recent c.8% increase in air passenger duty (APD) tax in the UK and the introduction of an EU emissions tax scheme (ETS) for all airlines operating in/out of Europe in 2012).
– Charges at some regulated airports and some route charges are increasing.
In the absence of further revenue recovery, comparables may become more difficult.
Key themes for 2012 Further cuts in capacity are required
Uncontrollable costs are rising
Second wave of consolidation is starting
Contraction of long-haul European growth may be required if the economic situation worsens
Capacity is falling: negative intra-Europe but only decelerating growth on long haul
Signals of a sharp slowdown in premium travel are evident in the Purchasing Managers Index (PMI) of business confidence
We would expect further consolidation, particularly in short haul, as weaker network airlines, smaller LCCs and tour operators contract operations
Cost pressures Fuel remaining at elevated levels
Government taxes – APD, EU ETS
Regulated airports, route charges
Interest cost pressures as negative free cash flow resumes

Research Report: Davy on Airlines January 19, 2012
4 Davy Research
The focus on capital expenditure reductions through deferral and capacity and cost reductions will be needed to bolster balance sheets and prevent negative free cash flow positions. Most companies' balance sheets are healthy, but we note that Air France-KLM has presented a plan to rapidly reduce debt.
Second wave of consolidation starting
Downward pressure on revenues in 2008 led to quicker consolidation in the marketplace towards the stronger players. After a pause and as revenue pressure resumes, we expect a second wave of consolidation.
Recent examples are the negotiations regarding the sale of bmi; other potential sales include TAP and Aer Lingus' government stake. After Qatar Airways' recent acquisition of a 35% stake in Cargolux, it will be interesting to see if the Gulf carriers combine organic with acquisitive growth (e.g. the proposed 29.2% stake in Air Berlin by Etihad).
Latest consolidation moves AMR bankruptcy
Etihad stake in Air Berlin
Qatar stake in Cargolux
Bmi sale to IAG; bmibaby likely closed
Lan Chile/TAM merger

Research Report: Davy on Airlines January 19, 2012
5 Davy Research
Current estimates Our current forecasts are provided in the table below and include changes to our estimates for Ryanair and Lufthansa. We have adjusted numbers upwards in the case of the former and downwards in the case of the latter. Broadly, our estimates are at or above consensus for the LCCs and below for the networks (which reflects our current view). We assume oil prices at current levels of c.$110 per barrel. Clearly, the largest sensitivities for the airlines are the euro/dollar or sterling/dollar cost of fuel and yield development; we map out the sensitivities to these below.
Table 1: Operating profit estimates and consensus 2012
Operating profit old (€/£m)
Operating profit current (€/£m)
Change Operating profit consensus (€/£m)
% above/below consensus
Lufthansa 800 593 -26% 686 -13.5%
Ryanair 550 579 5% 567 2.1%
easyJet 235 235 0% 235 0.3%
Aer Lingus 62 62 0% 53 15.5%
IAG 296 296 0% 331 -10.5%
Air France-KLM -485 -485 0% -280 -73.2%
Source: Davy; Reuters; Bloomberg
Table 4: Fuel hedging positions
Airline Hedging guidance
Air France-KLM 52% FY2012 guiding €7.2bn, c.€800m increase
IAG 53% hedged for FY2012; +/-$10/MT = +/-€33m cost approx
Lufthansa 67% hedged in FY2012 above>$104 enjoy relative cost advantage
Ryanair 73% hedged FY2013 at $990PMT
easyJet 73% hedged FY2012 at $956/MT; 48% FY2013 at $979PMT
Aer Lingus 47% of FY12 at $975MT
Source: Davy
The direction of estimates is upwards for the LCCs (we upgrade Ryanair) and downwards for the networks (we downgrade Lufthansa)
We are at or above consensus for LCCs and below for networks
Table 2: FY 2012 profit sensitivity to 1% yield movement
Operating profit (€/£m) Currently +/- 1% yield
Change Percentage
Ryanair 579.4 543.5 -35.9 -6.2%
easyJet 235.2 206.4 -28.8 -12.2%
IAG 296.2 151.6 -144.7 -48.8%
Lufthansa 593.2 345.0 -248.2 -41.8%
Air France KLM -485.0 -669.4 -184.4 -38.0%
Aer Lingus 61.7 50.1 -11.6 -18.8%
Source: Davy
Table 3: FY 2012 profit sensitivity to $5 change in oil per barrel ($50 per tonne)
Operating profit (€/£m)
Currently +/- $5 ($50 PMT)
Change Percentage
Ryanair 579.4 602.9 23.5 4.1%
easyJet 235.2 243.8 8.6 3.7%
IAG 296.2 461.2 165.0 55.7%
Lufthansa 593.2 718.2 125.0 21.1%
Air France KLM -485.0 -263.0 222.0 45.8%
Aer Lingus 61.7 66.4 4.7 7.6%
Source: Davy

Research Report: Davy on Airlines January 19, 2012
6 Davy Research
Capacity update Current levels of intra-European capacity are below 2008 peak levels (as is capacity in the US domestic market). On the other hand, inter-continental EU traffic is above peak levels. Planned intra-European capacity growth is benign and in our opinion should help to support higher yields. A similar scenario has occurred in the US domestic market. Given the potential outbound demand weakness in Europe, the planned European long-haul capacity growth will have to be supported by demand from outside Europe. We also have concerns about premium traffic, which has shown slowing growth. Leading indicators suggest that it could turn negative, which would have a significant impact on the operating profits of the network airlines. Intra-EU capacity remains below peak and should help support yields; in contrast, to/from EU is showing steady growth
Intra-European capacity in 2011 is 2% down from the 2008 peak as the network airlines have significantly reduced capacity due to the economic downturn and intense competition from the LCCs. The below-peak levels of intra-EU capacity create a beneficial environment for the LCCs. As we have previously outlined in previous research notes, there has been a structural decrease in US domestic capacity that has helped to support yield increases in the US. The US Air Transport Association statistics reported that domestic average fares were up 9.3% year-to-date to November 2011 compared to the same period last year. The slowdown, and indeed contraction, in EU capacity, driven by the key players (Ryanair and easyJet), is likely to lead to a similar situation to that of the domestic US market. Intercontinental European capacity in 2011 was 12% above the 2008 peak. This was helped by the consistent growth in capacity to/from the Middle East and the rebound in capacity to/from Asia Pacific. The capacity to/from US/Canada is still below peak levels, which have likely been helped by the joint venture consolidation on the transatlantic (over 75% of northern transatlantic capacity is controlled by the three alliances with anti-trust immunity).
Capacity is below peak in intra-European and US domestic markets
The below-peak levels of intra-EU capacity create a beneficial environment for the LCCs

Research Report: Davy on Airlines January 19, 2012
7 Davy Research
Q1 planned capacity for the network airlines has been adjusted downwards, but is it enough?
Given the stubbornly high fuel prices and the challenging economic outlook in Europe, many of the European carriers have lowered their planned capacity growth (as is evident in the following chart). The planned capacity growth by region reinforces our view. The LCCs should benefit from negative intra-European capacity
growth in Q1 and low growth in Q2. The picture is more negative for European network airlines. To keep
load factor stable, assuming challenging GDP conditions in Europe for H1, demand from outside the EU will need to be robust in order to handle the planned intercontinental increase in capacity.
We note the limited capacity growth on the Europe to North America route in H1 and believe that this may more closely match demand (assuming that the US continues to show low-single-digit GDP growth).
Intercontinental European capacity in 2011 was 12% above the 2008 peak
From SRS Analyser database, it is clear that intra-European capacity is favourable. On long haul, inbound demand needs to be strong to fill planned capacity.
Figure 1: Regional capacity data (millon seats)
-
200
400
600
800
1,000
1,200
2001 2002 2003 2004 2005 2006 2007 2008 2009 2010 2011
Within EU To/From EU USA domestic
Source: OAG; Davy
Figure 2: December European intercontinental capacity trends (millon seats)
0.0
1.0
2.0
3.0
4.0
5.0
6.0
7.0
2002 2003 2004 2005 2006 2007 2008 2009 2010 2011USA/Canada to from Western Europe Western Europe to/from Asia PacificWestern Europe to/from Middle East
Source: OAG; Davy

Research Report: Davy on Airlines January 19, 2012
8 Davy Research
Figure 3: Capacity growth by market – Q1 2012
-4%
-2%
0%
2%
4%
6%
8%
10%
12%
14%
Europe tooutside Europe
Europe toAfrica
Europe to Asia Intra-Europe Europe toMiddle East
Europe to N.America
Europe to S.America
Current analysis From September Davy on Airlines Source: SRS Analyser; Davy
Figure 4: Capacity growth by market – Q2 2012
0%
2%
4%
6%
8%
10%
12%
Europe tooutside Europe
Europe to Africa Europe to Asia Intra-Europe Europe toMiddle East
Europe to N.America
Europe to S.America
Source: SRS Analyser; Davy

Research Report: Davy on Airlines January 19, 2012
9 Davy Research
Early indicators signal upcoming weakness in premium traffic; potential significant impact on earnings
In previous downturns, freight and manufacturing PMIs were leading indicators of premium volume. Both of these are showing negative trends, which suggests that premium traffic will soon turn negative. Using reported historical data, we estimate the potential impact of changes in premium traffic volumes on the operating profit of the three network airlines.
Table 7: Impact of premium traffic volume changes on Lufthansa's operating profit
Premium traffic volume Operating profit (2012) Δ from base case
5% 781 32%
1% 633 7%
Base case 593 0%
-1% 555 -6%
-5% 407 -31%
Source: Davy
Leading indicators suggest premium weakness
Leading indicators suggest premium weakness
Impact of declining premium volumes would be large
Figure 5: Manufacturing PMI suggests premium declines
-30%
-25%
-20%
-15%
-10%
-5%
0%
5%
10%
15%
20%
25%
Apr
07
Aug
07
Dec
07
Apr
08
Aug
08
Dec
08
Apr
09
Aug
09
Dec
09
Apr
10
Aug
10
Dec
10
Apr
11
Aug
11
30
35
40
45
50
55
60
65
Premium volumes (IATA) JP Morgan Global Manufacturing PMI [50= No change] (rhs)
6 month lag between PMI >50 and growth in premium volumes
c. 3 month lag between PMI <50 and decline in premium volumes
October 49.9 November 49.7December 50.8
Source: IATA; Davy
Figure 6: Air freight suggests premium declines
-30%
-20%
-10%
0%
10%
20%
30%
40%
Apr
07
Aug
07
Dec
07
Apr
08
Aug
08
Dec
08
Apr
09
Aug
09
Dec
09
Apr
10
Aug
10
Dec
10
Apr
11
Aug
11
Premium volumes (yoy) Freight (yoy)
c. 3 month lag between air freight turning
negative and decline in premium volumes
c. 2 month lag between air freight turning positive and increase in premium
volumes
Air freight has been negative since May
Source: IATA; Davy
Table 5: Impact of premium traffic volume changes on Air France-KLM's operating profit
Premium traffic volume
Operating profit (2012)
Δ from base case
5% -319 34%
1% -448 8%
Base case -485 0%
-1% -522 -8%
-5% -651 -34%
Source: Davy
Table 6: Impact of premium traffic volume changes on IAG's operating profit
Premium traffic volume
Operating profit (2012) Δ from base case
5% 434 47%
1% 324 9%
Base case 296 0%
-1% 267 -10%
-5% 146 -51%
Source: Davy

Research Report: Davy on Airlines January 19, 2012
10 Davy Research
International Air Transport Association (IATA) remains cautious
In early December, industry body IATA revised down its 2012 industry outlook. For 2011, profitability remains weak but unchanged at $6.9bn for a net margin of 1.2%. Looking ahead to 2012, IATA downgraded its central forecast for airline profits from $4.9bn to $3.5bn for a net margin of 0.6%. It also provides a downside case in the event of a second banking crisis with losses of $8.3bn. Its central view is that both passenger and cargo yields will remain flat in 2012. Its fuel assumption is $99 per barrel. European carriers are expected to deliver losses of $600m, hit by the weakness of their home market economies and further increases in passenger taxes. IATA indicates that historically the airline industry has seen profit turn into loss whenever global GDP growth falls below 2%. IATA forecasts are shown in Appendix 7. The IATA forecasts by region and traffic assumptions showing supply exceeding demand are provided in the following tables.
Table 8: IATA forecasts by region
EBIT margin % revenues Net profits
Industry profits (US$bn) 2007 2008 2009 2010 2011F 2012F 2012F* 2007 2008 2009 2010 2011F 2012F 2012F*
Global 3.9 -1.6 0.4 4 2.2 1.4 0.5 14.7 -16 -4.6 15.8 6.9 3.5 -8.3
Regions
North America 5.5 -1.8 1.2 4.7 3.2 2.4 0.3 5.5 -9.6 -2.7 4.1 2 1.7 -1.8
Europe 4 0.1 -2.2 1.9 1.2 0.3 -1.7 6.4 0 -4.3 1.9 1 -0.6 -4.4
Asia-Pacific 2.9 -4.7 2.8 6 2.4 2.1 0.2 3 -4.7 2.6 8 3.3 2.1 -1.1
Middle East 0 1 -1.5 3.6 2 1.6 -0.4 -0.1 -0.3 -0.6 0.9 0.4 0.3 -0.4
Latin America 2 2.3 2.8 5 2 1.8 -0.1 0.1 -1.4 0.5 0.9 0.2 0.1 -0.4
Africa 1 -0.9 -1.2 1.6 0.8 0.3 -0.6 -0.2 -0.1 -0.1 0.1 0 -0.1 -0.2
* Banking crisis Source: Davy; IATA
Table 9: IATA forecasts – traffic volumes and capacity
Traffic volumes Capacity
Annual average growth rates %
2006 2007 2008 2009 2010 2011F 2012F 2012F* 2006 2007 2008 2009 2010 2011F 2012F 2012F*
Global 5.3 6 0.7 -4.3 10.4 4.2 2.9 -1.3 4.1 5.8 1.1 -3.5 5.2 6 3.1 0
Regions
North America 2.7 3.5 -2.4 -6.3 9.9 2 2.2 -1 0.5 3.2 -2.8 -5.6 3.9 3.4 2 -0.5
Europe 4.9 2.1 0.9 -7.7 5 7.5 2.5 -3.7 3.9 3.5 2.9 -5.4 1.5 9.2 2.9 -0.1
Asia-Pacific 7.5 7.8 -0.2 -2.2 12.6 2.1 2 -0.2 6.7 6.9 0.6 -4.8 5.8 4.6 2.9 0.1
Middle East 11.8 16.4 3.6 9.5 20 7.9 5.7 4.5 12.6 14.5 4.7 11.1 15.8 10.8 5.8 4.8
Latin America -3.4 9.9 3.3 0 14.5 10.6 8.5 2.3 1.6 6.9 3.2 1.4 9.6 8 8.3 3.3
Africa 7 4.5 5.1 -5.4 15 0.8 3.5 0.3 1.8 5.8 7.2 -1.5 9.5 2.9 3.7 0.7
* Banking crisis Source: Davy; IATA
IATA is pointing to softer profits with margins wafer thin
IATA indicates that historically the
airline industry has seen profit turn into loss whenever global GDP growth falls below 2%

Research Report: Davy on Airlines January 19, 2012
11 Davy Research
It is clear from the IATA data that passenger and freight volumes have dropped. Freight markets have contracted some 4% compared to January. Although passenger markets have shown some growth relative to the start of 2011 – about 2% – the trend has been soft and volatile. Further passenger loads have fallen, showing that passenger demand is outpacing airlines' ability to adjust capacity accordingly. In terms of premium traffic, it declined substantially in October – consistent with weaker trade and confidence indicators.
It is clear from the IATA data that passenger and freight volumes have dropped
Figure 7: Premium/economy traffic growth
-30
-25
-20
-15
-10
-5
0
5
10
15
20
25
Nov-06 May-07 Nov-07 May-08 Nov-08 May-09 Nov-09 May-10 Nov-10 May-11 Nov-11
% g
row
th y
oy
First/Business Economy Source: Davy; IATA
Figure 8: Passenger/freight traffic
-30%
-20%
-10%
0%
10%
20%
30%
40%
50%
Jan-03 Sep-03 May-04 Jan-05 Sep-05 May-06 Jan-07 Sep-07 May-08 Jan-09 Sep-09 May-10 Jan-11 Sep-11
Passenger Traffic growth (yoy) Freight growth (yoy)
Freight growth consistently negative
SARS impact
Still growth in passenger nos
Impact of volcanic ash
Source: Davy; IATA

Research Report: Davy on Airlines January 19, 2012
12 Davy Research
Rise in uncontrollable costs will prove challenging for network airlines Airlines face many uncontrollable cost increases (fuel, the APD and the EU ETS). Through various initiatives, the LCCs have demonstrated an ability to pay for higher fuel costs in weaker economic conditions. On the other hand, the network airlines are slower to adjust capacity and face significant challenges this year. Through fuel surcharges, the network airlines try to pass through fuel price increases; however, this only works in a robust economic environment. It appears that we are currently experiencing the twin evils of a weaker economic environment and stubbornly high oil prices. In particular, we feel that the combination of the APD and the EU ETS will make it very difficult for IAG to continue to increase yields to recoup the increase in fuel costs.
Fuel remains stubbornly high, even as network airlines' operating profit declines
Fuel prices remain stubbornly high in euro and sterling terms. This could prove very challenging for the network airlines. As hedges roll over, we estimate that there will still be double-digit percentage unit fuel increases for most of the airlines. This could squeeze network airlines' profits for perhaps a more prolonged period of time than during the 2008/2009 cycle. However, the impact on profits is likely to be less severe if supply is corrected.
Table 10: FY 2012 unit fuel cost increase (yoy)
Aer Lingus 13%
Air France-KLM 9%
IAG 14%
Lufthansa 11%
easyJet 19%
Ryanair 10%
Source: Davy
Profits could be squeezed for longer than during the 2008/2009 cycle for the network airlines
Figure 9: Jet kerosene ($) per metric tonne
600
700
800
900
1000
1100
1200
Dec 2009 Mar 2010 Jun 2010 Sep 2010 Dec 2010 Mar 2011 Jun 2011 Sep 2011 Dec 2011
-10%
Source: Davy; Bloomberg
Figure 10: Jet kerosene (£) per metric tonne
375
425
475
525
575
625
675
725
Dec 2009 Mar 2010 Jun 2010 Sep 2010 Dec 2010 Mar 2011 Jun 2011 Sep 2011 Dec 2011
-4%
Source: Davy; Bloomberg

Research Report: Davy on Airlines January 19, 2012
13 Davy Research
During the 2008/2009 economic downturn, the airline industry was helped significantly by the rapid decrease in the price of fuel. Brent crude peaked at $145/barrel on July 14th 2008 and was trading in the mid-$60-70 range by December. In contrast, there has not been any significant decrease in oil prices over the last couple of months. This implies that there could be a very significant impact on operating profits. As the network airlines continue to try to pass on the cost of fuel, the elasticity of demand will likely be reached and load factors or yield will fall (as has been seen in previous cycles). In the last cycle, fuel prices had already begun to fall, placing only a temporary squeeze on airlines' operating profit; this time, however, fuel is not falling. On top of this, the airlines also have to pass on APD and EU ETS costs. Early indicators already point to deteriorating premium traffic and intercontinental economy volume growth. The operating profits of the network airlines started to decline in Q3 relative to the previous year (Q3 IAG -31%, Lufthansa -27%, Air France-KLM -31%). We have seen falling volumes and declines in load factors (see below). Although supply is adjusting somewhat to suppressed demand, it is difficult to envisage a scenario in which the networks have pricing power.
Adding new capacity in a lower demand environment limits pricing power and the ability to pass on higher costs such as fuel
Figure 11: Jet kerosene (€) per metric tonne
375
425
475
525
575
625
675
725
775
825
875
Dec 2009 Mar 2010 Jun 2010 Sep 2010 Dec 2010 Mar 2011 Jun 2011 Sep 2011 Dec 2011
2%
Source: Davy; Bloomberg
Figure 12: Rebased currency impact on jet kerosene
0.90
1.00
1.10
1.20
1.30
1.40
1.50
1.60
1.70
1.80
1.90
Dec 09 Mar 10 Jun 10 Sep 10 Dec 10 Mar 11 Jun 11 Sep 11 Dec 11
Jet Kerosene pmt ($) Jet Kerosense pmt (€) Jet Kerosense pmt (£ ) Source: Davy; Bloomberg

Research Report: Davy on Airlines January 19, 2012
14 Davy Research
Figure 13: Association of European Airlines – supply versus demand
-20
-10
0
10
20
30
2004 2005 2006 2007 2008 2009 2010 2011
Demand exceeding supply
Supply adjusting to suppressed demand
Source: Association of European Airlines; Davy
During the 2008/2009 cycle, oil eventually decreased, offering some relief. However, this has not occurred in the current scenario, placing continued pressure on the network airlines' profits. The network airlines may lose a year (perhaps even longer) in paying for oil in this economic environment.
Figure 14: In the last oil spike, sustained yield increase by BA had a toll on load factor
-20%
-15%
-10%
-5%
0%
5%
10%
15%
20%
25%
Q1 2007 Q3 2007 Q1 2008 Q3 2008 Q1 2009 Q3 2009 Q1 2010 Q3 2010
-5
-4
-3
-2
-1
0
1
2
3
Yield (lfs) Change in load factor (rhs)
• Sustained yield increases begins• Load factor starts to drop• Brent crude makes a sustained break above $100/bbl
Source: Davy; BA
Figure 15: In the last oil spike, sustained yield increase by Air France-KLM had a toll on load factor
-3
-2
-1
0
1
2
3
4
Q4 2010Q2 2010Q4 2009Q2 2009Q4 2008Q2 2008Q4 2007Q2 2007
-20%
-15%
-10%
-5%
0%
5%
10%
15%
20%
Change in load factor (rhs) Yield (lhs)
LF 75.5%
Continued yield increases
Source: Davy; Air France-KLM

Research Report: Davy on Airlines January 19, 2012
15 Davy Research
Figure 18: BA operating income versus Brent
FY H2 2009FY H1 2009FY H2 2008FY H1 2008FY H2 2007FY H1 2007
0
20
40
60
80
100
120
140
BA (£, rhs) Brent Crude ($, lhs)
Source: Davy; Bloomberg
Figure 16: Air France-KLM operating income versus Brent
-100
0
100
200
300
400
500
600
700
800
Q3 2008Q2 2008Q1 2008Q4 2007Q3 2007Q2 2007Q1 2007Q4 2006Q3 2006Q2 2006
0
20
40
60
80
100
120
140
160
AF KL M Op income (€, rhs ) Brent Crude ($, lhs )
Source: Davy; Bloomberg
Figure 17: Lufthansa operating income versus Brent
0
100
200
300
400
500
600
Q3 2008Q2 2008Q1 2008Q4 2007Q3 2007Q2 2007Q1 2007Q4 2006Q3 2006Q2 2006
0
20
40
60
80
100
120
140
160
L ufthansa Op income (€, rhs ) B rent Crude ($, lhs )
Source: Davy; Bloomberg

Research Report: Davy on Airlines January 19, 2012
16 Davy Research
Effects of the UK APD
The UK APD is due to increase as of April 2012 (rates shown below). Assuming that demand levels stay constant, we have estimated the potential gains airlines could have made if, instead of the tax increase, they had increased yields by the same amount. We have performed this analysis on the airlines that have a significant proportion of their overall passengers departing from the UK.
Table 11: Increase in UK APD
Miles from UK Reduced rate (in lowest class of travel)*
Standard rate (in other than lowest class of travel)*
Band A (0-2000) £12 (£13) £24 (£26)
Band B (2001-4000) £60 (£65) £120 (£130)
Band C (4001-6000) £75 (£82) £150 (£164)
Band D (over 6000) £85 (£93) £170 (£186)
*Bracketed rates apply from April 2012 Source: HM Treasury
IAG is the airline that is most significantly affected by the increase in APD due to the proportion of its passengers that fly standard (i.e. premium) and the proportion of its passengers that fly long haul. Obviously, Ryanair and easyJet are only short-haul, low-cost economy.
Table 12: Impact of UK APD on airlines' profits – full-year run rate
Impact of APD increase 2012 (£m) As a proportion of FY2012E earnings
Ryanair 23.0 6%
easyJet 24.6 15%
IAG 52.5 40%
Source: Davy; company reports; HM Treasury
EU ETS has greater impact on the network airlines
The aviation industry has been included in the EU ETS as of 2012, having to surrender allowances for 2012 carbon emissions by April 2013. Any emissions in excess of the allotted carbon allowances can be purchased in the open market. IATA estimates that the annual industry-wide cost of the ETS will be c.€900m this year and will rise to €2.8bn by 2020. Based on company comments, estimates of the impact on the airlines under coverage are provided below. In order to recoup any of this cost, many airlines are adding surcharges.
Ryanair announced the introduction of a €0.25 levy to cover the cost of the carbon permits needed.
Lufthansa has said that it will add the costs of the EU ETS to its existing fuel surcharges. It will need to buy c.35% of permits in 2012 from the market.
Delta, American Airlines and US Airways have all added a $3 surcharge each way on flights between Europe and the US.
Networks will bear the brunt of tax increases
Table 13: EU ETS cost
easyJet £10.5m
IAG €90m
Lufthansa €130m
Ryanair €19m
Source: Davy; company reports

Research Report: Davy on Airlines January 19, 2012
17 Davy Research
Second wave of consolidation should benefit specific players We believe that a second wave of consolidation is underway as revenue pressure resumes (this aspect is dealt with in more detail later in this report in our discussion of each airline). Greater consolidation is part of the wider theme that necessitates the need for industry right-sizing in order to safeguard profitability. If IAG receives regulatory approval to purchase bmi with its 56
Heathrow slots, it will increase its dominant position from the current c.44% control of Heathrow slots to c.53%. As stated in our previous issue of Davy on Airlines ("Virtual airline mergers; implications of the consolidation of the North Atlantic", issued October 4th 2011), hub dominance is a long-term positive.
Etihad has taken a 29.2% equity stake in Air Berlin, which gives Etihad increased access to European airports (most notably German airports, which currently have restricted access). The deal gives Etihad access through Air Berlin to Berlin, with rival Emirates restricted to the four German cities of Hamburg, Frankfurt, Munich and Dusseldorf (Emirates has been pushing for landing slots in Berlin and Stuttgart).
Given the tough operating environment, further consolidation in the form of strategic partnerships or take-out could occur. Potential targets are Aer Lingus and TAP.
The CDS spreads for European airlines below (notably SAS) imply some form of further consolidation.
More consolidation is part of the wider theme that necessitates the need for industry right-sizing in order to safeguard profitability
Figure 19: Airlines CDS spreads
0
200
400
600
800
1000
1200
1400
1600
1800
Jan 10 Apr 10 Jul 10 Oct 10 Jan 11 Apr 11 Jul 11 Oct 11
SAS Societe Air France Lufthansa British Airways
Source: Davy; Bloomberg

Research Report: Davy on Airlines January 19, 2012
18 Davy Research
Middle East airlines moving into Europe
The recent move by Etihad to take a 29.2% stake in Air Berlin shows that Middle Eastern airlines continue to find ways into Europe. The Middle Eastern Airlines, dubbed by some the 'Super Connectors', have a business model that focuses on using new, large, lower unit-cost aircraft to service connecting traffic via the Middle East. This can make sense for European traffic heading to the East, especially to South East Asia. The Middle Eastern hubs will act as a gateway to Asia, the Middle East, the Indian subcontinent and Australia.
Figure 20: Etihad and Air Berlin route map
Source: SRS Analyser; Davy *Legend: Light grey is Air Berlin; dark grey is Etihad
The Middle Eastern Airlines have thus far placed a significant number of routes into Europe in order to capture transfer traffic. For example, Emirates recently launched a daily service to Dublin. Qatar, Etihad and Emirates fly over 640 operations per week from Western Europe to the Middle East, including 120 services per week from Germany.
Figure 21: Routes by Qatar, Emirates and Etihad to Western Europe
Source: SRS Analyser

Research Report: Davy on Airlines January 19, 2012
19 Davy Research
Qatar, Etihad and Emirates have very strong order books for wide-body aircraft, which will likely lead to a trebling of their fleet size. We would expect this to continue to put pressure on the European network airlines' routes to the East. When the orders are delivered, this will result in a fleet size that is 30% larger than the estimated wide-body fleet size of the three major European network airlines combined.
Middle Eastern airlines' fleet size is likely to triple in size and could be at least 30% larger than the European network fleet size
Table 14: Boeing aircraft for airlines in Middle East
Order In service Options
777 787 747 777 747 777 787 747
Emirates 92 5 94 9 20 0 10
Qatar 14 30 0 28 0 1 30 0
Etihad 12 41 0 8 0 7 25 0
Total 118 71 5 130 9 28 55 10
Source: Davy; Bloomberg; company
Table 15: Airbus aircraft for airlines in Middle East
Airbus Order In service Options
A380 A350 A380 A340 A330 A300 A380 A350
Qatar 10 80 0 4 29 3 3 0
Emirates 72 70 16 18 27 0 0 20
Etihad 10 25 0 11 22 2 5 10
Total 92 175 16 33 78 5 8 30
Source: Davy; Bloomberg; company

Research Report: Davy on Airlines January 19, 2012
20 Davy Research
Stock views Valuations are low but earnings at risk for networks; LCCs remain attractive
While we look at absolute and relative valuations for the airlines, earnings momentum remains key. As we have already outlined, we still see this as vulnerable for the networks. Our price targets and ratings are provided in Table 18. We examine various valuation methodologies, including DCF valuation, forward P/E, EV/EBITDAR and replacement value for the LCCs and forward EV/EBITDAR, P/E, replacement value and SOTP for the networks. In some cases, given the macro uncertainty, we apply discounts to our price targets. Our over-riding view is that the LCCs are sector relative outperformers and that the networks are sector relative underperformers. We believe the networks will continue to struggle in the current macro environment. However, it is worth pointing out that the leading networks (particularly IAG and Air France-KLM) have multiple upside over the medium term if and when they deliver on their business plans in a more favourable macro environment.
Table 16: Network peer comparison (€m)
Aer Lingus Air France-KLM IAG Lufthansa
2011 2012 2013 2011 2012 2013 2011 2012 2013 2011 2012 2013
Market cap 338.9 338.9 338.9 1344.3 1344.3 1344.3 3511.9 3511.9 3511.9 4383.5 4383.5 4383.5
Net balance sheet debt -376.3 -486.4 -557.9 6549.6 6758.9 6483.4 860.2 1291.4 2017.8 1517.3 1778.5 1860.7
Off-balance sheet 349.0 357.9 367.0 5895.7 6072.6 6254.7 2793.0 2876.8 2963.1 1396.4 1382.4 1368.6
Pension liability 0.0 0.0 0.0 0 0 0 2976.2 2777.8 2579.4 2371.0 2389.2 2189.2
Adjusted EV 311.6 210.4 148.0 13789.7 13975.8 14132.4 10341.3 10657.9 11272.1 9668.2 9933.5 9802.0
Revenue 1298.0 1362.2 1398.5 24325.3 25116.6 26207.3 16426.6 17356.0 18247.8 29562.8 30829.1 32543.4
EBITDAR 184.9 203.0 216.7 2150.5 2043.7 2653.2 1877.5 1756.8 1952.5 2565.6 2473.6 2647.5
P/E 7.8 6.0 5.0 -1.8 -2.1 -6.3 10.6 24.7 16.4 11.0 17.0 11.2
EV/sales 0.2 0.2 0.1 0.6 0.6 0.5 0.6 0.6 0.6 0.3 0.3 0.3
EV/EBITDAR 1.7 1.0 0.7 6.4 6.8 5.3 5.5 `6.1 5.8 3.8 4.0 3.7
Price/book 0.4 0.4 0.4 0.2 0.2 0.2 0.7 0.7 0.7 0.5 0.5 0.4
Net debt/EBITDAR -0.15 -0.63 -0.88 5.8 6.3 4.8 1.9 2.4 2.6 1.1 1.3 1.2
Net debt/capital -2.9% -14.3% -21.1% 52.0% 53.9% 54.1% 31.1% 34.1% 38.1% 16.0% 17.1% 17.3%
Free cash flow 56.0 110.1 71.5 -488.6 -209.3 275.5 34.8 -431.2 -726.3 78.7 -261.1 -82.3
Source: Davy
Stocks' ranking of preference LCCs (Ryanair and easyJet) preferred
Aer Lingus – very cheap but still waiting for value crystallisation
Lufthansa – exposed but low valuation and good balance sheet
IAG – sound strategy but big 2012 headwinds
Air France-KLM – strained balance sheet
Our over-riding view is that the LCCs are sector relative outperformers and that the networks are sector relative underperformers

Research Report: Davy on Airlines January 19, 2012
21 Davy Research
Table 17: LCC peer comparison
easyJet (£m) Ryanair (€m)
2011 2012 2013 2011 2012 2013
Market cap 1732 1732 1732 5713.6 5713.6 5713.6
Net balance sheet debt -100.0 113.2 77.6 150.0 -540.1 -1430.4
Off-balance sheet 763 571.2 591.528 616.9 601.0 534.4
Pension liability 0.0 0.0 0.0 0.0 0.0 0.0
Adjusted EV 2395.3 2416.7 2401.4 6366.5 5660.5 4703.6
Revenue 3452.0 3780.5 4009.8 4274.1 4680.1 5068.5
EBITDAR 468.0 424.8 449.6 996.7 993.8 1063.6
P/E 7.8 10.7 9.7 12.3 12.1 10.3
EV/sales 0.7 0.6 0.6 1.5 1.2 0.9
EV/EBITDAR 5.1 5.7 5.3 6.4 5.7 4.4
Price/book 1.0 1.0 1.0 1.7 1.5 1.3
Net debt/EBITDAR 1.4 1.6 1.5 0.8 0.1 -0.8
Net debt/capital 23.6% 24.4% 22.8% 16.2% 1.3% -21.8%
Free cash flow -57.0 -213.2 35.6 558.8 690.1 890.4
Source: Davy
Table 18: Ratings and price targets
Rating Price target
Airline Old New Old New
Aer Lingus Outperform Neutral €1.00 €0.75
Air France-KLM Neutral Underperform €7 €3.8
easyJet Outperform Outperform £4.75 £4.75
IAG Neutral Underperform 230c/200p 140c/115p
Lufthansa Neutral Neutral €12 €9
Ryanair Outperform Outperform €4.5 €5.0
Source: Davy
Table 19: Valuation methods and price targets
easyJet (£) Ryanair (€) Aer Lingus (€) Lufthansa (€) Air France-KLM (€) IAG (€)
DCF 4.1 5.4 - - - -
Forward P/E/mid cycle 5.0 4.5 - - - 1.27
EV/EBITDAR 4 5.0 1.4 9.2 - 1.60
Replacement value 5.9 3.5 1.8 7.2 5.3 0.7
SOTP - - - 11.6 - -
Current stock price 4.04 3.87 0.64 9.6 4.5 1.89
Undiscounted stock price 4.73 4.60 1.50 9.3 n/a 1.43
Discount for economic/ pension/liquidity uncertainty
0.0% 0.0% 50.0% 0.0% n/a 5.0%
Price target 4.75 5.0 0.75 9.0 3.8 1.4
% change 18% 29% 17% -6% -16% -26%
Source: Davy

Research Report: Davy on Airlines January 19, 2012
22 Davy Research
Table 20: 2012 EV/EBITDAR
Valuation multiples 2012 (£/€) Ryanair easyJet IAG Air France KLM
Lufthansa Aer Lingus
EBITDAR 993.8 424.8 1757 2043.7 2474 203.0
Multiple 7.5 6 5.5 4.0 4.0 3.0
Enterprise value 7454 2549 9662 8175 9894 609
Deduct adjusted net debt 60.9 684.4 4168 12831 3160.9 -128.5
Deduct pension liability 0 0 2778 0 2389.2 0
Minorities 0 0 0 0 0 0
Add investments 103 0 483 853 668 0
Market value 7496 1864 3200 -3804 5013 737
Shares (m) 1480.2 433 2051 300 460.5 530
Per share value 5.06 4.31 1.56 n/a 10.89 1.39
Current price 3.87 4.04 1.89 4.50 9.6 0.64
Current EV/EBITDAR multiple 6.4 5.7 6.1 6.8 4.0 1.01
Source: Davy
The following scatter graphs for our 2012 numbers clearly show the LCCs at a valuation premium. However, the operating and financial positions are superior and in most cases justify an even higher premium. Earnings momentum remains positive for the LCCs and negative for the networks.
LCCs' operating and financial positions are superior and in most cases justify an even higher premium
Figure 22: EV/EBITDAR compared to EBITDAR margins
Ryanair
Ryanair ex potential div
easyJet
easyJet ex special div
Lufthansa
Air France KLMIAG
Aer LingusAverage
0%
5%
10%
15%
20%
25%
0.0 1.0 2.0 3.0 4.0 5.0 6.0 7.0 8.0
EV/EBITDAR 2012E
EBIT
DA
R m
argi
n 20
12E
Favourable
Unfavourable
Source: Davy
Figure 23: EV/IC compared to ROIC
Average
Aer Lingus
IAG
Air France KLM
Lufthansa
easyJet ex special div
easyJet
Ryanair ex potential div
Ryanair
-2%
0%
2%
4%
6%
8%
10%
12%
14%
16%
0.0 0.2 0.4 0.6 0.8 1.0 1.2 1.4
EV/IC 2012F
ROIC
201
2F
Favourable
Unfavourable
Source: Davy

Research Report: Davy on Airlines January 19, 2012
23 Davy Research
We examine each of the airlines separately in the pages that follow.
Figure 24: Price/book compared to ROE
RyanairRyanair ex potential
diveasyJeteasyJet ex special
div
Lufthansa
Air France KLM
IAG
Aer Lingus
Average
-15%
-10%
-5%
0%
5%
10%
15%
0.0 0.2 0.4 0.6 0.8 1.0 1.2 1.4 1.6
Price/Book 2012F
ROE
2012
F
Favourable
Unfavourable
Source: Davy
Figure 25: Operating margin compared to EV/Sales
RyanairRyanair ex potential
div
easyJeteasyJet ex special div
Lufthansa
Air France KLM
IAG
Aer Lingus Average
-4%
-2%
0%
2%
4%
6%
8%
10%
12%
14%
0.0 0.2 0.4 0.6 0.8 1.0 1.2 1.4EV/Sales 2012F
Op
Mar
gin
2012
F
Favourable
Unfavourable
Source: Davy

Research Report: Davy on Airlines January 19, 2012
24 Davy Research
easyJet – special dividends and business focus
Next catalyst – Q1 IMS January 26th; capital markets day January 31st While easyJet has some cost headwinds into 2012, we see it as a sector outperformer due to the following factors: wasyJet generates £400m in free cash flow (pre-capex). As capex slows,
we believe that this will be returned to shareholders in the form of special dividends similar to the £150m being paid in March 2012. Taken together with the ordinary dividend, total cash returns of £195m or 45.4p per share will be paid on March 23rd 2012 to those shareholders on the register at the close of business on March 2nd with an ex-dividend date of February 29th.
Slower capacity growth has the added benefit of allowing more active management of fares. This will help to offset increasing costs, enhancing margins and returns. Capacity for the first half of the year will be flat with growth of around 4% for the full year. The Q1 IMS statement should be helped by easy comparables – there was double- digit growth in capacity last winter with significant capacity investments (e.g. +32% in France). The CEO has bedded down strategy and has implemented fee and charges increases. Ancillary revenues should grow significantly for the next three quarters.
easyJet is well placed to attract business and consumer traffic down-trading from network airlines in a difficult environment. Its business offering is enhanced by the launch of its 'Flexi-fare' product. easyJet's goal is to drive an additional contribution of £100m from passengers travelling on business through delivering improvements in product and distribution. Yields could be helped with even limited penetration in 'Flexi-fares'. Yields should also be aided by the fact that 84% of easyJet's airports are slot constrained, e.g. Milan, Paris, Gatwick, Geneva, Lisbon.
Table 21: Potential flexi-fare penetration
Flexi-fare penetration 0% 0.5% 1.0% 1.5% 2.0% 5.0% 10.0%
Average fare (£) 50 50.8 51.5 52.3 53 57.5 65
Increase from base fare 0.0% 1.5% 3.0% 4.5% 6.0% 15.0% 30.0%
Absolute incremental (£m) 0 42 84 126 168 420 840
Source: Davy
The capital markets day will allow members of easyJet's senior management team to present the group's strategy overview and implementation. Recent results from easyJet have been positive, with higher unit revenue helped by the maturing of capacity investments and the optimisation of fees and charges offsetting unit cost rises. For FY2011, ROCE at 12.7% was above its medium-term target.
easyJet positive catalysts
Cash returns – 11.5% dividend yield paid in March
CEO embedded strategy to illustrate at capital markets day
Higher fees and charges leading to strong ancillaries
Flat capacity – easy Q1 comps
Potential business traffic revenue kicker

Research Report: Davy on Airlines January 19, 2012
25 Davy Research
easyJet's last comment in November indicated that forward bookings were in line with last year and that 45% of winter seats were booked; first-half unit revenue per seat at constant currency is expected to be up by mid-single-digits. Costs per seat are expected to grow 2-3% for the full year and by 4% in H1, driven by price increases at regulated airports (costs creep is something to watch out for at easyJet) and investments in new revenue streams. The fuel headwind is £220m (currently marking to market, this may be c.£4m higher). The Q1 load performance continues to be very positive – the December number (stripping out weather) was one percentage point above that of last year. We expect easyJet to be positive on the revenue front for FY2012, albeit H1 is loss-making (we assume £219.2m) and H2 profitable (we assume £439.2m). Cost comps leave FY2012 PBT slightly below last year (£220.2m versus £248m). A strong winter implies upward bias for forecasts, albeit the summer will be key to easyJet's forecasts. We continue to rate easyJet 'outperform' with a £4.75 price target, supported by its special dividend, and trading at two-thirds of its replacement value.
Figure 26: easyJet profit bridge
0
50
100
150
200
250
300
350
400
450
FY 11 PBT Unit costs Vol/ yield uplift Ancillary EU ETS Fuel costs FY12 PBT Consensus
£248m -£47m
£100m
£105m -£10.5m -£176.5m
£220m £213m
Source: Davy

Research Report: Davy on Airlines January 19, 2012
26 Davy Research
Ryanair – cash machine to be further illustrated in 2012
Next catalyst – Q3 results January 30th
We continue to see Ryanair as a sector relative outperformer. Ryanair generates c.€1bn in free cash flow annually pre-capex. In the
absence of a new aircraft deal and little or no debt on the balance sheet, a significant portion of this could be returned to shareholders in the form of special dividends similar to the €500m returned in 2011. Ryanair's balance sheet remains one of the strongest in the industry with €3.1bn in cash despite returning €931m to shareholders over the past three years. The group's interim results showed the cash generation with net debt reduced from €709m to €372m despite another €85m share buyback.
Slower growth in capacity will result in greater ability to actively manage yields upwards, which will help to offset cost increases and enhance margins. We believe that the grounding of 80 aircraft this winter will significantly help yields. Indeed, December traffic fell 5% following a 7.5% decline in November. Further, the benign winter weather – particularly relative to last December – should be a positive for leisure-orientated airlines. Winter discounting (e.g. £9.99) appears more benign than in previous years.
Ryanair will continue to grow high-margin ancillary revenues, harvesting its 80m passengers. We note that the group has increased online bag fees by €5 to €25 for the peak months of June, July, August and September as well as Christmas. Ryanair has also rolled out reserved seating for the front two rows and the over-wing exit rows for a cost of €10 per seat. Given these changes, the revenue per passenger increase from FY2012 to FY2013 does not look strained.
Ryanair positive catalysts Potential for real pricing power
Huge cash generation likely returned in some form to shareholders
Further cost take-out through airport deals
Figure 27: Ryanair revenue per passenger profit bridge
55
55.5
56
56.5
57
57.5
58
58.5
59
59.5
FY 12 rev per paxest
Bag charge Reserve seating Ancillary Yield EU-ETS Surcharge FY 13 rev per paxest
€56.6
€0.95
€0.90€0.10
€0.25
€59.00€0.20
Source: Davy

Research Report: Davy on Airlines January 19, 2012
27 Davy Research
We see little aggressive discounting in short haul, which is not surprising given that Ryanair leads the market. Overall – based on the limited level of winter discounting, benign weather, trading down and capacity discipline – we are moving up our estimates by slightly over 5% from net income of €443m to €467m for FY2012, pushing up our FY2013 estimates by similar amounts to €473.9m (or 32c). This assumes yields approaching the c.16.5% yoy increases achieved in Q2. This would imply only very modest losses in Q3 (-€2.5m) and the loss in Q4 curtailed to c.€74m. Ryanair's market-leading position in the low-cost sector – it now has 50 bases – and its industry-leading low costs leave it very well placed. With the competitive environment very weak, airport opportunities are abundant — look for example at recent base deals at Wroclaw, Palma, Baden-Baden, Manchester, Billund and Paphos. These bases imply a strong level of revenue as we head into the summer schedule. The positive unit revenue performance shows the benefits of the Southwest-type model of slowing growth and rising unit revenue, even in a weak European economic environment. It has also delivered a stellar cost performance (unit costs ex-fuel, sector length adjusted flat in the last six months). Recent airport deals are likely to further illustrate the cost leadership of the business model. With a business whose DNA is built for a recession, we reiterate our 'outperform' rating. With positive earnings momentum, we are raising our price target to €5 (from €4.5).
We are moving up our estimates by slightly over 5% from net income of €443m to €467m for FY2012, pushing up our FY2013 estimates by similar amounts to €474.9m (or 32c)
We reiterate our 'outperform' rating and raise our price target to €5 (from €4.5)
Figure 28: Ryanair profit bridge
0
100
200
300
400
500
600
700
800
FY2012e netincome
Volume uplift Ancillaries Yield Fuel Unit costs FY2013e netincome
Consensus
€467m
€22m
-€160m€173m
-€61.2m
€474m
€34m
€472m
Source: Davy
Research Report: Davy on Airlines January 19, 2012
28 Davy Research
Aer Lingus – needs to break out from 'value trap' in 2012
Next catalyst – full-year results February 28th Aer Lingus has always looked cheap on valuation metrics but, for a variety of reasons (liquidity, economic, pensions), has failed to perform from a share price perspective. The Q3 results were strong, and Aer Lingus provided guidance that the full-year 2011 operating result (before exceptional items) would be at the upper end of the range of market expectations. At that time, we adjusted our FY results – raising operating profit upwards to €45m. Management indicated that it was too early to provide detailed guidance for 2012. It stated that the primary factors likely to influence trading performance are an expected slowdown in yield growth momentum, low-single-digit passenger volume increases and higher fuel costs. Two strategic issues discussed at the airline's investor day in September remain unresolved: the multi-employer pension deficit, which has clearly increased
significantly since the €400m actuarial deficit valuation in March; ownership structure. Management indicated that it is bound by the IPO prospectus on the former and therefore has no obligation to increase contributions – any change would require shareholder approval. The trustees continue to look for a solution. In relation to the shareholder structure, management continues to see a priority to expand the free float. We continue to believe that management has done an excellent job in repositioning the business as a network airline with a lower-cost structure. However, legacy issues – chief among which is the pension fund – will need to be resolved, but that should clear the path to potentially selling the government's 25% stake. The granting by the UK Court of Appeal of a stay on the investigation by the UK Office of Fair Trading into Ryanair's minority shareholding in Aer Lingus clearly delays any decision here. It is not clear whether there will be any trade buyer interest as the two leading candidates, IAG and Etihad (through investments in bmi and Air Berlin), appear to be looking elsewhere. A potential trade investor would almost certainly not take any pension deficit exposure and is likely to be largely interested in the transatlantic business and the Heathrow slots. We believe that restrictions on Heathrow slots should be removed, and we are in agreement with the Report of the Review Group on State Assets and Liabilities (April 2011) that "Heathrow slots would be deployed to their optimal use in the absence of restrictions" and "it is not plausible that Dublin-Heathrow would be under-served should slot allocation be left to market forces". Other global gateways such as Dubai are in many cases usurping Heathrow anyhow.
What Aer Lingus needs to do to break out from 'value trap' Remove pension risk as an issue
Increase liquidity
Use excess cash for special dividend
Consider strategic partnership

Research Report: Davy on Airlines January 19, 2012
29 Davy Research
We also note the passing in November of a resolution for a capital allocation – we believe some of Aer Lingus' excess cash should be used for special dividends. We do not see the Aer Lingus shares outperforming without a resolution of the pension issue and are sceptical of it gaining a trade buyer in 2012. Pending more clarity on both of these issues, we reduce our rating to 'neutral' and our price target to €0.75. The catalyst for a change in the airline's rating would be news on liquidity, a trade buyer and pension and/or dividend payments. There is value in Aer Lingus, but a logjam has to be cleared in order to crystallise this value.
We reduce our rating to 'neutral' and our price target to €0.75
Figure 29: Aer Lingus profit bridge
0
10
20
30
40
50
60
70
FY2011e opresult
Unit costs Greenfield Fuel Underlyingyield / vol
Ancillary FY2012e opresult
Consensus
€45m
€17m
-€6m
€-37m
€26m€44m
€17m €62m
Source: Davy

Research Report: Davy on Airlines January 19, 2012
30 Davy Research
IAG – constrained by capex and cash flow
Next catalyst – full-year results February 29th We have short-term concerns regarding IAG and see it as a sector underperformer in the current environment. We are changing its rating from 'neutral' to 'underperform' for the following reasons: IAG has c.10% premium traffic (c.45% of passenger revenue). This is
clearly exposed to any downturn. Premium traffic tends to lag business confidence (PMIs) by three to six months. The gap between its premium and non-premium volumes continues to narrow. Of its corporate contracted revenue, banking, professional and other services (e.g. telcos) represents 63%. These sectors are under pressure.
On the transatlantic, where it leads and has 31% of its traffic exposure, the majority point-of-sale is Europe (55% of long-haul point-of-sale is UK/Spain/rest of Europe). Further, IAG's North American partner in the revenue-sharing joint venture is in bankruptcy. While the American bankruptcy will not have any direct financial effects and should result in a leaner airline, consumer sentiment is unlikely to be positive.
We believe the increase in UK APD, which is due to occur in April 2012, should have a significant impact on IAG and make it more difficult to recoup fuel costs. We estimate that the APD increase will account for c.40% of FY2012 profits (if the tax was instead a yield increase, it would raise profits by c.40%).
Further earnings pressure could come from industrial relations problems in Iberia (pilots are out of contract and there were two strikes over the Christmas period and more in January related to the creation of Iberia Express).
Potential acquisitions such as bmi will take time to embed and enhance value. In Latin America, the creation of LATAM (merger of TAM and LAN Chile) could potentially see LAN Chile leave the oneworld alliance for Star. IAG probably also needs to expand its exposure to higher growth emerging markets (it has expressed interest in TAP), including Asia.
While net debt to capital is relatively low (c.31.1%), a high level of capital expenditure to renew the long-haul fleet should see this rise, and we expect IAG to be free cash flow negative in 2012 and 2013. While the recovery plan is on track, the pension deficit remains at c. £2.5bn with a review due in March 2012.
We believe that IAG and its management team are visionary and have ambitious targets. This could result in material profit and, as such, improved stock performance in the coming years in a better economic environment. The problem, however, is that we continue to see a "risk-off" trade for the networks. IAG's targets are set very far into the future, and it faces significant short-term challenges that are likely to result in lower profits in 2012 and further downside risk to estimates.
IAG long-term story but short-term challenges Cost headwinds in 2012
Negative free cash flow in 2012-2013
Complete and restructure bmi
Iberia competitive and industrial relations position challenging
Premium traffic at risk
Pension review in 2012

Research Report: Davy on Airlines January 19, 2012
31 Davy Research
At its inaugural capital markets day (November 11th), IAG indicated the following: It is targeting an operating profit improvement of c.€1.5bn in 2015
(assuming oil up to the $120 per barrel range), achieved through an increase from €400m to €450m in annual synergy targets from year-five, structural profit improvements of €400m and organic growth of €150m. Its goal is to deliver a 12% return on capital employed by 2015.
Specific areas of financial benefit include the creation of Iberia Express (at least €100m) and hub improvements at Madrid Barajas (at least €100m).
From a 2010 base, the company expects the optimisation of the transatlantic joint business with American Airlines to deliver at least €150m.
It is planning a capital expenditure programme of €1.1bn in 2011, €1.6bn in 2012, €2.0bn in 2013, €1.35bn in 2014 and €1.6bn in 2015 with a target of free cash generation in aggregate between 2012 and 2015.
There will be cost efficiency gains of c.€250m from the introduction of new aircraft into the fleet.
It is looking for an organic capacity growth rate of 2.5% per annum up to 2015.
It expects EU emissions trading costs of €90m in year one of the scheme at current carbon prices.
For FY2012, the company expects c.14% growth in unit fuel costs and unit costs ex-fuel to be flat. It plans to grow capacity by 2.5%.
Since the capital markets day, IAG has announced that it has reached a binding agreement with Lufthansa to sell bmi. The specifics of this deal include: a gross price of £172.5m with a significant reduction if Lufthansa does
not opt to sell bmibaby before completion; IAG's Heathrow slot portfolio to increase by up to 56 additional slot
pairs – BA currently has c.44% of Heathrow slots; earnings per share (EPS) to be accretive by 2014 at the latest and
IAG's 2015 operating profit target to increase by more than €100m with a consequent increase in EPS;
restructuring costs spread over three years and significantly lower in total than bmi's current annual losses;
deal subject to competition clearance; We think that this could be a great deal for IAG in the longer term if it can turn bmi around – IAG sees significant room for unit cost reduction and unit revenue improvement. In our previous issue of Davy on Airlines ("Virtual airline mergers; implications of the consolidation of the North Atlantic", issued October 4th), we outlined that home hub dominance is a positive long-term structural benefit bought for little cost
We found 18 routes, or 5%, of route overlap between BA and bmi. We expect the deal to be approved but with a small number of slot remedies.

Research Report: Davy on Airlines January 19, 2012
32 Davy Research
and remarkably without the pension deficits. However, the regulator may look at slot remedies to approve the deal, and bmi will not be easy to right-size given that it is perpetually loss-making. We rate IAG 'underperform' and reduce our price target to 140c/115p. In addition to more positive macro indicators, catalysts for a change in IAG's rating and for market sentiment improvement are as follows: greater clarity on the downside risk to premium (the airline currently
defines long haul premium as 'stable'); indications that Iberia Express can be a success; deliverability on targets, particularly as we get closer to its 2015 goals.
Figure 31: BA/IAG premium versus non-premium traffic growth
-50%
-40%
-30%
-20%
-10%
0%
10%
20%
30%
40%
50%
May-96
Feb-97
Nov-97
Aug-98
May-99
Feb-00
Nov-00
Aug-01
May-02
Feb-03
Nov-03
Aug-04
May-05
Feb-06
Nov-06
Aug-07
May-08
Feb-09
Nov-09
Aug-10
May-11
Premium volume growth Non-premium volume growth Source: Davy
We rate IAG a sector underperformer and reduce our price target to 140c/115p
Figure 30: IAG profit bridge
-100
0
100
200
300
400
500
600
700
FY2011e opresult
EU-ETS Yieldincrease
ATI
Yieldincreasemerger
Unit costs MENA/Japan
Vol uplift Fuel Vol uplift FY2012e opresult
Consensus
€459m -€90m€62m
€48m €26m
€8m -€673m
€356m
€100m
€331m
€296m
Source: Davy

Research Report: Davy on Airlines January 19, 2012
33 Davy Research
Lufthansa – challenges ahead in current environment
Next catalyst – full-year results March 15th Lufthansa is guiding operating profit "at the upper end of the three-digit-million euro range" for 2011. It reiterated this guidance at its Q3 results on October 27th after issuing a profit warning ahead of its September investor day. This was due to weaker-than-expected booking trends, particularly in intercontinental economy. Premium business had yet to see significant weakness.
Figure 32: Valuation is influenced by uncertainty and external events
Source: Lufthansa
In the short term, Lufthansa faces a number of cyclical and structural challenges. Our concerns, relating principally to weakness in cargo and potential weakness in the premium business, have caused us to lower our estimates. We are lowering Q4 FY2011 yields to 1.5% (previously 2.5%) and assume yield growth of 1.3% in 2012 and 1.1% in FY2013 (previously 1.1%) and a 5% decline in cargo revenue (previously flat). We now assume operating profit of €683m in FY2011 (previous €800m) but have also lowered FY2012 to €563m (previously €800m) and FY2013 to €769m (previously €1,114m). We assume that bmi is sold in Q1 2012 and adjust our 2012 operating profit to take this into account. Despite the removal of the loss-making subsidiary, pressure on the revenue line is likely to lead to a negative growth year for operating profits. Our numbers are now 10-15% below consensus. The specific issues facing the airline are: Normally representing some 25% of operating income, Lufthansa is
exposed to declining air cargo. The night-time flying ban at its hub at Frankfurt Main will also suppress profits (c.€50m in FY2012; court review in mid-March). Some restructuring of this business is likely, and we note likely restructuring at its Jade Cargo JV.
Lufthansa – challenges in 2012 Cargo weakness and night-time flying
ban at Frankfurt
Premium traffic risk
Potential long-term competition increase – Middle East, Frankfurt expansion
Continues to restructure passenger subsidiaries

Research Report: Davy on Airlines January 19, 2012
34 Davy Research
With almost 50% of long-haul passengers exposed to the premium end of the business, Lufthansa faces a potential decline in this high- yielding traffic. Winter capacity has been reduced to 4% (from 12% originally) and 3% next summer (the original plan was 9%). Despite the obvious monitoring of the market environment and utilising its flexibility as appropriate, we expect its premium share to fall back a number of percentage points in a cyclical downturn. Even in a more stable macro environment, the premium share should structurally fall as Lufthansa adds proportionally more economy seats with larger aircraft.
The proposed investment of a 29.2% stake by Etihad in Air Berlin highlights the potential for increased competition by the Gulf carriers over time. We see them as major threats to yields on long-haul Asian traffic.
The removal of loss-making subsidiary bmi is a positive, albeit the sale price is likely "clearly negative" if bmibaby is not sold pre-deal. The retention of the pension obligations of bmi (estimated to be £180m) is surprising.
The new runway at Frankfurt Main represents a medium-term growth opportunity for Lufthansa but will cause it to allocate capacity in the short term to protect its slot position here. We may see increased competitor and slot take-up in the summer schedules.
Based on these factors and the current uncertain macro environment, we see Lufthansa's share price struggling in 2012. For valuation and balance sheet reasons, we are retaining its rating as 'neutral'; in an uncertain economic environment, it will likely outperform other networks. Catalysts to change our recommendation could come from the following: further cost restructuring plans – as always, we expect Lufthansa's
Climb programme to reach its €1bn target by end-2012. There have been some indications of a potential further cost plan, including closer integration of subsidiaries, which could be announced in 2012.
significant improvement in the cargo market; successful restructuring of subsidiaries, including Austrian. We see the Lufthansa group as a robust aviation business model with a strong management team that is focused on the following: finding solutions to loss-making entities and accelerated management
cost initiatives (e.g. bmi); gaining strong market positions and significant leadership in Aviation
Services (e.g. MRO); ensuring a strong financial profile with a robust liquidity position. It
has 67% of its fleet unencumbered with a book value of €11.8bn. However, with earnings momentum still negative and the stock affected by uncertainty and external factors, we reduce our price target to €9.

Research Report: Davy on Airlines January 19, 2012
35 Davy Research
Table 22: Lufthansa passenger group forecasts
Passenger business -operating profit (€m)
Lufthansa Passenger
Airlines
Swiss bmi Austrian Germanwings SN Brussels Other Total
FY2013 251 200 0 -70 -50 0 0 331 FY
FY2012 193 200 0 -100 -50 0 0 243 FY
FY2011 291 300 -250 -70 -50 0 0 221 FY
3m -234 17 -63 -64 -44 0 -3 -391 Q1
6m -100 104 -120 -64 -46 0 -13 -239 H1
9m 161 244 -154 -34 -23 0 -25 169 Q1-Q3
FY2010 382 298 -145 -66 -39 0 6 436 FY
3m -236 1 -45 -66 -34 0 7 -373 Q1
6m -203 54 -93 -70 -39 0 9 -342 H1
9m 158 194 -90 -47 -11 0 14 218 Q1-Q3
FY2009 -107 93 -78 -31 24 0 91 -8 FY
Source: Davy; OAG Worldwide
We retain Lufthansa's rating as 'neutral but reduce our price target to €9
Figure 33: Lufthansa profit bridge
0
100
200
300
400
500
600
700
800
FY2011eop result
Japan Fuel costs Fuelsurchage
Underlyingyield / vol
Costsavings
EU ETS Cargonight
flying ban
bmi sale Non-paxbusiness
FY2012e op result
Consensus
€683m
€65m -€677m
€338m
€123m
€51m -€30m
€250m -€80m
€593m
€689m
-€130m
Source: Davy

Research Report: Davy on Airlines January 19, 2012
36 Davy Research
Table 23: Lufthansa operating forecasts (€m)
Passenger transportation
Logistics MRO IT Services Catering Service and financial
companies
Segment total
Reconciliation Group
2013F Total revenue 25,857.3 2,851.0 4,290.6 626.3 2,377.2 - 36,002.4 -3, 459.0 32,543.4 Operating result 331 171 257 21 83 -94 769 769.3 Operating margin 1.3% 6.0% 6.0% 3.3% 3.5% n/a 2.1% 2.4% 2012F Total revenue 24,355.5 2,851.0 4,165.6 608.1 2,308.0 - 34,288.1 -3,459.0 30,829.1 Operating result 244 100 250 20 81 -101 593 593.1 Operating margin 1.0% 3.5% 6.0% 3.3% 3.5% n/a 1.7% 1.9% 2011F Total revenue 23,031.4 2,962.0 4,124.4 596.1 2,308.0 - 33,021.8 -3,459.0 29,562.8 Operating result 221 207 247 18 83 -94 683 682.9 Operating margin 1.0% 7.0% 6.0% 3.0% 3.6% n/a 2.1% 0.0% 2.3% 556 2010A Total revenue 20,912.0 2,795.0 4,018.0 595 2,249.0 - 30,569.0 -3,245.0 27,324.0 EBITDA 2,610.0 445 412 45 174 3686 -1,128.0 2,558.0 EBITDA margin 12% 16% 1% 8% 8% 12% 9% Operating result 436 310 268 10 76 -226 874 2 876 Operating margin 2.1% 11.1% 6.7% 1.7% 3.4% n/a 2.9% -0.1% 3.2% 664 2009A Total revenue 16,798.0 1,951.0 3,963.0 605 2,102.0 - 25,419.0 -3,136.0 22,283.0 EBITDA 1,430.0 -28 436 54 120 2012 1,605.0 EBITDA margin 8.5% -1.4% 11.0% 8.9% 5.7% 7.9% 7.2% Operating result -8 -171 316 16 72 -134 91 39 130 Operating margin -0.05% -8.8% 8.0% 2.6% 3.4% n/a 0.4% -1.2% 0.6% 2008 Total revenue 18,393.0 2,907.0 3,717.0 657 2,325.0 - 27,999.0 -3,129.0 24,870.0 EBITDA 1,948.0 323 425 78 166 46 2,986.0 -343 2,643.0 EBITDA margin 10.6% 11.1% 11.4% 11.9% 7.1% 10.7% 10.6% Operating result 722 164 299 40 70 69 1364 -10 1,354.0 Operating margin 3.9% 5.6% 8.0% 6.1% 3.0% n/a 4.9% 0.3% 5.4% 2007 Total revenue 15,956.0 2,736.0 3,571.0 679 2,396.0 - 25,338.0 -2,918.0 22,420.0 EBITDA 2,047.0 299 406 39 167 232 3,190.0 -608 2,582.0 EBITDA margin 12.8% 10.9% 11.4% 5.7% 7.0% 12.6% 11.5% Operating result 826 136 293 23 100 53 1431 -53 1,378.0 Operating margin 5.2% 5.0% 8.2% 3.4% 4.2% n/a 5.6% 1.8% 6.1% 2006 Total revenue 13,475.0 2,845.0 3,415.0 652 2,278.0 - 22,665.0 -2,816.0 19,849.0 EBITDA 1,485.0 276 352 90 168 2,371.0 -475 1,896.0 EBITDA margin 11.0% 9.7% 10.3% 13.8% 7.4% 10.5% 16.9% 9.6% Operating result 409 82 248 49 50 52 890 -45 845 Operating margin 3.0% 2.9% 7.3% 7.5% 2.2% n/a 3.9% 1.6% 4.3% 2005 Total revenue 12,047.0 2,752.0 3,121.0 635 2,215.0 - 20,770.0 -2,705.0 18,065.0 EBITDA 1,381.0 284 364 99 17 2,145.0 -170.5 1,974.50 EBITDA margin 11.5% 10.3% 11.7% 15.6% 0.8% 10.3% 6.3% 10.9% Operating result 135 108 258 63 5 54 623 -46 577 Operating margin 1.1% 3.9% 8.3% 9.9% 0.2% n/a 3.0% 1.7% 3.2% 2004 Total revenue 11,207.0 2,469.0 3,060.0 628 2,334.0 - 19,698.0 -2,733.0 16,965.0 EBITDA 939 166 328 104 53 1,590.0 -94.8 1,495.20 EBITDA margin 8.4% 6.7% 10.7% 16.6% 2.3% 8.1% 3.5% 8.8% Operating result 265 34 205 40 -167 0 377 6 383 Operating margin 2.4% 1.4% 6.7% 6.4% -7.2% n/a 1.9% -0.2% 2.3% 2003 Total revenue 10,208.0 2,161.0 2,852.0 611 2,667.0 - 18,499.0 -2,542.0 15,957.0 EBITDA -157 177 310 95 217 642 541 1,183.0 EBITDA margin -1.5% 8.2% 10.9% 15.5% 8.1% 3.5% -21.3% 7.4% Operating result 45 -16 157 39 -215 - 10 26 36 Operating margin 0.4% -0.7% 5.5% 6.4% -8.1% n/a 0.1% -1.0% 0.2% 2002 Total revenue 10,461.2 2,350.5 2,808.3 557.4 3,075.8 - 19,253.2 -2,282.2 16,971.0 EBITDA 2,437.3 758 297.2 87.7 334.4 3,914.6 -1,986.4 1,928.2 EBITDA margin 23% 32% 11% 16% 11% 20% 87% 11% Operating result 477.6 122.5 176.4 37.1 -93.8 - 719.8 -1.8 718 Operating margin 4.6% 5.2% 6.3% 6.7% -3.0% n/a 3.7% 0.1% 4.2% 2001 Total revenue 10,632.5 2,437.6 2,834.8 478.1 2,515.4 - 18,898.4 -2,208.4 16,690.0 EBITDA 835.5 182.6 233.3 77 -223.5 1,104.9 635.7 1,740.6 EBITDA margin 7.9% 7.5% 8.2% 16.1% -8.9% 5.8% -28.8% 10.4% Operating result 31.7 41.5 130.3 19.6 -212.3 - 10.8 17.2 28 Operating margin 0.3% 1.7% 4.6% 4.1% -8.4% n/a 0.1% -0.8% 0.2%
Source: Davy

Research Report: Davy on Airlines January 19, 2012
37 Davy Research
Air France-KLM – needs to deliver on turnaround plan
Next catalyst – full-year results March 7th We see Air France-KLM remaining as a sector relative underperformer for the time being given the following: Air France-KLM is the most highly indebted company in the sector
with net debt of over €6.5bn at end-2011 and free cash flow negative in 2011. The decline in underlying profitability in 2012 will likely result in negative free cash flow pre-restructuring.
The company is highly exposed to the premium traffic market, which we believe will continue to be a declining trend in terms of both loads and yields in 2012. This could result in further margin and earnings pressure. Revenue traffic data imply unit revenue stable (passenger) to declining (cargo). This clearly illustrates, even now, that it is not covering higher fuel costs.
The turnaround plan (unveiled on January 13th) has many obstacles to implementation but needs to be delivered, in our view, given the group's indebtedness. Any delay or further revenue deterioration would likely require a rights issue.
Announces ambitious turnaround plan
On January 13th, Air France-KLM unveiled a turnaround plan to restore it to profitability. The transformation plan over three years (2012-2014) follows on the new CEO's setting out of three priorities on November 9th last: restoring competitiveness through cost-cutting, restructuring the short-haul and medium-haul operations and rapidly reducing debt.
Air France-KLM – challenges in 2012 Implement cost-reduction measures
Negotiate collective bargaining agreements with unions
Adhere to timetable given
Cargo and premium trends
Figure 34: Air France-KLM profit bridge
-1000
-900
-800
-700
-600
-500
-400
-300
-200
-100
0
FY2011e op result Fuel headwind Fuel surcharge/yield/vol
MENA/Japan Unit cost FY2012e op result Consensus
-€320m
-€587m €107m
€160m
€155m
-€485m
-€231m
Source: Davy

Research Report: Davy on Airlines January 19, 2012
38 Davy Research
There will be a downward revision of capacity growth and investments. Over the next three years (2012-2014), Air France-KLM will increase capacity by a little over 5% on a cumulative basis: c.2.2% in FY 2012, 2.2% in FY 2013 and 2.1% in FY 2014. This excludes additional one-off growth from provincial bases. Originally, the growth rate in passenger business was c.3%. The investment plan is targeting maximum investment of €4.8bn over the three years – €1bn less than initially planned. It is also targeting €700m in sale and leasebacks. A key priority is the reduction of the group's net debt by €2bn to some €4.5bn by end-December 2014. The aim is to generate €2bn over the period 2012-2014 in net cash flow through a combination of immediate actions and a transformation plan.
Immediate cost-reduction measures Immediate cost-reduction measures to save €1bn include a freeze on general pay rises in 2012 and 2013 at Air France and a policy of wage moderation at KLM. The hiring freeze introduced in September 2011 will also be continued. Additional productivity measures, a further reduction in overhead costs and network adaptations will complete the measures.
Structural transformation plan A structural transformation plan targets an additional €1bn over three years, implying the renegotiation of the employment rules contained in the existing collective agreements. Although the passenger business will be the primary focus, with the restructuring of the short-haul and medium-haul operations, cargo and maintenance will also be in focus. The medium-haul business lost some €700m in 2011 (which the group indicated on the conference call is "far more than the group's total losses") and the plan is to get to break-even within three years (our current FY2011 and FY2012 operating loss forecasts are €344m and €485m respectively; consensus is at -€249m and -€317m respectively). To restore the medium-haul business to break-even, the group is working on a number of structural measures: better utilisation rates for aircraft and assets; significantly improved productivity in all employee categories; and redefinition of certain activities, potentially leading to more extensive outsourcing in some areas. The negotiations on the new collective agreements will start in the coming weeks with a second progress report in March and a presentation of the final transformational plan in summer 2012 for implementation in 2012 and 2013.
Significant issues to overcome We are somewhat sceptical of the plan, which focuses entirely on costs. The objective of net balance sheet debt of €4.5bn appears higher than
previous 0.5x debt-to-equity targets – the aim is to reduce the debt-to-EBITDA ratio from 4.5x to below 2x.
Capacity growth reductions and capex adjustments appear modest.Previous cost plans have been offset by cost inflation elsewhere; we currently assume an extra €700m cost inflation for fuel in FY 2012 and that other costs, including airport and leasing costs, should rise.
Timetable for three-year plan January 2012: First Progress Report
Start of negotiations on the new collective agreements in the coming weeks
March 2012: Second Progress Report
Summer 2012: Presentation of the final transformation plan for implementation in 2012 and 2013

Research Report: Davy on Airlines January 19, 2012
39 Davy Research
Returning the short-haul and medium-haul business to break-even will be a challenge – c.80% of losses are in the connecting business with losses also in point-to-point and regional operations.
The cargo business is also loss-making and potential risks for the premium in this environment remain.
Union opposition could be an issue, particularly as collective bargaining agreements are renegotiated. The company will update on progress through the year.
Scenario analysis – rights issue likely if plan not delivered
Below we show the key metrics of the company having adjusted our estimates for the new capex and sale and leaseback update. It is clear that the targets set out cannot be achieved without implementation of a cost programme. We also show the same metrics with phase I of the cost programme implemented ("Immediate cost reduction measure") and discuss the full cost programme implemented ("Transformation plan"). If there are difficulties in implementation, which must be a risk given the large dependency on labour negotiations, we outline other actions that can be taken to achieve its targets and thus ameliorate its debt burden. a sell down of the Amadeus equity stake (we assume a sell down of
50% to 7.6% or in line with other airline shareholders – we think it likely that a board position is kept);
a discounted rights issue.
Table 24: Air France-KLM covenants, current financial position and targets pre-implementation of immediate plan and transformation plan
Air France-KLM financial position – covenants Dec-11 Dec-12 Dec-13 Covenant
Air France-KLM financial position
Non-current assets not pledged as collateral > unsecured net debt
>1
EBITDAR to net interest charge +1/3 op. leases) 3.3 3.2 4.2 >1.5 Air France KLM;>2.5 for Air
France and for KLM
Air France-KLM – current financial position Dec-11 Dec-12 Dec-13 Target 2014 Previous target
Air France-KLM - financial position
Net balance sheet debt €m 6,549.60 6,558.90 6,533.40 4,500
Off balance sheet (7x operating leases) €m 5,895.70 6,072.60 6,254.70
Net balance sheet debt/equity x 1.01 1.14 1.17 0.5x
Net debt/EBITDA 5.01 5.58 3.71 <2x
Davy ratios
Net debt/EBITDAR x 5.8 6.2 4.8
Total net debt/capital % 52.00% 53.00% 54.80%
Cash flow Cumulative/ target 2014
Cumulative/ current 2014
Capital expenditure €m -1,400 -1,100 -1,550 -4,100 -4,100
Free cash flow €m -489 -9 26 2,000 c. zero
Source: Davy

Research Report: Davy on Airlines January 19, 2012
40 Davy Research
With 75% of debt asset backed, we assume liquidity is not an issue for Air France-KLM. What is an issue, however, is the debt burden.
Table 25: Air France-KLM liquidity position
Air France KLM – liquidity position €m Dec 2011 Dec 2012 Dec 2013 Dec 2014
Gross liquidity 5,604 4,655 3,650
Gross cash 3,384
Credit lines 1,850
Amadeus stake 800
Repayments -430 -940 -1030 -1,710
Free cash flow -9 26 476
Net liquidity 5,604 4,655 3,650 2,416
Source: Davy
Scenario 1 – Phase I: implementation of immediate plan In Scenario 1, we assume that the immediate plans are implemented. These include payroll measures (€500m), overheads (€150m) and productivity and network adoption (€200m). The plan will be phased in. If fully implemented, this would have a full year run rate positive impact on profitability of €600m in FY2012, €800m in FY2013 and €1bn in FY2013. If this plan only is implemented and 50% of the Amadeus stake is sold, a c.€1bn rights issue will still be necessary to bring net debt/EBITDA to below 2x (and net debt to €4.44bn).
Table 26: Air France-KLM financial position and targets post implementation of immediate plan but assuming no transformation plan – rights issue likely in this case
Air France-KLM - financial position - self help Dec 2011 Dec 2012 Dec 2013 Dec 2014 Cumulative Target/Previous target
Sale of 50% of Amadeus stake 426
Free cash flow €m -489 668 -89 529 1,108 2,000 (cumulative)
Net balance sheet debt €m 6,550 5,882 5,971 5,442 4.5bn
EBITDA 1,308 1,522 1,639 2,198
Net debt/EBITDA 5.01 3.86 3.64 2.48 <2x
Air France KLM - financial position - with rights issue
Dec 2011 Dec 2012 Dec 2013 Dec 2014 Cumulative Target/Previous target
€1.0bn rights issue 1,000
Net debt/EBITDA 5.01 3.21 3.03 2.02 <2.0
Free cash flow €m -489 1,667 -89 529 2,108 2,000
Net balance sheet debt €m 6,550 4,882 4,971 4,442 4,500
Potential Air France-KLM rights issue
Current share price (€) 4.35 Rights issue discount
30%
Existing no. of shares (m) 300
Market cap at issue (€m) 1,305 Rights price 3.0
Amount raised (€m) 1000 Ex-rights price 3.8
Size of rights issue 100%
Downside from current
price
-13%
New shares issued (m) 230
Total no. of shares m (post issue) 530
Source: Davy
Immediate cost-saving measures (€m)
Payroll measures €500
Overheads €150
Productivity improvements and network adaption
€200
Source: Davy

Research Report: Davy on Airlines January 19, 2012
41 Davy Research
Scenario 2 – Phase I and Phase II: implementation of immediate plans and transformation plan The transformation plan focuses on bringing the medium-haul business (currently €700m in losses) to breakeven, turning around the cargo business and improving long haul and maintenance. We assume this will be phased in and back ended (full year run rate €400m in FY2013 and €600m in FY2014) with half the measures being implemented as cost savings and half contributing to revenue. If the company fully implements both stages of the plan, we estimate that it will reach a net debt/EBITDA level of c.1.5x (target <2.0x) with cumulative free cash flow of €1.8bn from FY2012-FY2014. We are changing our rating to sector underperform and adjust the price target to €3.8. A catalyst to change this rating would be deliverability on the turnaround plan.
Fundamental plan goals
Medium haul From -€700m to breakeven
Cargo turnaround From c. -€100 to profitability
Improvement in long haul and maintenance
c.€200m improvements
Source: Davy
We are changing our rating to sector underperform and adjust the price target to €3.8

Research Report: Davy on Airlines January 19, 2012
42 Davy Research
Appendix 1: Price to book
Aer Lingus forward price/book
0.0x
0.5x
1.0x
1.5x
2.0x
2.5x
Sep 06 Sep 07 Sep 08 Sep 09 Sep 10 Sep 11
Peak = 2.1x
Average = 0.8x
Trough = 0.4x Current = 0.4x
Source: Factset
Air France-KLM forward price/book
0.0x
0.2x
0.4x
0.6x
0.8x
1.0x
1.2x
Sep 06 Sep 07 Sep 08 Sep 09 Sep 10 Sep 11
Peak = 1.1x
Trough = 0.2x
Average = 0.6x
Current = 0.2x
Source: Factset
IAG forward price/book
0.0x
0.5x
1.0x
1.5x
2.0x
2.5x
3.0x
3.5x
Aug 01 Aug 02 Aug 03 Aug 04 Aug 05 Aug 06 Aug 07 Aug 08 Aug 09 Aug 10 Aug 11
Peak = 2.9x
Average = 1.3x
Trough = 0.5xCurrent 0.7x
Source:
Lufthansa forward price/book
0.0x
0.5x
1.0x
1.5x
2.0x
2.5x
Sep 06 Sep 07 Sep 08 Sep 09 Sep 10 Sep 11
Average = 1.0x
Peak = 2.0x
Trough = 0.5xCurrent = 0.5x
Source: Factset
easyJet forward price/book
0.0x
0.5x
1.0x
1.5x
2.0x
2.5x
3.0x
Sep 06 Sep 07 Sep 08 Sep 09 Sep 10 Sep 11
Peak = 2.4x
Average = 1.3x
Trough = 0.8x
Current = 1.0x
Source: Factset
Ryanair forward price/book
0.0x
0.5x
1.0x
1.5x
2.0x
2.5x
3.0x
3.5x
4.0x
Sep 06 Sep 07 Sep 08 Sep 09 Sep 10 Sep 11
Peak = 3.4x
Average = 1.9x
Trough = 1.2x
Current = 1.6x
Source: Factset

Research Report: Davy on Airlines January 19, 2012
43 Davy Research
European airlines forward price/book
0.0 x
0.2 x
0.4 x
0.6 x
0.8 x
1.0 x
1.2 x
1.4 x
1.6 x
1.8 x
Sep 06 Sep 07 Sep 08 Sep 09 Sep 10 Sep 11
Peak = 1.7x
Trough = 0.5x
Average = 0.9x
Current = 0.6x
Source: Factset

Research Report: Davy on Airlines January 19, 2012
44 Davy Research
Appendix 2: Price/peak EPS
Aer Lingus price to peak EPS
0.0
2.0
4.0
6.0
8.0
10.0
12.0
14.0
16.0
Sep 06 Sep 07 Sep 08 Sep 09 Sep 10 Sep 11
Average = 6.3x
Peak = 14.8x
Trough = 2.1x Current =3.0x
Source: Factset
Air France-KLM price to peak EPS
0.0
1.0
2.0
3.0
4.0
5.0
6.0
Aug 01 Aug 02 Aug 03 Aug 04 Aug 05 Aug 06 Aug 07 Aug 08 Aug 09 Aug 10 Aug 11
Average = 2.2x
Peak = 5.4x
Trough = 0.5x
Current = 0.6x
Source: Factset
IAG price to peak EPS
0.0
2.0
4.0
6.0
8.0
10.0
12.0
Aug 01 Aug 02 Aug 03 Aug 04 Aug 05 Aug 06 Aug 07 Aug 08 Aug 09 Aug 10 Aug 11
Average = 4.5x
Peak = 10.9x
Trough = 1.7xCurrent = 2.3x
Source: Factset
Lufthansa price to peak EPS
0.0
1.0
2.0
3.0
4.0
5.0
6.0
7.0
8.0
Aug 01 Aug 02 Aug 03 Aug 04 Aug 05 Aug 06 Aug 07 Aug 08 Aug 09 Aug 10 Aug 11
Average = 4.2x
Peak = 7.0x
Trough = 2.1xCurrent = 3.0x
Source: Factset
easyJet price to peak EPS
0.0
2.0
4.0
6.0
8.0
10.0
12.0
14.0
16.0
Aug 01 Aug 02 Aug 03 Aug 04 Aug 05 Aug 06 Aug 07 Aug 08 Aug 09 Aug 10 Aug 11
Average = 6.8x
Peak = 13.9x
Trough = 2.3x
Current = 7.6x
Source: Factset
Ryanair price to peak EPS
0.0
5.0
10.0
15.0
20.0
25.0
Aug 01 Aug 02 Aug 03 Aug 04 Aug 05 Aug 06 Aug 07 Aug 08 Aug 09 Aug 10 Aug 11
Average =10.7x
Peak = 19.7x
Trough = 5.7x
Current = 11.8x
Source: Factset

Research Report: Davy on Airlines January 19, 2012
45 Davy Research
Appendix 3: Cyclically adjusted P/E
Aer Lingus cyclically adjusted P/E
0.0
5.0
10.0
15.0
20.0
25.0
30.0
35.0
40.0
Sep 06 Sep 07 Sep 08 Sep 09 Sep 10 Sep 11
Average = 14.8x
Peak = 34.5x
Trough = 5.0x
Current = 7.0x
Source: Datastream
Air France-KLM cyclically adjusted P/E
0.0
5.0
10.0
15.0
20.0
25.0
Aug 01 Aug 02 Aug 03 Aug 04 Aug 05 Aug 06 Aug 07 Aug 08 Aug 09 Aug 10 Aug 11
Average = 8.7x
Peak = 21.4x
Trough = 2.0x
Current = 2.3x
Source: Datastream
IAG cyclically adjusted P/E
0.0
5.0
10.0
15.0
20.0
25.0
30.0
35.0
Aug 01 Aug 02 Aug 03 Aug 04 Aug 05 Aug 06 Aug 07 Aug 08 Aug 09 Aug 10 Aug 11
Average = 13.3x
Peak = 32.5x
Trough =5.0xCurrent = 6.9x
Source: Datastream
Lufthansa cyclically adjusted P/E
0.0
5.0
10.0
15.0
20.0
25.0
Aug 01 Aug 02 Aug 03 Aug 04 Aug 05 Aug 06 Aug 07 Aug 08 Aug 09 Aug 10 Aug 11
Average =12.6x
Peak = 21.4x
Trough = 6.4x
Current = 9.2x
Source: Datastream
easyJet cyclically adjusted P/E
0.0
5.0
10.0
15.0
20.0
25.0
30.0
35.0
40.0
Aug 01 Aug 02 Aug 03 Aug 04 Aug 05 Aug 06 Aug 07 Aug 08 Aug 09 Aug 10 Aug 11
Average = 17.3x
Peak = 35.7x
Trough = 5.9x
Current = 19.4x
Source: Datastream
Ryanair cyclically adjusted P/E
0.0
5.0
10.0
15.0
20.0
25.0
30.0
35.0
Aug 01 Aug 02 Aug 03 Aug 04 Aug 05 Aug 06 Aug 07 Aug 08 Aug 09 Aug 10 Aug 11
Average =17.8x
Peak = 32.6x
Trough = 9.6x
Current = 19.6x
Source: Datastream
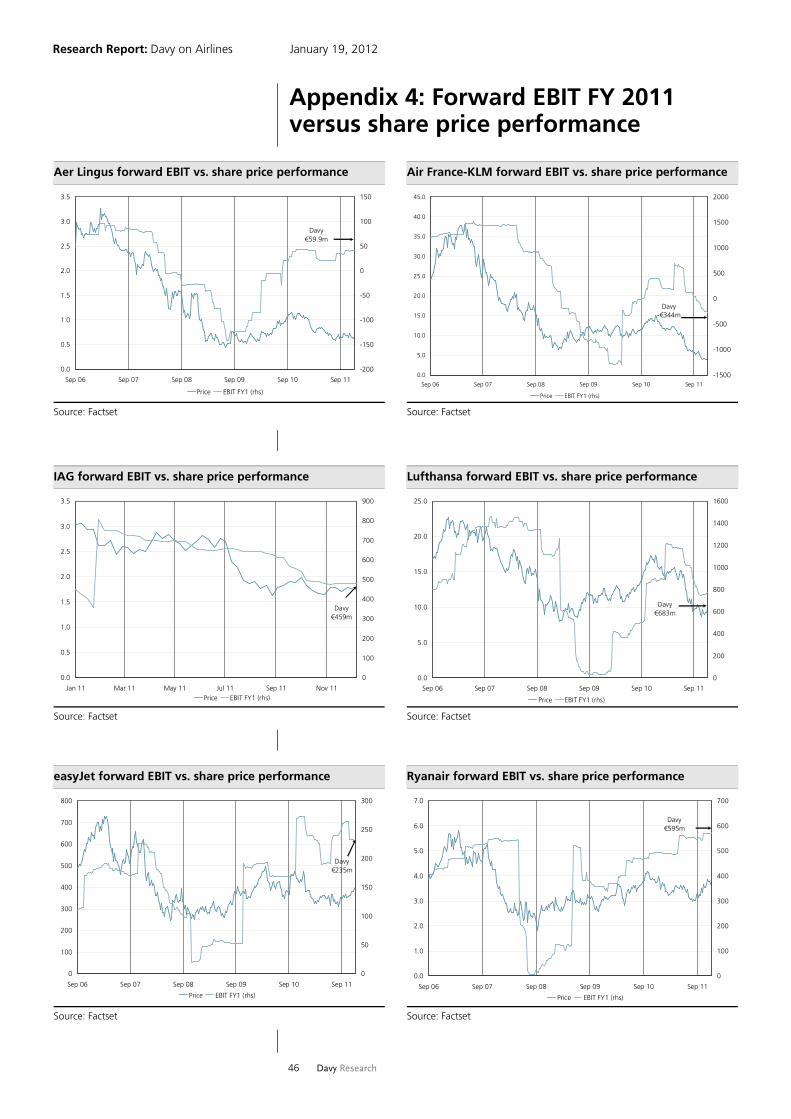
Research Report: Davy on Airlines January 19, 2012
46 Davy Research
Appendix 4: Forward EBIT FY 2011 versus share price performance
Aer Lingus forward EBIT vs. share price performance
0.0
0.5
1.0
1.5
2.0
2.5
3.0
3.5
Sep 06 Sep 07 Sep 08 Sep 09 Sep 10 Sep 11
-200
-150
-100
-50
0
50
100
150
Price EBIT FY1 (rhs)
Davy €59.9m
Source: Factset
Air France-KLM forward EBIT vs. share price performance
0.0
5.0
10.0
15.0
20.0
25.0
30.0
35.0
40.0
45.0
Sep 06 Sep 07 Sep 08 Sep 09 Sep 10 Sep 11
-1500
-1000
-500
0
500
1000
1500
2000
Price EBIT FY1 (rhs)
Davy -€344m
Source: Factset
IAG forward EBIT vs. share price performance
0.0
0.5
1.0
1.5
2.0
2.5
3.0
3.5
Jan 11 Mar 11 May 11 Jul 11 Sep 11 Nov 11
0
100
200
300
400
500
600
700
800
900
Price EBIT FY1 (rhs)
Davy €459m
Source: Factset
Lufthansa forward EBIT vs. share price performance
0.0
5.0
10.0
15.0
20.0
25.0
Sep 06 Sep 07 Sep 08 Sep 09 Sep 10 Sep 11
0
200
400
600
800
1000
1200
1400
1600
Price EBIT FY1 (rhs)
Davy €683m
Source: Factset
easyJet forward EBIT vs. share price performance
0
100
200
300
400
500
600
700
800
Sep 06 Sep 07 Sep 08 Sep 09 Sep 10 Sep 11
0
50
100
150
200
250
300
Price EBIT FY1 (rhs)
Davy €235m
Source: Factset
Ryanair forward EBIT vs. share price performance
0.0
1.0
2.0
3.0
4.0
5.0
6.0
7.0
Sep 06 Sep 07 Sep 08 Sep 09 Sep 10 Sep 11
0
100
200
300
400
500
600
700
Price EBIT FY1 (rhs)
Davy €595m
Source: Factset

Research Report: Davy on Airlines January 19, 2012
47 Davy Research
Appendix 5: Forward EBIT FY 2012 versus share price performance
Aer Lingus forward EBIT vs. share price performance
0.0
0.5
1.0
1.5
2.0
2.5
3.0
3.5
Sep 06 Sep 07 Sep 08 Sep 09 Sep 10 Sep 11
-150
-100
-50
0
50
100
150
Price EBIT FY2 (rhs)
Davy €61.7m
Source: Factset
Air France-KLM forward EBIT vs. share price performance
0.0
5.0
10.0
15.0
20.0
25.0
30.0
35.0
40.0
45.0
Sep 06 Sep 07 Sep 08 Sep 09 Sep 10 Sep 11
-500
0
500
1000
1500
2000
Price EBIT FY1 (rhs)
Davy -€485m
Source: Factset
IAG forward EBIT vs. share price performance
0.0
0.5
1.0
1.5
2.0
2.5
3.0
3.5
Jan 11 Mar 11 May 11 Jul 11 Sep 11 Nov 11
0
200
400
600
800
1000
1200
Price EBIT FY2 (rhs)
Davy €296m
Source: Factset
Lufthansa forward EBIT vs. share price performance
0.0
5.0
10.0
15.0
20.0
25.0
Sep 06 Sep 07 Sep 08 Sep 09 Sep 10 Sep 11
0
200
400
600
800
1000
1200
1400
1600
1800
Price EBIT FY2 (rhs)
Davy €593m
Source: Factset
easyJet forward EBIT vs. share price performance
0
100
200
300
400
500
600
700
800
Sep 06 Sep 07 Sep 08 Sep 09 Sep 10 Sep 11
0
50
100
150
200
250
300
Price EBIT FY1 (rhs)
Davy €235m
Source: Factset
Ryanair forward EBIT vs. share price performance
0.0
1.0
2.0
3.0
4.0
5.0
6.0
7.0
Sep 06 Sep 07 Sep 08 Sep 09 Sep 10 Sep 11
0
100
200
300
400
500
600
700
Price EBIT FY2 (rhs)
Davy €579m
Source: Factset

Research Report: Davy on Airlines January 19, 2012
48 Davy Research
Appendix 6: EV/sales
Aer Lingus EV/sales
-0.4
-0.2
0.0
0.2
0.4
0.6
0.8
1.0
1.2
Sep 06 Sep 07 Sep 08 Sep 09 Sep 10 Sep 11
Average = 0.16
Source: Factset
Air France-KLM EV/sales
0.1
0.2
0.3
0.4
0.5
0.6
Sep 06 Sep 07 Sep 08 Sep 09 Sep 10 Sep 11
Average = 0.4
Source: Factset
IAG EV/sales
0.0
0.1
0.2
0.3
0.4
0.5
0.6
0.7
Jan 11 Apr 11 Jul 11 Oct 11
Average = 0.3
Source: Factset
Lufthansa EV/sales
0.1
0.2
0.3
0.4
0.5
0.6
Sep 06 Sep 07 Sep 08 Sep 09 Sep 10 Sep 11
Average = 0.3
Source: Factset
easyJet EV/sales
0.2
0.4
0.6
0.8
1.0
1.2
1.4
Sep 06 Sep 07 Sep 08 Sep 09 Sep 10 Sep 11
Average= 0.6
Source: Factset
Ryanair EV/sales
0.5
1.0
1.5
2.0
2.5
3.0
3.5
4.0
Sep 06 Sep 07 Sep 08 Sep 09 Sep 10 Sep 11
Average = 1.8
Source: Factset

Research Report: Davy on Airlines January 19, 2012
49 Davy Research
Appendix 7: IATA summary forecasts
IATA forecasts
2000 2001 2002 2003 2004 2005 2006 2007 2008 2009 2010 2011F 2012F 2012F banking crisis
Revenue ($bn) 329.0 307.0 306.0 322.0 379.0 413.0 465.0 510.0 570.0 476.0 547.0 596.0 618.0 589.0
Passenger 256.0 239.0 238.0 249.0 294.0 323.0 365.0 399.0 444.0 374.0 425.0 469.0 488.0 462.0
Cargo 40.0 39.0 38.0 40.0 47.0 48.0 53.0 59.0 63.0 48.0 66.0 66.0 66.0 62.0
Traffic volumes
Passenger growth (%) 8.6 -2.7 1.0 2.3 14.9 7.0 5.0 6.4 1.5 -2.1 7.3 6.1 4.0 0.0
Passenger numbers (m) 1,672 1,793 1,792 1,849 2,064 2,211 2,328 2,497 2,507 2,479 2,681 2,840 2948 2834
Cargo growth (%) 9.1 -6.0 8.7 3.9 7.9 0.4 4.8 4.8 -1.0 -9.8 18.7 -0.5 0.0 -4.7
Freight tonnes (m) 30.4 32.3 35.2 37.5 41.1 42.1 44.6 46.8 45.4 40.8 45.8 45.5 45.4 45.3
World economic growth (%) 4.5 2.2 2.7 2.8 4.2 3.4 4.0 3.8 1.7 -2.3 3.9 2.5 2.1 0.8
Passenger yield (%) -1.1 -4.0 -1.7 2.4 2.6 2.7 7.8 2.7 9.5 -14.0 6.1 4.0 0.0 -1.5
Cargo yield (%) -2.3 1.9 -9.5 2.0 7.4 2.4 5.9 5.5 7.4 -14.2 15.0 0.0 0.0 -1.5
Expenses ($bn) 318.0 319.0 311.0 323.0 376.0 409.0 450.0 490.0 571.0 474.0 525.0 583.0 609.0 592.0
Fuel 46.0 43.0 40.0 44.0 65.0 91.0 107.0 134.0 189.0 125.0 139.0 178.0 198.0 183.0
% of expenses 14.0 13.0 13.0 14.0 17.0 22.0 24.0 27.0 33.0 26.0 26.0 30.0 32.0 31.0
Crude oil price (Brent $/b) 28.8 24.7 25.1 28.8 38.3 54.5 65.1 73.0 99.0 62.0 79.4 112.0 99.0 85.0
Non-fuel 272.0 276.0 270.0 279.0 311.0 318.0 333.0 355.0 382.0 349.0 386.0 405.0 412.0 409.0
cents per ATK ( non-fuel unit costs)
39.2 39.7 38.8 38.9 39.5 38.6 38.9 39.3 41.8 39.6 41.6 41.2 40.6 41.6
% change -2.3 1.4 -2.3 0.3 1.4 -2.1 0.8 0.8 6.4 -5.2 5.1 -1.0 -1.5 1.5
Break-even weight load factor %
60.8 61.3 61.9 61.1 61.9 62.0 61.2 60.9 63.2 62.3 63.1 63.1 63.5 64.0
Weight load factor achieved % 61.5 59.0 60.9 60.8 62.5 62.6 63.3 63.4 63.1 62.6 65.7 64.5 64.4 63.7
Operating profit ($bn) 10.7 -11.8 -4.8 -1.4 3.3 4.4 15.0 19.9 -1.1 1.9 21.7 13.2 8.7 -3.1
% margin 3.3 -3.8 -1.6 -0.4 0.9 1.1 3.2 3.9 -0.2 0.4 4.0 2.2 1.4 -0.5
Net profit ($bn) 3.7 -13.0 -11.3 -7.5 -5.6 -4.1 5.0 14.7 -26.1 -4.6 15.8 6.9 3.5 -8.3
% margin 1.1 -4.2 -3.7 -2.3 -1.5 -1.0 1.1 2.9 -4.6 -1.0 2.9 1.2 0.6 -1.4
Source: Davy; IATA; ICAO

50 Davy Research
Research Report: Davy on Airlines January 19, 2012
S H A R E P R I C E A N D P E R F O R M A N C E Price 12 Month Mkt. Cap Change % (€) Rel to E300 sector % Pr/Bk Debt/EBITDA Local High Low €m Wk 1 Mth YTD Wk 1 Mth YTD 2011 2011 2012
L O W C O S T A I R L I N E S Ryanair Holdings (RYA ID) 387 393 282 5715 -0.6 2.5 6.6 0.5 -2.5 5.7 1.67 0.2 -0.5 Air Arabia (AIRARABI UH) 58 85 57 573 0.0 -2.3 -0.2 1.1 -7.1 -1.0 0.51 -2.9 -1.1 AirAsia (AIRA MK) 365 414 235 2550 -0.6 1.4 0.0 0.5 -3.5 -0.8 2.34 3.9 3.5 Air Berlin (AB1 GY) 236 388 220 201 -2.5 2.2 -5.5 -1.4 -2.8 -6.2 0.63 N/A 25.9 easyJet (EZJ LN) 404 456 301 2093 0.5 7.5 3.4 1.7 2.2 2.5 1.02 -0.2 0.3 Flybe (FLYB LN) 62 330 55 56 12.0 -7.9 -10.8 13.2 -12.4 -11.5 0.41 0.9 2.0 GOL Linhas (GOL US) 683 1598 518 1485 -0.1 -8.7 4.8 1.0 -13.2 4.0 0.81 10.0 3.2 JetBlue (JBLU US) 526 649 340 1227 -10.9 -3.5 2.9 -9.9 -8.3 2.1 0.86 3.0 2.5 Norwegian Air (NAS NO) 6250 12900 5225 281 -0.6 5.9 13.9 0.5 0.7 13.0 1.07 3.8 4.4 Southwest Airlines (LUV US) 894 1283 735 5464 3.0 4.8 6.3 4.1 -0.3 5.4 1.13 0.4 0.2 Tiger Airways (TGR SP) 67 166 60 333 4.6 12.1 7.5 5.8 6.6 6.6 2.02 N/A 12.0 Virgin Australia (VAH AU) 31 44 23 548 2.4 -0.3 10.3 3.6 -5.2 9.4 0.73 4.7 2.6 Vueling (VLG SM) 392 1199 359 117 -2.2 3.4 1.3 -1.1 -1.6 0.5 0.57 -16.2 -14.6 Westjet Airlines (WJA CN) 1153 1565 1046 1233 -0.6 13.0 0.3 0.5 7.4 -0.5 1.18 1.8 1.3 Low cost airlines (14) 955 1177 783 21876 -0.1 2.8 4.4 1.0 -2.2 3.6 1.17 1.7 1.4
E U R O P E A N N E T W O R K A I R L I N E S Aer Lingus (AERL ID) 64 108 57 342 -1.5 -1.5 0.8 -0.4 -6.4 0.0 0.39 -2.0 -2.4 Air France KLM (AF FP) 448 1393 348 1344 15.0 13.5 12.7 16.3 7.9 11.8 0.20 3.6 3.5 Finnair (FIA1S FH) 255 514 230 327 0.8 5.4 10.9 1.9 0.2 10.0 0.41 5.7 2.3 IAG (IAG SM) 189 341 153 3497 6.2 10.8 8.3 7.4 5.3 7.5 0.74 1.1 1.4 Lufthansa (LHA GY) 957 1611 835 4383 7.1 7.2 4.2 8.3 2.0 3.4 0.50 0.6 0.7 SAS AB (SAS SS) 900 2520 750 336 -1.1 22.5 13.7 0.0 16.5 12.8 0.20 1.7 1.6 Turk Hava Yollari AO (THYAO TI) 213 442 201 1088 7.1 -0.3 4.4 8.3 -5.2 3.6 0.68 6.4 4.8 Euro network airlines (7) 287 571 251 11317 6.9 8.3 6.8 8.2 3.0 5.9 0.45 1.6 1.7
O T H E R A I R L I N E S Air China (753 HK) 599 901 486 10882 1.0 9.9 6.2 2.1 4.5 5.3 1.25 3.5 3.3 AMR (AAMRQ US) 40 769 24 106 11.4 -36.8 16.9 12.7 -39.9 15.9 N/A 8.2 7.3 Cathay Pacific (293 HK) 1396 2310 1188 5551 1.5 7.6 6.6 2.6 2.4 5.8 0.96 1.6 2.2 China Eastern Airlines (670 HK) 279 408 211 5243 -0.4 2.4 2.8 0.7 -2.6 2.0 1.19 4.3 4.0 China Southern Airlines (1055 HK) 406 537 308 7804 -8.1 6.0 5.1 -7.0 0.8 4.2 0.99 3.2 3.1 Delta Airlines (DAL US) 873 1230 662 5805 5.9 -1.1 9.8 7.1 -6.0 8.9 4.88 2.8 1.8 Qantas (QAN AU) 150 254 138 2763 -2.5 4.8 5.9 -1.4 -0.3 5.1 0.55 1.3 1.7 Singapore Airlines (SIA SP) 1080 1438 1005 7788 3.7 8.6 9.1 4.9 3.3 8.3 0.98 -1.9 -2.0 United Continental Holdings (UAL US) 1823 2748 1553 4735 4.6 -12.3 -1.7 5.8 -16.6 -2.5 2.54 1.1 0.7 US Airways (LCC US) 588 1105 400 748 3.1 -2.8 18.0 4.3 -7.6 17.0 10.14 3.9 2.8
A V I A T I O N S E R V I C E P R O V I D E R S Aeroports de Paris (ADP FP) 5589 6690 5003 5531 4.3 6.8 5.5 5.5 1.6 4.6 1.54 2.5 2.4 Amadeus IT Holding (AMS SM) 1298 1570 1155 5810 0.7 10.6 3.6 1.8 5.2 2.7 4.15 1.8 1.3 Datalex (USc) (DLE ID) 46 57 24 26 0.0 -2.7 2.9 1.1 -7.5 2.1 1.00 -2.9 -2.2 Fraport (FRA GY) 4390 5810 3761 4037 10.3 15.2 15.5 11.6 9.6 14.6 1.41 3.6 3.6
S H I P P I N G A N D P O R T S Irish Continental Grp (IR5A ID) 1450 1815 1400 360 0.0 -1.0 -4.4 1.1 -5.9 -5.2 2.11 0.2 -0.1 Attica Enterprises (ATTICA GA) 18 80 18 35 -13.6 -7.5 -19.7 -12.6 -12.1 -20.3 N/A N/A N/ADFDS (DFDS DC) 38600 47700 35300 771 2.1 9.1 8.8 3.2 3.7 7.9 0.84 1.8 1.1 Finnlines (FLG1S FH) 730 810 721 342 0.0 0.0 -5.2 1.1 -4.9 -6.0 N/A N/A N/AViking Line (VIK1V FH) 2150 3185 2110 232 -2.3 -8.5 -2.7 -1.2 -13.0 -3.5 N/A N/A N/AShipping (5) 1372 1764 1335 1741 0.2 2.2 0.7 1.4 -2.8 -0.2 1.04 1.5 0.8
T O U R O P E R A T O R S Thomas Cook (TCG LN) 15 204 10 153 -4.0 -5.4 -1.1 -2.9 -10.1 -2.0 0.11 1.9 2.1 TUI Travel (TT/ LN) 173 272 137 2329 7.8 13.3 5.0 9.0 7.7 4.1 1.00 -0.0 0.0
T R A N S P O R T L O G I S T I C S A.P. Moller-Maersk A/S (MAERSKA DC) 3716000 5250000 3096000 21975 0.8 13.5 3.7 1.9 7.9 2.9 0.84 1.1 1.1 Deutsche Post DHL (DPW GY) 1257 1383 913 15197 0.2 12.9 5.8 1.3 7.4 4.9 1.38 -0.4 -0.4 DSV A/S (DSV DC) 11520 13260 9325 2944 2.6 14.9 11.9 3.7 9.3 10.9 3.91 2.2 2.0 FedEx (FDX US) 8998 9850 6515 22213 2.0 8.3 9.6 3.1 3.0 8.7 1.68 -0.1 -0.2 Kuehne & Nagle (KNIN VX) 11020 13870 9185 10939 4.5 4.8 5.0 5.7 -0.3 4.1 5.27 -1.2 -1.3 Oesterreichische Post (POST AV) 2352 2465 1893 1589 0.0 5.5 0.9 1.2 0.4 0.1 2.25 -1.1 -1.4 Panalpina Welttransport (PWTN SW) 10000 12840 7335 2068 1.4 12.7 4.5 2.5 7.2 3.6 2.62 -2.4 -2.6 PostNL (PNL NA) 297 962 203 1166 9.6 32.2 20.9 10.9 25.7 19.9 4.06 1.9 2.0 TNT Express (TNTE NA) 627 1000 464 3407 5.0 11.8 8.6 6.2 6.3 7.8 1.60 0.3 0.2 United Parcel Service (UPS US) 7420 7647 6170 56618 0.3 5.6 3.1 1.5 0.5 2.3 9.05 0.9 0.8 Transport logistics (10) 1011 1056 791 138117 1.2 7.6 5.1 2.3 2.4 4.2 2.17 0.6 0.5 FTSE E300 Travel & Leisure (E3LEIS) 1152 1325 992 -1.1 5.2 0.8
Appendix 8: Sector valuations and company analysis

51 Davy Research
Research Report: Davy on Airlines January 19, 2012 V A L U A T I O N EPS (c) EPS Gth % EV/Sales EV/EBITDA P/E 2011 2012 2013 11-13 2011 2012 2013 2011 2012 2013 2011 2012 2013
L O W C O S T A I R L I N E S Ryanair Holdings (RYA ID) 32 32 37 18.6 1.4 1.1 0.8 6.5 5.7 4.3 12.3 12.1 10.3 Air Arabia (AIRARABI UH) 5 6 7 40.0 0.8 0.8 0.9 6.0 6.0 5.9 11.5 9.6 8.2 AirAsia (AIRA MK) 27 35 39 42.0 3.6 3.3 2.9 10.0 8.6 7.3 13.4 10.4 9.4 Air Berlin (AB1 GY) -214 -95 -87 N/A 0.2 0.2 0.2 N/A 32.8 10.3 N/A N/A N/AeasyJet (EZJ LN) 52 38 42 -20.0 0.5 0.5 0.5 4.5 5.4 5.0 7.8 10.7 9.7 Flybe (FLYB LN) -8 -0 13 N/A 0.1 0.2 0.2 2.8 3.4 2.4 N/A N/A 4.6 GOL Linhas (GOL US) -140 18 92 N/A 0.6 0.6 0.6 17.4 5.3 3.9 N/A 37.9 7.4 JetBlue (JBLU US) 25 51 65 158.0 0.8 0.7 0.7 5.4 4.5 4.1 21.0 10.3 8.2 Norwegian Air (NAS NO) 568 1063 1458 156.7 0.5 0.5 0.6 6.8 6.6 6.1 11.0 5.9 4.3 Southwest Airlines (LUV US) 41 82 102 148.8 0.5 0.4 0.3 4.3 3.1 2.6 21.8 10.9 8.8 Tiger Airways (TGR SP) -11 3 7 N/A 1.6 1.5 1.3 N/A 19.2 13.1 N/A 21.1 9.5 Virgin Australia (VAH AU) -2 3 4 N/A 0.5 0.4 0.4 8.2 4.4 3.5 N/A 12.1 7.4 Vueling (VLG SM) 41 39 89 118.0 N/A N/A N/A N/A N/A N/A 9.6 10.1 4.4 Westjet Airlines (WJA CN) 100 124 138 38.0 0.8 0.7 0.7 5.5 4.4 4.3 11.5 9.3 8.4 Low cost airlines (14) 0.7 0.6 0.6 6.1 4.9 4.1 13.7 11.6 9.0
E U R O P E A N N E T W O R K A I R L I N E S Aer Lingus (AERL ID) 8 11 13 54.0 N/A N/A N/A N/A N/A N/A 7.8 6.0 5.0 Air France KLM (AF FP) -76 -214 -71 N/A 0.2 0.1 0.1 2.6 2.9 1.9 N/A N/A N/AFinnair (FIA1S FH) -47 -11 16 N/A 0.3 0.3 0.2 12.9 5.1 3.5 N/A N/A 15.5 IAG (IAG SM) 18 8 12 -35.5 0.2 0.2 0.2 2.0 2.6 2.7 10.5 24.5 16.3 Lufthansa (LHA GY) 86 56 85 -1.8 0.1 0.1 0.1 1.7 1.9 1.8 11.1 17.1 11.3 SAS AB (SAS SS) 136 105 187 37.1 0.2 0.2 0.1 2.6 2.7 2.1 6.6 8.6 4.8 Turk Hava Yollari AO (THYAO TI) -30 16 38 N/A 0.8 0.7 0.7 8.9 6.6 6.2 N/A 13.3 5.7 Euro network airlines (7) 0.2 0.2 0.2 3.1 3.1 2.8 14.5 N/A 11.3
O T H E R A I R L I N E S Air China (753 HK) 87 82 86 -1.1 1.7 1.6 1.4 7.8 7.2 6.8 6.9 7.3 7.0 AMR (AAMRQ US) -355 -167 1 N/A 0.4 0.5 0.0 8.3 7.3 0.1 N/A N/A 40.2 Cathay Pacific (293 HK) 151 113 139 -8.4 0.8 0.8 0.8 5.8 6.8 5.8 9.2 12.4 10.1 China Eastern Airlines (670 HK) 44 50 57 31.3 1.2 1.1 1.0 7.6 6.9 5.8 6.4 5.5 4.9 China Southern Airlines (1055 HK) 73 59 69 -4.5 1.2 1.1 1.0 7.5 7.1 6.2 5.6 6.9 5.8 Delta Airlines (DAL US) 135 234 277 105.6 0.5 0.4 0.4 4.8 3.4 2.6 6.5 3.7 3.2 Qantas (QAN AU) 18 14 20 11.6 0.4 0.4 0.4 3.1 3.4 3.3 8.3 10.5 7.4 Singapore Airlines (SIA SP) 42 63 81 93.9 0.6 0.5 0.5 4.0 3.1 2.6 25.9 17.3 13.4 United Continental Holdings (UAL US) 331 525 620 87.3 0.3 0.3 0.2 2.3 1.9 1.7 5.5 3.5 2.9 US Airways (LCC US) 56 169 203 261.6 0.3 0.3 0.3 5.3 3.8 4.4 10.5 3.5 2.9
A V I A T I O N S E R V I C E P R O V I D E R S Aeroports de Paris (ADP FP) 322 348 389 21.0 2.8 2.7 2.5 8.2 7.8 7.1 17.4 16.1 14.4 Amadeus IT Holding (AMS SM) 114 131 145 27.2 2.8 2.5 2.3 7.4 6.3 5.5 11.4 9.9 9.0 Datalex (USc) (DLE ID) 5 9 10 80.6 0.7 0.5 0.4 4.5 2.2 1.4 8.5 5.1 4.7 Fraport (FRA GY) 271 268 322 18.9 2.9 2.8 2.7 8.5 8.1 7.3 16.2 16.4 13.6
S H I P P I N G A N D P O R T S Irish Continental Grp (IR5A ID) 110 137 152 38.0 1.3 1.2 1.1 7.0 5.9 5.2 13.2 10.6 9.5 Attica Enterprises (ATTICA GA) N/A N/A N/A N/A N/A N/A N/A N/A N/A N/A N/A N/A N/ADFDS (DFDS DC) 4110 4388 5382 30.9 0.7 0.6 0.5 5.5 4.7 3.9 9.4 8.8 7.2 Finnlines (FLG1S FH) N/A N/A N/A N/A N/A N/A N/A N/A N/A N/A N/A N/A N/AViking Line (VIK1V FH) N/A N/A N/A N/A N/A N/A N/A N/A N/A N/A N/A N/A N/AShipping (5) 0.8 0.7 0.6 5.9 5.0 4.2 10.3 9.3 7.8
T O U R O P E R A T O R S Thomas Cook (TCG LN) 15 12 13 -14.7 0.1 0.1 0.1 2.2 2.4 2.0 1.0 1.2 1.1 TUI Travel (TT/ LN) 23 24 27 14.2 0.1 0.1 0.1 3.0 3.0 2.7 7.4 7.1 6.5
T R A N S P O R T L O G I S T I C S A.P. Moller-Maersk A/S (MAERSKA DC) 283985 309267 436409 53.7 2.7 2.7 2.8 3.1 3.2 3.0 13.1 12.0 8.5 Deutsche Post DHL (DPW GY) 116 138 153 31.8 0.2 0.2 0.2 3.1 3.1 2.8 10.8 9.1 8.2 DSV A/S (DSV DC) 744 858 1030 38.4 0.6 0.6 0.6 9.6 9.1 8.2 15.5 13.4 11.2 FedEx (FDX US) 636 740 862 35.5 0.7 0.6 0.6 5.3 4.6 4.0 14.1 12.2 10.4 Kuehne & Nagle (KNIN VX) 518 557 627 20.9 0.7 0.6 0.6 12.4 11.1 9.8 21.3 19.8 17.6 Oesterreichische Post (POST AV) 228 216 190 -16.7 0.5 0.5 0.5 4.5 4.2 4.1 10.3 10.9 12.4 Panalpina Welttransport (PWTN SW) 549 584 693 26.2 0.3 0.3 0.3 9.0 8.0 6.9 18.2 17.1 14.4 PostNL (PNL NA) 54 56 63 18.6 0.5 0.5 0.5 4.1 4.1 3.8 5.6 5.3 4.7 TNT Express (TNTE NA) 15 24 44 193.4 0.5 0.5 0.4 13.9 7.3 5.3 42.0 26.2 14.3 United Parcel Service (UPS US) 424 478 546 28.9 1.5 1.4 1.3 9.4 8.5 7.9 17.5 15.5 13.6 Transport logistics (10) 0.7 0.7 0.7 5.6 5.3 4.8 15.1 13.3 11.2

Research Report: Davy on Airlines January 19, 2012
52 Davy Research
52 Davy Research
SUMMARY ACCOUNTS Dec09 Dec10 Dec11E Dec12F Dec13F I N C O M E S T A T E M E N T ( € M ) Revenue 1205.7 1215.6 1298.1 1362.2 1398.4 Total operating expenses -1148.2 -1019.0 -1113.1 -1159.2 -1181.7 EBITDAR 57.5 196.6 185.0 203.0 216.7 Aircraft rental 55.8 51.6 49.9 51.2 52.5 Depreciation 82.7 87.4 90.1 90.1 90.1 Employee profit share 0.0 0.0 0.0 0.0 0.0 Operating profit -81.0 57.6 45.0 61.7 74.1 Other income from operations 0.0 0.0 0.0 0.0 0.0 Share of associate / JV after-tax profits 0.0 0.0 0.0 0.0 0.0 PBIT before exceptionals -81.0 57.6 45.0 61.7 74.1 Group net interest 14.8 6.8 -1.3 6.0 6.0 Other finance costs 0.0 0.0 0.0 0.0 0.0 Total finance costs 14.8 6.8 -1.3 6.0 6.0 Exceptionals -88.7 -34.0 14.9 0.0 0.0 PBT -154.9 30.4 58.6 67.7 80.1 Tax 24.8 16.1 0.0 -10.8 -12.8 Minorities (incl. pref. divs.) 0.0 0.0 0.0 0.0 0.0 Earnings (basic) -130.1 46.5 58.6 56.9 67.3 Average no. of shares (m) - basic 529.7 529.6 529.6 529.6 529.6 Average no. of shares (m) - diluted 529.7 529.6 529.6 529.6 529.6 P E R S H A R E D A T A ( C ) EPS Basic -24.6 8.8 11.1 10.7 12.7 EPS Diluted (Adj) -7.8 15.2 8.3 10.7 12.7 Cash EPS (Diluted) 7.8 31.7 25.3 27.8 29.7 Dividend 0.0 0.0 0.0 0.0 0.0 NBV 133.0 151.0 162.1 172.8 185.5 NBV (incl. amortisation of intangibles) 141.3 159.4 170.4 181.2 193.9 C A S H F L O W ( € M ) EBITDA 1.7 145.0 135.1 151.8 164.2 Change in working capital -46.2 -42.0 12.2 13.1 14.1 Share-based payments 0.0 0.0 0.0 0.0 0.0 Cash generated from operations -44.6 103.1 147.3 164.9 178.3 Net capital expenditure -168.3 -38.0 -90.0 -50.0 -100.0 Operating cashflow -212.9 65.1 57.3 114.9 78.3 Net interest 10.1 3.1 -1.3 6.0 6.0 Tax 0.0 0.0 0.0 -10.8 -12.8 Dividends from associates 0.0 0.0 0.0 0.0 0.0 Dividends to minorities 0.0 0.0 0.0 0.0 0.0 Free cash flow -202.8 68.2 56.0 110.1 71.5 Dividends to shareholders 0.0 0.0 0.0 0.0 0.0 Acquisitions & investments 0.0 0.0 0.0 0.0 0.0 Business disposals 0.0 0.0 0.0 0.0 0.0 Share Issues / (Buybacks) 0.0 0.0 0.0 0.0 0.0 Translation differences 0.0 0.0 0.0 0.0 0.0 Other -115.2 -54.3 -29.5 0.0 0.0 Change in net cash / debt -318.0 13.9 26.5 110.1 71.5 B A L A N C E S H E E T ( € M ) Property, plant & equipment 790.5 760.4 760.3 720.1 730.0 Intangible assets 12.5 12.9 7.0 7.0 7.0 Investments in associates / jv's 0.0 0.0 0.0 0.0 0.0 Working capital -241.6 -161.1 -173.3 -186.4 -200.5 Other 0.0 0.0 0.0 0.0 0.0 Capital Employed 561.4 612.2 594.0 540.7 536.5 Financed by Equity capital & reserves 704.5 799.8 858.4 915.3 982.6 Minority interests 0.0 0.0 0.0 0.0 0.0 Preference shares 0.0 0.0 0.0 0.0 0.0 Net Debt/(Cash) -335.9 -349.8 -376.3 -486.4 -557.9 Deferred consideration/debt-related 0.0 0.0 0.0 0.0 0.0 Retirement benefit obligations 0.0 0.0 0.0 0.0 0.0 Net deferred tax 0.0 0.0 0.0 0.0 0.0 Other long-term liabilities 192.8 162.2 111.9 111.8 111.8 Capital Employed 561.4 612.2 594.0 540.7 536.5 Intangibles amortised 44.1 44.1 44.1 44.1 44.1 Capital employed inc. intangibles 605.5 656.3 638.1 584.8 580.6 Invested capital inc. intangibles 412.7 494.1 526.2 473.0 468.8
INDUSTRY DRIVERS Dec09 Dec10 Dec11E Dec12F Dec13F Load factor (%) 74.5 76.1 75.4 76.4 76.4 Yield (% change) -11.1 14.8 7.1 1.3 1.8 Oil price (Jet per gallon USD) 2.74 2.48 2.77 3.14 3.19 Ex-fuel costs (% change) 3.4 8.5 6.9 -1.1 0.8 Capacity growth (%) -5.1 -13.9 1.4 1.7 1.0
CALENDAR Date Ex-Div Interims 31-08-11 Finals 28-02-12 AGM 04-05-12 Updated 03-11-11
VALUATION Dec11E Dec12F Dec13F
P/E 7.8 6.0 5.0 Dividend Yield (%) 0.0 0.0 0.0 Free Cash Flow Yield (pre divs) (%) 16.4 32.2 20.9 Price / Book 0.39 0.37 0.34 EV / Revenue N/A N/A N/A EV / EBITDAR N/A N/A N/A EV / EBITA N/A N/A N/A EV / Operating Cashflow N/A N/A N/A EV / Invested Capital N/A N/A N/A PEG (Hist P/E/4yr gwth) N/A
PRICE PERFORMANCE (%)
1 Wk 1 Mth 3 Mths 6 Mths YTD 1 Yr
Absolute -1.5 -1.5 -10.5 -11.1 0.8 -41.3 Rel to ISEQ -0.4 -8.8 -21.3 -13.6 -0.7 -41.9 Rel to E300 -2.2 -8.9 -16.4 -6.6 -2.4 -34.3 Rel to E300 Travel & Leisure -0.4 -6.4 -16.7 -7.0 0.0 -31.1
PRICE AND P/E HISTORY Price Hist P/E High Low Yr End High Low Average
2012 66 64 4.3 4.2 4.3 2011 113 57 64 6.2 N/A 2.1 2010 117 56 108 11.7 N/A N/A 2009 162 45 64 12.8 3.9 8.9 2008 242 99 150 11.1 5.1 8.4 2007 327 190 209 18.2 8.7 11.1
KEY RATIOS Dec09 Dec10 Dec11E Dec12F Dec13F G R O W T H
EPS Diluted (Adj) (%) N/A N/A -45.7 30.2 18.3 Revenue (%) -11.2 0.8 6.8 4.9 2.7 EBITDAR (%) -45.5 241.9 -5.9 9.7 6.7 EBITDA (%) -96.9 N/A -6.8 12.4 8.2 P R O F I T A B I L I T Y / A C T I V I T Y
EBITDAR margin (%) 4.8 16.2 14.3 14.9 15.5 EBITA margin (%) N/A 4.7 3.5 4.5 5.3 Revenue / Capital Employed (x) 2.17 1.93 2.01 2.23 2.40 R E T U R N
ROCE (before tax, ex. invs) (%) N/A 9.1 7.0 10.1 12.7 ROE (after tax) (%) N/A 10.1 5.0 6.1 6.8 Ret. on Inv. Cap. (after tax) (%) N/A 15.9 8.8 10.4 13.2 Cost of Equity (%) 7.9 7.4 7.3 6.5 6.5 F I N A N C I A L / G E N E R A L
EBITDAR Interest Cover (x) N/A N/A 142.3 N/A N/A Group Interest Cover (x) N/A N/A 34.6 N/A N/A Debt / EBITDAR (x) N/A N/A N/A N/A N/A Debt / Equity (%) N/A N/A N/A N/A N/A Debt / Free Cash Flow (x) N/A N/A N/A N/A N/A Avg. Cost of Debt (before tax) (%) N/A N/A N/A N/A N/A Ret. benefits deficit / market cap (%) N/A N/A N/A N/A N/A Dividend Cover (x) N/A N/A N/A N/A N/A Working Capital / Revenue (%) N/A N/A N/A N/A N/A Net Capex / Depreciation (%) 203.5 43.5 99.9 55.5 111.0 Tax rate (%) (unadjusted) N/A N/A N/A 16.0 16.0
CAGR(%) 5 Year 10 Year MAJOR SHAREHOLDERS % Revenue (%) 3.1 N/A Ryanair 29.8 EBITDA (%) 0.1 N/A Irish Government 25.1 EPS Diluted (Adj) (%) -17.9 N/A Credit Suisse Securities 5.0 Cash EPS (Diluted) (%) -8.2 N/A Dresdner 4.0 Dividend (%) N/A N/A Denis O'Brien 3.3 TSR N/A N/A
Price (c) Shares (m) Mkt. Cap (€m) E.V. (€m) Mkt. Cap. / EV (%) Mkt. Weight (%) Free Float (%) Daily No. Shares Traded (m) Daily Value Traded (€m) 64 534.0 341.8 -144.6 N/A 0.3 41.8 0.271 0.186
Aer Lingus

Research Report: Davy on Airlines January 19, 2012
53 Davy Research
53 Davy Research
SUMMARY ACCOUNTS Mar10 Mar11 Dec11E Dec12F Dec13F I N C O M E S T A T E M E N T ( € M ) Revenue 20999.0 23621.0 18998.6 25117.0 26207.0 Total operating expenses -19923.0 -21045.0 -17061.0 -23073.0 -23554.0 EBITDAR 1076.0 2576.0 1937.6 2044.0 2653.0 Aircraft rental 721.0 830.0 635.0 867.5 894.0 Depreciation 1640.0 1624.0 1220.0 1661.2 1694.0 Amortisation of intangibles 0.0 0.0 0.0 0.0 0.0 Operating profit -1285.0 122.0 82.6 -484.7 65.0 Other income from operations 0.0 -12.0 -24.0 0.0 0.0 Share of associate / JV after-tax profits 0.0 0.0 0.0 0.0 0.0 PBIT before exceptionals -1285.0 110.0 58.6 -484.7 65.0 Group net interest -304.0 -371.0 -277.0 -360.0 -340.0 Other finance costs -368.0 -322.0 -143.0 0.0 0.0 Total finance costs -672.0 -693.0 -420.0 -360.0 -340.0 Exceptionals -189.0 999.0 0.0 0.0 0.0 PBT -2146.0 416.0 -361.4 -844.7 -275.0 Tax 586.0 196.0 138.2 211.0 68.7 Minorities (incl. pref. divs.) 1.0 1.0 -5.0 -8.0 -8.0 Earnings (basic) -1559.0 613.0 -228.2 -641.7 -214.3 Average no. of shares (m) - basic 294.7 294.3 295.7 295.7 295.7 Average no. of shares (m) - diluted 294.7 294.3 300.3 300.3 300.3 P E R S H A R E D A T A ( C ) EPS Basic -529.0 208.3 -77.2 -217.0 -72.5 EPS Diluted (Adj) -464.9 -131.2 -76.0 -213.7 -71.4 Cash EPS (Diluted) 91.6 420.7 330.3 339.5 492.7 Dividend 0.0 0.0 0.0 0.0 0.0 NBV 1819.8 2325.0 2205.9 1923.9 1852.6 NBV (incl. amortisation of intangibles) 1849.6 2354.9 2235.3 1953.2 1881.9 C A S H F L O W ( € M ) EBITDA 355.0 1746.0 1302.6 1176.5 1759.0 Change in working capital -555.0 406.0 56.0 63.0 87.0 Share-based payments 0.0 0.0 0.0 0.0 0.0 Cash generated from operations -200.0 2151.0 1359.0 1239.0 1847.0 Net capital expenditure -1044.0 -1145.0 -1145.0 -1100.0 -1550.0 Operating cashflow -1244.0 1006.0 214.0 139.0 297.0 Net interest -304.0 -405.0 -277.0 -360.0 -340.0 Tax 100.0 0.0 138.0 211.0 69.0 Dividends from associates 0.0 0.0 0.0 0.0 0.0 Dividends to minorities 0.0 0.0 0.0 0.0 0.0 Free cash flow -1448.0 601.0 75.0 -10.0 26.0 Dividends to shareholders 0.0 -3.0 0.0 0.0 0.0 Acquisitions & investments -15.0 0.0 0.0 0.0 0.0 Business disposals 0.0 193.0 0.0 0.0 0.0 Share Issues / (Buybacks) 0.0 0.0 0.0 0.0 0.0 Translation differences 0.0 0.0 0.0 0.0 0.0 Other -318.0 -457.0 -734.0 1.0 0.0 Change in net cash / debt -1781.0 334.0 -659.0 -9.0 26.0 B A L A N C E S H E E T ( € M ) Property, plant & equipment 13601.0 13151.0 12672.0 12444.0 11883.0 Intangible assets 1013.0 1117.0 1117.0 1117.0 1117.0 Investments in associates / jv's 4019.0 5071.0 5071.0 5071.0 5071.0 Working capital -3322.0 -1889.0 -1945.0 -2009.0 -2096.0 Other 1123.0 1095.0 1128.0 1128.0 1128.0 Capital Employed 16434.0 18545.0 18043.0 17751.0 17103.0 Financed by Equity capital & reserves 5363.0 6852.0 6624.0 5777.0 5563.0 Minority interests 55.0 54.0 54.0 54.0 54.0 Preference shares 0.0 0.0 0.0 0.0 0.0 Net Debt/(Cash) 6225.0 5891.0 6550.0 6559.0 6533.0 Deferred consideration/debt-related 418.0 511.0 511.0 511.0 511.0 Retirement benefit obligations 0.0 0.0 0.0 0.0 0.0 Net deferred tax 0.0 0.0 0.0 0.0 0.0 Other long-term liabilities 4373.0 5237.0 4304.0 4850.0 4442.0 Capital Employed 16434.0 18545.0 18043.0 17751.0 17103.0 Intangibles amortised 88.0 88.0 88.0 88.0 88.0 Capital employed inc. intangibles 16522.0 18633.0 18131.0 17839.0 17191.0 Invested capital inc. intangibles 12149.0 13396.0 13827.0 12989.0 12749.0 *Data to Dec 2011 is 9 months
INDUSTRY DRIVERS Mar10 Mar11 Dec11E Dec12F Dec13F Load factor (%) 80.7 81.6 81.9 81.9 81.9 Yield (% change) -10.8 10.4 -1.5 1.0 1.0 Oil price (USD per barrel) 70.0 80.0 91.8 97.4 102.4 Ex-fuel costs (% change) -0.2 1.3 -3.1 -2.0 -1.8 Capacity growth (%) -4.3 -0.1 5.7 3.1 3.8
CALENDAR Date Ex-Div Interims 09-11-11 Finals 07-03-12 AGM 07-07-11 Updated 18-01-12
VALUATION Dec11E Dec12F Dec13F
P/E N/A N/A N/A Dividend Yield (%) 0.0 0.0 0.0 Free Cash Flow Yield (pre divs) (%) 5.6 N/A 1.9 Price / Book 0.20 0.23 0.24 EV / Revenue 0.18 0.14 0.13 EV / EBITDAR 1.7 1.7 1.3 EV / EBITA N/A N/A 3.5 EV / Operating Cashflow 15.8 24.4 11.4 EV / Invested Capital 0.61 0.65 0.66 PEG (Hist P/E/4yr gwth) N/A
PRICE PERFORMANCE (%)
1 Wk 1 Mth 3 Mths 6 Mths YTD 1 Yr
Absolute 15.0 13.5 -20.1 -51.7 12.7 -69.3 Rel to CAC 40 13.0 3.2 -22.7 -45.0 8.9 -62.6 Rel to E300 14.2 5.0 -25.4 -49.3 9.1 -65.6 Rel to E300 Travel & Leisure 16.3 7.9 -25.7 -49.5 11.8 -63.9
PRICE AND P/E HISTORY Price Hist P/E High Low Yr End High Low Average
2012 448 381 N/A N/A N/A 2011 1512 348 397 N/A N/A N/A 2010 1440 885 1363 N/A N/A N/A 2009 1283 637 1100 3.7 N/A N/A 2008 2364 917 917 N/A N/A N/A 2007 3830 2211 2405 N/A N/A N/A
KEY RATIOS Mar10 Mar11 Dec11E Dec12F Dec13F G R O W T H
EPS Diluted (Adj) (%) N/A N/A N/A N/A N/A Revenue (%) -12.4 12.5 N/A 32.2 4.3 EBITDAR (%) -49.3 139.4 N/A 5.5 29.8 EBITDA (%) -75.9 391.8 N/A -9.7 49.5 P R O F I T A B I L I T Y / A C T I V I T Y
EBITDAR margin (%) 5.1 10.9 10.2 8.1 10.1 EBITA margin (%) N/A 0.5 0.4 N/A 0.2 Revenue / Capital Employed (x) 1.77 1.81 1.43 1.94 2.11 R E T U R N
ROCE (before tax, ex. invs) (%) N/A 0.8 0.4 N/A 0.5 ROE (after tax) (%) N/A N/A N/A N/A N/A Ret. on Inv. Cap. (after tax) (%) N/A 0.6 0.3 N/A 0.4 WACC (%) 5.5 5.4 3.5 4.6 4.3 F I N A N C I A L / G E N E R A L
EBITDAR Interest Cover (x) 3.5 6.9 7.0 5.7 7.8 Group Interest Cover (x) N/A 0.3 0.2 N/A 0.2 Debt / EBITDAR (x) 6.2 2.5 3.6 3.5 2.7 Debt / Equity (%) 122.6 92.7 105.7 121.2 125.4 Debt / Free Cash Flow (x) N/A 10.7 94.1 N/A 270.9 Avg. Cost of Debt (before tax) (%) 5.7 6.1 4.5 5.5 5.2 Ret. benefits deficit / market cap (%) N/A N/A N/A N/A N/A Dividend Cover (x) N/A N/A N/A N/A N/A Working Capital / Revenue (%) N/A N/A N/A N/A N/A Net Capex / Depreciation (%) 63.7 70.5 93.9 66.2 91.5 Tax rate (%) (unadjusted) N/A N/A N/A N/A N/A
CAGR(%) 5 Year 10 Year MAJOR SHAREHOLDERS % Revenue (%) -2.4 4.5 French State 15.7 EBITDA (%) -9.7 1.9 Capital Research & Mgmt 5.2 EPS Diluted (Adj) (%) N/A N/A AllianceBernstein 5.0 Cash EPS (Diluted) (%) -15.7 -4.3 Dividend (%) N/A N/A TSR -31.9 -11.6
Price (c) Shares (m) Mkt. Cap (€m) E.V. (€m) Mkt. Cap. / EV (%) Mkt. Weight (%) Free Float (%) Daily No. Shares Traded (m) Daily Value Traded (€m) 448 300.2 1344.1 8468.1 15.9 82.4 3.938 17.187
Air France-KLM
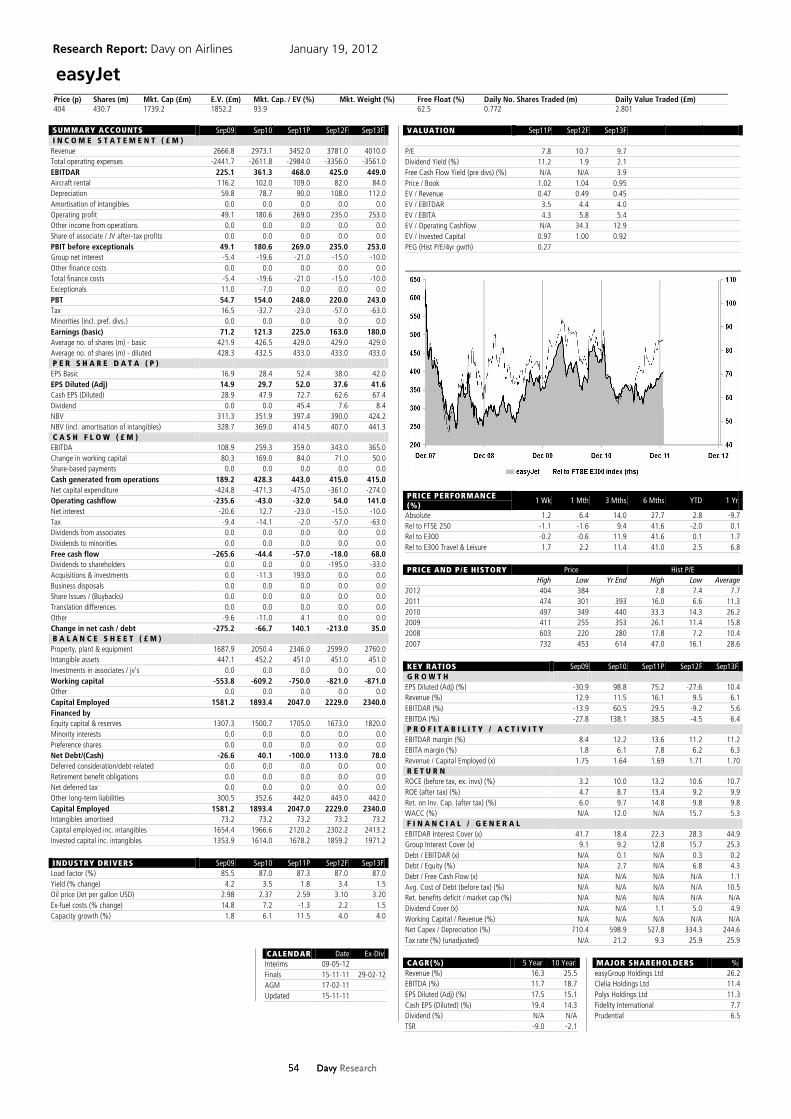
Research Report: Davy on Airlines January 19, 2012
54 Davy Research
54 Davy Research
SUMMARY ACCOUNTS Sep09 Sep10 Sep11P Sep12F Sep13F I N C O M E S T A T E M E N T ( £ M ) Revenue 2666.8 2973.1 3452.0 3781.0 4010.0 Total operating expenses -2441.7 -2611.8 -2984.0 -3356.0 -3561.0 EBITDAR 225.1 361.3 468.0 425.0 449.0 Aircraft rental 116.2 102.0 109.0 82.0 84.0 Depreciation 59.8 78.7 90.0 108.0 112.0 Amortisation of intangibles 0.0 0.0 0.0 0.0 0.0 Operating profit 49.1 180.6 269.0 235.0 253.0 Other income from operations 0.0 0.0 0.0 0.0 0.0 Share of associate / JV after-tax profits 0.0 0.0 0.0 0.0 0.0 PBIT before exceptionals 49.1 180.6 269.0 235.0 253.0 Group net interest -5.4 -19.6 -21.0 -15.0 -10.0 Other finance costs 0.0 0.0 0.0 0.0 0.0 Total finance costs -5.4 -19.6 -21.0 -15.0 -10.0 Exceptionals 11.0 -7.0 0.0 0.0 0.0 PBT 54.7 154.0 248.0 220.0 243.0 Tax 16.5 -32.7 -23.0 -57.0 -63.0 Minorities (incl. pref. divs.) 0.0 0.0 0.0 0.0 0.0 Earnings (basic) 71.2 121.3 225.0 163.0 180.0 Average no. of shares (m) - basic 421.9 426.5 429.0 429.0 429.0 Average no. of shares (m) - diluted 428.3 432.5 433.0 433.0 433.0 P E R S H A R E D A T A ( P ) EPS Basic 16.9 28.4 52.4 38.0 42.0 EPS Diluted (Adj) 14.9 29.7 52.0 37.6 41.6 Cash EPS (Diluted) 28.9 47.9 72.7 62.6 67.4 Dividend 0.0 0.0 45.4 7.6 8.4 NBV 311.3 351.9 397.4 390.0 424.2 NBV (incl. amortisation of intangibles) 328.7 369.0 414.5 407.0 441.3 C A S H F L O W ( £ M ) EBITDA 108.9 259.3 359.0 343.0 365.0 Change in working capital 80.3 169.0 84.0 71.0 50.0 Share-based payments 0.0 0.0 0.0 0.0 0.0 Cash generated from operations 189.2 428.3 443.0 415.0 415.0 Net capital expenditure -424.8 -471.3 -475.0 -361.0 -274.0 Operating cashflow -235.6 -43.0 -32.0 54.0 141.0 Net interest -20.6 12.7 -23.0 -15.0 -10.0 Tax -9.4 -14.1 -2.0 -57.0 -63.0 Dividends from associates 0.0 0.0 0.0 0.0 0.0 Dividends to minorities 0.0 0.0 0.0 0.0 0.0 Free cash flow -265.6 -44.4 -57.0 -18.0 68.0 Dividends to shareholders 0.0 0.0 0.0 -195.0 -33.0 Acquisitions & investments 0.0 -11.3 193.0 0.0 0.0 Business disposals 0.0 0.0 0.0 0.0 0.0 Share Issues / (Buybacks) 0.0 0.0 0.0 0.0 0.0 Translation differences 0.0 0.0 0.0 0.0 0.0 Other -9.6 -11.0 4.1 0.0 0.0 Change in net cash / debt -275.2 -66.7 140.1 -213.0 35.0 B A L A N C E S H E E T ( £ M ) Property, plant & equipment 1687.9 2050.4 2346.0 2599.0 2760.0 Intangible assets 447.1 452.2 451.0 451.0 451.0 Investments in associates / jv's 0.0 0.0 0.0 0.0 0.0 Working capital -553.8 -609.2 -750.0 -821.0 -871.0 Other 0.0 0.0 0.0 0.0 0.0 Capital Employed 1581.2 1893.4 2047.0 2229.0 2340.0 Financed by Equity capital & reserves 1307.3 1500.7 1705.0 1673.0 1820.0 Minority interests 0.0 0.0 0.0 0.0 0.0 Preference shares 0.0 0.0 0.0 0.0 0.0 Net Debt/(Cash) -26.6 40.1 -100.0 113.0 78.0 Deferred consideration/debt-related 0.0 0.0 0.0 0.0 0.0 Retirement benefit obligations 0.0 0.0 0.0 0.0 0.0 Net deferred tax 0.0 0.0 0.0 0.0 0.0 Other long-term liabilities 300.5 352.6 442.0 443.0 442.0 Capital Employed 1581.2 1893.4 2047.0 2229.0 2340.0 Intangibles amortised 73.2 73.2 73.2 73.2 73.2 Capital employed inc. intangibles 1654.4 1966.6 2120.2 2302.2 2413.2 Invested capital inc. intangibles 1353.9 1614.0 1678.2 1859.2 1971.2
INDUSTRY DRIVERS Sep09 Sep10 Sep11P Sep12F Sep13F Load factor (%) 85.5 87.0 87.3 87.0 87.0 Yield (% change) 4.2 3.5 1.8 3.4 1.5 Oil price (Jet per gallon USD) 2.98 2.37 2.59 3.10 3.20 Ex-fuel costs (% change) 14.8 7.2 -1.3 2.2 1.5 Capacity growth (%) 1.8 6.1 11.5 4.0 4.0
CALENDAR Date Ex-Div Interims 09-05-12 Finals 15-11-11 29-02-12 AGM 17-02-11 Updated 15-11-11
VALUATION Sep11P Sep12F Sep13F
P/E 7.8 10.7 9.7 Dividend Yield (%) 11.2 1.9 2.1 Free Cash Flow Yield (pre divs) (%) N/A N/A 3.9 Price / Book 1.02 1.04 0.95 EV / Revenue 0.47 0.49 0.45 EV / EBITDAR 3.5 4.4 4.0 EV / EBITA 4.3 5.8 5.4 EV / Operating Cashflow N/A 34.3 12.9 EV / Invested Capital 0.97 1.00 0.92 PEG (Hist P/E/4yr gwth) 0.27
PRICE PERFORMANCE (%)
1 Wk 1 Mth 3 Mths 6 Mths YTD 1 Yr
Absolute 1.2 6.4 14.0 27.7 2.8 -9.7 Rel to FTSE 250 -1.1 -1.6 9.4 41.6 -2.0 0.1 Rel to E300 -0.2 -0.6 11.9 41.6 0.1 1.7 Rel to E300 Travel & Leisure 1.7 2.2 11.4 41.0 2.5 6.8
PRICE AND P/E HISTORY Price Hist P/E High Low Yr End High Low Average
2012 404 384 7.8 7.4 7.7 2011 474 301 393 16.0 6.6 11.3 2010 497 349 440 33.3 14.3 26.2 2009 411 255 353 26.1 11.4 15.8 2008 603 220 280 17.8 7.2 10.4 2007 732 453 614 47.0 16.1 28.6
KEY RATIOS Sep09 Sep10 Sep11P Sep12F Sep13F G R O W T H
EPS Diluted (Adj) (%) -30.9 98.8 75.2 -27.6 10.4 Revenue (%) 12.9 11.5 16.1 9.5 6.1 EBITDAR (%) -13.9 60.5 29.5 -9.2 5.6 EBITDA (%) -27.8 138.1 38.5 -4.5 6.4 P R O F I T A B I L I T Y / A C T I V I T Y
EBITDAR margin (%) 8.4 12.2 13.6 11.2 11.2 EBITA margin (%) 1.8 6.1 7.8 6.2 6.3 Revenue / Capital Employed (x) 1.75 1.64 1.69 1.71 1.70 R E T U R N
ROCE (before tax, ex. invs) (%) 3.2 10.0 13.2 10.6 10.7 ROE (after tax) (%) 4.7 8.7 13.4 9.2 9.9 Ret. on Inv. Cap. (after tax) (%) 6.0 9.7 14.8 9.8 9.8 WACC (%) N/A 12.0 N/A 15.7 5.3 F I N A N C I A L / G E N E R A L
EBITDAR Interest Cover (x) 41.7 18.4 22.3 28.3 44.9 Group Interest Cover (x) 9.1 9.2 12.8 15.7 25.3 Debt / EBITDAR (x) N/A 0.1 N/A 0.3 0.2 Debt / Equity (%) N/A 2.7 N/A 6.8 4.3 Debt / Free Cash Flow (x) N/A N/A N/A N/A 1.1 Avg. Cost of Debt (before tax) (%) N/A N/A N/A N/A 10.5 Ret. benefits deficit / market cap (%) N/A N/A N/A N/A N/A Dividend Cover (x) N/A N/A 1.1 5.0 4.9 Working Capital / Revenue (%) N/A N/A N/A N/A N/A Net Capex / Depreciation (%) 710.4 598.9 527.8 334.3 244.6 Tax rate (%) (unadjusted) N/A 21.2 9.3 25.9 25.9
CAGR(%) 5 Year 10 Year MAJOR SHAREHOLDERS % Revenue (%) 16.3 25.5 easyGroup Holdings Ltd 26.2 EBITDA (%) 11.7 18.7 Clelia Holdings Ltd 11.4 EPS Diluted (Adj) (%) 17.5 15.1 Polys Holdings Ltd 11.3 Cash EPS (Diluted) (%) 19.4 14.3 Fidelity International 7.7 Dividend (%) N/A N/A Prudential 6.5 TSR -9.0 -2.1
Price (p) Shares (m) Mkt. Cap (£m) E.V. (£m) Mkt. Cap. / EV (%) Mkt. Weight (%) Free Float (%) Daily No. Shares Traded (m) Daily Value Traded (£m) 404 430.7 1739.2 1852.2 93.9 62.5 0.772 2.801
easyJet

Research Report: Davy on Airlines January 19, 2012
55 Davy Research
55 Davy Research
SUMMARY ACCOUNTS Dec09 Dec10 Dec11E Dec12F Dec13F I N C O M E S T A T E M E N T ( € M ) Revenue 13456.0 14798.0 16426.6 17355.6 18248.0 Total operating expenses -12963.0 -13147.0 -14549.1 -15599.1 -16295.2 EBITDAR 493.0 1651.0 1877.5 1756.5 1952.8 Aircraft rental 427.0 401.0 399.0 411.0 423.3 Depreciation 976.0 1025.0 1019.1 1049.5 1081.1 Amortisation of intangibles 0.0 0.0 0.0 0.0 0.0 Operating profit -910.0 225.0 459.4 296.0 448.4 Other income from operations -185.0 42.0 0.0 0.0 0.0 Share of associate / JV after-tax profits 8.0 20.0 0.0 0.0 0.0 PBIT before exceptionals -1087.0 287.0 459.4 296.0 448.4 Group net interest -60.0 -148.0 -90.0 -86.0 -132.4 Other finance costs -11.0 -55.0 0.0 0.0 0.0 Total finance costs -71.0 -203.0 -90.0 -86.0 -132.4 Exceptionals 0.0 0.0 -71.5 0.0 0.0 PBT -1158.0 84.0 297.9 210.0 316.0 Tax 381.0 16.0 -2.7 -52.5 -79.0 Minorities (incl. pref. divs.) 0.0 0.0 0.0 0.0 0.0 Earnings (basic) -777.0 100.0 295.2 157.5 237.0 Average no. of shares (m) - basic 1855.0 1855.0 1848.0 1848.0 1848.0 Average no. of shares (m) - diluted 2040.0 2040.0 2051.0 2051.0 2051.0 P E R S H A R E D A T A ( C ) EPS Basic -41.9 5.4 16.0 8.5 12.8 EPS Diluted (Adj) -38.1 4.9 17.9 7.7 11.6 Cash EPS (Diluted) 9.8 55.1 67.6 58.8 64.3 Dividend 0.0 0.0 0.0 0.0 1.3 NBV 196.5 238.9 255.7 264.3 275.8 NBV (incl. amortisation of intangibles) 196.5 238.9 255.7 264.3 275.8 C A S H F L O W ( € M ) EBITDA 66.0 1250.0 1478.5 1345.5 1529.5 Change in working capital -323.0 244.0 373.0 212.0 206.0 Share-based payments 0.0 0.0 0.0 0.0 0.0 Cash generated from operations -257.0 1527.0 1852.0 1557.0 1735.0 Net capital expenditure -652.0 -557.0 -1100.0 -1600.0 -2000.0 Operating cashflow -909.0 970.0 752.0 -43.0 -265.0 Net interest -166.0 -179.0 -90.0 -86.0 -132.0 Tax 22.0 6.0 -3.0 -53.0 -79.0 Dividends from associates 0.0 0.0 0.0 0.0 0.0 Dividends to minorities 0.0 0.0 0.0 0.0 0.0 Free cash flow -1053.0 797.0 659.0 -182.0 -476.0 Dividends to shareholders 0.0 0.0 0.0 0.0 0.0 Acquisitions & investments 0.0 0.0 0.0 0.0 0.0 Business disposals 0.0 0.0 0.0 0.0 0.0 Share Issues / (Buybacks) 0.0 0.0 0.0 0.0 0.0 Translation differences 250.0 157.0 0.0 0.0 0.0 Other 449.0 -524.0 -624.0 -249.0 -250.0 Change in net cash / debt -354.0 430.0 35.0 -431.0 -726.0 B A L A N C E S H E E T ( € M ) Property, plant & equipment 8832.0 9224.0 9305.0 9855.0 10774.0 Intangible assets 349.0 383.0 383.0 383.0 383.0 Investments in associates / jv's 1840.0 2700.0 2700.0 2700.0 2700.0 Working capital -2877.0 -3703.0 -4077.0 -4288.0 -4493.0 Other 153.0 282.0 652.0 699.0 742.0 Capital Employed 8297.0 8886.0 8963.0 9349.0 10106.0 Financed by Equity capital & reserves 3646.0 4431.0 4726.2 4883.8 5097.0 Minority interests 227.0 239.0 200.0 200.0 200.0 Preference shares 0.0 0.0 0.0 0.0 0.0 Net Debt/(Cash) 1325.0 895.0 860.0 1291.0 2017.0 Deferred consideration/debt-related 888.0 1119.0 1150.0 1150.0 1150.0 Retirement benefit obligations 0.0 0.0 0.0 0.0 0.0 Net deferred tax 0.0 0.0 0.0 0.0 0.0 Other long-term liabilities 2211.0 2202.0 2026.8 1824.2 1641.0 Capital Employed 8297.0 8886.0 8963.0 9349.0 10105.0 Intangibles amortised 0.0 0.0 0.0 0.0 0.0 Capital employed inc. intangibles 8297.0 8886.0 8963.0 9349.0 10105.0 Invested capital inc. intangibles 6086.0 6684.0 6936.2 7524.8 8464.0
INDUSTRY DRIVERS Dec09 Dec10 Dec11E Dec12F Dec13F Load factor (%) 78.6 79.0 79.2 79.7 79.7 Yield (% change) 0.0 13.2 3.7 2.9 2.2 Oil price (USD per barrel) 0.0 69.3 87.8 98.5 105.0 Ex-fuel costs (% change) 0.0 6.8 -5.0 -0.3 -0.7 Capacity growth (%) -4.6 -3.4 7.2 2.5 2.5
CALENDAR Date Ex-Div Interims 03-08-12 Finals 29-02-12 AGM Updated 16-11-11
VALUATION Dec11E Dec12F Dec13F
P/E 10.5 24.5 16.3 Dividend Yield (%) 0.0 0.0 0.7 Free Cash Flow Yield (pre divs) (%) 18.8 N/A N/A Price / Book 0.74 0.71 0.68 EV / Revenue 0.18 0.20 0.23 EV / EBITDAR 1.6 2.0 2.1 EV / EBITA 3.5 4.9 4.8 EV / Operating Cashflow 4.0 N/A N/A EV / Invested Capital 0.82 0.82 0.81 PEG (Hist P/E/4yr gwth) N/A
PRICE PERFORMANCE (%)
1 Wk 1 Mth 3 Mths 6 Mths YTD 1 Yr
Absolute 6.2 10.8 2.1 -27.2 8.3 -47.1 Rel to IBEX 35 5.4 6.5 4.9 -19.1 8.7 -36.2 Rel to E300 5.5 2.5 -4.6 -23.5 4.9 -40.8 Rel to E300 Travel & Leisure 7.4 5.3 -5.0 -23.9 7.5 -37.8
PRICE AND P/E HISTORY Price Hist P/E High Low Yr End High Low Average
2012 189 175 38.5 35.6 37.1 2011 366 153 174 70.9 N/A 41.1 2010 329 210 318 N/A N/A N/A 2009 269 128 210 3.0 N/A N/A 2008 448 139 186 12.7 1.9 5.9 2007 869 417 422 18.4 10.9 14.7
KEY RATIOS Dec09 Dec10 Dec11E Dec12F Dec13F G R O W T H
EPS Diluted (Adj) (%) N/A N/A 265.2 -57.1 50.5 Revenue (%) N/A 10.0 11.0 5.7 5.1 EBITDAR (%) N/A 234.9 13.7 -6.4 11.2 EBITDA (%) N/A N/A 18.3 -9.0 13.7 P R O F I T A B I L I T Y / A C T I V I T Y
EBITDAR margin (%) 3.7 11.2 11.4 10.1 10.7 EBITA margin (%) N/A 1.5 2.8 1.7 2.5 Revenue / Capital Employed (x) 4.82 2.34 2.64 2.69 2.60 R E T U R N
ROCE (before tax, ex. invs) (%) N/A 4.2 7.4 4.6 6.4 ROE (after tax) (%) N/A 2.5 8.0 3.3 4.7 Ret. on Inv. Cap. (after tax) (%) N/A 5.5 6.7 3.1 4.2 Cost of Equity (%) 8.3 7.7 7.5 6.6 6.6 F I N A N C I A L / G E N E R A L
EBITDAR Interest Cover (x) 8.2 11.2 20.9 20.4 14.7 Group Interest Cover (x) N/A 1.9 5.1 3.4 3.4 Debt / EBITDAR (x) 4.5 1.2 1.1 1.4 1.6 Debt / Equity (%) 57.1 43.1 40.8 48.0 59.8 Debt / Free Cash Flow (x) N/A 2.5 3.1 N/A N/A Avg. Cost of Debt (before tax) (%) 5.2 13.3 10.3 8.0 8.0 Ret. benefits deficit / market cap (%) N/A N/A N/A N/A N/A Dividend Cover (x) N/A N/A N/A N/A 8.9 Working Capital / Revenue (%) N/A N/A N/A N/A N/A Net Capex / Depreciation (%) 66.8 54.3 107.9 152.5 185.0 Tax rate (%) (unadjusted) N/A N/A 0.9 25.0 25.0
CAGR(%) 5 Year 10 Year MAJOR SHAREHOLDERS % Revenue (%) N/A N/A Caja Madrid 12.1 EBITDA (%) N/A N/A Blackrock 6.0 EPS Diluted (Adj) (%) N/A N/A Lloyds Banking Group 3.8 Cash EPS (Diluted) (%) N/A N/A Union Bank of Switzerland 3.1 Dividend (%) N/A N/A TSR -25.5 -5.8
Price (c) Shares (m) Mkt. Cap (€m) E.V. (€m) Mkt. Cap. / EV (%) Mkt. Weight (%) Free Float (%) Daily No. Shares Traded (m) Daily Value Traded (€m) 189 1855.4 3497.4 6138.4 57.0 87.8 10.870 19.234
IAG

Research Report: Davy on Airlines January 19, 2012
56 Davy Research
56 Davy Research
SUMMARY ACCOUNTS Dec09 Dec10 Dec11E Dec12F Dec13F I N C O M E S T A T E M E N T ( € M ) Revenue 25039.0 30144.0 32023.9 33290.2 35004.4 Total operating expenses -23096.0 -27340.0 -29458.1 -30816.4 -32356.8 EBITDAR 1943.0 2804.0 2565.8 2473.8 2647.6 Aircraft rental 338.0 246.0 199.5 197.5 195.5 Depreciation 1475.0 1682.0 1683.0 1683.0 1683.0 Amortisation of intangibles 0.0 0.0 0.0 0.0 0.0 Operating profit 130.0 876.0 683.3 593.3 769.1 Other income from operations 0.0 0.0 0.0 0.0 0.0 Share of associate / JV after-tax profits 58.0 104.0 82.0 80.0 80.0 PBIT before exceptionals 188.0 980.0 765.3 673.3 849.1 Group net interest -325.0 -357.0 -294.0 -320.0 -320.0 Other finance costs -92.0 355.0 -76.0 0.0 0.0 Total finance costs -417.0 -2.0 -370.0 -320.0 -320.0 Exceptionals 0.0 0.0 0.0 0.0 0.0 PBT -229.0 978.0 395.3 353.3 529.1 Tax 129.0 165.0 -62.3 -88.3 -132.3 Minorities (incl. pref. divs.) -12.0 -12.0 -13.0 -8.0 -8.0 Earnings (basic) -112.0 1131.0 320.0 257.0 388.8 Average no. of shares (m) - basic 457.9 457.9 457.9 457.9 457.9 Average no. of shares (m) - diluted 460.5 458.3 458.3 458.3 458.3 P E R S H A R E D A T A ( C ) EPS Basic -24.5 247.0 69.9 56.1 84.9 EPS Diluted (Adj) -24.3 246.8 86.4 56.1 84.8 Cash EPS (Diluted) 296.0 613.8 453.6 423.3 452.1 Dividend 0.0 60.0 45.0 39.0 50.0 NBV 1323.3 1789.8 1904.0 1998.7 2133.5 NBV (incl. amortisation of intangibles) 1323.3 1789.8 1904.0 1998.7 2133.5 C A S H F L O W ( € M ) EBITDA 1605.0 2558.0 2366.3 2276.3 2452.1 Change in working capital 224.0 475.0 475.0 350.0 350.0 Share-based payments 0.0 0.0 0.0 0.0 0.0 Cash generated from operations 1829.0 3033.0 2841.1 2626.1 2802.0 Net capital expenditure -2368.0 -1450.0 -2000.0 -2100.0 -2000.0 Operating cashflow -539.0 1583.0 841.1 526.1 802.0 Net interest -281.0 -451.0 -294.0 -320.0 -320.0 Tax 48.0 -110.0 -62.3 -88.3 -132.3 Dividends from associates 0.0 0.0 0.0 0.0 0.0 Dividends to minorities 0.0 0.0 0.0 0.0 0.0 Free cash flow -772.0 1022.0 484.8 117.8 349.7 Dividends to shareholders -333.0 -18.0 -206.1 -179.0 -232.0 Acquisitions & investments -1215.0 0.0 0.0 0.0 0.0 Business disposals 0.0 -13.0 0.0 0.0 0.0 Share Issues / (Buybacks) 0.0 0.0 0.0 0.0 0.0 Translation differences 0.0 -392.0 -200.0 -200.0 -200.0 Other 0.0 0.0 0.0 0.0 0.1 Change in net cash / debt -2320.0 599.0 78.7 -261.2 -82.2 B A L A N C E S H E E T ( € M ) Property, plant & equipment 13411.0 14150.0 14467.1 14884.2 15201.3 Intangible assets 2311.0 2733.0 2733.0 2733.0 2733.0 Investments in associates / jv's 1839.0 1911.0 1911.0 1911.0 1911.0 Working capital -2797.0 -2315.0 -2459.4 -2556.6 -2688.3 Other 135.0 169.0 169.0 169.0 169.0 Capital Employed 14899.0 16648.0 16820.7 17140.6 17326.0 Financed by Equity capital & reserves 6094.0 8242.0 8768.0 9203.9 9824.7 Minority interests 108.0 98.0 47.0 47.0 47.0 Preference shares 0.0 0.0 0.0 0.0 0.0 Net Debt/(Cash) 2195.0 1596.0 1517.3 1778.5 1860.7 Deferred consideration/debt-related 0.0 0.0 0.0 0.0 0.0 Retirement benefit obligations 0.0 0.0 0.0 0.0 0.0 Net deferred tax 888.0 516.0 516.0 516.0 516.0 Other long-term liabilities 5614.0 6196.0 5972.4 5595.2 5077.6 Capital Employed 14899.0 16648.0 16820.7 17140.6 17326.0 Intangibles amortised 0.0 0.0 0.0 0.0 0.0 Capital employed inc. intangibles 14899.0 16648.0 16820.7 17140.6 17326.0 Invested capital inc. intangibles 8397.0 9936.0 10332.3 11029.4 11732.4
INDUSTRY DRIVERS Dec09 Dec10 Dec11E Dec12F Dec13F Load factor (%) 77.8 79.2 77.7 78.7 78.7 Yield (% change) -12.2 6.0 1.3 1.3 1.1 Oil price (USD per barrel) 63.3 80.2 94.8 103.0 105.0 Ex-fuel costs (% change) -0.7 0.8 -7.1 -0.8 -0.2 Capacity growth (%) 5.5 15.4 10.8 3.0 5.0
CALENDAR Date Ex-Div Interims 02-08-12 Finals 15-03-12 AGM 08-05-12 Updated 18-01-12
VALUATION Dec11E Dec12F Dec13F
P/E 11.1 17.1 11.3 Dividend Yield (%) 4.7 4.1 5.2 Free Cash Flow Yield (pre divs) (%) 11.1 2.7 8.0 Price / Book 0.50 0.48 0.45 EV / Revenue 0.13 0.13 0.13 EV / EBITDAR 1.6 1.7 1.7 EV / EBITA 4.6 5.4 4.5 EV / Operating Cashflow 4.8 8.2 5.5 EV / Invested Capital 0.58 0.56 0.54 PEG (Hist P/E/4yr gwth) N/A
PRICE PERFORMANCE (%)
1 Wk 1 Mth 3 Mths 6 Mths YTD 1 Yr
Absolute 7.1 7.2 -1.2 -32.4 4.2 -42.6 Rel to DAX 4.2 -3.5 -8.6 -22.9 -3.0 -35.8 Rel to E300 6.3 -0.8 -7.8 -29.0 0.9 -35.8 Rel to E300 Travel & Leisure 8.3 2.0 -8.1 -29.3 3.4 -32.5
PRICE AND P/E HISTORY Price Hist P/E High Low Yr End High Low Average
2012 967 887 3.9 3.6 3.7 2011 1739 835 919 6.4 N/A N/A 2010 1777 1034 1636 9.8 N/A N/A 2009 1231 786 1175 9.5 6.1 8.0 2008 1832 899 1119 N/A N/A N/A 2007 2272 1710 1822 N/A N/A N/A
KEY RATIOS Dec09 Dec10 Dec11E Dec12F Dec13F G R O W T H
EPS Diluted (Adj) (%) N/A N/A -65.0 -35.1 51.3 Revenue (%) -7.3 20.4 6.2 4.0 5.1 EBITDAR (%) -33.5 44.3 -8.5 -3.6 7.0 EBITDA (%) -39.3 59.4 -7.5 -3.8 7.7 P R O F I T A B I L I T Y / A C T I V I T Y
EBITDAR margin (%) 7.8 9.3 8.0 7.4 7.6 EBITA margin (%) 0.5 2.9 2.1 1.8 2.2 Revenue / Capital Employed (x) 2.03 2.17 2.16 2.21 2.28 R E T U R N
ROCE (before tax, ex. invs) (%) 1.1 6.3 4.6 3.9 5.0 ROE (after tax) (%) N/A 15.8 4.7 2.9 4.1 Ret. on Inv. Cap. (after tax) (%) 1.7 12.5 6.2 4.5 5.5 WACC (%) 11.0 10.5 9.6 8.8 8.3 F I N A N C I A L / G E N E R A L
EBITDAR Interest Cover (x) 6.0 7.9 8.7 7.7 8.3 Group Interest Cover (x) 0.6 2.7 2.6 2.1 2.7 Debt / EBITDAR (x) 1.1 0.6 0.6 0.7 0.7 Debt / Equity (%) 35.4 19.1 17.2 19.2 18.8 Debt / Free Cash Flow (x) N/A 1.6 3.1 15.1 5.3 Avg. Cost of Debt (before tax) (%) N/A 18.8 18.9 19.4 17.6 Ret. benefits deficit / market cap (%) N/A N/A N/A N/A N/A Dividend Cover (x) N/A 4.1 1.9 1.4 1.7 Working Capital / Revenue (%) N/A N/A N/A N/A N/A Net Capex / Depreciation (%) 160.5 86.2 118.8 124.8 118.8 Tax rate (%) (unadjusted) N/A N/A 15.8 25.0 25.0
CAGR(%) 5 Year 10 Year MAJOR SHAREHOLDERS % Revenue (%) 8.6 5.6 Blackrock 5.5 EBITDA (%) 4.6 3.8 Deka International 3.1 EPS Diluted (Adj) (%) -0.9 N/A Cash EPS (Diluted) (%) 7.3 6.8 Dividend (%) -8.5 -2.2 TSR -10.6 -1.3
Price (c) Shares (m) Mkt. Cap (€m) E.V. (€m) Mkt. Cap. / EV (%) Mkt. Weight (%) Free Float (%) Daily No. Shares Traded (m) Daily Value Traded (€m) 957 457.9 4382.9 6208.4 70.6 100.0 3.833 35.616
Lufthansa
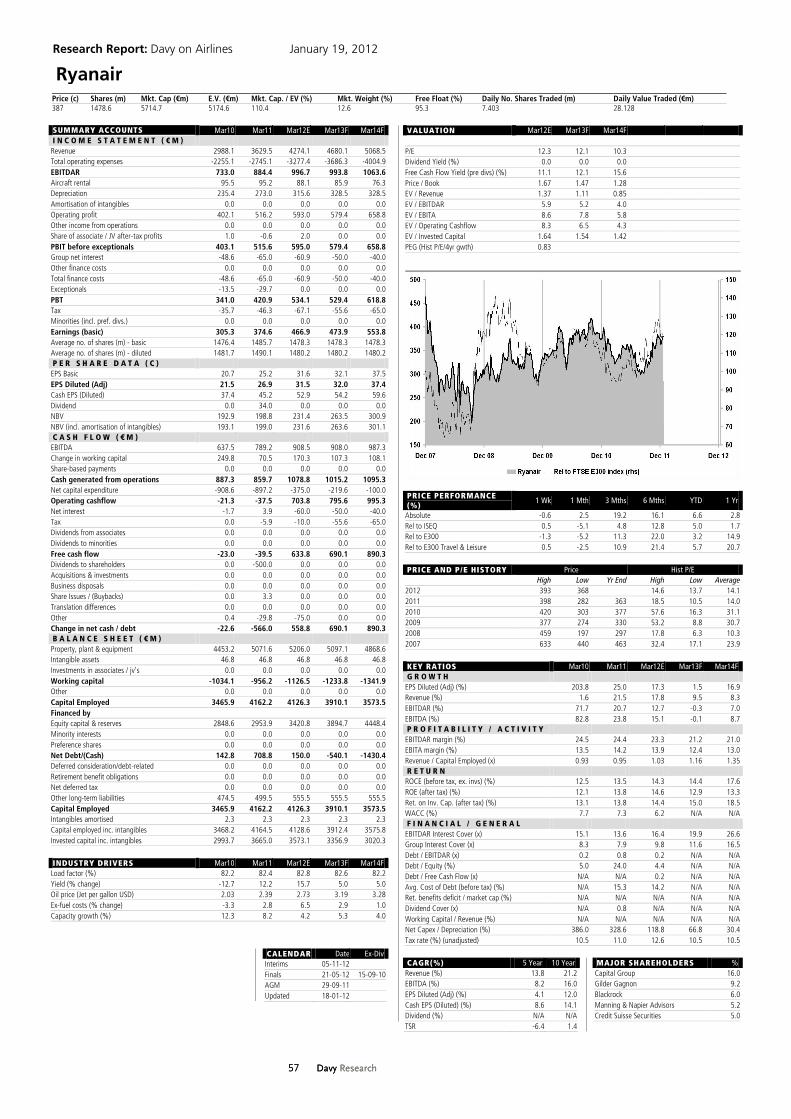
Research Report: Davy on Airlines January 19, 2012
57 Davy Research
57 Davy Research
SUMMARY ACCOUNTS Mar10 Mar11 Mar12E Mar13F Mar14F I N C O M E S T A T E M E N T ( € M ) Revenue 2988.1 3629.5 4274.1 4680.1 5068.5 Total operating expenses -2255.1 -2745.1 -3277.4 -3686.3 -4004.9 EBITDAR 733.0 884.4 996.7 993.8 1063.6 Aircraft rental 95.5 95.2 88.1 85.9 76.3 Depreciation 235.4 273.0 315.6 328.5 328.5 Amortisation of intangibles 0.0 0.0 0.0 0.0 0.0 Operating profit 402.1 516.2 593.0 579.4 658.8 Other income from operations 0.0 0.0 0.0 0.0 0.0 Share of associate / JV after-tax profits 1.0 -0.6 2.0 0.0 0.0 PBIT before exceptionals 403.1 515.6 595.0 579.4 658.8 Group net interest -48.6 -65.0 -60.9 -50.0 -40.0 Other finance costs 0.0 0.0 0.0 0.0 0.0 Total finance costs -48.6 -65.0 -60.9 -50.0 -40.0 Exceptionals -13.5 -29.7 0.0 0.0 0.0 PBT 341.0 420.9 534.1 529.4 618.8 Tax -35.7 -46.3 -67.1 -55.6 -65.0 Minorities (incl. pref. divs.) 0.0 0.0 0.0 0.0 0.0 Earnings (basic) 305.3 374.6 466.9 473.9 553.8 Average no. of shares (m) - basic 1476.4 1485.7 1478.3 1478.3 1478.3 Average no. of shares (m) - diluted 1481.7 1490.1 1480.2 1480.2 1480.2 P E R S H A R E D A T A ( C ) EPS Basic 20.7 25.2 31.6 32.1 37.5 EPS Diluted (Adj) 21.5 26.9 31.5 32.0 37.4 Cash EPS (Diluted) 37.4 45.2 52.9 54.2 59.6 Dividend 0.0 34.0 0.0 0.0 0.0 NBV 192.9 198.8 231.4 263.5 300.9 NBV (incl. amortisation of intangibles) 193.1 199.0 231.6 263.6 301.1 C A S H F L O W ( € M ) EBITDA 637.5 789.2 908.5 908.0 987.3 Change in working capital 249.8 70.5 170.3 107.3 108.1 Share-based payments 0.0 0.0 0.0 0.0 0.0 Cash generated from operations 887.3 859.7 1078.8 1015.2 1095.3 Net capital expenditure -908.6 -897.2 -375.0 -219.6 -100.0 Operating cashflow -21.3 -37.5 703.8 795.6 995.3 Net interest -1.7 3.9 -60.0 -50.0 -40.0 Tax 0.0 -5.9 -10.0 -55.6 -65.0 Dividends from associates 0.0 0.0 0.0 0.0 0.0 Dividends to minorities 0.0 0.0 0.0 0.0 0.0 Free cash flow -23.0 -39.5 633.8 690.1 890.3 Dividends to shareholders 0.0 -500.0 0.0 0.0 0.0 Acquisitions & investments 0.0 0.0 0.0 0.0 0.0 Business disposals 0.0 0.0 0.0 0.0 0.0 Share Issues / (Buybacks) 0.0 3.3 0.0 0.0 0.0 Translation differences 0.0 0.0 0.0 0.0 0.0 Other 0.4 -29.8 -75.0 0.0 0.0 Change in net cash / debt -22.6 -566.0 558.8 690.1 890.3 B A L A N C E S H E E T ( € M ) Property, plant & equipment 4453.2 5071.6 5206.0 5097.1 4868.6 Intangible assets 46.8 46.8 46.8 46.8 46.8 Investments in associates / jv's 0.0 0.0 0.0 0.0 0.0 Working capital -1034.1 -956.2 -1126.5 -1233.8 -1341.9 Other 0.0 0.0 0.0 0.0 0.0 Capital Employed 3465.9 4162.2 4126.3 3910.1 3573.5 Financed by Equity capital & reserves 2848.6 2953.9 3420.8 3894.7 4448.4 Minority interests 0.0 0.0 0.0 0.0 0.0 Preference shares 0.0 0.0 0.0 0.0 0.0 Net Debt/(Cash) 142.8 708.8 150.0 -540.1 -1430.4 Deferred consideration/debt-related 0.0 0.0 0.0 0.0 0.0 Retirement benefit obligations 0.0 0.0 0.0 0.0 0.0 Net deferred tax 0.0 0.0 0.0 0.0 0.0 Other long-term liabilities 474.5 499.5 555.5 555.5 555.5 Capital Employed 3465.9 4162.2 4126.3 3910.1 3573.5 Intangibles amortised 2.3 2.3 2.3 2.3 2.3 Capital employed inc. intangibles 3468.2 4164.5 4128.6 3912.4 3575.8 Invested capital inc. intangibles 2993.7 3665.0 3573.1 3356.9 3020.3
INDUSTRY DRIVERS Mar10 Mar11 Mar12E Mar13F Mar14F Load factor (%) 82.2 82.4 82.8 82.6 82.2 Yield (% change) -12.7 12.2 15.7 5.0 5.0 Oil price (Jet per gallon USD) 2.03 2.39 2.73 3.19 3.28 Ex-fuel costs (% change) -3.3 2.8 6.5 2.9 1.0 Capacity growth (%) 12.3 8.2 4.2 5.3 4.0
CALENDAR Date Ex-Div Interims 05-11-12 Finals 21-05-12 15-09-10 AGM 29-09-11 Updated 18-01-12
VALUATION Mar12E Mar13F Mar14F
P/E 12.3 12.1 10.3 Dividend Yield (%) 0.0 0.0 0.0 Free Cash Flow Yield (pre divs) (%) 11.1 12.1 15.6 Price / Book 1.67 1.47 1.28 EV / Revenue 1.37 1.11 0.85 EV / EBITDAR 5.9 5.2 4.0 EV / EBITA 8.6 7.8 5.8 EV / Operating Cashflow 8.3 6.5 4.3 EV / Invested Capital 1.64 1.54 1.42 PEG (Hist P/E/4yr gwth) 0.83
PRICE PERFORMANCE (%)
1 Wk 1 Mth 3 Mths 6 Mths YTD 1 Yr
Absolute -0.6 2.5 19.2 16.1 6.6 2.8 Rel to ISEQ 0.5 -5.1 4.8 12.8 5.0 1.7 Rel to E300 -1.3 -5.2 11.3 22.0 3.2 14.9 Rel to E300 Travel & Leisure 0.5 -2.5 10.9 21.4 5.7 20.7
PRICE AND P/E HISTORY Price Hist P/E High Low Yr End High Low Average
2012 393 368 14.6 13.7 14.1 2011 398 282 363 18.5 10.5 14.0 2010 420 303 377 57.6 16.3 31.1 2009 377 274 330 53.2 8.8 30.7 2008 459 197 297 17.8 6.3 10.3 2007 633 440 463 32.4 17.1 23.9
KEY RATIOS Mar10 Mar11 Mar12E Mar13F Mar14F G R O W T H
EPS Diluted (Adj) (%) 203.8 25.0 17.3 1.5 16.9 Revenue (%) 1.6 21.5 17.8 9.5 8.3 EBITDAR (%) 71.7 20.7 12.7 -0.3 7.0 EBITDA (%) 82.8 23.8 15.1 -0.1 8.7 P R O F I T A B I L I T Y / A C T I V I T Y
EBITDAR margin (%) 24.5 24.4 23.3 21.2 21.0 EBITA margin (%) 13.5 14.2 13.9 12.4 13.0 Revenue / Capital Employed (x) 0.93 0.95 1.03 1.16 1.35 R E T U R N
ROCE (before tax, ex. invs) (%) 12.5 13.5 14.3 14.4 17.6 ROE (after tax) (%) 12.1 13.8 14.6 12.9 13.3 Ret. on Inv. Cap. (after tax) (%) 13.1 13.8 14.4 15.0 18.5 WACC (%) 7.7 7.3 6.2 N/A N/A F I N A N C I A L / G E N E R A L
EBITDAR Interest Cover (x) 15.1 13.6 16.4 19.9 26.6 Group Interest Cover (x) 8.3 7.9 9.8 11.6 16.5 Debt / EBITDAR (x) 0.2 0.8 0.2 N/A N/A Debt / Equity (%) 5.0 24.0 4.4 N/A N/A Debt / Free Cash Flow (x) N/A N/A 0.2 N/A N/A Avg. Cost of Debt (before tax) (%) N/A 15.3 14.2 N/A N/A Ret. benefits deficit / market cap (%) N/A N/A N/A N/A N/A Dividend Cover (x) N/A 0.8 N/A N/A N/A Working Capital / Revenue (%) N/A N/A N/A N/A N/A Net Capex / Depreciation (%) 386.0 328.6 118.8 66.8 30.4 Tax rate (%) (unadjusted) 10.5 11.0 12.6 10.5 10.5
CAGR(%) 5 Year 10 Year MAJOR SHAREHOLDERS % Revenue (%) 13.8 21.2 Capital Group 16.0 EBITDA (%) 8.2 16.0 Gilder Gagnon 9.2 EPS Diluted (Adj) (%) 4.1 12.0 Blackrock 6.0 Cash EPS (Diluted) (%) 8.6 14.1 Manning & Napier Advisors 5.2 Dividend (%) N/A N/A Credit Suisse Securities 5.0 TSR -6.4 1.4
Price (c) Shares (m) Mkt. Cap (€m) E.V. (€m) Mkt. Cap. / EV (%) Mkt. Weight (%) Free Float (%) Daily No. Shares Traded (m) Daily Value Traded (€m) 387 1478.6 5714.7 5174.6 110.4 12.6 95.3 7.403 28.128
Ryanair

58 Davy Research
Important disclosures
Analyst certification Each research analyst primarily responsible for the content of this research report certifies that: (1) the views expressed in this research report accurately reflect his or her personal views about any or all of the subject securities or issuers referred to in this report and (2) no part of his or her compensation was, is or will be, directly or indirectly related to the specific recommendations or views expressed in this report.
Investment ratings definitions Davy ratings are indicators of the expected performance of the stock relative to its sector index (FTSE E300) over the next 12 months. At times, the performance might fall outside the general ranges stated below due to near-term events, market conditions, stock volatility or – in some cases – company-specific issues. Research reports and ratings should not be relied upon as individual investment advice. As always, an investor's decision to buy or sell a security must depend on individual circumstances, including existing holdings, time horizons and risk tolerance. Our ratings are based on the following parameters: Outperform: Outperforms the relevant E300 sector by 10% or more over the next 12 months. Neutral: Performs in-line with the relevant E300 sector (+/-10%) over the next 12 months. Underperform: Underperforms the relevant E300 sector by 10% or more over the next 12 months. Under Review: Rating is actively under review. Suspended: Rating is suspended until further notice. Restricted: The rating has been removed in accordance with Davy policy and/or applicable law and regulations where Davy is engaged in an investment banking transaction and in certain other circumstances.
Distribution of ratings/investment banking relationships Investment banking services/Past 12 months
Rating Count Percent Count Percent
Outperform 50 53 28 77
Neutral 28 30 6 16
Underperform 11 11 0 0
Under Review 3 3 1 2
Suspended 0 0 0 0
Restricted 1 1 1 2
This is a summary of Davy ratings for all companies under research coverage, including those companies under coverage to which Davy has provided material investment banking services in the previous 12 months. This summary is updated on a quarterly basis. The term 'material investment banking services' includes Davy acting as broker as well as the provision of corporate finance services, such as underwriting and managing or advising on a public offer.
Regulatory and other important information J&E Davy, trading as Davy is regulated by the Central Bank of Ireland. Davy is a member of the Irish Stock Exchange, the London Stock Exchange and Euronext. For branches in the UK, Davy is authorised by the Central Bank of Ireland and subject to limited regulation by the Financial Services Authority. Details about the extent of our regulation by the Financial Services Authority are available from us on request. No part of this document is to be reproduced without our written permission. This publication is solely for information purposes and does not constitute an offer or solicitation to buy or sell securities. This document does not constitute investment advice and has been prepared without regard to the individual financial circumstances and objectives of persons who receive it. The securities/strategy discussed in this report may not be suitable or appropriate for all investors. The value of investments can fall as well as rise and there is no guarantee that investors will receive back their capital invested. Past performance and simulated performance is not a reliable guide to future performance. Projected returns are estimates only and are not a reliable guide to the future performance of this investment. Forecasted returns depend on assumptions that involve subjective judgment and on analysis that may or may not be correct. Any information related to the tax status of the securities discussed herein is not intended to provide tax advice or to be used as tax advice. You should consult your tax adviser about the rules that apply in your individual circumstances. This document has been prepared and issued by Davy on the basis of publicly available information, internally developed data and other sources believed to be reliable. Whilst all reasonable care has been taken in the preparation of this document, we do not guarantee the accuracy or completeness of the information contained herein. Any opinion expressed (including estimates and forecasts) may be subject to change without notice. We or any of our connected or affiliated companies or their employees may have a position in any of the securities or may have provided, within the last twelve months, significant advice or investment services in relation to any of the securities or related investments referred to in this document. While reasonable care has been taken in the preparation of the information contained in this document, no warranty or representation, express or implied, is or will be provided by Davy or any of its shareholders, subsidiaries or affiliated entities or any person, firm or body corporate under its control or under common control or by any of their respective directors, officers, employees, agents, advisers and representatives, all of whom expressly disclaim any and all liability for the contents of, or omissions from, this document, the information or opinions on which it is based and/or whether it is a reasonable summary of the securities in this document and for any other written or oral communication transmitted or made available to the recipient or any of its officers, employees, agents or representatives. Neither Davy nor any of its shareholders, subsidiaries, affiliated entities or any person, form or body corporate under its control or under common control or their respective directors, officers, agents, employees, advisors, representatives or any associated entities (each an "Indemnified Party") will be responsible or liable for any costs, losses or expenses incurred by investors in connection with the information contained in this document. The investor indemnifies and holds harmless Davy and each Indemnified Party for any losses, liabilities or claims, joint or several, howsoever arising, except upon such Indemnified Party’s bad faith or gross negligence.

59 Davy Research
Share ownership policy Davy allows analysts to own shares in companies they issue recommendations on, subject to strict compliance with our internal rules governing own-account trading by staff members. We are satisfied that our internal policy on share ownership does not compromise the objectivity of analysts in issuing recommendations.
Conflicts of interest Our conflicts of interest management policy is available at www.davy.ie/ConflictsOfInterest. Davy acts as stockbroker to Ryanair Holdings. The remuneration of the analyst(s) who prepared this report is based on various factors including company profitability, which may be affected to some extent by revenues derived from investment banking. Davy is a registered market-maker in the securities of Aer Lingus and Ryanair Holdings on the Irish Stock Exchange and the London Stock Exchange. Davy may have acted, in the past 12 months, as lead manager/co-lead manager of a publicly disclosed offer of the securities in certain companies included in this report. Investors should be aware that Davy may have provided investment banking services to, and received compensation from, certain companies included in this report in the past 12 months or may provide such services in the future. The term investment banking services includes acting as broker as well as the provision of corporate finance services, such as underwriting and managing or advising on a public offer. From time to time, Davy may hold a position or deal in the securities referred to in this report. Should an instance arise where Davy has a holding that exceeds 5% of the issued share capital of a company, this will be disclosed in this report.
Other important disclosures A description of this company is available at www.davy.ie/RegulatoryDisclosures. A summary of our standard valuation methods is available at www.davy.ie/ValuationMethodologies. All prices used in this report are as of close on January 17th. A summary of existing and previous ratings for each company under coverage, together with an indication of which of these companies Davy has provided investment banking services to, is available at www.davy.ie/ratings. The data contained in this research note have been compiled by our independent analysts, based on a combination of publicly-available information and the analysts’ assumptions and modelling. Further information is available upon request. This document does not constitute or form part of any offer, solicitation or invitation to subscribe or purchase any securities, nor shall it or any part of it form the basis of, or be relied upon in connection with, any contract or commitment whatsoever. Any decision to purchase or subscribe for securities in any offering must be made solely on the basis of the information contained in the prospectus or other offering circular issued by the company concerned in connection with such an offering. This document has been prepared by its authors independently of the company or companies covered. Davy has no authority whatsoever to give any information, or make any representation or warranty on behalf of the company or companies. In particular, the opinions, estimates and projections expressed in it are entirely those of the analysts and are not given as an agent or financial adviser of the company or companies. Please note that in accordance with the Central Bank of Ireland's Market Abuse Rules, no person, other than a market-maker, may enter into any transaction or arrangement which would have the effect of generating a net economic benefit arising from a fall in the price of the following shares: the Governor and Company of Bank of Ireland, Allied Irish Banks plc, Irish Life & Permanent plc and Anglo Irish Bank Corporation plc. Please refer to the Market Abuse Rules for full details.
US Securities Exchange Act, 1934 This report is only distributed in the US to major institutional investors as defined by S15a-6 of the Securities Exchange Act, 1934 as amended. By accepting this report, a US recipient warrants that it is a major institutional investor as defined and shall not distribute or provide this report or any part thereof, to any other person.
Distribution of research to clients of Davy Securities in the US Davy Securities distributes third-party research produced by its affiliate, J & E Davy. Davy Securities is a member of FINRA and SIPC and is regulated by the Central Bank of Ireland. Davy Securities does not act as a market-maker. Neither Davy Securities nor its affiliates beneficially own more than 1% of any class of common equity securities of this company/these companies. This information was current as of the last business day of the month preceding the date of the report. An affiliate of Davy Securities may have acted, in the past 12 months, as lead manager/co-lead manager of a publicly disclosed offer of the securities in certain companies included in this report. Investors should be aware that an affiliate of Davy Securities may have provided investment banking or non-investment-banking services to, and received compensation from, certain companies included in this report in the past 12 months or may provide such services in the next three months. The term investment banking services includes acting as broker as well as the provision of corporate finance services, such as underwriting and managing or advising on a public offer.
Confidentiality and copyright statement Davy, Research Department, Davy House, 49 Dawson St., Dublin 2, Ireland. Confidential © Davy 2012.


