
U.S. International Trade CommissionPublication 4720 August 2017
Washington, DC 20436
Low Melt Polyester Staple Fiber from Korea and Taiwan
Investigation No. 731-TA-1378-1379 (Preliminary)

U.S. International Trade Commission
COMMISSIONERS
Rhonda K. Schmidtlein, Chairman David S. Johanson, Vice Chairman
Irving A. Williamson Meredith M. Broadbent
Catherine DeFilippo
Staff assigned
Address all communications to Secretary to the Commission
United States International Trade Commission Washington, DC 20436
Director of Operations
Porscha Stiger, Investigator Laura Rodriguez, Industry Analyst
Nabil Abbyad, Economist Janet Freas, Accountant Onslow Hall, Statistician
Cynthia Payne, Statistician Carolyn Holmes, Statistical Assistant
Peter Sultan, Attorney Elizabeth Haines, Supervisory Investigator
Special assistance fromAimee Larsen, Economist

U.S. International Trade CommissionWashington, DC 20436
www.usitc.gov
Publication 4720 August 2017
Low Melt Polyester Staple Fiber from Korea and Taiwan
Investigation No. 731-TA-1378-1379 (Preliminary)


CONTENTS Page
i
Determinations ............................................................................................................................... 1
Views of the Commission ............................................................................................................... 3
Part I: Introduction ................................................................................................................ I‐1
Background ................................................................................................................................ I‐1
Statutory criteria and organization of the report ..................................................................... I‐1
Statutory criteria ................................................................................................................... I‐1
Organization of report ........................................................................................................... I‐3
Market summary ....................................................................................................................... I‐3
Summary data and data sources ............................................................................................... I‐3
Previous and related investigations .......................................................................................... I‐4
Nature and extent of alleged sales at LTFV ............................................................................... I‐5
The subject merchandise .......................................................................................................... I‐6
Commerce’s scope ................................................................................................................ I‐6
Tariff treatment ..................................................................................................................... I‐6
The product ............................................................................................................................... I‐7
Description and applications ................................................................................................. I‐7
Manufacturing processes ...................................................................................................... I‐9
Domestic like product issues ................................................................................................... I‐12
Part II: Conditions of competition in the U.S. market ............................................................ II‐1
U.S. market characteristics ....................................................................................................... II‐1
Channels of distribution ........................................................................................................... II‐1
Geographic distribution ........................................................................................................... II‐1
Supply and demand considerations ......................................................................................... II‐2
U.S. supply ............................................................................................................................ II‐2
U.S. demand ......................................................................................................................... II‐4
Substitutability issues ............................................................................................................... II‐6
Lead times ............................................................................................................................ II‐6

CONTENTS Page
ii
Part II: Conditions of competition in the U.S. market‐‐Continued
Factors affecting purchasing decisions................................................................................. II‐6
Comparison of U.S.‐produced and imported low melt PSF ................................................. II‐6
Part III: U.S. producers’ production, shipments, and employment ....................................... III‐1
U.S. producers ......................................................................................................................... III‐1
FIT Fibers .............................................................................................................................. III‐2
Nan Ya America ................................................................................................................... III‐2
U.S. production, capacity, and capacity utilization ................................................................. III‐3
Alternative products ............................................................................................................ III‐4
U.S. producers’ U.S. shipments and exports ........................................................................... III‐4
U.S. producers’ inventories ..................................................................................................... III‐5
U.S. producers’ imports and purchases .................................................................................. III‐5
U.S. employment, wages, and productivity ............................................................................ III‐6
Part IV: U.S. imports, apparent U.S. consumption, and market shares ................................ IV‐1
U.S. importers.......................................................................................................................... IV‐1
U.S. imports ............................................................................................................................. IV‐3
Negligibility .............................................................................................................................. IV‐5
Cumulation considerations ..................................................................................................... IV‐6
Fungibility ............................................................................................................................ IV‐6
Presence in the market ....................................................................................................... IV‐9
Geographical markets ....................................................................................................... IV‐11
Apparent U.S. consumption .................................................................................................. IV‐13
Part V: Pricing data ............................................................................................................... V‐1
Factors affecting prices ............................................................................................................ V‐1
Raw material costs ............................................................................................................... V‐1
U.S. inland transportation costs ........................................................................................... V‐1
Pricing practices ....................................................................................................................... V‐1

CONTENTS Page
iii
Part V: Pricing data‐‐Continued
Pricing methods .................................................................................................................... V‐1
Sales terms and discounts .................................................................................................... V‐2
Price data .................................................................................................................................. V‐3
Price trends ........................................................................................................................... V‐5
Price comparisons ................................................................................................................ V‐5
Lost sales and lost revenue ...................................................................................................... V‐6
Part VI: Financial experience of U.S. producers .................................................................... VI‐1
Background .............................................................................................................................. VI‐1
Operations on low melt PSF .................................................................................................... VI‐1
Variance analysis ................................................................................................................. VI‐2
Capital expenditures and research and development expenses ............................................ VI‐3
Assets and return on assets .................................................................................................... VI‐3
Capital and investment ........................................................................................................... VI‐3
Part VII: Threat considerations and information on nonsubject countries .......................... VII‐1
The industry in Korea ............................................................................................................. VII‐3
Exports ................................................................................................................................ VII‐3
The industry in Taiwan ........................................................................................................... VII‐5
Far Eastern New Century Corporation ............................................................................... VII‐6
Changes in operations ........................................................................................................ VII‐6
Operations on low melt PSF ............................................................................................... VII‐6
Alternative products ........................................................................................................... VII‐7
Exports ................................................................................................................................ VII‐7
U.S. inventories of imported merchandise .......................................................................... VII‐10
U.S. importers’ outstanding orders ...................................................................................... VII‐11
Antidumping or countervailing duty orders in third‐country markets ................................ VII‐11
Information on nonsubject countries .................................................................................. VII‐11

CONTENTS Page
iv
Appendixes
A. Federal Register notices ................................................................................................. A‐1
B. List of conference witnesses .......................................................................................... B‐1
C. Summary data ................................................................................................................ C‐1
Note.—Information that would reveal confidential operations of individual concerns may not
be published and therefore has been deleted. Such deletions are indicated by asterisks.

UNITED STATES INTERNATIONAL TRADE COMMISSION
Investigation Nos. 731‐TA‐1378‐1379 (Preliminary)
Low Melt Polyester Staple Fiber from Korea and Taiwan
DETERMINATION
On the basis of the record1 developed in the subject investigations, the United States International Trade Commission (“Commission”) determines, pursuant to the Tariff Act of 1930 (“the Act”), that there is a reasonable indication that an industry in the United States is materially injured by reason of imports of low melt polyester staple fiber from Korea and Taiwan, provided for in subheading 5503.20 of the Harmonized Tariff Schedule of the United States, that are alleged to be sold in the United States at less than fair value (“LTFV”).
Pursuant to section 207.18 of the Commission’s rules, the Commission also gives notice of the commencement of the final phase of its investigations. The Commission will issue a final phase notice of scheduling, which will be published in the Federal Register as provided in section 207.21 of the Commission’s rules, upon notice from the Department of Commerce (“Commerce”) of affirmative preliminary determinations in the investigations under section 733(b) of the Act, or, if the preliminary determinations are negative, upon notice of an affirmative final determinations in those investigations under section 735(a) of the Act. Parties that filed entries of appearance in the preliminary phase of the investigations need not enter a separate appearance for the final phase of the investigations. Industrial users, and, if the merchandise under investigation is sold at the retail level, representative consumer organizations have the right to appear as parties in Commission antidumping and countervailing duty investigations. The Secretary will prepare a public service list containing the names and addresses of all persons, or their representatives, who are parties to the investigations.
BACKGROUND
On June 27, 2017, Nan Ya Plastics Corporation, America, Livingston, New Jersey filed a petition with the Commission and Commerce, alleging that an industry in the United States is materially injured or threatened with material injury by reason of LTFV imports of low melt polyester staple fiber from Korea and Taiwan. Accordingly, on June 27, 2017, the Commission, pursuant to section 733(a) of the Act (19 U.S.C. 1673b(a)), instituted antidumping duty investigation Nos. 731‐TA‐1378‐1379 (Preliminary).
Notice of the institution of the Commission’s investigations and of a public conference to be held in connection therewith was given by posting copies of the notice in the Office of the Secretary, U.S. International Trade Commission, Washington, DC, and by publishing the notice in the Federal Register of July 3, 2017 (82 FR 30907). The conference was held in Washington, DC, on July 18, 2017, and all persons who requested the opportunity were permitted to appear in person or by counsel.
1 The record is defined in sec. 207.2(f) of the Commission’s Rules of Practice and Procedure
(19 CFR 207.2(f)).

B
there is a
reason o
that are a
TI.
T
requires
prelimina
materiall
materiall
standard
record as
threat of
investiga
1
994, 1001argues thaunfairly tr
2 AF.3d 1535
ased on the
a reasonable
f imports of
allegedly sol
The Legal S
he legal stan
the Commis
ary determin
ly injured or
ly retarded,
d, the Comm
s a whole co
f such injury;
ation.”2
19 U.S.C. §§ 11‐04 (Fed. Cir.at the establiraded importAmerican Lam5, 1543 (Fed. C
record in th
e indication t
low melt po
ld in the Uni
Standard fo
ndard for pre
ssion to dete
nations, whe
threatened
by reason o
ission weigh
ontains clear
; and (2) no
1671b(a), 167. 1986); Aristeshment of ans. mb Co., 785 FCir. 1994).
Views of t
he prelimina
that an indu
olyester stap
ited States a
or Prelimin
eliminary an
ermine, base
ether there i
with mater
f the alleged
hs the eviden
and convinc
likelihood ex
73b(a) (2000)ech Chem. Con industry in t
F.2d at 1001; s
3
the Comm
ry phase of t
stry in the U
ple fiber (“lo
at less than f
nary Deter
ntidumping a
ed upon the
is a reasonab
ial injury, or
dly unfairly t
nce before it
cing evidenc
xists that co
; see also Amorp. v. United the United Sta
see also Texa
mission
these invest
United State
w melt PSF”
fair value.
rminations
and counter
information
ble indicatio
r that the est
traded impo
t and determ
ce that there
ontrary evide
merican Lamb States, 20 CITates is mater
as Crushed Sto
tigations, we
s is material
”) from Kore
s
vailing duty
n available a
on that a dom
tablishment
rts.1 In appl
mines wheth
e is no mate
ence will aris
Co. v. UnitedT 353, 354‐55ially retarded
one Co. v. Un
e determine
lly injured by
a and Taiwa
determinat
t the time o
mestic indus
t of an indust
lying this
her “(1) the
rial injury or
se in a final
d States, 785 F5 (1996). No d by the allege
ited States, 3
that
y
an
ions
f the
stry is
try is
r
F.2d party edly
35

BII.
N
fiber (“lo
appeared
Se
represen
Corp.; an
Respond
Counsel f
for Far Ea
from Taiw
represen
appeared
U
accounti
based on
accounti
to its que
exports a
3
a respons3, PR at V
Background
Nan Ya Plastic
ow melt PSF”
d at the staff
everal respo
ntatives from
nd Stein Fibe
ents”), appe
for Milliken
astern New
wan, appear
ntative of Pre
d at the conf
U.S. industry
ng for 100 p
n official imp
ng for the va
estionnaires
accounted fo
Confidential se to its questII‐3.
d
cs Corporati
”) filed the p
f conference
ondent entit
m Bernet Inte
ers, Ltd., imp
eared at the
& Company
Century Cor
red at the co
ecision Custo
ference.
data are bas
percent of U.
port statistics
ast majority
from one fo
or *** perce
Report (“CR”tionnaire from
ion, America
petitions in th
e and submit
ies participa
ernational Tr
porters of su
conference
(“Milliken”)
rporation (“F
onference an
om Coatings
sed on the q
.S. productio
s and questi
of total subj
oreign produ
ent of U.S. im
) at I‐5, Publicm producers o
4
a, a domestic
hese investig
tted a postc
ated in these
rading, LLC;
bject merch
and submitt
), an importe
FENC”), a pro
nd submitted
s, LLC, an im
questionnair
on of low me
onnaire resp
ject imports
ucer of subje
mports of low
c Report (“PRor exporters o
c producer o
gations on J
onference b
e investigatio
Consolidate
handise (colle
ted a joint p
er of subject
oducer and
d postconfe
porter of the
re responses
elt PSF in 20
ponses from
s. The Comm
ect merchan
w melt PSF f
R”) at I‐3‐4. Tof subject me
of low melt p
une 27, 201
brief.
ons. Counse
ed Fibers, Inc
ectively, “Be
postconferen
t merchandi
exporter of
rence briefs
e subject me
s of two prod
16. U.S. imp
m 23 U.S. imp
mission recei
ndise in Taiw
from Taiwan
The Commissierchandise in
polyester sta
7. Petitione
el and
c.; Fibertex
ernet
nce brief.
se, and coun
low melt PS
s. A
erchandise,
ducers,
port data are
porters,
ved a respo
wan whose
n in 2016.3
on did not reKorea. CR at
aple
er
nsel
F
e
nse
ceive t VII‐

DIII.
In
States is
subject m
“industry
the relev
those pro
proportio
“domest
characte
T
factual d
“most sim
dispositiv
4 5 6 7 S
DepartmeStates, 191990), affparticularnumber o(3) channmanufactprice. See1996).
Domestic L
n determinin
materially in
merchandise
y.”4 Section
vant domest
oducers who
on of the tot
ic like produ
ristics and u
he decision
eterminatio
milar in char
ve, and the C
19 U.S.C. § 1619 U.S.C. § 1619 U.S.C. § 16See, e.g., Cleoent of Comme9 CIT 450, 455f’d, 938 F.2d 1r record at issof factors incluels of distribuuring facilitiee Nippon, 19 C
ike Produc
ng whether t
njured or thr
e, the Comm
771(4)(A) of
ic industry a
ose collectiv
tal domestic
uct” as “a pro
ses with, the
regarding th
n, and the C
racteristics a
Commission
677(4)(A). 677(4)(A). 677(10). o Inc. v. Uniteerce, 36 F. Sup5 (1995); Torr1278 (Fed. Cirue’ and the ‘uuding the follution; (4) custes, productionCIT at 455 n.4
ct
there is a rea
reatened wi
ission first d
f the Tariff A
as the “produ
e output of
c production
oduct which
e article sub
he appropria
Commission
and uses” on
may consid
ed States, 501pp. 2d 380, 3rington Co. v. r. 1991)(“eveunique facts oowing: (1) phtomer and prn processes, a4; Timken Co.
5
asonable ind
th material i
defines the “
Act of 1930,
ucers as a w
a domestic l
of the prod
h is like, or in
bject to an in
ate domestic
has applied
n a case‐by‐c
er other fac
1 F.3d 1291, 183 (Ct. Int’l TUnited Statesry like producof each case’”hysical characoducer perceand productio v. United Sta
dication that
injury by rea
“domestic lik
as amended
whole of a do
like product
duct.”5 In tur
n the absenc
nvestigation.
c like produc
the statutor
case basis.7 N
ctors it deem
1299 (Fed. Cirrade 1998); Ns, 747 F. Suppct determinat”). The Commcteristics andeptions of theon employeesates, 913 F. Su
t an industry
ason of impo
ke product”
d (“the Tariff
omestic like p
constitutes
rn, the Tariff
ce of like, mo
.”6
ct(s) in an inv
ry standard
No single fac
ms relevant b
r. 2007); NEC Nippon Steel Cp. 744, 749 ntion ‘must bemission gened uses; (2) intee products; (5s; and, whereupp. 580, 584
y in the Unit
orts of the
and the
f Act”), defin
product, or
a major
f Act defines
ost similar in
vestigation i
of “like” or
ctor is
based on the
Corp. v. Corp. v. Unite.3 (Ct. Int’l Tre made on therally considererchangeabili5) common e appropriate4 (Ct. Int’l Tra
ed
nes
s
n
is a
e
ed rade e rs a ity;
, (6) ade

6
facts of a particular investigation.8 The Commission looks for clear dividing lines among
possible like products and disregards minor variations.9 Although the Commission must accept
Commerce’s determination as to the scope of the imported merchandise that is subsidized
and/or sold at less than fair value,10 the Commission determines what domestic product is like
the imported articles Commerce has identified.11
A. Scope Definition
In its notice of initiation, Commerce defined the imported merchandise within the scope
of these investigations as follows:
synthetic staple fibers, not carded or combed, specifically bi‐component polyester fibers having a polyester fiber component that melts at a lower temperature than the other polyester fiber component (low melt PSF). The scope includes bicomponent polyester staple fibers of any denier or cut length. The subject merchandise may be coated, usually with a finish or dye, or not coated. Low melt PSF is classifiable under the Harmonized Tariff Schedule of the United States (HTSUS) subheading 5503.20.0015. Although the HTSUS subheading is provided for convenience and customs purposes, the written description of the scope of the
8 See, e.g., S. Rep. No. 96‐249 at 90‐91 (1979). 9 See, e.g., Nippon, 19 CIT at 455; Torrington, 747 F. Supp. at 748‐49; see also S. Rep. No. 96‐249
at 90‐91 (Congress has indicated that the like product standard should not be interpreted in “such a narrow fashion as to permit minor differences in physical characteristics or uses to lead to the conclusion that the product and article are not ‘like’ each other, nor should the definition of ‘like product’ be interpreted in such a fashion as to prevent consideration of an industry adversely affected by the imports under consideration.”).
10 See, e.g., USEC, Inc. v. United States, 34 Fed. App’x 725, 730 (Fed. Cir. 2002) (“The ITC may not modify the class or kind of imported merchandise examined by Commerce.”); Algoma Steel Corp. v. United States, 688 F. Supp. 639, 644 (Ct. Int’l Trade 1988), aff’d, 865 F.3d 240 (Fed. Cir.), cert. denied, 492 U.S. 919 (1989).
11 Hosiden Corp. v. Advanced Display Mfrs., 85 F.3d 1561, 1568 (Fed. Cir. 1996) (the Commission may find a single like product corresponding to several different classes or kinds defined by Commerce); Cleo, 501 F.3d at 1298 n.1 (“Commerce’s {scope} finding does not control the Commission’s {like product} determination.”); Torrington, 747 F. Supp. at 748‐52 (affirming the Commission’s determination defining six like products in investigations where Commerce found five classes or kinds).

7
merchandise under the investigations is dispositive.12 Low melt PSF is a manmade staple fiber, not carded, combed, or otherwise processed
for spinning, made entirely of polyester. Like other types of PSF, low melt PSF is a strong fiber
that resists shrinking and stretching. Unlike other types of PSF, low melt PSF has a bi‐
component structure consisting of two strongly bonded, but separate polymers of different
chemical and/or physical construction. It is most commonly comprised of a pure polyester core
and outer sheath, but may also be produced in a side‐by‐side configuration. The sheath, which
melts at a lower temperature than the core, provides a stable structure that allows the fiber to
be processed smoothly into another form and acts as an agent for thermal‐bonding to the core
polymer.13
B. Arguments of the Parties
Petitioner’s Arguments. Petitioner asks the Commission to define one domestic like
product coextensive with the scope of the investigations. It argues that this would be consistent
with the Commission’s decision in its 2000 investigations of polyester staple fiber from Korea
and Taiwan to treat low melt PSF as a separate domestic like product from other polyester
staple fiber, and Petitioner argues that the factors that distinguished low melt PSF in those
earlier investigations continue to be true today.14
12 Low Melt Polyester Staple Fiber From the Republic of Korea and Taiwan: Initiation of Less‐
Than‐Fair‐Value Investigations, 82 Fed. Reg. 34277, 34281 (July 24, 2017). 13 CR at I‐9‐10, PR at I‐6‐7. 14 Petition at 13. In Certain Polyester Staple Fiber from Korea and Taiwan, Inv. Nos. 731‐TA‐825‐
826 (Final), USITC Pub. 3300 at 5‐7 (May 2000), the Commission found low melt PSF to be a distinct like product from other PSF within the scope. It made negative determinations with respect to low melt PSF, and affirmative determinations with respect to the other domestic like product.

8
Petitioner takes issue with respondents’ arguments that black low melt PSF and
crystalline low melt PSF should be treated as separate domestic like products. Petitioner
maintains that the only differentiating physical characteristic of black low melt PSF is its color,
and argues that the Commission should not find a dividing line based on such a minor
difference between products. Petitioner argues that respondents overstate the legal
implication of the limited interchangeability of black low melt PSF with other low melt PSF. It
argues that limited interchangeability is a recognized attribute of the continuum of products
which make up a single like product. Petitioner disputes respondents’ assertion that black low
melt PSF cannot be made on the same equipment as other low melt PSF; it notes that ***.15
Petitioner asserts that crystalline low melt PSF is produced from the same basic raw
materials as other low melt PSF. Petitioner acknowledges that the chemical structure of
crystalline low melt PSF may be different from that of other low melt PSF, but it argues that the
Commission has found a single domestic like product to exist in other cases despite differences
in chemistries within types of product. Referring to the use of crystalline low melt PSF in
particular parts of automobiles, Petitioner argues that a specialized use does not undermine the
continuum nature of all low melt PSF as a single domestic like product. Petitioner maintains
that customers perceive crystalline low melt PSF to be a low melt PSF, notwithstanding that
customers might prefer to use crystalline low melt PSF for certain automotive applications.
15 Petitioner’s Postconference Brief at 7‐9.

9
Finally, Petitioner argues that the fact that foreign producers might use batch manufacturing to
produce crystalline low melt PSF has no bearing on the domestic like product analysis.16
Respondents’ Argument. Bernet Respondents argue that black low melt PSF and
crystalline low melt PSF should each be defined as distinct domestic like products. They argue
that black low melt PSF is different from other low melt PSF because the product is black. It is
used in applications where the product is visible. For example, in the automotive industry it is
used in places such as under the hood, in carpeting, and for trunk linings. Bernet Respondents
argue that black low melt PSF is minimally interchangeable with regular white low melt PSF
because customers ordering the black product choose it for aesthetic reasons and will only
accept that color. Conversely, in some applications such as wipes and bedding, usually only
white low melt PSF is used. Bernet Respondents state that both black and white low melt PSF
are sold directly to end users or through distributors. Bernet Respondents state that the
additional black dye used to produce black low melt PSF adds an extra step to the production
process for that product. Black and regular low melt PSF cannot be produced at the same time
on the same equipment because the black colored fibers would contaminate the white fibers.
Finally, Bernet Respondents state that black low melt PSF commands a higher price.17
Bernet Respondents argue that crystalline low melt PSF has distinct physical
characteristics because the polymer molecules of the product are in a structured and repeated
arrangement. Unlike other low melt PSF, crystalline low melt PSF does not soften until it meets
its exact melting point. For this reason, crystalline low melt PSF can withstand a significantly
16 Petitioner’s Postconference Brief at 9‐10. 17 Bernet Respondents’ Postconference Brief at 5‐7.

10
larger range of temperatures without changing form. It is used primarily in the automotive
industry, typically in the underbody of a vehicle, wheel liners, and components near the engine
compartment. Bernet Respondents maintain that crystalline low melt PSF is of limited
interchangeability with other low melt PSF because the other low melt product will deform at a
different temperature zone. Bernet Respondents state that crystalline low melt PSF is usually
made on smaller manufacturing lines called “batch lines,” and that special cutting, packaging
and spraying systems are used to make that product. Finally, Bernet Respondents state that
customers are willing to pay a higher price for crystalline low melt PSF.18
Milliken argues that black and colored low melt PSF should be treated as a separate
domestic like product.19 It argues that the black and colored low melt PSF is physically different
from natural low melt PSF because it is dyed with a pigment during the manufacturing process.
Milliken argues that the black and colored product also is used for different purposes. For
example, black low melt PSF is used in the automotive industry and applications where it might
be visible, whereas natural PSF is used in the bedding industry or for certain filtering media,
where a clean appearance is important. Milliken states that the production of black or colored
low melt PSF requires separate facilities or equipment because otherwise the downtime
involved in the changeover from making black or colored product to making natural low melt
product would be too costly. Milliken further argues that black or colored and natural low melt
PSF are not interchangeable because automotive customers require that the product be black
18 Bernet Respondents’ Postconference Brief at 7‐8. 19 Milliken is arguing for a somewhat broader separate like product than Bernet Respondents.
While Bernet Respondents seek a separate like product encompassing only black low melt PSF, the separate like product Milliken seeks includes both black and other colored low melt PSF.

11
or colored when it is used in certain visible applications. Customer perceptions are also
impacted by black or colored product. Milliken argues that black or colored low melt PSF
moves through different channels of distribution than natural low melt PSF insofar as it is sold
to different types of end users. Finally, Milliken states that black low melt PSF is more
expensive than natural low melt PSF and that it has paid approximately *** percent more for
the black product.20
C. Analysis
In investigations such as these where domestically manufactured merchandise involves
niche or specialized products, the Commission does not consider each item of merchandise to
be a separate like product that is only “like” its identical counterpart in the scope, but considers
the grouping itself to constitute the domestic like product21 and “disregards minor variations”22
absent a “clear dividing line” between particular products in the group. Based on the record,
we define a single domestic like product consisting of all low melt PSF within the scope of
investigation. We address below the merits of defining black or other colored low melt PSF or
crystalline low melt PSF to be a separate domestic like product.
20 Milliken’s Postconference Brief at 2‐5. 21 See, e.g., Fine Denier Polyester Staple Fiber from China, India, Korea, Taiwan, and Vietnam,
Inv. Nos. 701‐TA‐579‐580 and 731‐TA‐ 1369‐1373 (Preliminary), USITC Pub. 4709 at 9 (July 2017); Certain Corrosion‐Resistant Steel Products from China, India, Italy, Korea, and Taiwan, Inv. Nos. 701‐TA‐534‐538 and 731‐TA‐1274‐1278 (Preliminary), USITC Pub. 4547 at 9 (July 2015); Carbon and Certain Alloy Steel Wire Rod from China, Germany, and Turkey, Inv. Nos. 731‐TA‐1099‐1101 (Preliminary), USITC Pub. 3832 (January 2006) at 10 (“a lack of interchangeability among products comprising a continuum is not unexpected and not inconsistent with finding a single like product.”); Stainless Steel Bar from France, Germany, Italy, Korea, and the United Kingdom, Inv. Nos. 701‐TA‐413 (Final) and 731‐TA‐913‐916 and 918 (Final), USITC Pub. 3488 (February 2002) at 6‐7.
22 See S. Rep. No. 96‐249 at 90‐91 (1979).

12
1. Black and Other Colored Low Melt PSF23
Physical Characteristics and Uses. Black and other colored low melt PSF is distinguished
from other low melt PSF only by pigmentation. Black/colored low melt PSF is used in the same
downstream industries as regular low melt PSF, but is used in specialized applications within
those industries. For example, black/colored and regular low melt PSF are both used in the
automotive industry, but the black/uncolored product is used in applications where it might be
visible.24
Manufacturing Facilities, Production Processes, and Employees. ***, including black
fiber, on the same equipment and with the same workers.25 Differences between the
manufacturing processes for uncolored low melt PSF and those for colored low melt PSF are
reportedly minor; the principal additional step required to produce colored low melt PSF is that
dye is added to the polymer before the extrusion of the fiber.26
Channels of Distribution. All low melt PSF, including black/colored low melt PSF, is sold
to distributors and end users.27 Black/colored low melt PSF is used especially in the automotive
industry, which is also an end user of uncolored low melt PSF.28
Interchangeability. The interchangeability between black/colored and uncolored low
melt PSF is limited. For aesthetic reasons, the uncolored product is not used in automotive
23 We are considering the argument by Bernet Respondents concerning black low melt PSF and the argument by Milliken concerning black and colored low melt PSF jointly because both arguments concern differences between colored and uncolored product, rather than the precise color used.
24 CR at I‐12, PR at I‐8. 25 Petitioner’s Postconference Brief, Exh. 3, para. 3. 26 CR at I‐15‐17, PR at I‐9‐11. 27 CR/PR at II‐1. 28 Conference Tr. at 21 (Sparkman), 30 and 31 (Ringel), Petitioner’s Postconference Brief at Exh.
2, para. 11.

13
applications where it is visible.29 While the black/colored product could be used in certain
applications where it is not visible, it would be uneconomical to do so because it is more
expensive.30 In certain applications, for example, face masks and wipes, the black/colored
product would not be used, again for aesthetic reasons.31
Producer and Customer Perceptions. Petitioner maintains that producers and
consumers perceive all low melt PSF to be a distinctive product characterized by its bi‐
component structure and lower melt temperature for specialized bonding purposes.32
Respondents contend that customers perceive the black/colored product and uncolored low
melt PSF to have different applications.33
Price. The record indicates that black low melt PSF is priced approximately *** percent
above uncolored low melt PSF.34
Conclusion. Aside from color, black/colored low melt PSF shares all of the other physical
characteristics of other low melt PSF. Black/colored low melt PSF product is used in the same
downstream industries – most notably the automotive industry – as regular low melt PSF, but is
used in specialized applications within those industries. The manufacturing facilities,
production processes, and employees used to make black/colored low melt PSF are the same as
those used to make other low melt PSF, except that production of the black/colored product
involves an additional step of adding dye to the polymer. The channels of distribution are the
29 CR at I‐12, PR at I‐8. 30 Conference Tr. at 95 (Fee). 31 Conference Tr. at 51 (Sparkman) 32 Petitioner’s Postconference Brief at 7. 33 Milliken’s Postconference Brief at 3‐4, Conference Tr. at 90 (Stein). 34 Milliken’s Postconference Brief at 5.

14
same. Although the interchangeability of black/colored low melt PSF with other low melt PSF is
limited, such limited interchangeability is also true for other low melt PSF products that serve a
range of applications based upon the product’s specific characteristics. Although customers
perceive the black/colored product and the uncolored low melt PSF to have different
applications, based largely on aesthetic considerations, the basic characteristics of the colored
and uncolored products, namely bonding in nonwoven products, are the same.35 Black/colored
low melt PSF commands a modest price premium as compared with the uncolored product.
Overall, the limited distinctions between black/colored low melt PSF and uncolored low melt
PSF do not, in our view, constitute a clear dividing line, and accordingly we do not define
black/colored low melt PSF as a separate domestic like product for purposes of these
preliminary determinations.
2. Crystalline Low Melt PSF
Physical Characteristics and Uses. Crystalline low melt PSF has a different molecular
structure than other low melt PSF in that the polymer molecules are in a structured and
repeated arrangement, whereas the other low melt PSF has a random molecular structure.36
Crystalline low melt PSF resists heat and retains its rigidity better than other low melt PSF.
Other low melt PSF softens as the temperature gets closer to its melt point. That is not the case
with crystalline low melt PSF; it holds its form all the way until the melt point is reached.37
Crystalline low melt PSF is typically used in automotive applications where there are large
35 CR at I‐10, PR at I‐7. 36 CR at I‐11, Conference Tr. at 88 (Edwards). 37 CR at I‐12, PR at I‐8; Conference Tr. at 70 (Sparkman) and 88 (Edwards).

15
variations in temperature (for example, the underbody, wheel liners, and near the engine
compartment).38
Manufacturing Facilities, Production Processes, and Employees. ***.39 Differences
between the manufacturing processes for crystalline low melt PSF and other low melt PSF are
reportedly minor; the principal additional step required to produce crystalline low melt PSF is
the addition of a chemical to the polymer before the fiber extrusion.40
Channels of Distribution. All low melt PSF, including crystalline low melt PSF, is sold to
distributors and end users.41 While crystalline low melt PSF is used especially in the automotive
industry, that industry also uses other low melt PSF.42
Interchangeability. The interchangeability between crystalline low melt PSF and other
low melt PSF is limited. Other low melt PSF is not used in applications where crystalline low
melt PSF is required.43
Producer and Customer Perceptions. Petitioner contends that although customers may
prefer crystalline low melt PSF for certain automotive applications, they still perceive the
crystalline product to be low melt PSF.44 Respondents contend that customers perceive the
crystalline low melt PSF and other low melt PSF to have different applications.45
38 CR at I‐12, PR at I‐8. 39 Petitioner’s Postconference Brief, Exh. 3, para. 3. 40 CR at I‐15‐16, PR at I‐10‐11. 41 CR/PR at II‐1. 42 Conference Tr. at 21 (Sparkman), 30 and 31 (Ringel), Petitioner’s Postconference Brief at Exh.
2, para. 11. 43 Conference Tr. at 89 (Edwards). 44 Petitioner’s Postconference Brief at 10. 45 Conference Tr. at 89 (Edwards).

16
Price. The record indicates that crystalline low melt PSF is priced higher than other low
melt PSF, but that difference has not been quantified.46
Conclusion. Crystalline low melt PSF and other low melt PSF share certain basic physical
characteristics, most notably their bi‐component structure, in which one component melts at a
lower temperature than the other, giving the fiber thermal bonding qualities.47 However, the
molecular structure of crystalline low melt PSF is different from that of other low melt PSF, and
the crystalline product is more rigid. Crystalline low melt PSF is used in the same downstream
industry – the automotive industry – as other low melt PSF, but is used in specialized
applications in that industry. The manufacturing facilities, production processes, and
employees used to make crystalline low melt PSF are the same as those used to make other low
melt PSF, except that production of the crystalline product involves adding an additional
chemical to the polymer. The channels of distribution are the same. Although the
interchangeability of crystalline low melt with other low melt PSF is limited, such limited
interchangeability is also true for other low melt PSF products that serve a range of applications
based upon the product’s specific characteristics. For example, different end uses for low melt
PSF require different melt points.48 Although customers perceive the crystalline low melt PSF
and other low melt PSF to have different applications, the basic characteristics of the products
are the same, namely bonding in nonwoven products.49 Crystalline low melt PSF is priced
higher than other low melt PSF. Overall, the limited distinctions between crystalline low melt
46 Conference Tr. at 89 (Edwards). The Commission did not seek pricing data for a crystalline low
melt PSF product. 47 CR at I‐10, PR at I‐7. 48 CR at I‐10‐11, PR at I‐7‐8. 49 CR at I‐10, PR at I‐7.

PSF and o
we do no
these pre
D
Fo
product c
DIV.
T
like prod
a major p
industry,
domestic
the dome
T
producer
subject m
50
the Commprovide inthey perchand, and
51
52
other low m
ot define cry
eliminary de
D. Concl
or purposes
coextensive
Domestic In
he domestic
uct, or those
proportion o
the Commi
c production
estic mercha
here are no
r of polyeste
merchandise
0 If respondenmission definen their commeive a clear dd other dome1 19 U.S.C. § 12 CR at III‐2‐3,
elt PSF do n
ystalline low
etermination
usion
of the prelim
with Comm
ndustry
c industry is
e producers
of the total d
ssion’s gene
n of the like p
ant market.
related part
er staple fibe
e to the Unit
nts wish to pue crystalline loents on the Cdividing line bstically produ1677(4)(A). PR at III‐2.
ot, in our vie
melt PSF as
ns.50
minary phas
merce’s scope
defined as t
whose colle
domestic pro
eral practice
product, wh
ty issues in t
er products i
ed States du
ursue their arow melt PSF aCommission’s etween domuced low melt
17
ew, constitu
a separate d
se of these in
e definition.
he domestic
ective outpu
oduction of t
has been to
ether toll‐pr
these investi
n Taiwan,52
uring the Jan
gument in anas a separatedraft questioestically prodt PSF product
ute a clear di
domestic lik
nvestigation
c “producers
ut of a dome
the product.
o include in t
roduced, cap
igations. Alt
because tha
nuary 2014‐M
ny final phasee domestic likonnaires a paduced crystallts, on the oth
ividing line,
ke product fo
ns, we define
s as a whole
stic like prod
.”51 In defin
the industry
ptively cons
though Nan
at firm did n
March 2017
e of these invee product, thrticularized dline low melt her.
and accordi
or purposes
e one like
of a domes
duct constitu
ing the dom
producers o
umed, or so
Ya is owned
ot export th
period of
estigations thhey should discussion of wPSF, on the o
ngly
of
tic
utes
mestic
of all
ld in
d by a
he
hat
why one

investiga
neither d
A
melt PSF
NV.
P
merchan
all such m
which da
deemed
S
respectiv
the petit
negligibil
CVI.
Fo
indicatio
requires
53
54
55
56
U.S.C. §§157
ation (“POI”)
domestic pro
Accordingly, w
.
Negligible I
ursuant to S
dise corresp
merchandise
ata are availa
negligible.56
ubject impo
vely, of total
ion (June 20
lity threshol
Cumulation
or purposes
n of materia
the Commis
3 Conference 4 See 19 U.S.C5 CR at III‐10, 6 19 U.S.C. §11677(24)(A) a7 CR at IV‐6, P
,53 Nan Ya d
oducer impo
we define th
Imports
Section 771(2
ponding to a
e imported in
able precedi
6
rts from Kor
U.S. import
016 through
d, we find th
n
of evaluatin
al injury by r
ssion to cum
Tr. at 48 (FreC. § 1677(4)(BPR at III‐5. 673b(a). Theand 1677(24)(R at IV‐5.
oes not mee
orted the sub
he domestic
24) of the Ta
domestic li
nto the Unit
ng the filing
rea and Taiw
ts of low me
May 2017).5
hat subject i
ng the volum
eason of sub
mulate subjec
eman). B).
ere are except(B).
18
et the definit
bject mercha
industry to
ariff Act, imp
ke product t
ted States du
g of an antidu
wan accounte
lt PSF in the
57 Because t
mports from
me and effec
bject import
ct imports fr
tions to this g
tion of a rela
andise.55
include all d
ports from a
that account
uring the mo
umping peti
ed for 67.7 p
12‐month p
hese percen
m Korea and
cts for a dete
ts, section 77
rom all coun
general rule n
ated party.54
domestic pro
a subject cou
t for less tha
ost recent 12
ition shall ge
percent and
period prece
ntages excee
Taiwan are
ermination o
71(7)(G)(i) o
ntries as to w
not pertinent
4 Furthermo
oducers of lo
untry of
an 3 percent
2 months fo
enerally be
30.6 percen
eding the fili
ed the statut
not negligib
of reasonabl
of the Tariff A
which petitio
here. See 19
ore,
ow
of
r
nt,
ng of
tory
ble.
e
Act
ons
9

19
were filed and/or investigations self‐initiated by Commerce on the same day, if such imports
compete with each other and with the domestic like product in the U.S. market. In assessing
whether subject imports compete with each other and with the domestic like product, the
Commission generally has considered four factors:
(1) the degree of fungibility between subject imports from different countries and between subject imports and the domestic like product, including consideration of specific customer requirements and other quality related questions;
(2) the presence of sales or offers to sell in the same geographic markets of subject imports from different countries and the domestic like product;
(3) the existence of common or similar channels of distribution for subject imports from different countries and the domestic like product; and
(4) whether the subject imports are simultaneously present in the market.58
While no single factor is necessarily determinative, and the list of factors is not
exclusive, these factors are intended to provide the Commission with a framework for
determining whether the subject imports compete with each other and with the domestic like
product.59 Only a “reasonable overlap” of competition is required.60
Petitioner argues that subject imports should be cumulated because low melt PSF from
all subject sources is fungible, sold through the same channels of distribution, and
58 See Certain Cast‐Iron Pipe Fittings from Brazil, the Republic of Korea, and Taiwan, Inv. Nos.
731‐TA‐278‐80 (Final), USITC Pub. 1845 (May 1986), aff’d, Fundicao Tupy, S.A. v. United States, 678 F. Supp. 898 (Ct. Int’l Trade), aff’d, 859 F.2d 915 (Fed. Cir. 1988).
59 See, e.g., Wieland Werke, AG v. United States, 718 F. Supp. 50 (Ct. Int’l Trade 1989). 60 The Statement of Administrative Action (SAA) to the Uruguay Round Agreements Act (URAA),
expressly states that “the new section will not affect current Commission practice under which the statutory requirement is satisfied if there is a reasonable overlap of competition.” H.R. Rep. No. 103‐316, Vol. I at 848 (1994) (citing Fundicao Tupy, 678 F. Supp. at 902); see Goss Graphic Sys., Inc. v. United States, 33 F. Supp. 2d 1082, 1087 (Ct. Int’l Trade 1998) (“cumulation does not require two products to be highly fungible”); Wieland Werke, AG, 718 F. Supp. at 52 (“Completely overlapping markets are not required.”).

20
simultaneously present throughout the U.S. market.61 Respondents did not address
cumulation.
The threshold requirement for cumulation is satisfied because the antidumping duty
petitions with respect to both countries were filed on the same day, June 27, 2017.62 As
discussed below, we find a reasonable overlap of competition between subject imports from
Korea and Taiwan, and between subject imports from each source and the domestic like
product.
Fungibility. The record in the preliminary phase of these investigations indicates that
low melt PSF is at least moderately fungible regardless of source. *** U.S. producers reported
that product from all sources was “always” interchangeable.63 The majority of importers
reported that low melt PSF from different sources was “frequently” or “sometimes”
interchangeable.64 There were pricing observations for domestically produced product and
subject imports from both Korea and Taiwan for all three pricing products for nearly all quarters
in the POI,65 which suggests sales of competing products. Furthermore, multiple purchasers
responding to the lost sales/lost revenue survey indicated that they purchased low melt PSF
from one or both subject countries and the domestic like product.66
In view of the foregoing, the record indicates that there is sufficient fungibility between
and among subject imports from Korea and Taiwan and the domestic like product to satisfy the
61 Petitioner’s Postconference Brief at 14‐17. 62 None of the statutory exceptions to cumulation applies. 63 CR/PR at Table II‐4. 64 CR/PR at Table II‐4. 65 CR/PR at Table V‐3‐5. 66 CR/PR at Tables V‐8‐9.

21
reasonable overlap standard. As stated above, market participants generally perceive products
from different sources to be at least somewhat interchangeable. Information in the record also
reflects substantial overlap between the domestic like product and subject imports in terms of
denier size and melt point of the product.67 The purchaser data from the lost sales/lost
revenue survey discussed above also indicates some degree of competition between the
domestic like product and subject imports from each of these sources.
Channels of Distribution. U.S. producers sold mostly to distributors, but a substantial
portion of their shipments went to end users.68 Importers of subject merchandise from Korea
and Taiwan sold almost entirely to end users.69
Geographic Overlap. U.S. producers and importers reported selling low melt PSF to all
regions of the contiguous United States.70
Simultaneous Presence in Market. Subject imports from Korea and Taiwan were present
in the U.S. market in each month of the POI.71
67 CR/PR at Tables IV‐6 and IV‐7. Most of the shipments from the domestic producers and from
each subject country consisted of medium denier low melt PSF with a melt point of 120°C or below. See CR/PR at Table IV‐4. Although the domestic industry makes very little black or crystalline low melt PSF, the record indicates that these products account for relatively small shares of the domestic market. Petitioner’s Postconference Brief at Exh. 2, para. 9 (black and crystalline low melt PSF estimated to account for 10 percent and four percent of the U.S. market, respectively).
68 The proportion of U.S. producers’ U.S. commercial shipments that went to distributors ranged from *** to *** percent over the POI, while the proportion of their shipments that went to end users ranged from *** to *** percent. CR/PR at Table II‐1.
69 CR/PR at Table II‐1. 70 CR/PR at Table II‐2. Imports from each subject country entered predominantly at East Coast
ports. CR/PR at Table IV‐6. 71 CR at IV‐11, PR at IV‐9 & CR/PR at Table IV‐5.

C
from Kor
reasonab
product,
analysis o
imports.
RVII.
A
In
Commiss
States is
investiga
subject im
domestic
operatio
immater
domestic
72
amendedindicationrespects.
73
relevant tto the det
74
Conclusion. B
rea and Taiw
ble overlap o
we analyze
of whether t
Reasonable
A. Legal
n the prelimi
sion determi
materially in
ation.72 In m
mports, thei
c producers
ns.73 The sta
ial, or unimp
c industry is
2 19 U.S.C. §§ the provision
n of material i We have app3 19 U.S.C. § 1to the determtermination.”4 19 U.S.C. § 1
Because the
wan were file
of competitio
subject imp
there is a rea
e Indicatio
Standard
inary phase
ines whethe
njured or thr
making this de
ir effect on p
of the dome
atute define
portant.”74 I
materially in
1671b(a), 16ns of the Tarifinjury and thrplied these am1677(7)(B). Tmination” but ” 19 U.S.C. § 1677(7)(A).
antidumpin
ed on the sam
on between
ports from Ko
asonable ind
n of Mate
of antidump
er there is a r
reatened wi
eterminatio
prices for the
estic like pro
es “material
In assessing
njured by re
673b(a). The Tff Act pertainreat of matermendments hhe Commissioshall “identif1677(7)(B).
22
ng duty petit
me day, and
and among
orea and Tai
dication of m
rial Injury
ping and cou
reasonable i
th material i
n, the Comm
e domestic l
oduct, but on
injury” as “h
whether the
ason of subj
Trade Preferening to Commrial injury by rhere. on “may consfy each {such}
ions with re
d the record
g subject imp
iwan on a cu
material inju
by Reason
untervailing
indication th
injury by rea
mission must
ike product,
nly in the co
harm which
ere is a reas
ject imports
ences Extensimission determreason of sub
sider such oth} factor ... {a}
espect to sub
indicates th
ports and the
umulated ba
ry by reason
n of Subjec
duty investi
hat an indust
ason of the i
t consider th
, and their im
ntext of U.S
is not incon
onable indic
, we conside
ion Act of 201minations of rbject imports
her economicnd explain in
bject imports
at there is a
e domestic l
asis for our
n of subject
ct Imports
gations, the
try in the Un
mports und
he volume o
mpact on
. production
sequential,
cation that t
er all relevan
15, Pub. L. 11reasonable in certain
c factors as arfull its releva
s
a
ike
s
nited
er
of
n
he
nt
14‐27,
re ance

23
economic factors that bear on the state of the industry in the United States.75 No single factor
is dispositive, and all relevant factors are considered “within the context of the business cycle
and conditions of competition that are distinctive to the affected industry.”76
Although the statute requires the Commission to determine whether there is a
reasonable indication that the domestic industry is “materially injured by reason of” unfairly
traded imports,77 it does not define the phrase “by reason of,” indicating that this aspect of the
injury analysis is left to the Commission’s reasonable exercise of its discretion.78 In identifying a
causal link, if any, between subject imports and material injury to the domestic industry, the
Commission examines the facts of record that relate to the significance of the volume and price
effects of the subject imports and any impact of those imports on the condition of the domestic
industry. This evaluation under the “by reason of” standard must ensure that subject imports
are more than a minimal or tangential cause of injury and that there is a sufficient causal, not
merely a temporal, nexus between subject imports and material injury.79
75 19 U.S.C. § 1677(7)(C)(iii). 76 19 U.S.C. § 1677(7)(C)(iii). 77 19 U.S.C. §§ 1671b(a), 1673b(a). 78 Angus Chemical Co. v. United States, 140 F.3d 1478, 1484‐85 (Fed. Cir. 1998) (“{T}he statute
does not ‘compel the commissioners’ to employ {a particular methodology}.”), aff’g 944 F. Supp. 943, 951 (Ct. Int’l Trade 1996).
79 The Federal Circuit, in addressing the causation standard of the statute, has observed that “{a}s long as its effects are not merely incidental, tangential, or trivial, the foreign product sold at less than fair value meets the causation requirement.” Nippon Steel Corp. v. USITC, 345 F.3d 1379, 1384 (Fed. Cir. 2003). This was re‐affirmed in Mittal Steel Point Lisas Ltd. v. United States, 542 F.3d 867, 873 (Fed. Cir. 2008), in which the Federal Circuit, quoting Gerald Metals, Inc. v. United States, 132 F.3d 716, 722 (Fed. Cir. 1997), stated that “this court requires evidence in the record ‘to show that the harm occurred “by reason of” the LTFV imports, not by reason of a minimal or tangential contribution to material harm caused by LTFV goods.’” See also Nippon Steel Corp. v. United States, 458 F.3d 1345, 1357 (Fed. Cir. 2006); Taiwan Semiconductor Industry Ass’n v. USITC, 266 F.3d 1339, 1345 (Fed. Cir. 2001).

24
In many investigations, there are other economic factors at work, some or all of which
may also be having adverse effects on the domestic industry. Such economic factors might
include nonsubject imports; changes in technology, demand, or consumer tastes; competition
among domestic producers; or management decisions by domestic producers. The legislative
history explains that the Commission must examine factors other than subject imports to
ensure that it is not attributing injury from other factors to the subject imports, thereby
inflating an otherwise tangential cause of injury into one that satisfies the statutory material
injury threshold.80 In performing its examination, however, the Commission need not isolate
the injury caused by other factors from injury caused by unfairly traded imports.81 Nor does the
80 SAA, H.R. Rep. 103‐316, Vol. I at 851‐52 (1994) (“{T}he Commission must examine other
factors to ensure that it is not attributing injury from other sources to the subject imports.”); S. Rep. 96‐249 at 75 (1979) (the Commission “will consider information which indicates that harm is caused by factors other than less‐than‐fair‐value imports.”); H.R. Rep. 96‐317 at 47 (1979) (“in examining the overall injury being experienced by a domestic industry, the ITC will take into account evidence presented to it which demonstrates that the harm attributed by the petitioner to the subsidized or dumped imports is attributable to such other factors;” those factors include “the volume and prices of nonsubsidized imports or imports sold at fair value, contraction in demand or changes in patterns of consumption, trade restrictive practices of and competition between the foreign and domestic producers, developments in technology and the export performance and productivity of the domestic industry”); accord Mittal Steel, 542 F.3d at 877.
81 SAA at 851‐52 (“{T}he Commission need not isolate the injury caused by other factors from injury caused by unfair imports.”); Taiwan Semiconductor Industry Ass’n , 266 F.3d at 1345. (“{T}he Commission need not isolate the injury caused by other factors from injury caused by unfair imports ... . Rather, the Commission must examine other factors to ensure that it is not attributing injury from other sources to the subject imports.” (emphasis in original)); Asociacion de Productores de Salmon y Trucha de Chile AG v. United States, 180 F. Supp. 2d 1360, 1375 (Ct. Int’l Trade 2002) (“{t}he Commission is not required to isolate the effects of subject imports from other factors contributing to injury” or make “bright‐line distinctions” between the effects of subject imports and other causes.); see also Softwood Lumber from Canada, Inv. Nos. 701‐TA‐414 and 731‐TA‐928 (Remand), USITC Pub. 3658 at 100‐01 (Dec. 2003) (Commission recognized that “{i}f an alleged other factor is found not to have or threaten to have injurious effects to the domestic industry, i.e., it is not an ‘other causal factor,’ then there is nothing to further examine regarding attribution to injury”), citing Gerald Metals, 132 F.3d at 722 (the statute “does not suggest that an importer of LTFV goods can escape countervailing duties by finding some tangential or minor cause unrelated to the LTFV goods that contributed to the harmful effects on domestic market prices.”).

25
“by reason of” standard require that unfairly traded imports be the “principal” cause of injury
or contemplate that injury from unfairly traded imports be weighed against other factors, such
as nonsubject imports, which may be contributing to overall injury to an industry.82 It is clear
that the existence of injury caused by other factors does not compel a negative
determination.83
Assessment of whether material injury to the domestic industry is “by reason of” subject
imports “does not require the Commission to address the causation issue in any particular way”
as long as “the injury to the domestic industry can reasonably be attributed to the subject
imports” and the Commission “ensure{s} that it is not attributing injury from other sources to
the subject imports.”84 Indeed, the Federal Circuit has examined and affirmed various
Commission methodologies and has disavowed “rigid adherence to a specific formula.”85
The Federal Circuit’s decisions in Gerald Metals, Bratsk, and Mittal Steel all involved
cases in which the relevant “other factor” was the presence in the market of significant
volumes of price‐competitive nonsubject imports. The Commission interpreted the Federal
82 S. Rep. 96‐249 at 74‐75; H.R. Rep. 96‐317 at 47. 83 See Nippon, 345 F.3d at 1381 (“an affirmative material‐injury determination under the statute
requires no more than a substantial‐factor showing. That is, the ‘dumping’ need not be the sole or principal cause of injury.”).
84 Mittal Steel, 542 F.3d at 877‐78; see also id. at 873 (“While the Commission may not enter an affirmative determination unless it finds that a domestic industry is materially injured ‘by reason of’ subject imports, the Commission is not required to follow a single methodology for making that determination ... {and has} broad discretion with respect to its choice of methodology.”) citing United States Steel Group v. United States, 96 F.3d 1352, 1362 (Fed. Cir. 1996) and S. Rep. 96‐249 at 75. In its decision in Swiff‐Train v. United States, 793 F.3d 1355 (Fed. Cir. 2015), the Federal Circuit affirmed the Commission’s causation analysis as comporting with the Court’s guidance in Mittal.
85 Nucor Corp. v. United States, 414 F.3d 1331, 1336, 1341 (Fed. Cir. 2005); see also Mittal Steel, 542 F.3d at 879 (“Bratsk did not read into the antidumping statute a Procrustean formula for determining whether a domestic injury was ‘by reason’ of subject imports.”).
26
Circuit’s guidance in Bratsk as requiring it to apply a particular additional methodology
following its finding of material injury in cases involving commodity products and a significant
market presence of price‐competitive nonsubject imports.86 The additional
“replacement/benefit” test looked at whether nonsubject imports might have replaced subject
imports without any benefit to the U.S. industry. The Commission applied that specific
additional test in subsequent cases, including the Carbon and Certain Alloy Steel Wire Rod from
Trinidad and Tobago determination that underlies the Mittal Steel litigation.
Mittal Steel clarifies that the Commission’s interpretation of Bratsk was too rigid and
makes clear that the Federal Circuit does not require the Commission to apply an additional
test nor any one specific methodology; instead, the court requires the Commission to have
“evidence in the record ‘to show that the harm occurred ‘by reason of’ the LTFV imports,’” and
requires that the Commission not attribute injury from nonsubject imports or other factors to
subject imports.87 Accordingly, we do not consider ourselves required to apply the
replacement/benefit test that was included in Commission opinions subsequent to Bratsk.
The progression of Gerald Metals, Bratsk, and Mittal Steel clarifies that, in cases
involving commodity products where price‐competitive nonsubject imports are a significant
86 Mittal Steel, 542 F.3d at 875‐79. 87 Mittal Steel, 542 F.3d at 873 (quoting from Gerald Metals, 132 F.3d at 722), 875‐79 & n.2
(recognizing the Commission’s alternative interpretation of Bratsk as a reminder to conduct a non‐attribution analysis).

27
factor in the U.S. market, the Court will require the Commission to give full consideration, with
adequate explanation, to non‐attribution issues when it performs its causation analysis.88
The question of whether the material injury threshold for subject imports is satisfied
notwithstanding any injury from other factors is factual, subject to review under the substantial
evidence standard.89 Congress has delegated this factual finding to the Commission because of
the agency’s institutional expertise in resolving injury issues.90
B. Conditions of Competition and the Business Cycle
The following conditions of competition inform our analysis of whether there is a
reasonable indication of material injury by reason of the subject imports.
1. Demand Conditions
Demand for low melt PSF depends on demand for the downstream products in which it
is used. These include antibacterial wipes and diapers, soundproofing, batting, furniture,
88 To that end, after the Federal Circuit issued its decision in Bratsk, the Commission began to
present published information or send out information requests in the final phase of investigations to producers in nonsubject countries that accounted for substantial shares of U.S. imports of subject merchandise (if, in fact, there were large nonsubject import suppliers). In order to provide a more complete record for the Commission’s causation analysis, these requests typically seek information on capacity, production, and shipments of the product under investigation in the major source countries that export to the United States. The Commission plans to continue utilizing published or requested information in the final phase of investigations in which there are substantial levels of nonsubject imports.
89 We provide in our discussion below a full analysis of other factors alleged to have caused any material injury experienced by the domestic industry.
90 Mittal Steel, 542 F.3d at 873; Nippon Steel Corp., 458 F.3d at 1350, citing U.S. Steel Group, 96 F.3d at 1357; S. Rep. 96‐249 at 75 (“The determination of the ITC with respect to causation is ... complex and difficult, and is a matter for the judgment of the ITC.”).

28
padding and insulation in the trunks of cars and in engine hoods, car floors, and the headliners
of cars.91
Apparent U.S. consumption rose throughout the POI; it was *** pounds in 2014, ***
pounds in 2015, and *** pounds in 2016.92 *** U.S. producers and 12 of 22 importers reported
that demand in the United States for low melt PSF increased since the beginning of the POI.93
2. Supply Conditions
Subject imports were the largest supplier of low melt PSF to the United States
throughout the POI. The market share of subject imports rose from *** percent in 2014 to ***
percent in 2015, and to *** percent in 2016.94
The domestic industry was the second largest source of supply to the U.S. market after
subject imports. The domestic industry’s market share declined from *** percent in 2014 to
*** percent in 2015, and to *** percent in 2016.95 The domestic industry’s production capacity
remained constant throughout the POI.96 *** domestic producer reported producing products
other than low melt PSF on the same equipment and machinery used to make low melt PSF.
Low melt PSF accounted for between *** percent of U.S. producers’ production on this shared
equipment from 2014 to 2016.97 Respondents assert that the domestic industry was impacted
91 CR at II‐7, PR at II‐4‐5. 92 CR/PR at Table IV‐17. Apparent U.S. consumption was *** pounds in the first quarter of 2016
(“interim 2016”) and *** pounds in the first quarter of 2017 (“interim 2017”). Id. 93 CR at II‐8, PR at II‐5, and CR/PR at Table II‐3. 94 CR/PR at Table IV‐7. Subject imports accounted for *** percent of the U.S. market in interim
2016 and *** percent in interim 2017. Id. 95 CR/PR at Table IV‐7. The domestic industry’s market share was *** percent in interim 2016
and *** percent in interim 2017. Id. 96 The industry’s capacity was *** pounds in each full year of the POI and *** pounds in both
interim periods. CR/PR at Table III‐5. 97 CR at III‐7, PR at III‐4, and CR/PR at Table III‐5.

29
by shortages of the raw material purified terephthalic acid (“PTA”), following a fire at the plant
of the sole or principal supplier of this product in late 2014.98 Petitioner disputes respondents’
assertion that the domestic industry’s ability to supply its customers was affected during the
POI by a raw material shortage.99
The market share of nonsubject imports was very small throughout the POI. It was ***
percent in 2014, *** percent in 2015, and *** percent in 2016.100
3. Substitutability and Other Conditions
As discussed above, *** U.S. producers reported that product from all sources was
“always” interchangeable,101 and the majority of importers reported that low melt PSF from
different sources was “frequently” or “sometimes” interchangeable.102 Respondents have
reported that they cannot obtain black or colored low melt PSF, or crystalline low melt PSF from
domestic producers, or that they cannot obtain these products from domestic producers in
sufficient quantities.103 The record indicates that these products account for relatively small
shares of the domestic market.104 Overall, the record indicates that there is a moderate degree
of substitutability between domestically produced low melt PSF and subject imports from Korea
and Taiwan.
98 Bernet Respondents’ Postconference Brief at Exh. 1, p. 5; Conference Tr. at 17 (Menegaz). 99 Petitioner’s Postconference Brief at 20‐21. 100 CR/PR at Table IV‐7. Nonsubject imports’ market share was *** percent in interim 2016 and
*** percent in interim 2017. Id. 101 CR/PR at Table II‐4. 102 CR/PR at Table II‐4. 103 Bernet Respondents’ Postconference Brief at 8‐9 and Exh. 1, p. 1; Milliken Postconference
Brief at 6‐8. 104 Black and crystalline low melt PSF are estimated to account for 10 percent and four percent
of the U.S. market, respectively. Petitioner’s Postconference Brief at Exh. 2, para. 9.

30
Purchasers have indicated that price is one of several factors that are important in
purchasing decisions. Purchasers responding to the Commission’s lost sales/lost revenue
survey most frequently cited price, quality, and availability as the factors affecting their
purchasing decisions.105 Six of eight purchasers reported price as a major factor.106 In light of
this, we find that price is an important factor in purchasing decisions.
The primary raw materials used to produce low melt PSF are monoethylene glycol
(“MEG”), PTA, and purified isophthalic acid (“PIA”). The prices of MEG and PTA fell overall
during 2014 to 2016, declining by *** percent and *** percent, respectively.107 Raw material
costs accounted for *** percent of the cost of goods sold (“COGS”) in 2014 and *** percent in
2016.108
C. Volume of Subject Imports
Section 771(7)(C)(i) of the Tariff Act provides that the “Commission shall consider
whether the volume of imports of the merchandise, or any increase in that volume, either in
absolute terms or relative to production or consumption in the United States, is significant.”109
Cumulated subject imports increased during the POI. The quantity of cumulated subject
imports rose from 151.4 million pounds in 2014 to 170.8 million pounds in 2015, and then to
199.1 million pounds in 2016, an increase of 30.4 percent.110 Subject imports gained significant
105 CR at II‐10, PR at II‐6. 106 CR at II‐10, PR at II‐6. 107 CR/PR at V‐1 and Fig. V‐1. Between December 2016 and March 2017, the costs
of these inputs increased by *** percent and *** percent, respectively. Id. 108 CR/PR at V‐1. 109 19 U.S.C. § 1677(7)(C)(i). 110 CR/PR at Tables IV‐2 and C‐1. Subject imports were 47.4 million pounds in interim 2016 and
50.4 million pounds in interim 2017. Id.

31
market share directly at the expense of the domestic industry. Cumulated subject import
market share rose from *** percent in 2014 to *** percent in 2015 and *** percent in 2016, a
gain of *** percentage points.111 By contrast, the domestic industry’s market share declined by
*** percentage points from 2014 to 2016.112
For purposes of these preliminary determinations, we find that the volume of subject
imports and the increase in that volume are significant both in absolute terms and relative to
consumption in the United States.113
D. Price Effects of the Subject Imports
Section 771(7)(C)(ii) of the Tariff Act provides that, in evaluating the price effects of
subject imports, the Commission shall consider whether –
(I) there has been significant price underselling by the imported merchandise as compared with the price of domestic like products of the United States, and
(II) the effect of imports of such merchandise otherwise depresses prices to a significant degree or prevents price increases, which otherwise would have occurred, to a significant degree.114
111 CR/PR at Table IV‐7. Their market share was *** percent in interim 2016 and *** percent in
interim 2017. Id. 112 The domestic industry’s market share, as measured by quantity, was *** percent in 2014,
*** percent in 2015, and *** percent in 2016. CR/PR at Table IV‐7. Its share was *** percent in interim 2016 and *** percent in interim 2017. Id.
113 Respondents argue that much of the growth in low melt PSF demand has occurred in certain specialized products that the domestic industry does not make in sufficient quantities, including black low melt PSF and crystalline low melt PSF. Conference Tr. at 75‐76 (Bernet) and 97 (Longo). In any final phase of these investigations, we will seek data on U.S. shipments of domestically produced and imported black and colored low melt PSF and crystalline low melt PSF.
114 19 U.S.C. § 1677(7)(C)(ii).

32
We found in section VII.B.3. above that there is a moderate degree of substitutability
between subject imports and the domestic like product and that price is an important factor in
purchasing decisions.
The Commission collected quarterly pricing data from U.S. producers and importers for
three low melt PSF products.115 Both U.S. producers and nine importers provided usable pricing
data for sales of the requested products, although not all firms reported prices for all products
for all quarters.116 Pricing data reported by these firms accounted for approximately ***
percent of U.S. producers’ commercial shipments of low melt PSF, *** percent of U.S.
commercial shipments of subject imports from Korea, and *** percent of shipments of U.S.
commercial shipments of subject imports from Taiwan in 2016.117
The pricing comparison data show predominant overselling. Prices of cumulated subject
imports were below those for U.S.‐produced product in 31 of 77 quarterly comparisons (40.3
percent of all comparisons) from January 2014 to March 2017.118 The quantity of subject
imports in underselling comparisons was 81.3 million pounds, or 18.2 percent of the total
quantity, while the quantity that oversold the domestic product totaled 365.7 million pounds,
115 The three pricing products are: Product 1 — Low melt polyester staple fiber, 4 denier in diameter, 37‐76 mm in cut length, sheath melt point of 110°C; Product 2 — Low melt polyester staple fiber, 4 denier in diameter, 37‐76 mm in cut length, sheath melt point of 180°C; and Product 3 — Low melt polyester staple fiber, 2 denier in diameter, 37‐76 mm in cut length, melt point of 110°C.
CR at V‐4‐5, PR at V‐3.
116 CR at V‐5, PR at V‐3. 117 CR at V‐5, PR at V‐3. 118 CR/PR at Table V‐7.

33
or 81.8 percent of total quantity.119 The average margins of underselling and overselling were
29.5 percent and 9.6 percent, respectively.120 A majority of purchasers that responded to the
lost sales/lost revenue survey reported that the subject imports were priced lower than the
domestic like product, but only a minority of purchasers that purchased subject imports instead
of the domestic like product stated that they did so for price reasons.121 Based on the record of
these preliminary phase investigations, we do not find that there is significant underselling by
the subject imports as compared with the domestic like product.122
We also consider whether the subject imports had significant price‐depressing effects.
Prices for domestically produced fine low melt PSF declined for Products 1 and 2, which
accounted for the largest volume of sales during the POI, declined by *** percent and ***
percent, respectively, from January 2014 to March 2017.123 Prices fell during 2014 to 2016
119 CR/PR at Table V‐7. 120 CR/PR at Table V‐7. 121 CR/PR at Table V‐9. Of the eight purchasers responding to the lost sales/lost revenue survey,
three reported decreasing purchases from domestic producers, one reported increasing purchases, one reported no change, one reported fluctuating purchases, and one did not purchase any domestic product. Explanations for increasing purchases of domestic product included an increase in demand from the U.S. bedding industry. Explanations for decreasing purchases of domestic product included quality issues and availability. All eight purchasers reported that they had purchased imported low melt PSF from Korea instead of U.S.‐produced product since 2014. Five purchasers reported that they had purchased imported low melt PSF from Taiwan instead of U.S.‐produced product. Two purchasers reported that price was a primary reason for the decision to purchase imported product rather than U.S.‐produced product. Purchasers identified performance, quality, and availability as non‐price reasons for purchasing imported rather than U.S.‐produced product. CR at V‐15‐18, PR at V‐7, and CR/PR at Tables V‐8 and V‐9.
122 In any final phase investigations we will consider collecting quarterly pricing data distinguished by channels of distribution (i.e., sales to distributors, sales to end users). Furthermore, we request that parties in their questionnaire comments address the best way to collect data so that pigmentation and form of products are equivalent.
123 CR/PR at Table V‐6.

34
before recovering slightly during interim 2017.124 Prices for domestically produced Product 3
increased by *** percent in the same period.125 The cost for the principal raw materials used to
make low melt PSF also fell during the POI.126 Nonetheless, the industry’s average unit value of
net sales declined more rapidly than unit COGS from 2014 to 2016, and increased less rapidly
than unit COGS did in interim 2017.127 In light of this, and the large and increasing volumes of
subject imports during the POI and their moderate substitutability with the domestic like
product, we cannot conclude on the record of the preliminary phase of these investigations
that subject imports did not have significant price‐depressing effects on the domestic like
product.
In addition, given that price is an important factor in purchasing decisions, and that
subject imports and the domestic like product are moderately substitutable, we cannot
conclude that the shifts in market share from the domestic industry to subject imports were not
the result of subject import pricing.
124 CR/PR at Tables V‐3 and V‐4 and Figs. V‐2 and V‐3. 125 CR/PR at Table V‐4. 126 In any final phase investigations we intend to examine the extent to which raw material costs
impact the prices of the domestic like product and subject imports. 127 In the 2014‐2016 period, when unit COGS decreased by 22.7 percent, the average unit value
of net sales decreased by 27.7 percent. CR/PR at Table C‐1. In interim 2017, when unit COGS were 11.3 percent higher than in interim 2016, the average unit value of net sales only increased by 2.8 percent. Id. We note, however, that unit COGS may have decreased less rapidly than the average unit value of net sales between full years due to the decline in the quantity of net sales between 2014 and 2016.

35
E. Impact of the Subject Imports128
Section 771(7)(C)(iii) of the Tariff Act provides that the Commission, in examining the
impact of the subject imports on the domestic industry, “shall evaluate all relevant economic
factors which have a bearing on the state of the industry.” These factors include output, sales,
inventories, capacity utilization, market share, employment, wages, productivity, gross profits,
net profits, operating profits, cash flow, return on investment, return on capital, ability to raise
capital, ability to service debt, research and development, and factors affecting domestic prices.
No single factor is dispositive and all relevant factors are considered “within the context of the
business cycle and conditions of competition that are distinctive to the affected industry.”129
The domestic industry’s performance deteriorated over the POI. Most indicators of the
domestic industry’s performance declined from 2014 to 2016. There were improvements in
some of these indicators over the interim periods.130
Even as apparent U.S. consumption grew,131 the domestic industry’s production, U.S.
shipments, and total sales all declined, as subject imports took market share from the domestic
128 In its notice initiating the antidumping duty investigations, Commerce reported estimated
dumping margins of 39.24 to 52.23 percent for imports of low melt PSF from Korea, and 28.47 to 73.21 percent for imports of low melt PSF from Taiwan. Low Melt Polyester Staple Fiber From the Republic of Korea and Taiwan: Initiation of Less‐Than‐Fair‐Value Investigations, 82 Fed Reg. 34277, 34280 (July 24, 2017).
129 19 U.S.C. § 1677(7)(C)(iii). This provision was amended by the Trade Preferences Extension Act of 2015, Pub. L. 114‐27.
130 See CR/PR at Table C‐1. 131 Apparent U.S. consumption rose from *** pounds in 2014 to *** pounds in 2015 and ***
pounds in 2016. CR/PR at Table IV‐7.

36
industry.132 The domestic industry’s capacity remained constant throughout the POI,133 and its
capacity utilization fell.134 The domestic industry’s inventories declined throughout the POI.135
The domestic industry’s production‐related workers, wages paid, total hours worked,
and average hours worked per worker declined from 2014 to 2016.136 The industry’s
productivity declined from 2014 to 2015, but then improved in 2016 to a level that was better
than in 2014.137
132 The industry’s production totaled *** pounds in 2014, and *** pounds in both 2015 and
2016. CR/PR at Table III‐5. Its production totaled *** pounds in interim 2016 and *** pounds in interim 2017. Id. The industry’s U.S. shipments were *** pounds in 2014, *** pounds in 2015, and *** pounds in 2016. CR/PR at Table III‐6. The industry’s U.S. shipments were *** pounds in interim 2016 and *** pounds in interim 2017. Id. The industry’s total net sales were *** pounds in 2014, *** pounds in 2015, and *** pounds in 2016. CR/PR at Table VI‐1. Total net sales were *** pounds in interim 2016 and *** pounds in interim 2017. Id.
133 The industry’s capacity was *** pounds in each full year of the POI and *** pounds in both interim periods. CR/PR at Table III‐5.
134 The industry’s capacity utilization declined from *** percent in 2014 to *** percent in 2015 and *** percent in 2016. The industry’s capacity utilization was *** percent in interim 2016 and *** percent in interim 2017. CR/PR at Table III‐5.
135 U.S. producers’ end‐of‐period inventories declined from *** pounds in 2014 to *** pounds in 2015 and *** pounds in 2016. CR/PR at Table III‐7. End‐of‐period inventories were *** pounds in interim 2016 and *** pounds in interim 2017. Id.
136 The industry’s number of production‐related workers fell from *** in 2014 to *** in 2015 and to *** in 2016. CR/PR at Table III‐8. There were *** production‐related workers in interim 2016 and *** workers in interim 2017. Id. Total hours worked declined from *** in 2014 to *** in 2015 and to *** in 2016. CR/PR at Table III‐8. Hours worked were *** in interim 2016 and *** in interim 2017. Id. The wages the industry paid to its workers declined from $*** in 2014 to $*** in 2015, and then rose to $*** in 2016. Id. Wages paid totaled $*** in interim 2016 and $*** in interim 2017. Id. Average hours worked per worker declined from *** in 2014 to *** in 2015, and to *** in 2016. Id. Average hours worked per worker was *** in interim 2016 and *** in interim 2017. Id.
137 The industry’s productivity measured in pounds per hour declined from *** in 2014 to *** in 2015, and then increased to *** in 2016. CR/PR at Table III‐8. Productivity was *** pounds per hour in interim 2016 and *** pounds per hour in interim 2017. Id.

37
Average unit sales values fell and sales revenues declined.138 The ratio of COGS to net
sales was high and increased between 2014 and 2016 and was higher in interim 2017 than in
interim 2016.139 Gross profits declined from 2014 to 2016 and were lower in interim 2017 than
in interim 2016.140
Operating income declined from $*** in 2014 to $*** in 2015, and *** in 2016.141 The
domestic industry’s operating income margins likewise declined from *** percent in 2014 to
*** percent in 2015 to *** percent in 2016.142 Similarly, net income declined from $*** in
2014 to $*** in 2015, and turned to a *** in 2016.143
Subject import volume increased significantly in absolute terms from 2014 to 2016, and
the subject imports increased their share of the U.S. market at the expense of the domestic
industry. As previously discussed, we cannot conclude on the present record that the market
138 The domestic industry’s sales revenues fell from $*** in 2014 to $*** in 2015 and $*** in
2016. CR/PR at Table VI‐1. They were $*** in interim 2016 and $*** in interim 2017. Id. The industry’s average sales values declined from $*** per pound in 2014 to $*** per pound in 2015 and $*** per pound in 2016. Id. Its average sales values were $*** per pound in interim 2016 and $*** per pound in interim 2017. Id.
139 The domestic industry’s COGS as a ratio to net sales increased from *** percent in 2014 to *** percent in 2015, and to *** percent in 2016. CR/PR at Table VI‐1. The ratio was *** percent in interim 2016 and *** percent in interim 2017. Id.
140 The domestic industry’s gross profits declined from $*** in 2014 to $*** in 2015 and *** in 2016. CR/PR at Table VI‐1. Gross profits were $*** in interim 2016 and *** in interim 2017. Id.
141 CR/PR at Table VI‐1. Operating income was $*** in interim 2016 and *** in interim 2017. Id. 142 CR/PR at Table VI‐1. The industry’s operating income margins were *** percent in interim
2016 and *** percent in interim 2017. Id. The industry’s return on investment expressed as a ratio of operating income to net assets
declined from *** percent in 2014 to *** percent in 2015 and to *** percent in 2016. CR/PR at Table VI‐4.
143 CR/PR at Table VI‐1. Net income was $*** in interim 2016 and a loss of $*** in interim 2017. Id. The industry’s capital expenditures were $*** in 2014, $*** in 2015, and $*** in 2016. CR/PR at Table VI‐3. There were *** and there were $*** in interim 2017. Id. The industry’s research and development expenses were $*** in 2014, $*** in 2015, $*** in 2016, $*** in interim 2016, and $*** in interim 2017. Id.

38
share shifts were not the result of subject import pricing; this is a matter we will examine
further in any final phase investigations. In addition to lower market share, the industry
reported lower production, shipments, and sales. These declines were inconsistent with other
conditions of competition, particularly rising demand for low melt PSF and the industry’s
available capacity. Consequently, the industry also lost revenues that it ordinarily would have
obtained under these conditions.144 This lost revenue was reflected in its poor and declining
financial performance. For purposes of these preliminary determinations, we find that the
significant volume of cumulated subject imports, which gained market share at the expense of
the domestic industry, had a significant impact on the domestic industry.
We have considered whether there are other factors that may have had an impact on
the domestic industry during the POI to ensure that we are not attributing injury from such
other factors to subject imports. Nonsubject imports had only a small presence in the U.S.
market throughout the POI,145 and thus their presence cannot explain the observed declines in
the domestic industry’s market share and performance.
Accordingly, for purposes of these preliminary determinations, we conclude that subject
imports have had a significant impact on the domestic industry.
144 The industry operated with ample unused capacity and declining capacity utilization rates
from 2014 to 2016, indicating it had the ability to increase production. See CR/PR at Table III‐4. 145 As measured by quantity, nonsubject import market share was 2.5 percent in 2014, 3.1
percent in 2015, and 1.8 percent in 2016. CR/PR at Table IV‐2.

CVIII.
Fo
industry
from Kor
Conclusion
or the reaso
in the Unite
rea and Taiw
ons stated ab
d States is m
wan that are
bove, we det
materially inj
allegedly so
39
termine that
jured by rea
old in the Un
t there is a r
son of subje
ited States a
reasonable i
ect imports o
at less than f
ndication th
of low melt P
fair value.
hat an
PSF


I‐1
PART I: INTRODUCTION
BACKGROUND
These investigations result from a petition filed with the U.S. Department of Commerce (“Commerce”) and the U.S. International Trade Commission (“USITC” or “Commission”) by Nan Ya Plastics Corporation, America, Livingston, New Jersey, on June 27, 2017, alleging that an industry in the United States is materially injured and threatened with material injury by reason of less‐than‐fair‐value (“LTFV”) imports of low melt polyester staple fiber (“low melt PSF”)1 from Korea and Taiwan. The following tabulation provides information relating to the background of these investigations.2 3
Effective date Action June 27, 2017 Petition filed with Commerce and the Commission;
institution of Commission investigation (82 FR 30907, July 3, 2017)
July 17, 2017 Commerce’s notice of initiation (82 FR 34277, July 24, 2017)
July 18, 2017 Commission’s conference August 10, 2017 Commission’s vote August 11, 2017 Commission’s determination August 18, 2017 Commission’s views
STATUTORY CRITERIA AND ORGANIZATION OF THE REPORT
Statutory criteria
Section 771(7)(B) of the Tariff Act of 1930 (the “Act”) (19 U.S.C. § 1677(7)(B)) provides
that in making its determinations of injury to an industry in the United States, the Commission‐‐
shall consider (I) the volume of imports of the subject merchandise, (II) the effect of imports of that merchandise on prices in the United States for domestic like products, and (III) the impact of imports of such merchandise on domestic producers of domestic like products, but only in the context of production operations within the United States; and. . . may consider such other economic factors as are relevant to the
1 See the section entitled “The Subject Merchandise” in Part I of this report for a complete description of the merchandise subject in this proceeding.
2 Pertinent Federal Register notices are referenced in appendix A, and may be found at the Commission’s website (www.usitc.gov).
3 A list of witnesses appearing at the conference is presented in appendix B of this report.

I‐2
determination regarding whether there is material injury by reason of imports.
Section 771(7)(C) of the Act (19 U.S.C. § 1677(7)(C)) further provides that‐‐4 In evaluating the volume of imports of merchandise, the Commission shall consider whether the volume of imports of the merchandise, or any increase in that volume, either in absolute terms or relative to production or consumption in the United States is significant.. . .In evaluating the effect of imports of such merchandise on prices, the Commission shall consider whether. . .(I) there has been significant price underselling by the imported merchandise as compared with the price of domestic like products of the United States, and (II) the effect of imports of such merchandise otherwise depresses prices to a significant degree or prevents price increases, which otherwise would have occurred, to a significant degree.. . . In examining the impact required to be considered under subparagraph (B)(i)(III), the Commission shall evaluate (within the context of the business cycle and conditions of competition that are distinctive to the affected industry) all relevant economic factors which have a bearing on the state of the industry in the United States, including, but not limited to. . . (I) actual and potential decline in output, sales, market share, gross profits, operating profits, net profits, ability to service debt, productivity, return on investments, return on assets, and utilization of capacity, (II) factors affecting domestic prices, (III) actual and potential negative effects on cash flow, inventories, employment, wages, growth, ability to raise capital, and investment, (IV) actual and potential negative effects on the existing development and production efforts of the domestic industry, including efforts to develop a derivative or more advanced version of the domestic like product, and (V) in {an antidumping investigation}, the magnitude of the margin of dumping.
In addition, Section 771(7)(J) of the Act (19 U.S.C. § 1677(7)(J)) provides that—5 (J) EFFECT OF PROFITABILITY.—The Commission may not determine that there is no material injury or threat of material injury to an industry in the United States merely because that industry is profitable or because the performance of that industry has recently improved.
4 Amended by PL 114‐27 (as signed, June 29, 2015), Trade Preferences Extension Act of 2015. 5 Amended by PL 114‐27 (as signed, June 29, 2015), Trade Preferences Extension Act of 2015.

I‐3
Organization of report
Part I of this report presents information on the subject merchandise, alleged dumping margins, and domestic like product. Part II of this report presents information on conditions of competition and other relevant economic factors. Part III presents information on the condition of the U.S. industry, including data on capacity, production, shipments, inventories, and employment. Parts IV and V present the volume of subject imports and pricing of domestic and imported products, respectively. Part VI presents information on the financial experience of U.S. producers. Part VII presents the statutory requirements and information obtained for use in the Commission’s consideration of the question of threat of material injury as well as information regarding nonsubject countries.
MARKET SUMMARY
Low melt PSF is generally used as a bonding fiber in nonwoven applications including
automotive lining, soundproofing, insulation and batting. There are two U.S. producers of low melt PSF: Nan Ya Plastics Corporation, America (“Nan Ya”) and Fiber Innovation Technology (“FIT Fibers”).6 Leading producers of low melt PSF outside the United States include Huvis Corporation (“Huvis”), Toray Chemical Korea, Inc. (“Toray Chemical”), and Taekwang Industrial Co., Ltd. (“Taekwang”) of Korea and Far Eastern New Century Corporation (“Far Eastern”) of Taiwan. The leading U.S. importers of product from Korea are ***, while the leading importers of product from Taiwan are ***. Leading importers of product from nonsubject countries (China and Japan) include ***. U.S. purchasers of product are firms that produce batting for quilts, filtration, lining for automotive headliners, truck liners, and soundproofing; leading U.S. purchasers include ***.
Apparent U.S. consumption of low melt PSF totaled approximately *** pounds ($***) in 2016. U.S. producers’ U.S. shipments of low melt PSF totaled *** pounds ($***) in 2016, and accounted for *** percent of apparent U.S. consumption by quantity and *** percent by value. U.S. imports from subject sources totaled 199.1 million pounds ($114.2 million) in 2016 and accounted for *** percent of apparent U.S. consumption by quantity and *** percent by value. U.S. imports from nonsubject sources totaled 3.6 million pounds ($2.8 million) in 2016 and accounted for *** percent of apparent U.S. consumption by quantity and *** percent by value.
SUMMARY DATA AND DATA SOURCES
A summary of data collected in these investigations is presented in appendix C, table C‐
1. Except as noted, U.S. industry data are based on questionnaire responses of two firms that accounted for 100 percent of U.S. production of low melt PSF during 2016. U.S. imports are based on official Commerce statistics and questionnaire responses of 23 firms that accounted for the vast majority of subject low melt PSF in 2016. Foreign industry data are based on the
6 Petition, p. 1.

I‐4
questionnaire data of one producer in Taiwan whose exports accounted for *** percent of U.S. imports of low melt PSF from Taiwan in 2016. The Commission did not receive any foreign producers’ questionnaire responses from Korean firms.
PREVIOUS AND RELATED INVESTIGATIONS7
Out‐of‐scope certain polyester staple fiber from Korea and Taiwan has been the subject
of prior antidumping and countervailing duty investigations in the United States. The original investigation on certain polyester staple fiber (“certain PSF”) was filed on April 2, 1999 by E.I. DuPont de Nemours ("DuPont"); Intercontinental Polymers, Inc. ("Intercontinental"); Arteva Specialties S.a.r.l., d/b/a KoSa (“KoSa”); Nan Ya; and Wellman, Inc. (“Wellman”). Nan Ya subsequently withdrew as a petitioner in the investigation involving Korea and was never an original petitioner in the investigation involving Taiwan. DuPont also later withdrew as a petitioner in the investigation involving Taiwan. In 2000, the Commission determined that an industry in the United States was materially injured by reason of imports from Korea and Taiwan of certain subject PSF, other than low melt PSF. The Commission found that low melt PSF was a separate domestic like product, and it made a negative injury determination with respect to that product. 8 After receiving the Commission’s final affirmative determinations, Commerce issued antidumping duty orders on imports of certain PSF from Korea and Taiwan,9 with margins of de minimis to 7.91 percent ad valorem for certain PSF from Korea and 5.77 to 9.51 percent ad valorem for certain PSF from Taiwan.10
On March 20, 2006, the Commission completed its full first five‐year reviews. The Commission determined that revocation of the antidumping duty orders on certain PSF from Korea and Taiwan would be likely to lead to continuation or recurrence of material injury to an industry in the United States within a reasonably foreseeable time.11 On April 3, 2006, Commerce published its notice of continuation of the antidumping duty orders.12
On September 13, 2011, the Commission completed its expedited second five‐year reviews on certain PSF from Korea and Taiwan.13 The Commission determined that revocation
7 Unless otherwise noted, information contained in this section comes from Polyester Staple Fiber from Korea and Taiwan, Inv. Nos. 731‐TA‐825 and 826 (Third Review), USITC Publication 4668, January 2017, pp. I‐9 – I‐11.
8 Certain Polyester Staple Fiber From Korea and Taiwan, 65 FR 33576, May 24, 2000. 9 Certain Polyester Staple Fiber from the Republic of Korea and Taiwan: Notice of Antidumping Duty
Order, 65 FR 33807, May 25, 2000. 10 Certain Polyester Staple Fiber from Korea and Taiwan, Inv. Nos. 731‐TA‐825 and 826 (Third
Review), USITC Publication 4668, January 2017, p. I‐9. 11 Certain Polyester Staple Fiber from Korea and Taiwan; Determinations, 71 FR 14721, March 23,
2006. 12 Certain Polyester Staple Fiber from the Republic of Korea and Taiwan: Continuation of Antidumping
Duty Orders, 71 FR 16558, April 3, 2006. 13 Certain Polyester Staple Fiber from Korea and Taiwan, Inv. Nos. 731‐TA‐825 and 826 (Second
Review), USITC Publication 4257, September 2011, p. I‐1.

I‐5
of the antidumping duty orders on certain PSF from Korea and Taiwan would be likely to lead to continuation or recurrence of material injury to an industry in the United States within a reasonably foreseeable time.14 On September 30, 2011, Commerce published its notice of continuation of the antidumping duty orders.15
On June 23, 2006, a petition was filed with the Commission and Commerce by DAK Americas, Nan Ya, and Wellman, alleging that LTFV imports of polyester staple fiber (“PSF”) from China were materially injuring or threatening to materially injure the domestic industry. On April 1, 2007, Commerce determined that PSF from China was being or was likely to be sold in the United States at LTFV.
On May 24, 2007, the Commission determined that the U.S. industry was materially injured by reason of LTFV imports of PSF from China.16 On June 1, 2007, Commerce issued the antidumping duty order on PSF from China.17 On May 1, 2012, the Commission instituted18 and Commerce initiated19 the first five‐year review on the antidumping duty on PSF from China. Following an expedited five‐year review, on September 28, 2012, the Commission determined that revocation of the antidumping duty order on PSF from China would be likely to lead to continuation or recurrence of material injury to an industry in the United States within a reasonably foreseeable time,20 and Commerce published the first continuation of the antidumping duty order on PSF from China on October 12, 2012.21 The second five‐year review of the antidumping duty order on PSF from China is currently scheduled for initiation on September 1, 2017.
NATURE AND EXTENT OF ALLEGED SALES AT LTFV
On July 24, 2017, Commerce published a notice in the Federal Register of the initiation
of its antidumping duty investigations on product from Korea22 and Taiwan.23 Commerce has
14 Certain Polyester Staple Fiber from Korea and Taiwan; Determination, 76 FR 58040, September 19, 2011.
15 Certain Polyester Staple Fiber from the Republic of Korea and Taiwan: Continuation of Antidumping Duty Orders, 76 FR 60802, September 30, 2011.
16 Certain Polyester Staple Fiber from China: Determination, 72 FR 30394, May 31, 2007. 17 Notice of Antidumping Duty Order: Certain Polyester Staple Fiber from the People's Republic of China, 72 FR 30545, June 1, 2007. 18 Certain Polyester Staple Fiber from China; Institution of a Five‐Year Review, 77 FR 25744, May 1,
2012. 19 Initiation of Five‐Year (“Sunset”) Review, 77 FR 25683, May 1, 2012. 20 Certain Polyester Staple Fiber from China: Determination, 77 FR 60720, October 4, 2012. 21 Certain Polyester Staple Fiber from the People's Republic of China: Continuation of Antidumping Duty Order, 77 FR 62217, October 12, 2012. 22 Low Melt Polyester Staple Fiber From the Republic of Korea and Taiwan: Initiation of Less‐Than‐
Fair‐Value Investigations, 82 FR 34277, July 24, 2017. 23 Low Melt Polyester Staple Fiber From the Republic of Korea and Taiwan: Initiation of Less‐Than‐
Fair‐Value Investigations, 82 FR 34277, July 24, 2017.

I‐6
initiated antidumping duty investigations based on estimated dumping margins of 39.24 to 52.23 percent for low melt PSF from Korea and 28.47 to 73.21 percent for low melt PSF from Taiwan.
THE SUBJECT MERCHANDISE
Commerce’s scope
Commerce has defined the scope of this investigation as follows:24 25 The merchandise subject to these investigations is synthetic staple fibers, not carded or combed, specifically bi‐component polyester fibers having a polyester fiber component that melts at a lower temperature than the other polyester fiber component (low melt PSF). The scope includes bicomponent polyester staple fibers of any denier or cut length. The subject merchandise may be coated, usually with a finish or dye, or not coated. Low melt PSF is classifiable under the Harmonized Tariff Schedule of the United States (HTSUS) subheading 5503.20.0015. Although the HTSUS subheading is provided for convenience and customs purposes, the written description of the scope of the merchandise under the investigations is dispositive.
Tariff treatment
Based upon the scope set forth by the Department of Commerce, information available
to the Commission indicates that the merchandise subject to these investigations is imported under the following provision of the 2017 Harmonized Tariff Schedule of the United States (“HTSUS”): 5503.20.0015. The 2017 general rate of duty for this HTS subheading is 4.3 percent ad valorem. The import duty applicable to goods originating from Korea was phased out as provided under the United States‐Korea Free Trade Agreement. U.S. imports from Korea that qualify for the preferential rate of duty under the United States‐Korea Free Trade Agreement are eligible for duty‐free entry.26 Decisions on the tariff classification and treatment of imported goods are within the authority of U.S. Customs and Border Protection.
24 Low Melt Polyester Staple Fiber From the Republic of Korea and Taiwan: Initiation of Less‐Than‐Fair‐Value Investigations, 82 FR 34277, July 24, 2017.
25 During their review of the Petitions, Commerce determined that the scope language of the low melt PSF Petition overlaps with recently‐initiated less‐than‐fair‐value investigations of fine denier polyester staple fiber (PSF) from Korea and Taiwan and the existing AD orders on polyester staple fiber (PSF) from Korean. Where the Department has faced the possibility of administering two proceedings covering identical merchandise, it has chosen to craft the scope of the subsequent proceedings to eliminate the potential overlap. Low Melt Polyester Staple Fiber From the Republic of Korea and Taiwan: Initiation of Less‐Than‐Fair‐Value Investigations, 82 FR 34277, July 24, 2017.
26 The United States‐Korea Free Trade Agreement entered into force on March 15, 2012.

I‐7
THE PRODUCT
Description and applications
Low melt PSF is a synthetic (manmade) staple fiber,27 not carded, combed or otherwise processed for spinning, made entirely of polyester. It is similar in appearance to cotton or wool fiber when baled. Like other types of PSF, low‐melt PSF is a high tenacity or strong fiber that resists shrinking and stretching.28 Unlike other types of PSF, low melt PSF has a bi‐component structure consisting of two strongly bonded, but separate polymers of different chemical and/or physical construction.29 It is most commonly comprised of a pure polyester core and a pure polyester outer sheath, but may also be produced in a side‐by‐side configuration. The sheath, which melts at a lower temperature (approximate melt point of 90° C to 220° C) than the core (approximate melt point of 250° C), provides a stable structure that allows the fiber to be processed smoothly into another form,30 and acts as an agent for thermal‐bonding to the core polymer. Thermal bonding eliminates the need for chemical adhesives and is therefore more environmentally friendly than resin bonding—a process used years ago to bind the outer sheath with the core.31 By melting at a lower temperature, the polyester outer sheath bonds the fibers together which imparts specific properties to the fibers.32 These include structural integrity, resilience, and durability for nonwoven products such as fiberfill or batting used in bedding – e.g., for comforters, quilting, and padding.33 According to the petitioner, “different end uses require different melt points.”34 Low melt PSF can be used in nonwoven products for a broad spectrum of downstream industries— automotive (door trim, dash pads, wheel guards, carpets, trunk and hood liners), industrial purposes (soundproofing and insulation for
27 Staple fiber is cut into specific, predetermined lengths from filaments. Hoeschst Celanese. Dictionary of Fiber & Textile Technology, “Staple,” p. 150. 1990
28 Hoeschst Celanese. Dictionary of Fiber & Textile Technology, “Polyester Fiber,” p. 116. 1990 29 Hans J. Koslowski. Dictionary of Man‐Made Fibers: Terms‐Figures‐Statistics, 2nd edition, p. 2, 34‐
35. 30 Fiberpartner.com. “Basics about low melt fiber you need to know,” April 4, 2016.
http://ww.slideshare.net/.../basics‐about‐low‐melt‐fiber‐you‐need‐to‐know, accessed July 12, 2017. 31 Low melt polyester staple fibers offer reduced energy costs, recyclability, and a healthier work
environment for manufacturers’ employees. Exelto Fibers. “Product Data Sheet: Polyolefin (Low) Melt Fibers.” http://www.exelto.com, accessed July 26, 2017, conference transcript, p. 73 (Bernet), and representative of the American Fiber Manufacturers Association, email message to USITC staff, July 26, 2017.
32 Conference transcript, p. 14 (Menegaz). 33 “Low Melt Polyester Fiber.” http://www.globalsources.com/gsol/I/Polyester‐
fiber/p/sm/1133589310.htm (accessed July 26, 2017) and Drum Creative. “The Low‐Down on Low‐Melt,” September 29, 2011. http://www.cdsensembles.com/the‐low‐down‐on‐low‐melt/, accessed July 12, 2017.
34 Conference transcript, p. 19 (Sparkman).

I‐8
construction), water and air filtration (such as air‐filtering face masks), and hygienic products (wipes, diapers, sanitary and medical goods, etc.).35
The variable physical characteristics of low melt PSF include “denier length, finished luster, and crimp,” percentage of the low melt PSF compared to the main fiber, whiteness or color (for black or other colors, a dye is added to the polymer during the fiber extrusion process),36 and crystalline form (the molecules remain in a repeated and structured arrangement rather than an amorphous form throughout the entire production process, and a chemical addictive is inserted before extrusion).37
Black and crystalline low melt PSF are sold at higher prices because of additional raw materials that are needed during the production process.38 Both are used for the same downstream industries as regular low melt PSF, but are targeted for niche markets within those industries. For example, black low melt PSF has been replacing “more toxic and heavier molded plastics in automotive applications such as trunk liners and engine insulation liners…,”and is used in applications in the automotive industry where the fiber might be visible, or for the exterior of the vehicle for which quality, esthetics, and engineering specifications are considered important.39
The respondents state that the chemical structure of crystalline low melt PSF differs from that of standard low melt PSF because “the polymer molecules are in a structured and repeated arrangement.” Furthermore, “crystalline low melt does not soften until it meets the exact melting point…and can withstand a significantly larger variety of temperatures without changing form,” whereas standard low melt PSF softens as the temperature gets closer to its melt temperature.40 The petitioner notes that the additive in the crystalline form of low melt PSF provides a bit more rigidity which enables it to resist heat more effectively than standard low melt PSF.41 For this reason, crystalline low melt PSF is typically used in the underbody of
35 Low Melt Polyester Fiber.” http://www.globalsources.com/gsol/I/Polyester‐fiber/p/sm/1133589310.htm, accessed July 26, 2017 and Fiberpartner.com. “Basics about low melt fiber you need to know,” April 4, 2016. http://ww.slideshare.net/.../basics‐about‐low‐melt‐fiber‐you‐need‐to‐know, accessed 7/12/2017, Conference transcript, p. 74 (Bernet), and Petitioner Nan Ya, postconference brief, p. 5.
36 Representative of the American Fiber Manufacturers Association, email message to USITC staff, July 24, 2017.
37 Representative of the American Fiber Manufacturers Association, email message to USITC staff, July 24, 2017 and Bernet International Trading, Fibertex Corporation, Stein Fibers, and Consolidated Fibers, postconference brief, p. 7 and conference transcript, pp. 80‐81 (Kunik).
38 Respondent Far Eastern New Century Corporation, postconference brief, p. 1 and conference transcript, pp. 47 and 105. Respondent Milliken stated that it has historically paid *** more for black low melt PSF. Respondent Milliken postconference brief, p. 5.
39 Conference transcript, p. 15 (Menegaz), p. 50 (Sparkman), and Respondents Bernet International Trading, Fibertex Corporation, Stein Fibers, and Consolidated Fibers, postconference brief, p. 122‐123.
40 Respondents Bernet International Trading, Fibertex Corporation, Stein Fibers, and Consolidated Fibers, postconference brief, p. 7.
41 Conference transcript, p. 70 (Sparkman).

I‐9
the automobile, wheel liners and components near the engine compartment which have various temperature zones. 42
The petitioner states that low melt PSF produced in the United States is chemically similar to the low melt PSF produced in Korea and Taiwan, used in the same applications, and made from the same raw materials—monoethylene glycol (MEG) and purified terephthalate acid (PTA).43 However, the respondents state that each producer’s fiber “has slightly different characteristics, such as shrinkage and/or bond strength”44 and that the low melt PSF produced in the United States does not offer the “various specialty products in different configurations that Korean sources provide.”45
The petitioner estimates that crystalline and black low melt PSF account for about 4 and 10 percent, respectively, (a combined 14 percent) of the U.S. market for low melt PSF.46 In contrast, the respondents estimate that together crystalline and black low melt PSF account for 20 to 30 percent of the U.S. market.47 Respondents also note there is limited substitutability between the white low melt produced domestically by the petitioners and the black low melt imported into the U.S. market. Respondents claim that black low melt PSF is responsible for the increase in demand worldwide, not just the United States, for low melt PSF.48
All low melt staple fiber is sold cut‐to‐length in bales to distributors or directly to end users—U.S. manufacturers of bedding, mattresses, filters, automotive components, insulation media, and other general industrial components.49
Manufacturing processes
Like other forms of polyester staple fiber, the production of bi‐component low melt PSF
is capital intensive and occurs in two distinct stages—1) the formation of the polymers and 2) the formation of fiber including extruding, stretching, cutting, and baling. However, the production of low melt PSF is distinctive because of the fiber’s unique bi‐component structure consisting of two polymers that have different melting points. The most common structures of low melt bi‐component staple fiber are: 1) core/sheath types (concentric circles) and 2) side‐by‐side types.50 Most low melt PSF is produced is in the core/sheath type configuration,51 in which
42 Respondents Bernet International Trading, Fibertex Corporation, Stein Fibers, and Consolidated Fibers, postconference brief , p. 7.
43 Conference transcript, p. 23 (Sparkman) and Petitioner Nan Ya, postconference brief, p. 4. 44 Conference transcript, p. 75 (Bernet). 45 Conference transcript, p. 28 (Kunik). 46 Petitioner Nan Ya, postconference brief, pp. 9 and 16. 47 Conference transcript, p.15 (Menegaz). 48 Conference transcript, p. 15 (Menegaz). 49 Conference transcript, p. 82 (Elias). 50 Hans J. Koslowski. Dictionary of Man‐Made Fibers: Terms‐Figures‐Statistics, 2nd edition, p. 2, 34‐
35 and representative of the American Fiber Manufacturers Association, telephone call with USITC staff, July 31, 2017.
51 Conference transcript, p. 46.

I‐10
the outer sheath, made of virgin materials, melts at a lower temperature (approximate melt point of 90° C to 220° C) than the core (approximate melt point of 250 C), which can be produced with either virgin or recycled materials.52 The thermal bonding of the outer sheath with the inner core that occurs when the low‐melt PSF is heated, replaces a resin bonding process employed in the past.53
In stage one of the manufacturing process, the polymer is produced by the reaction of the raw materials— monoethylene glycol (MEG) and purified terephthalate acid (PTA) or its derivatives.54 The cost of these raw materials accounts for most of the production costs of low melt PSF.55 Unlike other forms of PSF, production of low melt PSF requires two reactors, one producing the lower melt temperature product and the second which produces the higher melt temperature product.56 The MEG and PTA are chemically combined in one reactor that will eventually form the polyester core of low melt. Polyester that will form the outer sheath is formulated in a second reactor, where MEG and PTA are mixed. Often a third input, purified isophthalic acid (PIA) is added to achieve a lower melting point.57 “The melt point of the outer sheath can be controlled by the amount of PIA added to the second reactor vessel.”58
The polymerization occurs at a high temperature using a vacuum by one of two methods: 1) The MEG and PTA “react to form a polymer chain, releasing methanol; or 2) the MEG and PTA react directly to form the polymer with water as the by‐product.”59
The second stage of the production process for low melt PSF, common to all PSF, is extrusion and fiber formation that includes stretching, cutting, and baling. After polymerization, the solid, molten plastic, which has a consistency similar to cold honey, must be heated and liquefied before it can be extruded. The liquid fiber‐forming polymers are then extruded through tiny holes of a spinneret, a device similar in principle to a showerhead, to form continuous filaments of semi‐solid polymer. The denier of the fiber is controlled by the size of the holes on the spinneret as is the configuration (core/sheath or side by side, for example) of the bi‐component low melt PSF.60
Petitioner maintains that all low melt PSF (including black low melt PSF and crystalline low melt PSF) is manufactured using the same basic production process on the same equipment
52 Conference transcript, p. 19 and p. 44. 53 Representative of the American Fiber Manufacturers Association, email message to USITC staff,
July 26, 2017 and conference transcript, p. 73. According to one respondent, “resin bonding manufacturing capabilities no longer really exist in meaningful ways,” conference transcript, p. 73 (Bernet). (***).
54 Hoeschst Celanese. Dictionary of Fiber & Textile Technology, “Polyester Fiber,” p. 116. 1990 55 ***. 56 Conference transcript, p. 66 and Representative of the American Fiber Manufacturers Association,
telephone call with USITC staff, July 31, 2017. 57 Petitioner Nan Ya Plastics, postconference brief, p. 4. 58 Conference transcript, p. 20. 59 Hoeschst Celanese. Dictionary of Fiber & Textile Technology, “Polyester Fiber,” 116. 1990. 60 Representative of the American Fiber Manufacturers Association, telephone call with USITC staff,
July 31, 2017.

I‐11
and with the same employees.61 An industry source reports that the differences between the manufacturing processes for standard low melt PSF and those for black low melt PSF and crystalline low melt PSF are minor.62 The principal additional step required to produce black and crystalline low melt PSF is that the dye used to produce the black low melt PSF, or the chemical addictive used to produce the crystalline low melt PSF), are added to the polymer before the fiber extrusion. 63 Because of the additional materials required to produce black and crystalline low melt PSF, U.S. producers of low melt PSF either use dedicated production lines for these different forms or produce them in alternate small batches.64 Standard low melt PSF cannot be produced simultaneously with black or crystalline low melt PSF on the same shared equipment.65
After extrusion, the semi‐solid fibers are air cooled to form solid fibers. The solid fiber is coated for the first time with an oil finish, usually only for internal use to facilitate further processing. The spun tow,66 is collected into a can to be stretched. The spun tow is sent over a creel and a series of “draw wheels” in order to orient the fiber molecules and strengthen the tow. Next, the tow is sent through a crimping machine, which gives the fiber tow a two‐dimensional, saw‐tooth shape. The tow is then sent through an oven to heat‐set the crimp. A second finish (usually silicone or some type of oil‐based finish) may be added during this stage of the process, either before the tow is crimped and heat‐set or directly after, depending on the manufacturer’s preference. Finally, the fiber tow is cut to length, baled, and shipped to the end users or customers. 67 For low melt PSF, the bales are not compressed as much as for other
61 Petitioner Nan Ya, postconference brief, p. 6 and representative of the American Fiber Manufacturers Association, email message to USITC staff, July 24, 2017.
62 Representative of the American Fiber Manufacturers Association, email message to USITC staff, July 24, 2017.
63 Representative of the American Fiber Manufacturers Association, email message to USITC staff, July 24, 2017.
64 Representative of the American Fiber Manufacturers Association, email message to USITC staff, July 26, 2017 and conference transcript, pp. 89‐90.
65 Conference transcript, p. 94 (Fee). 66 “Tow is a large strand of continuous manufactured fiber filaments without definite twist, collected
in loose, rope‐like form, usually held together by crimp. Tow is the form that most manufactured fiber reaches before being cut into staple.” Hoeschst Celanese. Dictionary of Fiber & Textile Technology, “Tow,” 1990, p. 165.
67 Certain Polyester Staple Fiber from Korea and Taiwan, Invs. Nos. 731‐TA‐825 and 826 (Final), USITC Publication 3300, May 2000, pp. I‐3‐I‐9, and Certain Polyester Staple Fiber from Korea and Taiwan, Invs. Nos. 731‐, USITC Publication 3843, March 2006, pp. I‐12‐I‐19, Certain Polyester Staple Fiber from Korea and Taiwan, Invs. Nos. 731‐TA‐825 and 826 (Review), USITC Publication 3843, March 2006, p. I‐16. Staff field trip report, Wellman, November 4, 2005, and representative of the American Fibers Manufacturers Association, email message to USITC staff, July 27, 2017.

I‐12
staple fibers to avoid damaging the fibers. 68 Therefore, the bales weigh less—about 120 pounds versus as much as 400 pounds for non‐low melt PSF.69
DOMESTIC LIKE PRODUCT ISSUES
Petitioners contend that the Commission should define the domestic like product as all low melt PSF, separate from other polyester staple fiber, and co‐extensive with the scope of these investigations.70 Further, they argue that black low melt PSF and crystalline low melt PSF are not separate like products based on the Commission’s six factor like product analysis.71 Respondent Milliken & Company (“Milliken”) argues that the Commission should find black and other dyed low melt PSF as separate like products.72 Respondents Fibertex Corporation (“Fibertex”), Consolidated Fibers, Inc. (“Consolidated Fibers”), BIT and Stein Fibers agree with respondent Milliken’s argument that black low melt PSF is a separate like product and additionally assert that crystalline low melt PSF also should be considered a separate domestic like product.73
68 Representative of the American Fibers Manufacturers Association, email message to USITC staff, July 27, 2017.
69 Representative of the American Fibers Manufacturers Association, email message to USITC staff, July 27, 2017.
70 Petition, pp. 13‐15. 71 Petitioner’s postconference brief, pp. 8‐11. 72 Respondent Milliken’s postconference brief, pp. 2‐5. 73 Respondents’ Fibertex, Consolidated Fibers, BIT and Stein Fibers postconference brief, pp. 4‐9.

II-1
PART II: CONDITIONS OF COMPETITION IN THE U.S. MARKET
U.S. MARKET CHARACTERISTICS
Low melt PSF is used in a range of consumer and industrial nonwoven products including antibacterial wipes and diapers, insulation, soundproofing, batting, and furniture. Low melt PSF also is commonly used in the automotive industry for padding and insulation in the trunks of cars, engine hoods, car floors, and the headliners.1
Apparent U.S. consumption of low melt PSF increased from 2014 to 2016. Overall, apparent U.S. consumption in 2016 was *** percent higher than in 2014.
CHANNELS OF DISTRIBUTION
U.S. producers sold mostly to distributors, with the remaining share to end users, while importers sold almost entirely to end users (table II-1).2
Table II-1 Low melt PSF: U.S. producers’ and importers’ U.S. commercial shipments, by sources and channels of distribution, 2014-16, January to March 2016, and January to March 2017
* * * * * * *
GEOGRAPHIC DISTRIBUTION
U.S. producers reported selling low melt PSF to all regions in the contiguous United States (table II-2). Importers reported selling to all regions of the United States. For U.S. producers, *** percent of sales were within 100 miles of their production facility, *** percent were between 101 and 1,000 miles, and *** percent were over 1,000 miles. Importers sold 56.7 percent within 100 miles of their U.S. point of shipment, 39.3 percent between 101 and 1,000 miles, and 4.1 percent over 1,000 miles.
1 Petition, p. 7. 2 Eleven of 23 importers imported low melt PSF for internal consumption/company transfers and did
not report any U.S. commercial shipments. Imports of low melt PSF from Korea for internal consumption increased from 2014 to 2016. Imports of low melt PSF from Korea for internal consumption accounted for 11.5 percent, by quantity, of total imports from Korea in 2016. Imports of low melt PSF from Taiwan for internal consumption decreased from 11.8 percent in 2014 to 9.7 percent in 2016 and increased from 10.1 percent in interim 2016 to 11.2 percent in interim 2017.

II-2
Table II-2 Low melt PSF: Geographic market areas in the United States served by U.S. producers and importers
Region U.S. producers Importers
Northeast 2 6
Midwest 2 7
Southeast 2 8
Central Southwest 1 6
Mountain 1 5
Pacific Coast 1 5
Other1 0 1
All regions (except Other) 1 4
Reporting firms 2 10 1 All other U.S. markets, including AK, HI, PR, and VI.
Source: Compiled from data submitted in response to Commission questionnaires.
SUPPLY AND DEMAND CONSIDERATIONS
U.S. supply
Domestic production
Based on available information, U.S. producers of low melt PSF have the ability to respond to changes in demand with large changes in the quantity of shipments of U.S.-produced low melt PSF to the U.S. market. The main contributing factors to this degree of responsiveness of supply are a substantial amount of unused capacity, along with the ability to shift some shipments from alternate markets. Factors mitigating responsiveness of supply include the limited ability to shift production to or from alternate products.
Industry capacity
Domestic capacity utilization decreased from *** percent in 2014 to *** percent in 2016; domestic capacity utilization increased from *** percent in interim 2016 to *** percent in interim 2017. The decline in capacity utilization was a result of declining production, as capacity remained stable during the period. This relatively low level of capacity utilization suggests that U.S. producers may have a substantial ability to increase production of low melt PSF in response to an increase in prices.
Alternative markets
U.S. producers’ exports, as a percentage of total shipments, increased from *** percent in 2014 to *** percent in 2016, and were *** percent in January-March 2016 and *** percent in January-March 2017. This level of exports indicates that U.S. producers may have some ability to shift shipments between the U.S. market and other markets in response to price changes. The primary export markets listed by U.S. producers were ***.

II-3
Inventory levels
U.S. producers’ inventories declined during the period. As a ratio to total shipments, U.S. producers’ inventories decreased from *** percent in 2014 to *** percent in 2016. These inventory levels suggest that U.S. producers may have limited ability to respond to changes in demand with changes in the quantity shipped from inventories.
Production alternatives
*** responding U.S. producers stated that *** could produce different types of low melt PSF on the same type of equipment.3 However, U.S. producers reported that other PSF products, such as coarse or fine denier PSF, cannot be produced on the same production lines as low melt PSF.4
Subject imports from Korea
No foreign producers from Korea responded to the Commission’s questionnaires. The United States is the largest export market for low melt PSF from Korea, accounting for 18.4 percent of total Korean exports in 2016.5
Subject imports from Taiwan6
Based on available information, the producer of low melt PSF from Taiwan, Far Eastern New Century Corporation (“FENC”) has the ability to respond to changes in demand with moderate changes in the quantity of shipments of low melt PSF to the U.S. market. The main contributing factors to this degree of responsiveness of supply are some unused capacity, the ability to shift shipments from alternate markets and some ability to shift production to or from alternate products; factors mitigating responsiveness of supply include limited inventories.
Industry capacity
FENC’s capacity utilization decreased from *** percent in 2014 to *** percent in 2016, and was *** percent in interim 2016 compared to *** percent in interim 2017. The decline in capacity utilization was a result of declining production, as capacity remained stable during the period. This moderately high level of capacity utilization suggests that the Taiwan producer may
3 The petitioner also specifically noted that black and crystalline low melt PSF, can be produced on
the same production line. Conference transcript, p.30 (Ringel). 4 Petitioners’ postconference brief, p. 7. 5 Official exports statistics under HS subheading 5503.20 as reported by Korea Customs and Trade Development Institution in the IHS/GTA database, accessed July 13, 2017. 6 For data on the number of responding foreign firms and their share of U.S. imports from Taiwan,
please refer to Part I, “Summary Data and Data Sources.”

II-4
have a moderate ability to increase production of low melt PSF in response to an increase in prices.
Alternative markets
Taiwan shipments to markets other than the United States, as a percentage of total shipments, decreased from *** percent in 2014 to *** percent in 2016. FENC’s home market shipments increased from *** percent in 2014 to *** percent in 2016. This level of exports indicates that FENC may have some ability to shift shipments between the U.S. market and other markets in response to price changes.
Inventory levels
FENC’s inventories declined during the period. Inventory levels, as a ratio to total shipments, decreased from *** percent in 2014 to *** percent in 2016. These inventory levels suggest that the FENC may have limited ability to respond to changes in demand with changes in the quantity shipped from inventories.
Production alternatives
***. It reported that it can produce ***. ***.
Supply constraints
*** U.S. producers and the *** responding foreign producer reported no supply constraints since January 2014.
Nonsubject imports
Nonsubject imports accounted for 1.8 percent of total U.S. imports, by quantity, in 2016. The only sources of nonsubject imports reported by U.S. importers were China and Japan. Combined, these countries accounted for 78.6 percent of the reported nonsubject imports from January 2014 to March 2017.
U.S. demand
Based on available information, the overall demand for low melt PSF is likely to experience moderate changes in response to changes in price. The main contributing factors are the limited range of substitute products and the moderate cost share of low melt PSF in most of its end-use products.
End uses and cost share
U.S. demand for low melt PSF depends on the demand for U.S.-produced downstream products. Reported end uses include antibacterial wipes and diapers, soundproofing, batting,

II-5
furniture, padding and insulation in the trunks of cars and in engine hoods, car floors, and the headliners of cars.
Low melt PSF accounts for a moderate share of the cost of the end-use products in which it is used. Reported cost shares for some end uses were as follows:
20 to 30 percent in general non-woven fabrics
10 to 20 percent in bedding applications
18 to 20 percent in furniture
18 to 50 percent in general automotive end uses
20 to 30 percent in high loft batting
Business cycles
*** responding U.S. producers and three of the responding 20 importers indicated that the market for low melt PSF was subject to business cycles or distinctive conditions of competition. Specifically, U.S. producer *** reported that the demand for low melt PSF depends heavily on the production of automobiles. One importer, ***, reported that the demand for low melt PSF increases during the late fall through early spring due to tax refunds being issued to consumers and increased outdoor furniture purchases. Another importer reported that demand spikes around national holidays in the United States that involve major sales events in the bedding industry, such as President’s Day, Memorial Day, July 4th, and Labor Day.
Demand trends
*** U.S. producers and 12 of 22 importers reported an increase in U.S. demand for low melt PSF since January 1, 2014 (table II-3). Four importers reported that increased U.S. demand was in part driven by increased use in automotive applications.
Table II-3 Low melt PSF: Firms’ responses regarding U.S. demand and demand outside the United States
Item Increase No change Decrease Fluctuate
Demand in the United States
U.S. producers *** 0 0 0
Importers 12 5 2 3
Demand outside the United States
U.S. producers 1 0 0 0
Importers 11 4 0 1
Source: Compiled from data submitted in response to Commission questionnaires.
Substitute products
Substitutes for low melt PSF are limited. *** U.S. producers and 18 of 22 responding importers reported that there were no substitutes. However, four importers identified substitutes, including bicomponent fiber made from polyethylene and polyethylene terephthalate, polypropylene, as well as powder and spray bonding instead of bonding using low melt PSF.

II-6
SUBSTITUTABILITY ISSUES
The degree of substitution between domestic and imported low melt PSF depends upon such factors as relative prices, quality (e.g., grade standards, reliability of supply, defect rates, etc.), and conditions of sale (e.g., price discounts/rebates, lead times between order and delivery dates, payment terms, product services, etc.). Based on available data, staff believes that there is a moderate degree of substitutability between domestically produced low melt PSF and low melt PSF imported from subject sources.
Lead times
Low melt PSF is primarily sold from inventory. U.S. producers reported that *** percent of their commercial shipments in 2016 came from inventories, with lead times averaging *** days. The remaining *** percent of their commercial shipments were produced-to-order, with lead times averaging *** days. Importers reported that 80.4 percent of their commercial shipments of imported low melt PSF from Korea and Taiwan came from their U.S. inventories, with an average lead time of 2 days. Importers reported that 11.3 percent of their commercial shipments were shipped from foreign inventories, with an average lead time of 62 days. The remaining 8.3 percent of importers’ commercial shipments were produced-to-order, with an average lead time of 57 days.
Factors affecting purchasing decisions
Purchasers responding to lost sales lost revenue allegations7 were asked to identify the main purchasing factors their firm considered in their purchasing decisions for low melt PSF. The major purchasing factors identified by firms included price, quality, and availability. Six of eight purchasers listed price as a major factor in their purchase decision. Six of eight purchasers also listed quality as a major factor, and four of eight purchasers listed availability as one of their three main purchasing factors. Two purchasers also reported that the availability of black low melt PSF was a major purchasing factor and one purchaser reported the availability of crystalline low melt PSF as a major factor. Two of eight purchasers reported the unavailability of domestically produced black low melt PSF, instead of price, was a primary reason for purchasing subject imports rather than domestically produced low melt PSF.
Comparison of U.S.-produced and imported low melt PSF
In order to determine whether U.S.-produced low melt PSF can generally be used in the same applications as imports from Korea and Taiwan, U.S. producers and importers were asked whether the products can always, frequently, sometimes, or never be used interchangeably. As shown in table II-4, *** U.S. producers reported that low melt PSF can always be used
7 This information is compiled from responses by purchasers identified by the petitioner or other U.S.
producers to the lost sales lost revenue allegations. See Part V for additional information.

II-7
interchangeably, regardless of the source country. Only one of 15 importers reported the U.S. product was always interchangeable with low melt PSF from Korea, and the same importer was the only one of 12 responding importers to report the U.S. product was always interchangeable with low melt PSF from Taiwan. The majority of importers reported that U.S. product was either sometimes or never interchangeable with low melt PSF from both Korea and Taiwan. Three importers reported the unavailability of U.S.-produced black low melt PSF as a reason for the domestic product being sometimes or never interchangeable with either Korea or Taiwan product.8 9Another reason cited was quality. For instance, importer *** reported that low melt PSF from Korea always runs on their production lines, whereas U.S.-produced low melt PSF sometimes does not. Several importers also cited how easily customers can process the product as a reason for the products being sometimes or never interchangeable. Table II-4 Low melt PSF: Interchangeability between low melt PSF produced in the United States and in other countries, by country pairs
Country pair Number of U.S. producers
reporting Number of U.S. importers
reporting
A F S N A F S N
U.S. vs. subject countries:
U.S. vs. Korea *** *** *** *** 1 4 8 2
U.S. vs. Taiwan *** *** *** *** 1 3 7 2
Subject countries comparisons:
Korea vs. Taiwan *** *** *** *** 1 4 4 4
Nonsubject countries comparisons:
U.S. vs. nonsubject *** *** *** *** 1 2 5 2
Korea vs. nonsubject *** *** *** *** 1 2 4 3
Taiwan vs. nonsubject *** *** *** *** 1 2 5 1
Note.—A=Always, F=Frequently, S=Sometimes, N=Never. Source: Compiled from data submitted in response to Commission questionnaires.
In addition, U.S. producers and importers were asked to assess how often differences
other than price were significant in sales of low melt PSF from the United States, subject, or nonsubject countries. As seen in table II-5, *** U.S. producers reported that factors other than the price were never important factors in their sales decisions. A plurality of importers reported that factors other than price were always or frequently a factor in their firms’ sales decisions.
8 Respondents contend that black low melt PSF is not interchangeable with white low melt PSF.
Respondents argue that the addition of a pigment dye results in different end-uses based on their color, and therefore, the two products are not substitutable with one another. Respondent *** postconference brief, p. 7. The petitioner contends that for end-uses were the low melt PSF is not visible all color variations of low melt PSF are interchangeable. Petitioner’s postconference brief, p. 9.
9 The petitioner estimated that the black and crystalline low melt PSF account for 10 percent and 4 percent of the U.S. low melt market, respectively. Petitioner’s postconference brief, p. 16.

II-8
Differences other than price cited by importers include quality, how well the product can be processed through the machines of customers, and the unavailability of black low melt PSF from U.S. producers.
Table II-5 Low melt PSF: Significance of differences other than price between low melt PSF produced in the United States and in other countries, by country pairs
Country pair Number of U.S. producers
reporting Number of U.S. importers
reporting
A F S N A F S N
U.S. vs. subject countries:
U.S. vs. Korea *** *** *** *** 4 4 4 0
U.S. vs. Taiwan *** *** *** *** 5 3 3 0
Subject countries comparisons:
Taiwan vs. Korea *** *** *** *** 3 2 2 3
Nonsubject countries comparisons:
U.S. vs. nonsubject *** *** *** *** 4 2 1 0
Korea vs. nonsubject *** *** *** *** 4 2 1 0
Taiwan vs. nonsubject *** *** *** *** 3 2 1 0
Note.--A = Always, F = Frequently, S = Sometimes, N = Never. Source: Compiled from data submitted in response to Commission questionnaires.

III‐1
PART III: U.S. PRODUCERS’ PRODUCTION, SHIPMENTS, AND EMPLOYMENT
The Commission analyzes a number of factors in making injury determinations (see 19 U.S.C. §§ 1677(7)(B) and 1677(7)(C)). Information on the dumping margins was presented in Part I of this report and information on the volume and pricing of imports of the subject merchandise is presented in Part IV and Part V. Information on the other factors specified is presented in this section and/or Part VI and (except as noted) is based on the questionnaire responses of two firms that accounted for the all U.S. production of low melt PSF during 2016.
U.S. PRODUCERS
The Commission issued a U.S. producer questionnaire to two firms based on information
contained in the petition. Both firms provided usable data on their productive operations. Staff believes that these responses represent all U.S. production of low melt PSF.
Table III‐1 lists U.S. producers of low melt PSF, their production locations, positions on the petition, and shares of total production in 2016.
Table III-1 Low melt PSF: U.S. producers of low melt PSF, their positions on the petition, production locations, and shares of reported production, 2016
Firm Position on petition Production location(s) Share of production
(percent) FIT Fibers *** Johnson City, TN ***Nan Ya Support Lake City, SC ***
Total ***1 Fiber Innovation Technology, Inc. (“FIT Fibers”) is ***. 2 Nan Ya Plastics Corporation, America (“Nan Ya America”) is ***. Source: Compiled from data submitted in response to Commission questionnaires.
Table III‐2 presents information on U.S. producers’ ownership, related and/or affiliated firms, and their share of total production of low melt PSF.
Table III-2 Low melt PSF: U.S. producers' ownership, related and/or affiliated firms
* * * * * * *
As indicated in table III‐2, U.S. producer *** is related to a foreign producer of the
subject merchandise. Nan Ya is wholly owned by Nan Ya Plastics Corporation, ***. No U.S. producers are related to U.S. importers of the subject merchandise.

III‐2
FIT Fibers
FIT Fibers, a wholly owned subsidiary of The Cha Technologies Group, is a producer of low melt PSF, black low melt polyester staple fiber, and crystalline polyester staple fiber headquartered in Johnson City, Tennessee. FIT Fibers operates a research and development facility on‐site and maintains a large number of patents that it utilizes to jointly develop products with customers.1 The Johnson City facility was constructed and became operational in 1997.
The Cha Technologies Group, headquartered in Nyon, Switzerland, is a division of The Cha Group, a multinational corporation with a diversified business portfolio that includes property, technology, financial services and healthcare.2 The Cha Technologies Group is composed of 7 companies and operates businesses in fibers, yarns, nonwovens and filter manufacturing.3
Nan Ya America
Nan Ya America, a wholly owned subsidiary of Nan Ya Plastics Corporation, is a producer of low melt PSF headquartered in Livingston, New Jersey. Nan Ya America operates three business units in the United States (1) flexible PVC films (Batchelor, Louisiana), (2) polyester fiber (Lake City, South Carolina), and (3) ethylene glycol production (Point Comfort, Texas).4 Established in 1990, Nan Ya America’s Lake City, South Carolina plant is the firm’s largest U.S. production site5 and began production of low melt PSF in 2008.6 In addition to low melt PSF, this site produces polyester chip (resin) for textile and bottle/sheet industries, other polyester staple fiber, and polyester continuous filament yarns through a fully automated and continuous production lines process.7 The firm estimates that this site produces 2 billion pounds of polyester polymer per year.8 Nan Ya Plastics Corporation, which is headquartered in Taipei, Taiwan, focuses on the production of petrochemical products, polyester products and electronics. In 2015, Nan Ya
1 Fiber Innovation Technology webpage, http://www.fitfibers.com/, July 24, 2017. 2 The Cha Technologies Group webpage, http://www.chatechnologies.com/who‐we‐are/the‐cha‐
group/, accessed July 24, 2017. 3 The Cha Technologies Group webpage, http://www.chatechnologies.com/who‐we‐are/group‐
structure/, July 24, 2017. 4 Nan Ya Plastics Corporation, America webpage, http://www.npcam.com/nno1.htm, accessed July
24, 2017. 5 Nan Ya Plastics Corporation, America webpage, http://www.npcam.com/nj‐sc/AAAAA‐01.htm,
accessed July 24, 2017. 6 Conference transcript, p. 19 (Sparkman). 7 Nan Ya Plastics Corporation, America webpage, http://www.npcam.com/nj‐sc/AAAAA‐01.htm,
accessed July 24, 2017. 8 Nan Ya Plastics Corporation, America webpage, http://www.npcam.com/nj‐sc/AAAAA‐01.htm,
accessed July 24, 2017.

III‐3
reported annual operating revenue of $9,066 million.9 The firm manufactures polyester products at plants located throughout Taiwan, the United States, Vietnam and mainland China.10
Producers were asked to report any changes in operations such as plant openings, plant closings, relocations, expansions, acquisitions, consolidations, prolonged shutdowns or production curtailments since January 1, 2014. Such changes are presented in table III‐3.
Table III-3 Low melt PSF: U.S. producers’ reported changes in operations, since January 1, 2014
* * * * * * *
U.S. PRODUCTION, CAPACITY, AND CAPACITY UTILIZATION
Table III‐4 and figure III‐1 present U.S. producers’ production, capacity, and capacity
utilization. Total annual capacity to produce low melt PSF in the United States remained unchanged from 2014 to 2016. Total U.S. production of low melt PSF decreased by *** percent from 2014 to 2016, but was *** percent higher in January to March 2017 relative to January to March 2016. U.S. producers’ capacity utilization rate for low melt PSF decreased by *** percentage points from 2014 to 2015, remained unchanged from 2015 to 2016, but was *** percentage points higher in January to March 2017 relative to January to March 2016.
Table III-4 Low melt PSF: U.S. producers' capacity, production, and capacity utilization, 2014-16, January to March 2016, and January to March 2017
* * * * * * * Figure III-1 Low melt PSF: U.S. producers' capacity, production, and capacity utilization, 2014-16, January to March 2016, and January to March 2017
* * * * * * *
U.S. producers’ production is calculated ***.11 Petitioner Nan Ya testified that efficient low melt PSF production requires a continuous high volume production to maintain
9 Nan Ya Plastics webpage, http://www.npc.com.tw/j2npc/enus/company_highlights.jsp, accessed July 24, 2017.
10 Nan Ya Plastics webpage, http://www.npc.com.tw/j2npc/enus/company_highlights.jsp, accessed July 24, 2017.
11 Nan Ya’s producer questionnaire response, section II‐7. FIT Fibers’ producer questionnaire response, section II‐7.

III‐4
efficiencies.12 Furthermore, maintaining a high level of capacity utilization is essential because stopping and restarting production is inefficient and raises production costs.13 Additionally, Petitioner Nan Ya asserted that it could make adjustments to double its capacity with existing equipment should pricing make it commercially justifiable.14
The Commission asked producers to report constraints on capacity to produce low melt PSF. FIT Fibers stated that the ***15 are constraints while Nan Ya reported that ***16 limits production. FIT Fibers reported that it ***17 while Nan Ya reported that its firm ***.18 However, Nan Ya testified their facility operates a secondary line that produces conjugate which could be switched to low melt production, and would require the manufacture of new spinnerets, which could take four to six weeks.19
Alternative products
*** firm reported producing products other than low melt PSF on the same equipment and machinery used to make low melt PSF. As shown in table III‐5, low melt PSF accounted for between *** percent of U.S. producers’ production on this shared equipment from 2014 to 2016. ***.
Table III-5 Low melt PSF: U.S. producers' overall capacity and production on the same equipment as subject production, 2014-16, January to March 2016, and January to March 2017
* * * * * * *
U.S. PRODUCERS’ U.S. SHIPMENTS AND EXPORTS
Table III‐6 presents U.S. producers’ U.S. shipments, export shipments, and total shipments.
Table III-6 Low melt PSF: U.S. producers' U.S. shipments, export shipments, and total shipments, 2014-16, January to March 2016, and January to March 2017
* * * * * * *
12 Conference transcript, p. 22 (Sparkman). 13 Conference transcript, p. 22 (Sparkman). 14 Conference transcript, p. 22 (Sparkman). 15 FIT Fibers producer questionnaire response, section II‐3d. 16 Nan Ya producer questionnaire response, section II‐3. 17 FIT Fibers producer questionnaire response, section II‐3f. 18 Nan Ya producer questionnaire response, section II‐3d. 19 Conference transcript, pp. 65‐66 (Sparkman).

III‐5
U.S. producers’ ship *** of their low melt PSF domestically, with U.S. shipments accounting for *** percent, *** percent, and *** percent of total shipments in 2014, 2015 and 2016 respectively. The quantity of total shipments decreased by *** percent from 2014 to 2016 and was *** percent lower in January to March 2017 relative to January to March 2016. The value of total shipments also decreased *** percent from 2014 to 2016, but was *** percent higher in January to March 2017 relative to January to March 2016.
U.S. producers’ U.S. commercial shipments decreased by *** percent from 2014 to 2016 and were *** percent lower in January to March 2017 relative to January to March 2016. The value of U.S. commercial shipments decreased by *** percent from 2014 to 2016 and was *** percent higher in January to March 2017 relative to January to March 2016. The unit value of U.S. producers’ U.S. commercial shipments decreased *** percent from 2014 to 2016 and was *** percent higher in January to March 2017 relative to January to March 2016.20
*** *** reported exporting shipments to low melt PSF to ***. *** export shipments increased by *** percent from 2014 to 2016 by quantity, while the value decreased by *** percent over the same period. In the interim period, *** export shipments were *** percent lower in January to March 2017 relative to January to March 2016 by quantity and *** percent lower by value in January to March 2017 relative to January to March 2016.
U.S. PRODUCERS’ INVENTORIES
Table III‐7 presents U.S. producers’ end‐of‐period inventories and the ratio of these
inventories to U.S. producers’ production, U.S. shipments, and total shipments. U.S. producers’ inventories of low melt PSF decreased by *** percent from 2014 to 2016 and were *** percent lower in January to March 2017 relative to January to March 2016. The ratio of inventories to production, inventories to U.S. shipments, and inventories to total shipments each decreased from 2014 to 2016, by ***, *** and *** percentage points respectively. Additionally, the ratio of inventories to production, inventories to U.S. shipments, and inventories to total shipments were all lower in January to March 2017 relative to January to March 2016.
Table III-7 Low melt PSF: U.S. producers' inventories, 2014-16, January to March 2016, and January to March 2017
* * * * * * *
U.S. PRODUCERS’ IMPORTS AND PURCHASES
No U.S. producer reported imports or purchases of low melt PSF during the period for
which data were collected.
20 *** *** email message to USITC staff, July 17, 2017.

III‐6
U.S. EMPLOYMENT, WAGES, AND PRODUCTIVITY
Table III‐8 shows U.S. producers’ employment‐related data. The level of production related workers (PRWs), their hours worked and wages all decreased from 2014 to 2016. PRWs decreased by *** percent from 2014 to 2015, increased slightly by *** percent from 2015 to 2016, and was *** percent higher in January to March 2017 relative to January to March 2016. Total hours worked decreased *** percent from 2014 to 2015, then decreased *** percent from 2015 to 2016, but was *** percent higher in January to March 2017 relative to January to March 2016. Wages paid decreased *** percent from 2014 to 2015, then increased by *** percent from 2015 to 2016, and was *** percent higher in January to March 2017 relative to January to March 2016. Hourly wages increased *** percent from 2014 to 2015, then increased by *** percent from 2015 to 2016, but were *** percent lower in January to March 2017 relative to January to March 2016. Productivity decreased from *** pounds per hour in 2014, to *** pounds per hour in 2015, then increased to *** pounds per hour in 2016 and was *** percent higher in January to March 2017 relative to January to March 2016.
Table III-8 Low melt PSF: U.S. producers' employment related data, 2014-16, January to March 2016, and January to March 2017
* * * * * * *

IV‐1
PART IV: U.S. IMPORTS, APPARENT U.S. CONSUMPTION, AND MARKET SHARES
U.S. IMPORTERS The Commission issued importer questionnaires to 41 firms believed to be importers of
subject low melt PSF, as well as to all U.S. producers of low melt PSF.1 Usable questionnaire responses were received from 23 companies, representing the vast majority of total U.S. imports and *** percent of total subject imports during.
Firms responding to the Commission’s questionnaire accounted for the following estimated shares of each subject country’s imports during 2016.
*** percent of subject imports from Korea;
*** percent of subject imports from Taiwan
Table IV‐1 lists all responding U.S. importers of low melt PSF from Korea and Taiwan, and nonsubject sources, their locations, and their shares of U.S. imports in 2016.
1 The Commission issued questionnaires to those firms identified in the petition, along with firms that, based on a review of data provided by U.S. Customs and Border Protection (“Customs”), may have accounted for more than one percent of total imports under HTS subheading 5503.20.0015 in January 2014 to April 2017.

IV‐2
Table IV-1 Low melt PSF: U.S. importers by source, 2016
Firm Headquarters
Share of imports by source (percent)
Korea Taiwan Subject sources
All other sources
All import sources
3M St. Paul, MN *** *** *** *** ***
American Outdoor Living Rancho Cucamonga, CA *** *** *** *** ***
Ann's Trading Vernon, CA *** *** *** *** ***Bernet International Los Angeles, CA *** *** *** *** ***Consolidated Fibers Charlotte, NC *** *** *** *** ***Custom Nonwoven New Albany, MS *** *** *** *** ***Fibertex Teaneck, NJ *** *** *** *** ***Goetz Dallas, TX *** *** *** *** ***HSM Hickory, NC *** *** *** *** ***Janesville Acoustics1 Southfield, MI *** *** *** *** ***Kilop High Point, NC *** *** *** *** ***Milliken Spartanburg, SC *** *** *** *** ***NC Works2 Franklin, OH *** *** *** *** ***Piana3 Cartersville, GA *** *** *** *** ***Poole Company Greenville, SC *** *** *** *** ***Precision Custom Coatings Totowa, NJ *** *** *** *** ***RSM Charlotte, NC *** *** *** *** ***Shalag US, Inc.4 Oxford, NC *** *** *** *** ***Spuntech5 Roxboro, NC *** *** *** *** ***Stein Fibers Albany, NY *** *** *** *** ***Tenowo Inc. Lincolnton, NC *** *** *** *** ***William Barnet & Son6 Spartanburg, SC *** *** *** *** ***Wm. T. Burnett & Co. Statesville, NC *** *** *** *** ***
Total *** *** *** *** ***1 Janesville Acoustics is ***. *** 2 NC Works is ***. 3 Piana is ***. 4 Shalag US, Inc. is ***. 5 Spuntech Industries, Inc. is ***. *** 6 William Barnet & Son is related to importer/exporter *** which is a subsidiary. Note.--Shares and ratios shown as "0.0" percent represent values greater than zero but less than "0.05" percent. Source: Compiled from data submitted in response to Commission questionnaires.

IV‐3
U.S. IMPORTS
Table IV‐2 and figure IV‐1 present data for U.S. imports of low melt PSF from Korea, Taiwan and all other sources. From 2014 to 2016, total U.S. imports increased by 30.5 percent by quantity, but decreased by 9.7 percent by value. Subject imports, which exceeded those from nonsubject sources in each period for which data were collected, increased by 31.5 percent by quantity, but decreased 9.4 percent by value. The increase in subject imports was driven by an increase in imports from Korea, which accounted for 67.9 percent of the total increase of subject imports during 2014 to 2016. Nonsubject imports decreased by 8.9 percent by quantity and 20.3 percent by value. Average unit values of subject and nonsubject sources fell during 2014 to 2016, 31.1 percent and 12.5 percent respectively.

IV‐4
Table IV-2 Low melt PSF: U.S. imports, by source, 2014-16, January to March 2016, and January to March 2017
Item Calendar year January to March
2014 2015 2016 2016 2017 Quantity (1,000 pounds) U.S. imports from.-- Korea 106,685 120,703 139,081 33,640 34,901
Taiwan 44,751 50,115 60,059 13,775 15,519 Subject sources 151,436 170,818 199,141 47,415 50,420 Nonsubject sources 3,940 5,534 3,589 1,250 1,150
All import sources 155,376 176,352 202,729 48,666 51,571 Value (1,000 dollars)U.S. imports from.-- Korea 91,162 83,707 83,259 20,173 21,300
Taiwan 34,965 32,304 30,981 7,105 8,535 Subject sources 126,128 116,011 114,240 27,278 29,835 Nonsubject sources 3,547 4,245 2,827 852 847
All import sources 129,675 120,256 117,067 28,130 30,681 Unit value (dollars per pound) U.S. imports from.-- Korea 0.85 0.69 0.60 0.60 0.61
Taiwan 0.78 0.64 0.52 0.52 0.55 Subject sources 0.83 0.68 0.57 0.58 0.59 Nonsubject sources 0.90 0.77 0.79 0.68 0.74
All import sources 0.83 0.68 0.58 0.58 0.59 Share of quantity (percent) U.S. imports from.-- Korea 68.7 68.4 68.6 69.1 67.7
Taiwan 28.8 28.4 29.6 28.3 30.1 Subject sources 97.5 96.9 98.2 97.4 97.8 Nonsubject sources 2.5 3.1 1.8 2.6 2.2
All import sources 100.0 100.0 100.0 100.0 100.0 Share of value (percent)
U.S. imports from.-- Korea 70.3 69.6 71.1 71.7 69.4
Taiwan 27.0 26.9 26.5 25.3 27.8 Subject sources 97.3 96.5 97.6 97.0 97.2 Nonsubject sources 2.7 3.5 2.4 3.0 2.8
All import sources 100.0 100.0 100.0 100.0 100.0 Ratio to U.S. production
U.S. imports from.-- Korea *** *** *** *** ***
Taiwan *** *** *** *** ***Subject sources *** *** *** *** ***Nonsubject sources *** *** *** *** ***
All import sources *** *** *** *** ***Source: Official U.S. import statistics for HTS statistical reporting number 5503.20.0015, accessed July 13, 2017.

IV‐5
Figure IV-1 Low melt PSF: U.S. imports, by source, 2014-16, January to March 2016, and January to March 2017
Source: Official U.S. import statistics for HTS statistical reporting number 5503.20.0015, accessed July 13, 2017.
NEGLIGIBILITY
The statute requires that an investigation be terminated without an injury determination if imports of the subject merchandise are found to be negligible.2 Negligible imports are generally defined in the Tariff Act of 1930, as amended, as imports from a country of merchandise corresponding to a domestic like product where such imports account for less than 3 percent of the volume of all such merchandise imported into the United States in the most recent 12‐month period for which data are available that precedes the filing of the petition or the initiation of the investigation. However, if there are imports of such merchandise from a number of countries subject to investigations initiated on the same day that individually account for less than 3 percent of the total volume of the subject merchandise, and if the imports from those countries collectively account for more than 7 percent of the volume of all such merchandise imported into the United States during the applicable 12‐month period, then imports from such countries are deemed not to be negligible.3 Imports from Korea accounted for 67.7 percent and imports from Taiwan accounted for 30.6 percent of total imports of low melt PSF by quantity from June to May 2017. Table IV‐3 presents the individual shares of total imports accounted for by subject countries by quantity during the most recent 12‐month period.
2 Sections 703(a)(1), 705(b)(1), 733(a)(1), and 735(b)(1) of the Act (19 U.S.C. §§ 1671b(a)(1), 1671d(b)(1), 1673b(a)(1), and 1673d(b)(1)).
3 Section 771 (24) of the Act (19 U.S.C § 1677(24)).
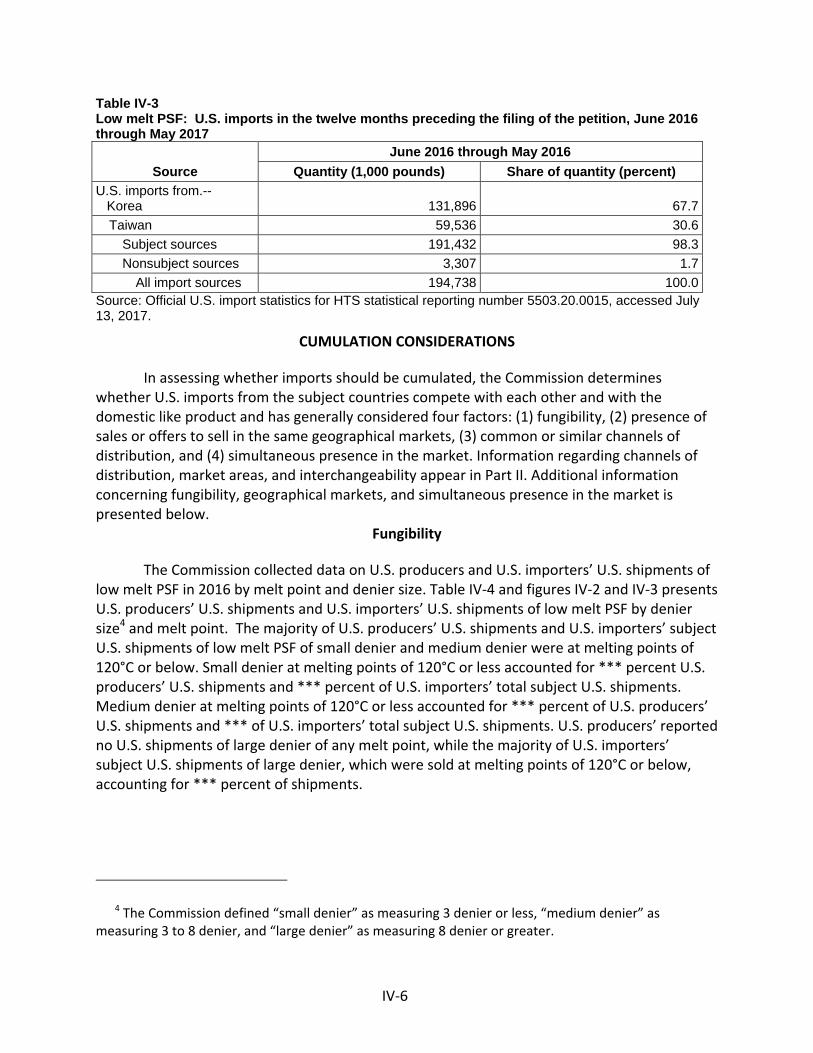
IV‐6
Table IV-3 Low melt PSF: U.S. imports in the twelve months preceding the filing of the petition, June 2016 through May 2017
Source June 2016 through May 2016
Quantity (1,000 pounds) Share of quantity (percent) U.S. imports from.-- Korea 131,896 67.7
Taiwan 59,536 30.6 Subject sources 191,432 98.3 Nonsubject sources 3,307 1.7
All import sources 194,738 100.0 Source: Official U.S. import statistics for HTS statistical reporting number 5503.20.0015, accessed July 13, 2017.
CUMULATION CONSIDERATIONS
In assessing whether imports should be cumulated, the Commission determines whether U.S. imports from the subject countries compete with each other and with the domestic like product and has generally considered four factors: (1) fungibility, (2) presence of sales or offers to sell in the same geographical markets, (3) common or similar channels of distribution, and (4) simultaneous presence in the market. Information regarding channels of distribution, market areas, and interchangeability appear in Part II. Additional information concerning fungibility, geographical markets, and simultaneous presence in the market is presented below.
Fungibility
The Commission collected data on U.S. producers and U.S. importers’ U.S. shipments of low melt PSF in 2016 by melt point and denier size. Table IV‐4 and figures IV‐2 and IV‐3 presents U.S. producers’ U.S. shipments and U.S. importers’ U.S. shipments of low melt PSF by denier size4 and melt point. The majority of U.S. producers’ U.S. shipments and U.S. importers’ subject U.S. shipments of low melt PSF of small denier and medium denier were at melting points of 120°C or below. Small denier at melting points of 120°C or less accounted for *** percent U.S. producers’ U.S. shipments and *** percent of U.S. importers’ total subject U.S. shipments. Medium denier at melting points of 120°C or less accounted for *** percent of U.S. producers’ U.S. shipments and *** of U.S. importers’ total subject U.S. shipments. U.S. producers’ reported no U.S. shipments of large denier of any melt point, while the majority of U.S. importers’ subject U.S. shipments of large denier, which were sold at melting points of 120°C or below, accounting for *** percent of shipments.
4 The Commission defined “small denier” as measuring 3 denier or less, “medium denier” as measuring 3 to 8 denier, and “large denier” as measuring 8 denier or greater.

IV‐7
Table IV-4 Low melt PSF: U.S. producers' and U.S. importers' U.S. shipments, by size and melt point, 2016
Item U.S.
producers
U.S. importers U.S. producers and U.S.
importers combinedKorea Taiwan
Subject sources
Nonsubject sources
All import sources
Quantity (1,000 pounds) U.S. shipments.-- Small denier: Melt point <120 C *** *** *** *** *** *** ***
Small denier: Melt point 120 to 170 C *** *** *** *** *** *** ***Small denier: Melt point >170 C *** *** *** *** *** *** ***
Small denier: All melt pounds *** *** *** *** *** *** ***Medium denier: Melt point <120 C *** *** *** *** *** *** ***Medium denier: Melt point 120 to 170 C *** *** *** *** *** *** ***Medium denier: Melt point >170 C *** *** *** *** *** *** ***
Medium denier: All melt pounds *** *** *** *** *** *** ***Large denier: Melt point <120 C *** *** *** *** *** *** ***Large denier: Melt point 120 to 170 C *** *** *** *** *** *** ***Large denier: Melt point >170 C *** *** *** *** *** *** ***
Large denier: All melt pounds *** *** *** *** *** *** ***All denier: Melt point <120 C *** *** *** 157,729 *** *** ***All denier: Melt point 120 to 170 C *** *** *** 7,097 *** *** ***All denier: Melt point >170 C *** *** *** 18,020 *** *** ***
All denier: All melt points *** *** *** 182,846 *** *** *** Share across (percent)
U.S. shipments.-- Small denier: Melt point <120 C *** *** *** *** *** *** ***
Small denier: Melt point 120 to 170 C *** *** *** *** *** *** ***Small denier: Melt point >170 C *** *** *** *** *** *** ***
Small denier: All melt pounds *** *** *** *** *** *** ***Medium denier: Melt point <120 C *** *** *** *** *** *** ***Medium denier: Melt point 120 to 170 C *** *** *** *** *** *** ***Medium denier: Melt point >170 C *** *** *** *** *** *** ***
Medium denier: All melt pounds *** *** *** *** *** *** ***Large denier: Melt point <120 C *** *** *** *** *** *** ***Large denier: Melt point 120 to 170 C *** *** *** *** *** *** ***Large denier: Melt point >170 C *** *** *** *** *** *** ***
Large denier: All melt pounds *** *** *** *** *** *** ***All denier: Melt point <120 C *** *** *** *** *** *** ***All denier: Melt point 120 to 170 C *** *** *** *** *** *** ***All denier: Melt point >170 C *** *** *** *** *** *** ***
All denier: All melt points *** *** *** *** *** *** ***
Table Continued.

IV‐8
Table IV-4 -- Continued Low melt PSF: U.S. producers' and U.S. importers' U.S. shipments, by size and melt point, 2016
Item U.S.
producers
U.S. importers U.S. producers and U.S.
importers combinedKorea Taiwan
Subject sources
Nonsubject sources
All import sources
Quantity (1,000 pounds) Share down by subtotal (percent) U.S. shipments.-- Small denier: Melt point <120 C *** *** *** *** *** *** ***
Small denier: Melt point 120 to 170 C *** *** *** *** *** *** ***Small denier: Melt point >170 C *** *** *** *** *** *** ***
Small denier: All melt pounds *** *** *** *** *** *** ***
Medium denier: Melt point <120 C *** *** *** *** *** *** ***Medium denier: Melt point 120 to 170 C *** *** *** *** *** *** ***Medium denier: Melt point >170 C *** *** *** *** *** *** ***
Medium denier: All melt pounds *** *** *** *** *** *** ***
Large denier: Melt point <120 C *** *** *** *** *** *** ***Large denier: Melt point 120 to 170 C *** *** *** *** *** *** ***Large denier: Melt point >170 C *** *** *** *** *** *** ***
Large denier: All melt pounds *** *** *** *** *** *** ***
All denier: Melt point <120 C *** *** *** 86.3 *** *** ***All denier: Melt point 120 to 170 C *** *** *** 3.9 *** *** ***All denier: Melt point >170 C *** *** *** 9.9 *** *** ***
All denier: All melt points *** *** *** 100.0 *** *** ***Source: Compiled from data submitted in response to Commission questionnaires.

IV‐9
Figure IV-2 Low melt PSF: U.S. producers' and U.S. importers' U.S. shipments, by denier size, 2016
* * * * * * * Figure IV-3 Low melt PSF: U.S. producers' and U.S. importers' U.S. shipments, by denier size, 2016
* * * * * * *
The Commission also requested data on low melt PSF by type (virgin and non‐virgin).
The majority of U.S. producers and U.S. importers reported U.S. shipments of virgin low melt PSF. While several firms reported that virgin and non‐virgin low melt PSF cannot be used interchangeably due to ***5, most firms reported they had no experience with non‐virgin low melt PSF.6
Presence in the market
Table IV‐5 presents monthly data for U.S. subject and nonsubject imports of low melt PSF between January 2014 and March 2017. Subject U.S. imports of low melt PSF from Korea and Taiwan were present in each month during January 2014‐March 2017. Imports from Korea and Taiwan, respectively, peaked in April 2015 at 16.8 million pounds and May 2016 at 7.3 million pounds. Imports from nonsubject sources peaked at 1.4 million pounds in March 2015.
5 *** importer questionnaire response, section II‐5c. *** importer questionnaire response, section II‐5c.
6 *** importer questionnaire response, section II‐5c.
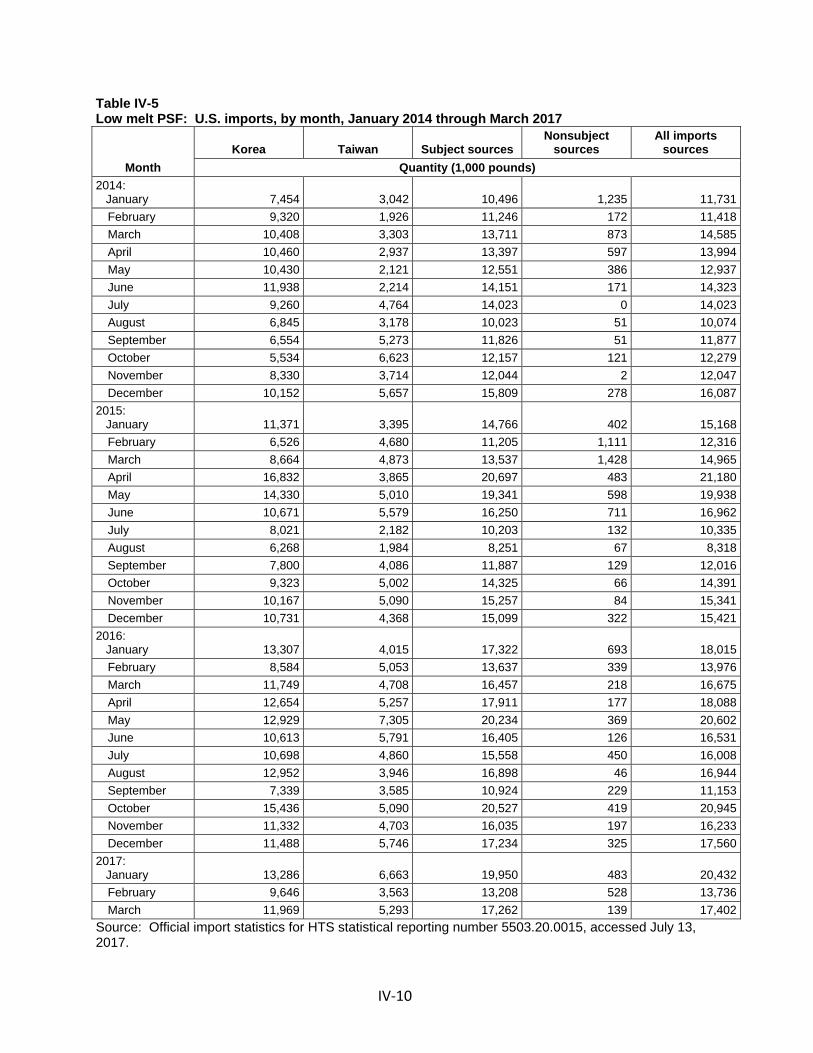
IV‐10
Table IV-5 Low melt PSF: U.S. imports, by month, January 2014 through March 2017
Month Korea Taiwan Subject sources
Nonsubject sources
All imports sources
Quantity (1,000 pounds)2014: January 7,454 3,042 10,496 1,235 11,731
February 9,320 1,926 11,246 172 11,418 March 10,408 3,303 13,711 873 14,585 April 10,460 2,937 13,397 597 13,994 May 10,430 2,121 12,551 386 12,937 June 11,938 2,214 14,151 171 14,323 July 9,260 4,764 14,023 0 14,023 August 6,845 3,178 10,023 51 10,074 September 6,554 5,273 11,826 51 11,877 October 5,534 6,623 12,157 121 12,279 November 8,330 3,714 12,044 2 12,047 December 10,152 5,657 15,809 278 16,087
2015: January 11,371 3,395 14,766 402 15,168
February 6,526 4,680 11,205 1,111 12,316 March 8,664 4,873 13,537 1,428 14,965 April 16,832 3,865 20,697 483 21,180 May 14,330 5,010 19,341 598 19,938 June 10,671 5,579 16,250 711 16,962 July 8,021 2,182 10,203 132 10,335 August 6,268 1,984 8,251 67 8,318 September 7,800 4,086 11,887 129 12,016 October 9,323 5,002 14,325 66 14,391 November 10,167 5,090 15,257 84 15,341 December 10,731 4,368 15,099 322 15,421
2016: January 13,307 4,015 17,322 693 18,015
February 8,584 5,053 13,637 339 13,976 March 11,749 4,708 16,457 218 16,675 April 12,654 5,257 17,911 177 18,088 May 12,929 7,305 20,234 369 20,602 June 10,613 5,791 16,405 126 16,531 July 10,698 4,860 15,558 450 16,008 August 12,952 3,946 16,898 46 16,944 September 7,339 3,585 10,924 229 11,153 October 15,436 5,090 20,527 419 20,945 November 11,332 4,703 16,035 197 16,233 December 11,488 5,746 17,234 325 17,560
2017: January 13,286 6,663 19,950 483 20,432
February 9,646 3,563 13,208 528 13,736 March 11,969 5,293 17,262 139 17,402
Source: Official import statistics for HTS statistical reporting number 5503.20.0015, accessed July 13, 2017.

IV‐11
Figure IV-4 Low melt PSF: Subject U.S. imports, by month, January 2014 through March 2017
Source: Official import statistics for HTS statistical reporting number 5503.20.0015, accessed July 13, 2017.
Geographical markets
According to Commission questionnaire responses, low melt PSF production occurs in the Southern geographic regions of the United States. Low melt PSF is generally shipped nationwide.7 As presented in table IV‐6, U.S. Customs districted located in the East8 accounted for 68.5 percent, the largest share of the imports of low melt PSF from subject countries during 2016, whereas U.S. Customs districts located in the North,9 South,10 and West11 accounted for
7 See part II for additional information on geographic markets. 8 The “East” includes the following Customs entry districts: Baltimore, Maryland; Boston,
Massachusetts; Buffalo, New York; Charleston, South Carolina; Charlotte, North Carolina; New York, New York; Norfolk, Virginia; Ogdensburg, New York; Philadelphia, Pennsylvania; Portland, Maine; San Juan, Puerto Rico; Savannah, Georgia; St. Albans, Vermont; and Washington, District of Columbia.
9 The “North” includes the following Customs entry districts: Chicago, Illinois; Cleveland, Ohio; Detroit, Michigan; Duluth, Minnesota; Great Falls, Montana; Milwaukee, Wisconsin; Minneapolis, Minnesota; and Pembina, North Dakota.
10 The “South” includes the following Customs entry districts: Dallas‐Fort Worth, Texas; El Paso, Texas; Houston‐Galveston, Texas; Laredo, Texas; Miami, Florida; Mobile, Alabama; New Orleans, Louisiana; and Tampa, Florida.
11 The “West” includes the following Customs entry districts: Columbia‐Snake, Oregon; Honolulu, (continued...)

IV‐12
smaller shares (8.6 percent, 6.9 percent, and 16.0 percent of imports from subject countries, respectively).
Table IV-6 Low melt PSF: U.S. imports, by border of entry, 2016
East North South West Total
Quantity (1,000 pounds) U.S. imports from.-- Korea 95,184 12,677 11,869 19,352 139,081
Taiwan 41,235 4,736 2,094 11,995 60,059 Subject sources 136,418 17,413 13,963 31,347 199,141 Nonsubject sources 2,527 5 52 1,004 3,589
All import sources 138,946 17,418 14,015 32,351 202,729 Share across (percent) U.S. imports from.-- Korea 68.4 9.1 8.5 13.9 100.0
Taiwan 68.7 7.9 3.5 20.0 100.0 Subject sources 68.5 8.7 7.0 15.7 100.0 Nonsubject sources 70.4 0.1 1.5 28.0 100.0
All import sources 68.5 8.6 6.9 16.0 100.0 Share down (percent) U.S. imports from.-- Korea 68.5 72.8 84.7 59.8 68.6
Taiwan 29.7 27.2 14.9 37.1 29.6 Subject sources 98.2 100.0 99.6 96.9 98.2 Nonsubject sources 1.8 0.0 0.4 3.1 1.8
All import sources 100.0 100.0 100.0 100.0 100.0 Source: Official import statistics for HTS statistical reporting number 5503.20.0015, accessed July 13, 2017.
(…continued) Hawaii; Los Angeles, California; Nogales, Arizona; San Diego, California; San Francisco, California; and Seattle, Washington.

IV‐13
APPARENT U.S. CONSUMPTION
Table IV‐7 and figure IV‐5 present data on apparent U.S. consumption and U.S. market shares for low melt PSF. Apparent U.S. consumption based on quantity increased by *** percent from 2014 to 2016 and was *** higher in January to March 2017 relative to January to March 2016. The increase in apparent consumption was driven by an increase in U.S. importers’ U.S. shipments, which rose from *** pounds in 2014 to *** pounds in 2016, an increase of *** percent. By value, apparent U.S. consumption fell *** percent from 2014 to 2016, but was *** higher in January to March 2017 relative to January to March 2016.
U.S. producers’ market share based on quantity decreased by *** percentage points from 2014 to 2016. U.S. producers’ market share was *** percentage points lower in January to March 2017 relative to January to March 2016. Subject imports’ market share increased *** percentage points from 2014 to 2016 and was *** percentage points higher in January to March 2017 relative to January to March 2016. The increase in subject imports’ market share between 2014 and 2016 was driven by subject imports from Korea, which accounted for *** percent of the market share increase. Overall, U.S. producers’ U.S. shipments accounted for *** percent of U.S. market share in 2016, while U.S. importers’ shipments of subject imports accounted for *** percent.

IV‐14
Table IV-7 Low melt PSF: Apparent U.S. consumption, 2014-16, January to March 2016, and January to March 2017
Item Calendar year January to March
2014 2015 2016 2016 2017 Quantity (1,000 pounds) U.S. producers' U.S. shipments *** *** *** *** ***U.S. imports from.-- Korea 106,685 120,703 139,081 33,640 34,901
Taiwan 44,751 50,115 60,059 13,775 15,519 Subject sources 151,436 170,818 199,141 47,415 50,420 Nonsubject sources 3,940 5,534 3,589 1,250 1,150
All import sources 155,376 176,352 202,729 48,666 51,571 Apparent U.S. consumption *** *** *** *** *** Value (1,000 dollars) U.S. producers' U.S. shipments *** *** *** *** ***U.S. imports from.-- Korea 91,162 83,707 83,259 20,173 21,300
Taiwan 34,965 32,304 30,981 7,105 8,535 Subject sources 126,128 116,011 114,240 27,278 29,835 Nonsubject sources 3,547 4,245 2,827 852 847
All import sources 129,675 120,256 117,067 28,130 30,681 Apparent U.S. consumption *** *** *** *** *** Share of quantity (percent) U.S. producers' U.S. shipments *** *** *** *** ***U.S. imports from.-- Korea *** *** *** *** ***
Taiwan *** *** *** *** ***Subject sources *** *** *** *** ***Nonsubject sources *** *** *** *** ***
All import sources *** *** *** *** *** Share of value (percent) U.S. producers' U.S. shipments *** *** *** *** ***U.S. imports from.-- Korea *** *** *** *** ***
Taiwan *** *** *** *** ***Subject sources *** *** *** *** ***Nonsubject sources *** *** *** *** ***
All import sources *** *** *** *** ***Source: Compiled from data submitted in response to Commission questionnaires and official import statistics for HTS statistical reporting number 5503.20.0015, accessed July 13, 2017. Figure IV-5 Low melt PSF: Apparent U.S. consumption, 2014-16, January to March 2016, and January to March 2017
* * * * * * *

V‐1
PART V: PRICING DATA
FACTORS AFFECTING PRICES
Raw material costs
The primary raw materials used to produce low melt PSF are monoethylene glycol (“MEG”), purified terephthalic acid (“PTA”), and purified isophthalic acid (“PIA”).1 U.S. producers’ raw material costs, as a share of the cost of goods sold (“COGS”), decreased from *** in 2014 to *** percent in 2016. During January‐March 2017, U.S. producers’ raw material costs as a share of COGS was *** percent, compared with *** percent during January‐March 2016.
Overall, the prices of MEG and PTA both decreased from January 2014 to December 2016 (figure V‐1). The price of MEG decreased by *** percent during this time, while the price of PTA decreased by *** percent. Between December 2016 and March 2017, the prices of each of these inputs increased by *** percent and *** percent, respectively.
Figure V-1 Raw materials: Purified terephthalic acid (“PTA”) and monoethylene glycol (“MEG”), monthly, January 2014-March 2017
* * * * * * *
U.S. inland transportation costs
*** U.S. producers and nine of 10 responding importers reported that they typically arrange transportation to their customers. One U.S. producer reported that its U.S. inland transportation costs were *** percent, 2 while most importers reported costs of 0 to 3 percent.
PRICING PRACTICES
Pricing methods
*** U.S. producers and the majority of importers reported using transaction‐by‐
transaction negotiations, while the second most common price setting method used by importers was contracts (table V‐1).
1 Some low melt PSF is also manufactured using recycled raw materials, but the types of materials used and the production process are the same, whether the low melt PSF is virgin or recycled. Petitioner’s brief, pp. 13‐14.
2 ***.

V‐2
Table V-1 Low melt PSF: U.S. producers’ and importers’ reported price setting methods, by number of responding firms1
Method U.S. producers Importers Transaction-by-transaction *** 9 Contract *** 6 Set price list *** 0 Other *** 0 Responding firms *** 10
1 The sum of responses down may not add up to the total number of responding firms as each firm was instructed to check all applicable price setting methods employed. Source: Compiled from data submitted in response to Commission questionnaires.
*** U.S. producers reported selling *** of their low melt PSF through spot sales (table V‐2). Importers reported that they sold most of their product under short‐term contracts, with the remaining share on the spot market.
Table V-2 Low melt PSF: U.S. producers’ and importers’ shares of U.S. commercial shipments by type of sale, 2016
* * * * * * *
All eight responding importers used short‐term contracts and reported that the average duration of their short‐term contracts ranged from 60 and 120 days, not allow for price renegotiations, and fixed both price and quantity. Most importers (7 of 8) reported that their short‐term contracts did not have meet‐or‐release provisions.
Purchasers provided general information about their methods of purchase for low melt PSF. Five of eight responding U.S. purchasers reported that they purchase low melt PSF on a quarterly basis through contracts. Two purchasers also reported using individual purchase orders. Four purchasers reported soliciting contracts from suppliers based on a request for quote or bidding system. One purchaser, ***, reported that pricing is based on market prices for raw materials and conversion costs for low melt PSF.
Sales terms and discounts
***. Seven importers quote prices on an f.o.b. basis and the remaining two importers
quote on a delivered basis. No U.S. producer or importer reported having discount policies for sales of low melt PSF.
U.S. producers reported sales terms of net 30 days. Seven out of nine importers reported sales terms of net 30 days and six reported sales terms of net 60 days.

V‐3
PRICE DATA
The Commission requested U.S. producers and importers to provide quarterly data for the total quantity and f.o.b. value of the following low melt PSF products shipped to unrelated U.S. customers during January 2014 – March 2017.
Product 1.‐‐Low melt polyester staple fiber, 4 denier in diameter, 37‐76 mm in cut
length, sheath melt point of 110°C.
Product 2.‐‐Low melt polyester staple fiber, 4 denier in diameter, 37‐76 mm in cut length, sheath melt point of 180°C.
Product 3.‐‐Low melt polyester staple fiber, 2 denier in diameter, 37‐76 mm in cut
length, melt point of 110°C.
Both U.S. producers and nine importers provided usable pricing data for sales of the requested products, although not all firms reported pricing for all products for all quarters.3 4 5 Pricing data reported by these firms accounted for approximately *** percent of U.S. producers’ commercial U.S. shipments of low melt PSF, *** percent of U.S. commercial shipments of imports from Korea, and *** percent of U.S. commercial shipments of imports from Taiwan in 2016. Price data for products 1‐3 are presented in tables V‐3 to table V‐5 and figures V‐2 to V‐4.
3 Per‐unit pricing data are calculated from total quantity and total value data provided by U.S. producers and importers. The precision and variation of these figures may be affected by rounding, limited quantities, and producer or importer estimates.
4 The petitioner contended that sales are occurring at different levels of distribution. U.S. producers sell to both distributors and end users and subject importers, some of which are distributors, sell only to end users. The petitioner reports that because ***. The petitioner argued that this makes the importer price data not comparable with the producer price data, since the former includes markups while the latter does not. For instance, ***. Postconference brief, p. 23, 30‐31.
5 Firms’ reported AUVs varied widely. ***. Importer ***. William Barnet reported that its focus with this product is on ***. These data were
included in the pricing data analysis. Importer ***.

V‐4
Table V-3 Low melt PSF: Weighted-average f.o.b. prices and quantities of domestic and imported product 1 and margins of underselling/(overselling), by quarters, January 2014-March 2017
* * * * * * * Table V-4 Low melt PSF: Weighted-average f.o.b. prices and quantities of domestic and imported product 2 and margins of underselling/(overselling), by quarters, January 2014-March 2017
* * * * * * * Table V-5 Low melt PSF: Weighted-average f.o.b. prices and quantities of domestic and imported product 3 and margins of underselling/(overselling), by quarters, January 2014-March 2017
* * * * * * *
Figure V-2 Low melt PSF: Weighted-average prices and quantities of domestic and imported product 1, by quarters, January 2014-March 2017
* * * * * * * Figure V-3 Low melt PSF: Weighted-average prices and quantities of domestic and imported product 2, by quarters, January 2014-March 2017
* * * * * * * Figure V-4 Low melt PSF: Weighted-average prices and quantities of domestic and imported product 3, by quarters, January 2014-March 2017
* * * * * * *

V‐5
Price trends
In general, prices decreased during January 2014‐March 2017. Table V‐6 summarizes the price trends, by country and by product. As shown in the table, domestic price decreases for products 1 and 2 ranged from *** percent to *** percent during January 2014‐March 2017. Import price decreases for all three products ranged from *** percent to *** percent. Domestic prices for *** increased during the period.6
Table V-6 Low melt PSF: Summary of weighted-average f.o.b. prices for products 1-3 from the United States Korea, and Taiwan
* * * * * * *
Price comparisons
As shown in table V‐7, prices for low melt PSF imported from subject countries were below those for U.S.‐produced product in 31 of 77 instances (81.3 million pounds); margins of underselling ranged from 1.0 to 64.3 percent. In the remaining 46 instances (365.7 million), prices for low melt PSF from subject countries were between 0.3 and 20.4 percent above prices for the domestic product.7 8 On an individual country basis, prices of imports from Korea and Taiwan were both higher than domestic prices in the majority of instances.
6 ***. 7 The petitioner attributed some of the overselling to product differences as subject imports include
black and crystalline low melt PSF, both of which are generally sold at higher prices. Respondents also indicated that some of this overselling may be attributed to the import of black and crystalline low melt PSF. Petitioner’s postconference brief, pp. 32‐33; conference transcript, p. 105 (Bernet).
8 The petitioner also alleged that some of the overselling is due to the Commission not collecting cost data on direct import costs (i.e., the price importers pay to a foreign producer). Petitioner’s postconference brief, pp. 31‐32.

V‐6
Table V-7 Low melt PSF: Instances of underselling/overselling and the range and average of margins, by country, January 2014-March 2017
Source
Underselling
Number of quarters
Quantity1 (pounds)
Average margin
(percent)
Margin range (percent)
Min Max
Korea *** *** *** *** *** Taiwan *** *** *** *** *** Total 31 81,348,437 29.5 1.0 64.3
Source
(Overselling)
Number of quarters
Quantity1 (pounds)
Average margin
(percent)
Margin range (percent)
Min Max
Korea *** *** *** *** ***Taiwan *** *** *** *** ***Total 46 365,722,635 (9.6) (0.3) (20.4)
1 These data include only quarters in which there is a comparison between the U.S. and subject product. Source: Compiled from data submitted in response to Commission questionnaires.
LOST SALES AND LOST REVENUE
The Commission requested that U.S. producers of low melt PSF identify purchasers in which they experienced instances of lost sales or lost revenue due to competition from imports of low melt PSF from Korea and Taiwan during January 2014‐March 2017. Both U.S. producers reported that they had to reduce prices and one reported that it had to roll back announced price increases. Both U.S. producers reported that they had lost sales. U.S. producer *** submitted lost sales and lost revenue allegations, identifying five firms to which it lost sales or revenue (three consisting of lost sales allegations and two consisting of lost revenue allegations). Of the five lost sale allegations, four were lost sales to imports from Korea, and one lost sale allegation was to imports from both Korea and Taiwan. The allegations occurred during February and March of 2015 and March 2017‐May 2017.
Staff contacted the five purchasers identified by the U.S. producer, and received responses from eight purchasers.9 Responding purchasers reported purchasing 143,876 pounds of low melt PSF during 2016 (table V‐8).
9 In addition to the five firms identified by the U.S. producer, three additional purchasers, ***, ***, and *** submitted unsolicited purchaser questionnaire responses to the Commission.

V‐7
Table V-8 Low melt PSF: Purchases and imports, 2016
Purchaser
Purchases and imports in 2016(1,000 pounds) Change in domestic
share2 (pp, 2014-16)
Change in subject country share2 (pp,
2014-16) Domestic Subject All other1
*** *** *** *** *** ****** *** *** *** *** ****** *** *** *** *** ****** *** *** *** *** ****** *** *** *** *** ****** *** *** *** *** ****** *** *** *** *** ****** *** *** *** *** ***Totals 40,028 99,377 4,471 (11.9) 15.61 Includes all other sources and unknown sources. 2Percentage points (pp) change: Change in the share of the firm’s total purchases of domestic and/or subject country imports between first and last years. Source: Compiled from data submitted in response to Commission questionnaires.
During 2016, responding purchasers purchased 45.5 percent from U.S. producers, 29.6 percent from Korea, 19.9 percent from Taiwan, and 3.1 percent from nonsubject countries, and 1.9 percent from “unknown source” countries. Of the responding purchasers, three reported decreasing purchases from domestic producers, one reported increasing purchases, one reported no change, one reported fluctuating purchases, and one did not purchase any domestic product. Explanations for increasing purchases of domestic product included an increase in demand from the U.S. bedding industry. Explanations for decreasing purchases of domestic product included quality issues being raised by two firms. One firm also mentioned availability issues and another reported that it has become more difficult in 2017 to get a “two‐day call‐out” for orders and that unscheduled loads have been shipped before.
All eight purchasers reported that, they had purchased imported low melt PSF from Korea instead of U.S.‐produced product since 2014. Five purchasers reported that they had purchased imported low melt PSF from Taiwan instead of U.S.‐produced product. Six of eight purchasers reported that subject import prices were lower than U.S.‐produced product, and two of these purchasers reported that price was a primary reason for the decision to purchase imported product rather than U.S.‐produced product. One purchaser estimated that it purchased 2,000 pounds of low melt PSF from Korea instead of domestic product (table V‐9). Estimates for quantities purchased from Taiwan were not provided. Purchasers identified performance, quality, and availability as non‐price reasons for purchasing imported rather than U.S.‐produced product. Purchasers specifically mentioned black low melt PSF not being produced in the U.S. as a reason for purchasing imports. Several purchasers also reported that imports were purchased instead of U.S.‐produced product due to plant preferences and the product having to pass production trials.

V‐8
Table V-9 Low melt PSF: Purchasers’ responses to shifting supply sources, by firm
* * * * * * * Table V-9--Continued Low melt PSF: Purchasers’ responses to shifting supply sources, by firm
* * * * * * *
One of 8 purchasers reported that U.S. producers had reduced prices in order to compete with lower‐priced imports from subject countries (table V‐10; seven reported that they did not know). The reported estimated price reduction by this purchaser was 33.0 percent from Korea.
Responding U.S. purchasers identified various methods that they use in purchasing low melt PSF including bids or requests for quotes. In responding to the lost sales and lost revenue survey, some purchasers provided additional information on purchases and market dynamics. Purchasers identified needs to secure their supply chain, increased sourcing options, transportation costs, and raw material supply and costs. Some purchasers also noted lack of sufficient quantity and/or specific products from domestic producers. Table V-10 Low melt PSF: Purchasers’ responses to U.S. producer price reductions
* * * * * * *

VI‐1
PART VI: FINANCIAL EXPERIENCE OF U.S. PRODUCERS
BACKGROUND
Two U.S. producers (Nan Ya and FIT Fibers) reported their financial results on low melt PSF. These data are believed to account for *** U.S. production of low melt PSF from January 2014 to March 2017. *** represented the majority ***. Thus, the aggregated data largely reflect the financial performance of ***. *** reported internal consumption transfers to related firms, or tolling. *** reported their financial results on a calendar year basis.
OPERATIONS ON LOW MELT PSF
Table VI‐1 presents aggregated data on U.S. producers’ operations on low melt PSF during the period examined, while table VI‐2 presents selected company‐specific financial data.
Net sales
***. As shown in table VI‐1, total net sales quantity declined by *** percent from 2014 to 2016, and was *** percent lower in January‐March 2017 than in January‐March 2016. The total net sales value declined *** percent from 2014 to 2016, and was *** percent higher in January‐March 2017 than in January‐March 2016.
On a per‐pound basis, the net sales value decreased from 2014 to 2016, and was higher in January‐March 2017 than in January‐March 2016. As shown in table VI‐2, the per‐pound net sales values ***. ***.1
Cost of goods sold and gross profit or (loss)
As shown in table VI‐1, raw materials represented the largest component of COGS, accounting for between *** and *** percent of total COGS during the period examined. ***.2 3 4 Company‐specific per‐unit data shows ***.5 6
1 ***. *** email to Commission staff, July 13, 2017. ***. *** email to Commission staff, July 17, 2017.
2 ***. ***, email to Commission staff, July 24, 2017. 3 ***. U.S. producers’ questionnaire, question III‐7, and ***, email to Commission staff, July 24, 2017. 4 Conference testimony alleged that due to the abundant supply of the main ingredient PTA in the
Far East, the cost of this critical raw material is significantly lower than the price of PTA in the U.S. markets. Conference transcript, p. 17 (Menegaz).
5 ***. *** email to Commission staff, July 13, 2017. 6 ***. U.S. producers’ questionnaire, question III‐9b, *** email to Commission staff, July 13, 2017,
and ***, email to Commission staff, July 24, 2017.

VI‐2
Table VI-1 Low melt PSF: Results of operations of U.S. producers, 2014-16, January to March 2016, and January to March 2017
* * * * * * * Table VI-2 Low melt PSF: Selected Results of operations of U.S. producers, by company, 2014-16, January to March 2016, and January to March 2017
* * * * * * *
Other factory costs were the second largest component of COGS, representing *** to *** percent of total COGS during the period examined. Company‐specific per‐unit data shows ***. 7
Direct labor was the smallest component of COGS. As shown in table VI‐1, per‐pound direct labor costs were relatively constant during the reporting period. ***.
As shown in table VI‐1, the total COGS ***. As shown in table VI‐2, company‐specific per‐unit data shows that ***.8
The industry’s gross profits declined from *** Gross profit also fell ***. In contrast, ***.
Selling general and administrative expenses and operating profit or (loss)
As shown in table VI‐1, the industry’s selling, general, and administrative (“SG&A”) expense ratio (i.e., total SG&A expenses divided by total revenue) steadily increased from *** percent in 2014 to *** percent in 2016 and ***. Table VI‐2 shows that ***. 9
***. Both firms reported lower operating income or increased losses in January‐March 2017 compared to January‐March 2016.
All other expenses and net income or (loss)
***.10 11 Net income followed the same trend as operating income, ***.
Variance analysis
A variance analysis is not presented in this report due to ***.
7 ***. ***, email to Commission staff, July 24, 2017. 8 ***. *** email to Commission staff, July 13, 2017. 9 ***. *** email to Commission staff, July 13, 2017. 10 ***. ***, email to Commission staff, July 24, 2017. 11 ***.

VI‐3
CAPITAL EXPENDITURES AND RESEARCH AND DEVELOPMENT EXPENSES
Table VI‐3 presents the U.S. producers’ capital expenditures and research and development expenses. ***.12 ***.13
Table VI-3 Low melt PSF: Capital expenditures and research development of U.S. producers, 2014-16, January to March 2016, and January to March 2017
* * * * * * *
ASSETS AND RETURN ON ASSETS
Table VI‐4 presents data on the U.S. producers’ total assets and their return on assets (“ROA”). ***. Total assets irregularly increased from $*** in 2014 to $*** in 2016, and the ROA consistently declined from *** percent in 2014 to *** percent in 2016.14
Table VI-4 Low melt PSF: U.S. producers’ total assets and ROA, 2014-16
* * * * * * *
CAPITAL AND INVESTMENT
The Commission requested U.S. producers of low melt PSF to describe any actual or potential negative effects of imports of low melt PSF from China on their firms’ growth, investment, ability to raise capital, development and production efforts, or the scale of capital investments. Table VI‐5 presents U.S. producers’ responses in a tabulated format and table VI‐6 provides the narrative responses. Table VI-5 Low melt PSF: Actual and anticipated negative effects of imports on investment, growth, and development, since January 1, 2014
* * * * * * * Table VI-6 Low melt PSF: Narratives relating to the actual and anticipated negative effects of imports on investment, growth, and development, since January 1, 2014
* * * * * * *
12 ***. ***, email to Commission staff, July 24, 2017. 13 ***. 14 With respect to a company’s overall operations, staff notes that a total asset value reflects an
aggregation of a number of assets which generally are not product specific. Thus, high‐level allocation factors may have been required in order to report a total asset value for low melt PSF.


VII‐1
PART VII: THREAT CONSIDERATIONS AND INFORMATION ON NONSUBJECT COUNTRIES
Section 771(7)(F)(i) of the Act (19 U.S.C. § 1677(7)(F)(i)) provides that—
In determining whether an industry in the United States is threatened with material injury by reason of imports (or sales for importation) of the subject merchandise, the Commission shall consider, among other relevant economic factors1‐‐ (I) if a countervailable subsidy is involved, such information as may be
presented to it by the administering authority as to the nature of the subsidy (particularly as to whether the countervailable subsidy is a subsidy described in Article 3 or 6.1 of the Subsidies Agreement), and whether imports of the subject merchandise are likely to increase,
(II) any existing unused production capacity or imminent, substantial increase in production capacity in the exporting country indicating the likelihood of substantially increased imports of the subject merchandise into the United States, taking into account the availability of other export markets to absorb any additional exports,
(III) a significant rate of increase of the volume or market penetration of imports of the subject merchandise indicating the likelihood of substantially increased imports,
(IV) whether imports of the subject merchandise are entering at prices that are likely to have a significant depressing or suppressing effect on domestic prices, and are likely to increase demand for further imports,
(V) inventories of the subject merchandise,
1 Section 771(7)(F)(ii) of the Act (19 U.S.C. § 1677(7)(F)(ii)) provides that “The Commission shall consider {these factors} . . . as a whole in making a determination of whether further dumped or subsidized imports are imminent and whether material injury by reason of imports would occur unless an order is issued or a suspension agreement is accepted under this title. The presence or absence of any factor which the Commission is required to consider . . . shall not necessarily give decisive guidance with respect to the determination. Such a determination may not be made on the basis of mere conjecture or supposition.”

VII‐2
(VI) the potential for product‐shifting if production facilities in the foreign country, which can be used to produce the subject merchandise, are currently being used to produce other products,
(VII) in any investigation under this title which involves imports of both a raw agricultural product (within the meaning of paragraph (4)(E)(iv)) and any product processed from such raw agricultural product, the likelihood that there will be increased imports, by reason of product shifting, if there is an affirmative determination by the Commission under section 705(b)(1) or 735(b)(1) with respect to either the raw agricultural product or the processed agricultural product (but not both),
(VIII) the actual and potential negative effects on the existing development and production efforts of the domestic industry, including efforts to develop a derivative or more advanced version of the domestic like product, and
(IX) any other demonstrable adverse trends that indicate the probability that there is likely to be material injury by reason of imports (or sale for importation) of the subject merchandise (whether or not it is actually being imported at the time).2
Information on the nature of the alleged dumping margins was presented earlier in this report; information on the volume and pricing of imports of the subject merchandise is presented in Parts IV and V; and information on the effects of imports of the subject merchandise on U.S. producers’ existing development and production efforts is presented in Part VI. Information on inventories of the subject merchandise; foreign producers’ operations, including the potential for “product‐shifting;” any other threat indicators, if applicable; and any dumping in third‐country markets, follows. Also presented in this section of the report is information obtained for consideration by the Commission on nonsubject countries.
2 Section 771(7)(F)(iii) of the Act (19 U.S.C. § 1677(7)(F)(iii)) further provides that, in antidumping investigations, “. . . the Commission shall consider whether dumping in the markets of foreign countries (as evidenced by dumping findings or antidumping remedies in other WTO member markets against the same class or kind of merchandise manufactured or exported by the same party as under investigation) suggests a threat of material injury to the domestic industry.”

VII‐3
THE INDUSTRY IN KOREA
The Commission issued foreign producers’ or exporters’ questionnaires to 10 firms believed to produce and/or export low melt PSF from Korea.3 The Commission did not receive a response from any Korean producers. According to petitioners, there are three major producers of low melt PSF: Huvis Corporation, Toray Chemical Korea Inc. and Taekwang Industrial. Petitioners noted that Huvis Corporation claims a total polyester staple fiber capacity of 1.1 billion pounds per year and expanded its capacity by adding a new low melt production line in 2013.4 Petitioners also stated that Toray, which claims to be the world’s third largest low melt producer, broke ground on a new facility that would more than double its low melt PSF production capacity increasing it from 144 million pounds to 342 million pounds.5 Additionally, they noted Taekwang Industrial’s claim that its vertical integration process that allows it to produce low melt PSF with its own PTA facility gives the firm a price competitive edge.6
Exports
According to GTA, the leading export markets for low melt PSF from Korea are the United States, China, and Germany (table IV‐1). During 2016, the United States was the top single market for low melt PSF from Korea, accounting for 18.4 percent, followed by the China, accounting for 9.1 percent.
3 These firms were identified through a review of information submitted in the petition and contained in *** records.
4 Petitioner’s postconference brief, p. 45. 5 Petitioner’s postconference brief, p. 45. 6 Petitioner’s postconference brief, p. 45.

VII‐4
Table IV-1 Low melt PSF: Korea exports by destination market, 2014-16
Destination market Calendar year
2014 2015 2016 Quantity (1,000 pounds) Korea exports to the United States 247,078 272,174 289,033 Korea exports to other major destination markets.-- China 154,148 143,494 143,050
Germany 108,405 102,577 101,294 Vietnam 99,071 101,461 99,584 Italy 68,359 78,396 93,810 Poland 63,084 75,675 75,934 Japan 52,310 60,806 72,272 United Kingdom 80,618 73,127 69,261 Belgium 37,461 40,610 44,904 All other destination markets 511,687 547,798 585,811
Total Korea exports 1,422,221 1,496,118 1,574,954 Value (1,000 dollars) Korea exports to the United States 168,801 153,283 143,008 Korea exports to other major destination markets.-- China 118,099 82,589 73,176
Germany 78,374 60,082 52,467 Vietnam 73,159 64,162 57,364 Italy 46,261 41,581 43,723 Poland 39,533 38,048 33,504 Japan 32,681 35,258 39,114 United Kingdom 49,972 36,802 30,655 Belgium 24,732 22,211 20,730 All other destination markets 360,934 314,092 295,981
Total Korea exports 992,546 848,107 789,722 Table continued.

VII‐5
Table IV-1 -- Continued Low melt PSF: Korea exports by destination market, 2014-16
Destination market Calendar year
2014 2015 2016 Unit value (dollars per pound) Korea exports to the United States 0.68 0.56 0.49 Korea exports to other major destination markets.-- China 0.77 0.58 0.51
Germany 0.72 0.59 0.52 Vietnam 0.74 0.63 0.58 Italy 0.68 0.53 0.47 Poland 0.63 0.50 0.44 Japan 0.62 0.58 0.54 United Kingdom 0.62 0.50 0.44 Belgium 0.66 0.55 0.46 All other destination markets 0.71 0.57 0.51
Total Korea exports 0.70 0.57 0.50 Share of quantity (percent) Korea exports to the United States 17.4 18.2 18.4 Korea exports to other major destination markets.-- China 10.8 9.6 9.1
Germany 7.6 6.9 6.4 Vietnam 7.0 6.8 6.3 Italy 4.8 5.2 6.0 Poland 4.4 5.1 4.8 Japan 3.7 4.1 4.6 United Kingdom 5.7 4.9 4.4 Belgium 2.6 2.7 2.9 All other destination markets 36.0 36.6 37.2
Total Korea exports 100.0 100.0 100.0 Source: Official exports statistics under HS subheading 5503.20 as reported by Korea Customs and Trade Development Institution in the IHS/GTA database, accessed July 13, 2017.
THE INDUSTRY IN TAIWAN
The Commission issued foreign producers’ or exporters’ questionnaires to 5 firms believed to produce and/or export low melt PSF from Taiwan.7 A usable response to the Commission’s questionnaire was received from Far Eastern New Century Corporation (“FENC”). FENC’s exports to the United States accounted for the majority of U.S. imports of low melt PSF
7 These firms were identified through a review of information submitted in the petition and contained in *** records.

VII‐6
from Taiwan over the period being examined.8 According to estimates requested of the responding Taiwan producers, the production of low melt PSF in Taiwan reported in this part of the report accounts for approximately *** percent of overall production of low melt PSF in Taiwan.
Far Eastern New Century Corporation
Far Eastern New Century Corporation (“FENC”), formerly known as Far Eastern Textile Limited, is headquartered in Taipei, Taiwan and operates three distinct business units (1) a petrochemicals, polyester and textiles production unit, (2) an industrial holdings unit that includes telecommunications, cement, retail, financial services and transportation, and (3) a land asset management and property development unit.9
Changes in operations
FENC reported no changes in operations in relation to the production of low melt PSF since January 1, 2014.
Operations on low melt PSF
Table VII‐2 presents information on the low melt PSF operations of the responding producers and exporters in Taiwan.
Table VII-2 Low melt PSF: Data on industry in Taiwan, 2014-16, January to March 2016, and January to March 2017 and projection calendar years 2017 and 2018
* * * * * * *
8 “FENC believes that it accounts for 100 percent of Taiwan low melt PSF exports to the U.S.” Respondent FENC postconference brief, p. 1.
9 http://about.fenc.com/ir_report.aspx?lang=en, retrieved July 21, 2017.
VII‐7
Alternative products
As shown in table VII‐3, responding Taiwan firms produced other products on the same equipment and machinery used to produce low melt PSF.
Table VII-3 Low melt PSF: Overall capacity and production on the same equipment as in-scope production Taiwan, 2014-16, January to March 2016, and January to March 2017
* * * * * * *
Exports
According to GTA, the leading export markets for low melt PSF from Taiwan are Vietnam, the United States, and the United Kingdom (table IV‐4). During 2016, the Vietnam was the top export market for low melt PSF from Taiwan, accounting for 21.9 percent, followed by the United States, accounting for 10.4 percent.

VII‐8
Table IV-4 Low melt PSF: Taiwan exports by destination market, 2014-16
Destination market Calendar year
2014 2015 2016 Quantity (1,000 pounds) Taiwan exports to the United States 66,862 73,306 88,759 Taiwan exports to other major destination markets.-- Vietnam 204,017 190,971 187,461
United Kingdom 38,700 52,072 45,418 China 31,336 28,889 35,485 Thailand 25,386 25,084 32,935 Pakistan 17,285 16,123 30,881 Germany 40,598 33,160 30,365 Mexico 20,934 22,480 27,692 Italy 32,429 24,025 25,998 All other destination markets 339,458 330,383 352,556
Total Taiwan exports 817,008 796,495 857,550 Value (1,000 dollars) Taiwan exports to the United States 47,960 41,431 42,922 Taiwan exports to other major destination markets.-- Vietnam 130,911 94,980 85,479
United Kingdom 27,044 30,060 22,546 China 23,255 18,482 21,048 Thailand 18,724 14,558 16,726 Pakistan 12,744 9,386 14,929 Germany 29,141 18,822 15,243 Mexico 15,558 13,094 13,808 Italy 22,155 12,633 12,247 All other destination markets 245,954 197,547 181,961
Total Taiwan exports 573,445 450,993 426,910 Table continued.

VII‐9
Table IV-4 -- Continued Low melt PSF: Taiwan exports by destination market, 2014-16
Destination market Calendar year
2014 2015 2016 Unit value (dollars per pound) Taiwan exports to the United States 0.72 0.57 0.48 Taiwan exports to other major destination markets.-- Vietnam 0.64 0.50 0.46
United Kingdom 0.70 0.58 0.50 China 0.74 0.64 0.59 Thailand 0.74 0.58 0.51 Pakistan 0.74 0.58 0.48 Germany 0.72 0.57 0.50 Mexico 0.74 0.58 0.50 Italy 0.68 0.53 0.47 All other destination markets 0.72 0.60 0.52
Total Taiwan exports 0.70 0.57 0.50 Share of quantity (percent) Taiwan exports to the United States 8.2 9.2 10.4 Taiwan exports to other major destination markets.-- Vietnam 25.0 24.0 21.9
United Kingdom 4.7 6.5 5.3 China 3.8 3.6 4.1 Thailand 3.1 3.1 3.8 Pakistan 2.1 2.0 3.6 Germany 5.0 4.2 3.5 Mexico 2.6 2.8 3.2 Italy 4.0 3.0 3.0 All other destination markets 41.5 41.5 41.1
Total Taiwan exports 100.0 100.0 100.0 Source: Official exports statistics under HS subheading 5503.20 as reported by Taiwan Directorate General of Customs in the IHS/GTA database, accessed July 13, 2017.

VII‐10
U.S. INVENTORIES OF IMPORTED MERCHANDISE
Table VII‐5 presents data on U.S. importers’ reported inventories of low melt PSF. From 2014 to 2016, U.S. importers’ end‐of‐period inventories of U.S. imports of low melt from Korea and Taiwan increased by *** percent and *** percent, respectively. The majority of these inventories were held by ***.
Table VII-5 Low melt PSF: U.S. importers' end-of-period inventories of imports by source, 2014-16, January to March 2016, and January to March 2017
Item Calendar year January to March
2014 2015 2016 2016 2017 Inventories (1,000 pounds); Ratios (percent)
Imports from Korea Inventories *** *** *** *** *** Ratio to U.S. imports *** *** *** *** *** Ratio to U.S. shipments of imports *** *** *** *** ***
Ratio to total shipments of imports *** *** *** *** *** Imports from Taiwan: Inventories *** *** *** *** *** Ratio to U.S. imports *** *** *** *** *** Ratio to U.S. shipments of imports *** *** *** *** ***
Ratio to total shipments of imports *** *** *** *** *** Imports from subject sources: Inventories 25,064 29,693 47,403 32,495 89,021 Ratio to U.S. imports 16.0 16.3 23.1 16.0 24.0 Ratio to U.S. shipments of imports 17.2 17.1 25.9 17.4 23.7
Ratio to total shipments of imports 16.7 16.7 25.3 16.9 23.4 Imports from nonsubject sources: Inventories *** *** *** *** *** Ratio to U.S. imports *** *** *** *** *** Ratio to U.S. shipments of imports *** *** *** *** ***
Ratio to total shipments of imports *** *** *** *** *** Imports from all import sources: Inventories *** *** *** *** *** Ratio to U.S. imports *** *** *** *** *** Ratio to U.S. shipments of imports *** *** *** *** ***
Ratio to total shipments of imports *** *** *** *** ***Source: Compiled from data submitted in response to Commission questionnaires.

VII‐11
U.S. IMPORTERS’ OUTSTANDING ORDERS
The Commission requested importers to indicate whether they imported or arranged for the importation of low melt PSF from subject sources after March 31, 2017. ***.
Table VII-6 Low melt PSF: Arranged imports, April 2017 through March 2018
* * * * * * *
ANTIDUMPING OR COUNTERVAILING DUTY ORDERS IN THIRD‐COUNTRY MARKETS10
According to petitioners, there have been several unfair trade remedy investigations in third‐country markets on polyester staple fiber (without restriction to denier size or fiber structure) from Korea and Taiwan. In 1993, Mexico imposed an antidumping duty order on all forms of polyester staple fiber from Korea, which was extended in 2013. Turkey imposed an antidumping duty order on all forms of polyester staple fiber from Korea in 2000, which was extended in 2012. In 2003, Turkey issued a similar antidumping order on all forms of polyester staple fiber from China, India, and Taiwan, which was extended in 2014. In 2011, Indonesia enacted antidumping duty orders on all forms of polyester staple fiber from China, India, and Taiwan, which were extended in 2016.
INFORMATION ON NONSUBJECT COUNTRIES
In assessing whether the domestic industry is materially injured or threatened with material injury “by reason of subject imports,” the legislative history states “that the Commission must examine all relevant evidence, including any known factors, other than the dumped or subsidized imports, that may be injuring the domestic industry, and that the Commission must examine those other factors (including non‐subject imports) ‘to ensure that it is not attributing injury from other sources to the subject imports.’”11
10 Unless otherwise noted, information in this section is based on petitioner’s postconference brief, exh. 11.
11 Mittal Steel Point Lisas Ltd. v. United States, Slip Op. 2007‐1552 at 17 (Fed. Cir. Sept. 18, 2008), quoting from Statement of Administrative Action on Uruguay Round Agreements Act, H.R. Rep. 103‐316, Vol. I at 851‐52; see also Bratsk Aluminum Smelter v. United States, 444 F.3d 1369 (Fed. Cir. 2006).
VII‐12
Table VII‐7 presents global exports of synthetic staple fibers, not carded, combed or otherwise processed for spinning that are of polyester (HS 5503.20) by country.12 Export data specifically for low melt PSF, as defined by the scope of this investigation, are not available from global trade databases. However, export data are available for a somewhat broader category of synthetic staple fiber. This would include out‐of‐scope products such as coarse polyester staple fiber and fine denier polyester staple fiber. Global exports increased by 9.1 percent during 2014‐16. In 2016, the five leading country exporters (China, Korea, Taiwan, Thailand, and India) accounted for 76.5 percent of global exports of synthetic staple fiber.
12 Global trade databases present data based on six‐digit HTS subheading 5503.20, which describes the article as: “synthetic staple fibers, not carded, combed or otherwise processed for spinning: of polyester.” Harmonized Tariff Schedule of the United States (2016). HTS subheading 5503.20 covers products that are outside the scope of this investigation. Therefore, export data compiled from these databases may overstate the quantity of exports of low melt PSF.

VII‐13
Table VII-7 Low melt PSF: Global exports by exporter, 2014-16
Exporter Calendar year
2014 2015 2016 Quantity (1,000 pounds) United States 129,279 97,775 96,151 Korea 1,422,221 1,496,118 1,574,954 Taiwan 817,008 796,495 857,550
Subject sources 2,368,508 2,390,388 2,528,655 All other major reporting exporters.-- China 1,924,913 2,079,684 2,219,563
Thailand 448,486 555,955 575,526 India 432,133 389,980 458,294 Indonesia 306,451 336,397 320,521 Malaysia 218,924 231,630 236,965 Ireland 175,897 181,710 180,364 Belarus 77,827 103,506 124,512 Romania 106,809 110,768 113,748 Turkey 79,907 99,452 101,300 Belgium 107,196 108,571 100,628 All other exporters 565,642 552,644 473,234
Nonsubject sources 4,444,184 4,750,297 4,904,655 Total global exports 6,812,692 7,140,685 7,433,310
Value (1,000 dollars) United States 103,349 83,847 78,925 Korea 992,546 848,107 789,722 Taiwan 573,445 450,993 426,910
Subject sources 1,669,341 1,382,947 1,295,557 All other major reporting exporters.-- China 1,105,404 987,901 940,967
Thailand 285,377 273,617 258,917 India 277,192 201,068 212,020 Indonesia 185,604 164,908 150,449 Malaysia 140,423 115,358 113,266 Ireland 144,095 128,301 118,593 Belarus 57,238 51,611 56,692 Romania 78,396 64,482 64,004 Turkey 59,710 57,146 51,927 Belgium 88,050 71,232 62,153 All other exporters 489,596 407,902 308,528
Nonsubject sources 2,911,085 2,523,527 2,337,515 Total global exports 4,580,426 3,906,474 3,633,072
Table continued.

VII‐14
Table VII-7 -- Continued Low melt PSF: Global exports by exporter, 2014-16
Exporter Calendar year
2014 2015 2016 Unit value (dollars per pound) United States 0.80 0.86 0.82 Korea 0.70 0.57 0.50 Taiwan 0.70 0.57 0.50
Subject sources 0.70 0.58 0.51 All other major reporting exporters.-- China 0.57 0.48 0.42
Thailand 0.64 0.49 0.45 India 0.64 0.52 0.46 Indonesia 0.61 0.49 0.47 Malaysia 0.64 0.50 0.48 Ireland 0.82 0.71 0.66 Belarus 0.74 0.50 0.46 Romania 0.73 0.58 0.56 Turkey 0.75 0.57 0.51 Belgium 0.82 0.66 0.62 All other exporters 0.87 0.74 0.65
Nonsubject sources 0.66 0.53 0.48 Total global exports 0.67 0.55 0.49
Share of quantity (percent) United States 1.9 1.4 1.3 Korea 20.9 21.0 21.2 Taiwan 12.0 11.2 11.5
Subject sources 34.8 33.5 34.0 All other major reporting exporters.-- China 28.3 29.1 29.9
Thailand 6.6 7.8 7.7 India 6.3 5.5 6.2 Indonesia 4.5 4.7 4.3 Malaysia 3.2 3.2 3.2 Ireland 2.6 2.5 2.4 Belarus 1.1 1.4 1.7 Romania 1.6 1.6 1.5 Turkey 1.2 1.4 1.4 Belgium 1.6 1.5 1.4 All other exporters 8.3 7.7 6.4
Nonsubject sources 65.2 66.5 66.0 Total global exports 100.0 100.0 100.0
Source: Official exports statistics under HS subheading 5503.20 as reported by various national statistical authorities in the IHS/GTA database, accessed July 13, 2017.

A‐1
APPENDIX A
FEDERAL REGISTER NOTICES


A‐3
The Commission makes available notices relevant to its investigations and reviews on its
website, www.usitc.gov. In addition, the following tabulation presents, in chronological order,
Federal Register notices issued by the Commission and Commerce during the current
proceeding.
Citation Title Link
82 FR 30907, July 3, 2017
Low Melt Polyester Staple Fiber from Korea and Taiwan; Institution of Antidumping Duty Investigation and Scheduling of Preliminary Phase Investigation
https://www.gpo.gov/fdsys/pkg/FR‐2017‐07‐03/pdf/2017‐13910.pdf
82 FR 34277, July 24, 2017
Low Melt Polyester Staple Fiber from Korea and Taiwan: Initiation of Less‐Than‐Fair‐Value Investigation
https://www.gpo.gov/fdsys/pkg/FR‐2017‐07‐24/pdf/2017‐15475.pdf


B‐1
APPENDIX B
CONFERENCE WITNESSES


‐ 3 ‐
CALENDAR OF PUBLIC PRELIMINARY CONFERENCE
Those listed below appeared as witnesses at the United States International Trade Commission’s preliminary conference:
Subject: Low Melt Polyester Staple Fiber from Korea and Taiwan
Inv. Nos.: 731-TA-1378 and 1379 (Preliminary)
Date and Time: July 18, 2017 - 9:30 a.m.
Sessions were held in connection with these preliminary phase investigations in the Main Hearing Room (room 101), 500 E Street, S.W., Washington, DC.
OPENING REMARKS: Petitioner (Kathleen W. Cannon, Kelley Drye & Warren LLP) Respondents (Gregory S. Menegaz, deKieffer & Horgan PLLC) In Support of the Imposition of
Antidumping Duty Orders: Kelley Drye & Warren LLP Washington, DC on behalf of Nan Ya Plastics Cooperation, America Michael Sparkman, Senior Business Manager, Nan Ya Plastics
Cooperation, America John Freeman, Assistant Director of Sales, Nan Ya Plastics
Cooperation, America Gina Beck, Economic Consultant, Georgetown Economic Services LLC Paul C. Rosenthal ) Kathleen W. Cannon ) – OF COUNSEL Brooke M. Ringel )

‐ 4 ‐
In Opposition to the Imposition of Antidumping Duty Orders:
deKieffer & Horgan PLLC Washington, DC on behalf of Bernet International Trading, LLC Consolidated Fibers, Inc. Fibertex Corporation Stein Fibers, Ltd. Mervyn Bernet, Chief Executive Officer, Bernet International
Trading, LLC Ryan Bernet, Vice President of Operations, Bernet International Trading, LLC Robert Kunik, President and Owner, Consolidated Fibers, Inc. Ernest Elias, Vice President and 50% Owner, Fibertex Corporation Sidney J. Stein, III, Vice President, Stein Fibers, Ltd. Jaren Edwards, Vice President of Sales, Stein Fibers, Ltd. Gregory S. Menegaz ) ) – OF COUNSEL
Judith Holdsworth ) Alston & Bird LLP Washington, DC on behalf of Milliken & Company Jon Fee ) – OF COUNSEL Squire Patton Boggs (US) LLP Washington, DC on behalf of Far Eastern New Century Corporation Peter Koenig ) – OF COUNSEL

‐ 5 ‐
INTERESTED PARTY APPEARANCE: Precision Custom Coatings, LLC Peter Longo, Chairman and Owner REBUTTAL/CLOSING REMARKS: Petitioner (Paul C. Rosenthal, Kelley Drye & Warren LLP) Respondents (Gregory S. Menegaz, deKieffer & Horgan PLLC)
-END-


C‐1
APPENDIX C
SUMMARY DATA


Table C-1Low melt PSF: Summary data concerning the U.S. market, 2014-16, January to March 2016, and January to March 2017
Jan-Mar2014 2015 2016 2016 2017 2014-16 2014-15 2015-16 2016-17
U.S. consumption quantity:Amount................................................................................ *** *** *** *** *** *** *** *** ***Producers' share (fn1).......................................................... *** *** *** *** *** *** *** *** ***Importers' share (fn1):
Korea................................................................................ *** *** *** *** *** *** *** *** ***Taiwan.............................................................................. *** *** *** *** *** *** *** *** ***
Subject sources.............................................................. *** *** *** *** *** *** *** *** ***Nonsubject sources........................................................ *** *** *** *** *** *** *** *** ***
All import sources....................................................... *** *** *** *** *** *** *** *** ***
U.S. consumption value:Amount................................................................................ *** *** *** *** *** *** *** *** ***Producers' share (fn1).......................................................... *** *** *** *** *** *** *** *** ***Importers' share (fn1):
Korea................................................................................ *** *** *** *** *** *** *** *** ***Taiwan.............................................................................. *** *** *** *** *** *** *** *** ***
Subject sources.............................................................. *** *** *** *** *** *** *** *** ***Nonsubject sources........................................................ *** *** *** *** *** *** *** *** ***
All import sources....................................................... *** *** *** *** *** *** *** *** ***
U.S. imports from:Korea:
Quantity............................................................................ 106,685 120,703 139,081 33,640 34,901 30.4 13.1 15.2 3.7 Value................................................................................ 91,162 83,707 83,259 20,173 21,300 (8.7) (8.2) (0.5) 5.6 Unit value.......................................................................... $0.85 $0.69 $0.60 $0.60 $0.61 (29.9) (18.8) (13.7) 1.8 Ending inventory quantity.................................................. *** *** *** *** *** *** *** *** ***
Taiwan:Quantity............................................................................ 44,751 50,115 60,059 13,775 15,519 34.2 12.0 19.8 12.7 Value................................................................................ 34,965 32,304 30,981 7,105 8,535 (11.4) (7.6) (4.1) 20.1 Unit value.......................................................................... $0.78 $0.64 $0.52 $0.52 $0.55 (34.0) (17.5) (20.0) 6.6 Ending inventory quantity.................................................. *** *** *** *** *** *** *** *** ***
Subject sources:Quantity............................................................................ 151,436 170,818 199,141 47,415 50,420 31.5 12.8 16.6 6.3 Value................................................................................ 126,128 116,011 114,240 27,278 29,835 (9.4) (8.0) (1.5) 9.4 Unit value.......................................................................... $0.83 $0.68 $0.57 $0.58 $0.59 (31.1) (18.5) (15.5) 2.9 Ending inventory quantity.................................................. 25,064 29,693 47,403 32,495 45,065 89.1 18.5 59.6 38.7
Nonsubject sources:Quantity............................................................................ 3,940 5,534 3,589 1,250 1,150 (8.9) 40.5 (35.1) (8.0)Value................................................................................ 3,547 4,245 2,827 852 847 (20.3) 19.7 (33.4) (0.7)Unit value.......................................................................... $0.90 $0.77 $0.79 $0.68 $0.74 (12.5) (14.8) 2.7 8.0 Ending inventory quantity.................................................. *** *** *** *** *** *** *** *** ***
All import sources:Quantity............................................................................ 155,376 176,352 202,729 48,666 51,571 30.5 13.5 15.0 6.0 Value................................................................................ 129,675 120,256 117,067 28,130 30,681 (9.7) (7.3) (2.7) 9.1 Unit value.......................................................................... $0.83 $0.68 $0.58 $0.58 $0.59 (30.8) (18.3) (15.3) 2.9 Ending inventory quantity.................................................. *** *** *** *** *** *** *** *** ***
U.S. producers':Average capacity quantity.................................................... *** *** *** *** *** *** *** *** ***Production quantity.............................................................. *** *** *** *** *** *** *** *** ***Capacity utilization (fn1)....................................................... *** *** *** *** *** *** *** *** ***U.S. shipments:
Quantity............................................................................ *** *** *** *** *** *** *** *** ***Value................................................................................ *** *** *** *** *** *** *** *** ***Unit value.......................................................................... *** *** *** *** *** *** *** *** ***
Export shipments:Quantity............................................................................ *** *** *** *** *** *** *** *** ***Value................................................................................ *** *** *** *** *** *** *** *** ***Unit value.......................................................................... *** *** *** *** *** *** *** *** ***
Ending inventory quantity..................................................... *** *** *** *** *** *** *** *** ***Inventories/total shipments (fn1)........................................... *** *** *** *** *** *** *** *** ***Production workers.............................................................. *** *** *** *** *** *** *** *** ***Hours worked (1,000s)......................................................... *** *** *** *** *** *** *** *** ***Wages paid ($1,000)............................................................ *** *** *** *** *** *** *** *** ***Hourly wages (dollars).......................................................... *** *** *** *** *** *** *** *** ***Productivity (pounds per hour).............................................. *** *** *** *** *** *** *** *** ***Unit labor costs.................................................................... *** *** *** *** *** *** *** *** ***Net sales:
Quantity............................................................................ *** *** *** *** *** *** *** *** ***Value................................................................................ *** *** *** *** *** *** *** *** ***Unit value.......................................................................... *** *** *** *** *** *** *** *** ***
Cost of goods sold (COGS).................................................. *** *** *** *** *** *** *** *** ***Gross profit or (loss)............................................................ *** *** *** *** *** *** *** *** ***SG&A expenses................................................................... *** *** *** *** *** *** *** *** ***Operating income or (loss)................................................... *** *** *** *** *** *** *** *** ***Net income or (loss)............................................................. *** *** *** *** *** *** *** *** ***Capital expenditures............................................................. *** *** *** *** *** *** *** *** ***Unit COGS........................................................................... *** *** *** *** *** *** *** *** ***Unit SG&A expenses............................................................ *** *** *** *** *** *** *** *** ***Unit operating income or (loss)............................................. *** *** *** *** *** *** *** *** ***Unit net income or (loss)...................................................... *** *** *** *** *** *** *** *** ***COGS/sales (fn1)................................................................. *** *** *** *** *** *** *** *** ***Operating income or (loss)/sales (fn1).................................. *** *** *** *** *** *** *** *** ***Net income or (loss)/sales (fn1)............................................ *** *** *** *** *** *** *** *** ***
Notes:
fn1.--Reported data are in percent and period changes are in percentage points.fn2.--Undefined.
C-3
Period changes
(Quantity=1,000 pounds; Value=1,000 dollars; Unit values, unit labor costs, and unit expenses=dollars per pound; Period changes=percent--exceptions noted)
Calendar year Calendar yearReported data
January to March
Source: Compiled from data submitted in response to Commission questionnaires and official import statistics for HTS statistical reporting number 5503.20, accessed July 13, 2017


