M. Chatib Basri
Anggota Dewan Kehormatan
Bank Indonesia Instiute
Bank Indonesia, Aug 24, 2017
Macroeconomic
Policy
Coordination: beyond stability

The macroeconomic impact of the
global volatility
2
capital
inflow
Risks of assets
re pricing
Exchange rate
?
Trade balance/ current account
deficit
commodity
price (?)Trump Effect
Economic
growth
Government
Revenue
Negative
interest
rate

The opportunities Quah (2015), the bad news about China maybe not too bad
2005: China’s GDP was $2.3 tn
China grew by 12%, its market place will increase by $274 bn
2015: China’s GDP was around $ 11.3 tn
China grew by 7%, its market place will increase by $790 bn
So China still generate economic growth in absolute magnitude 3 times larger than 2005
ASEAN still grow and remains robust
ASEAN countries can also take some market opportunities
From 2002 to its high point in 2014 Vietnam manufactured exports increased 13-fold, India nearly 6-fold and Bangladesh 5 times.
3

Indonesian economy
4
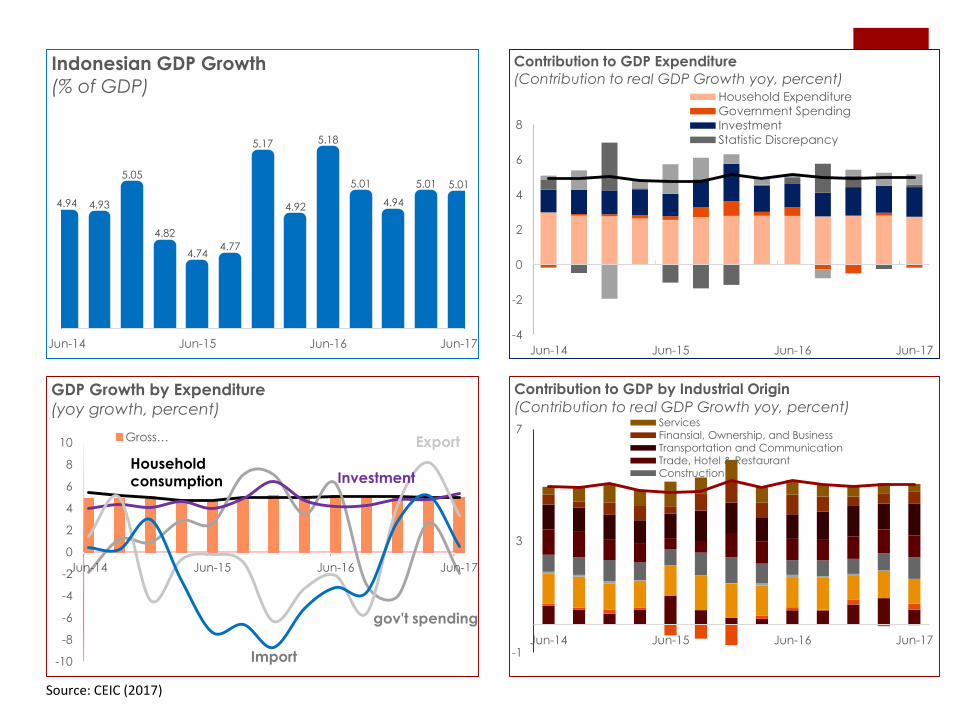
Source: CEIC (2017)
4.94 4.93
5.05
4.82
4.744.77
5.17
4.92
5.18
5.01
4.94
5.01 5.01
Jun-14 Jun-15 Jun-16 Jun-17
Indonesian GDP Growth
(% of GDP)
-10
-8
-6
-4
-2
0
2
4
6
8
10
Jun-14 Jun-15 Jun-16 Jun-17
GDP Growth by Expenditure
(yoy growth, percent)
Gross… Export
Import
InvestmentHouseholdconsumption
gov't spending
-4
-2
0
2
4
6
8
Jun-14 Jun-15 Jun-16 Jun-17
Contribution to GDP Expenditure
(Contribution to real GDP Growth yoy, percent)Household Expenditure
Government SpendingInvestment
Statistic Discrepancy
-1
3
7
Jun-14 Jun-15 Jun-16 Jun-17
Contribution to GDP by Industrial Origin
(Contribution to real GDP Growth yoy, percent)ServicesFinansial, Ownership, and BusinessTransportation and CommunicationTrade, Hotel & RestaurantConstruction

Source: IHS Markit, BI, CEIC (2017)
0
100
200
300
400
500
Jun-14 Jun-15 Jun-16 Jun-17
Retail Sales Index(2010=100)
Retail Sales Index
Stationery & Communication
Food, Drinks, and Tobacco
Other Goods: Apparel
Other Goods
Household Appliances
Spare Parts & Accessories
Cultural & Recreation
Fuels
Other Goods
-10
0
10
20
43
44
45
46
47
48
49
50
51
52
53
54
Jun-14 Jun-15 Jun-16 Jun-17
Industrial production indicators
(PMI diffusion index; industrial production
growth yoy, percent)
Industrial production, RHS
Manufacturing PMI
(35)
(30)
(25)
(20)
(15)
(10)
(5)
-
5
10
15
20
Jun-14 Jun-15 Jun-16 Jun-17
Motor vehicle sales
(seasonally-adjusted sales growth yoy,
percent)
Motor Vehicle Sales
Motorcycle sales
80
90
100
110
120
130
140
Jul-14 Jul-15 Jul-16 Jul-17
Consumer Confidence Index(Index, Weighted average of 18 cities)
Consumer ConfidenceIndex
Current Economic Condition Index
Consumer Expectation Index

Growth of real average
monthly expenditure per
capita
7
0
5
10
15
20
25
01/2011 01/2012 01/2013 01/2014 01/2015 01/2016
AverageMonthlyExpenditurepercapita
AverageMonthlyExpenditureperCapita:Urban(UR)
AverageMonthlyExpenditureperCapita:Rural(RL)

Many of the Indonesian
poor are worse off than they
were 3 years ago
8
88
90
92
94
96
98
100
102
104
106
MonthlyRealWagesIndexforFarm,Construction,Barbershop,Housekeepers
LabourWages:Farmer:perDay:Real LabourWages:ConstructionWorker:perDay:Real
LabourWages:BarbershopWoman:perPerson:Real LabourWages:Housekeeper:perMonth:Real
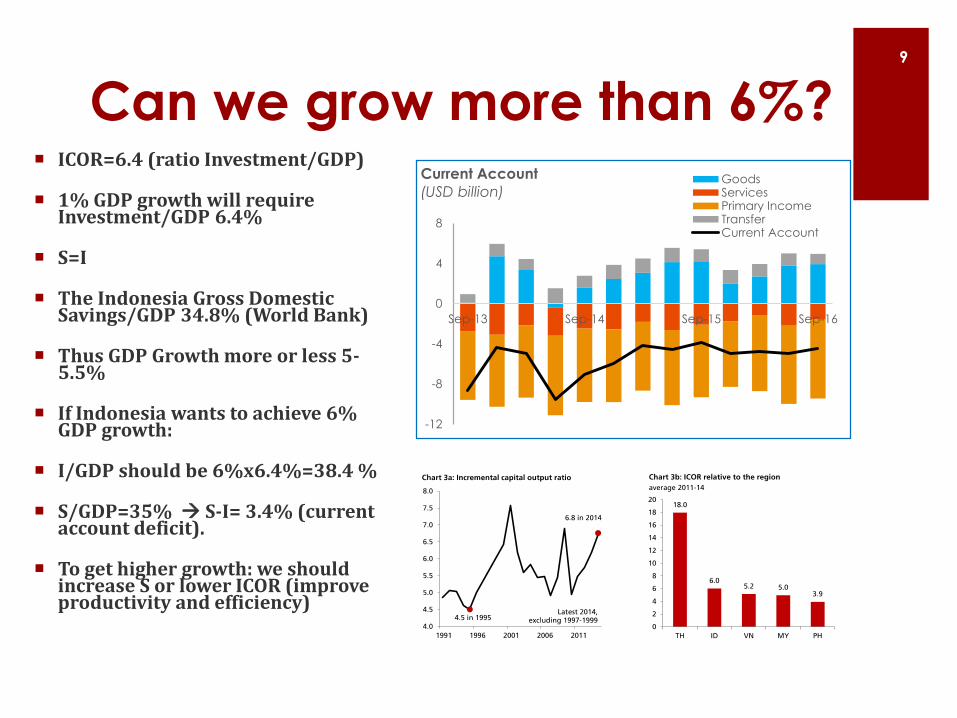
Can we grow more than 6%? ICOR=6.4 (ratio Investment/GDP)
1% GDP growth will require Investment/GDP 6.4%
S=I
The Indonesia Gross Domestic Savings/GDP 34.8% (World Bank)
Thus GDP Growth more or less 5-5.5%
If Indonesia wants to achieve 6% GDP growth:
I/GDP should be 6%x6.4%=38.4 %
S/GDP=35% S-I= 3.4% (current account deficit).
To get higher growth: we should increase S or lower ICOR (improve productivity and efficiency)
9
-12
-8
-4
0
4
8
Sep-13 Sep-14 Sep-15 Sep-16
Current Account
(USD billion)GoodsServicesPrimary IncomeTransferCurrent Account

The limit of monetary
policy?
10

Credit growth, consumption and
interest rate (Zahro, 2016, Basri
2016)
Consumption positively affect credit growth
Investment does not significantly affect credit growth.
BI rate does not significantly affect credit growth.
Fed fund rate significantly affects credit growth. When the fed fund rate goes up, credit growth falls. This also explains the role of liquidity inflow.
The short term problem is on the demand side
11
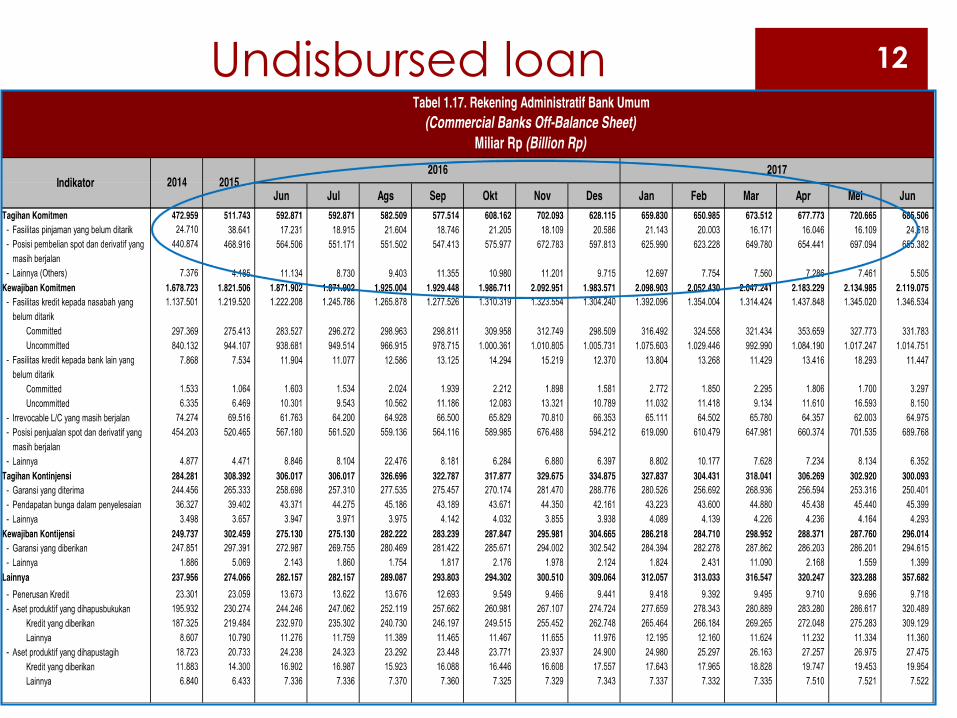
Undisbursed loan 12

Macroeconomic
coordination
Govt budget/ fiscal policy
Will fiscal policy promote growth?
13
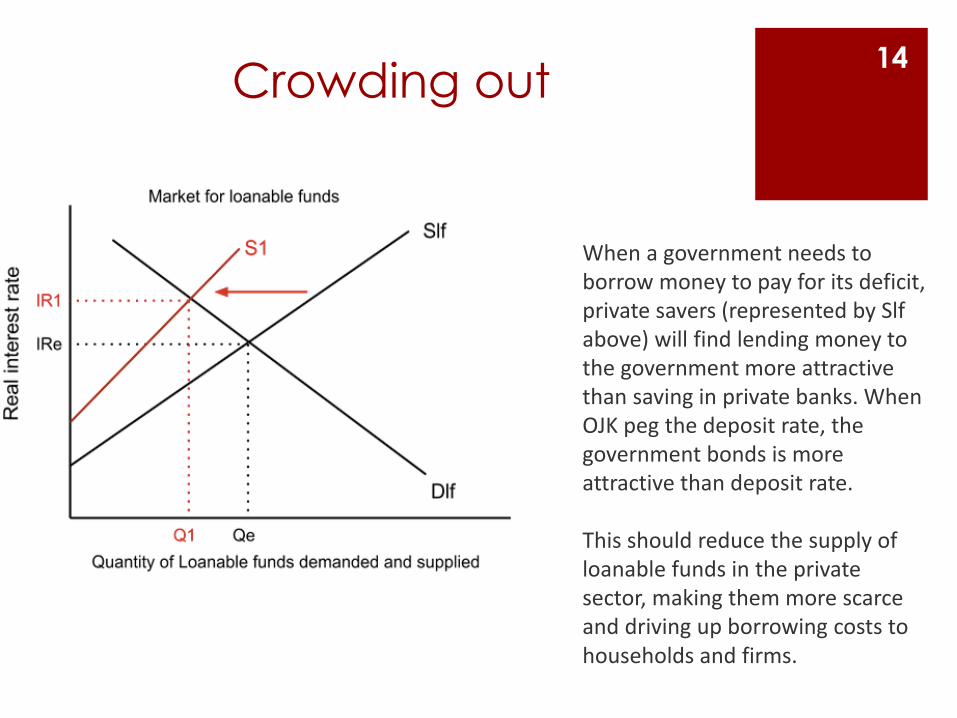
Crowding out14
When a government needs to borrow money to pay for its deficit, private savers (represented by Slf above) will find lending money to the government more attractive than saving in private banks. When OJK peg the deposit rate, the government bonds is more attractive than deposit rate.
This should reduce the supply of loanable funds in the private sector, making them more scarce and driving up borrowing costs to households and firms.

Source: CEIC (2017)*from Aug 2016 Bank Indonesia adopt 7-days repo rate as new benchmark of monetary tool
-1
0
1
2
3
4
5
6
7
8
9
Jun-14 Jun-15 Jun-16 Jun-17
Policy Rate
(percent)
Indonesia
China
United Stated
EU
Japan
0
1
2
3
4
5
0
20
40
60
80
100
May-14 May-15 May-16 May-17
Banking sector indicators
(Monthly, percent)
Non performing loans (RHS)
Return on assets (RHS)
Capital adeqacy ratio
Loan to deposit ratio
0
5
10
15
20
25
30
35
May-14 May-15 May-16 May-17
Credit Growth
(yoy growth, percent)
total credit
Consumption
Investment
Working Capital
(5)
-
5
10
15
20
25
30
May-14 May-15 May-16 May-17
Deposit Growth
(yoy growth, percent)
Third Party…
Demand Deposit
Saving DepositTime Deposit

Growth of Domestic Savings, Deposit, and
Government Bond
-
5
10
15
20
25
30
35
Q1 Q3 Q1 Q3 Q1 Q3 Q1 Q3 Q1 Q3 Q1 Q3 Q1
2011 2012 2013 2014 2015 20162017
Domestic Savings, Deposit, &
Government Bond Growth (%)
Domestic Savings
Deposit
Central Govt Debt: Government Securities
-
5
10
15
20
25
30
Q1 Q3 Q1 Q3 Q1 Q3 Q1 Q3 Q1 Q3 Q1
2012 2013 2014 2015 2016 2017
Domestic Savings, Deposit, &
Government Bond Growth –
Moving Average (%)
Domestic Savings
Deposit
Central Govt Debt: Government Securities
Source: IMF
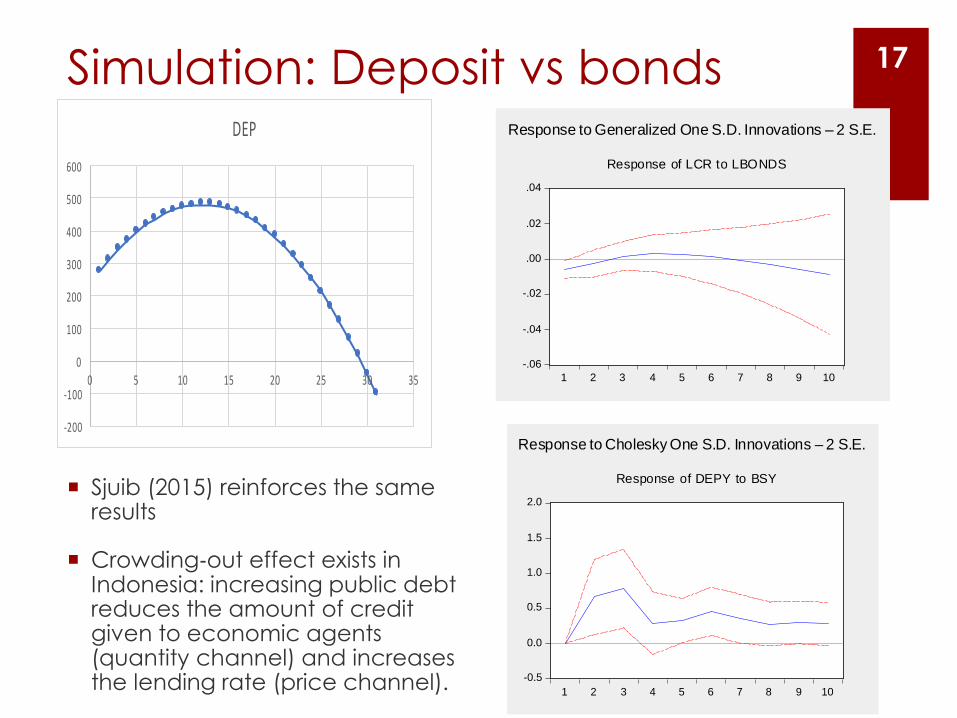
Simulation: Deposit vs bonds
Sjuib (2015) reinforces the same results
Crowding‐out effect exists in Indonesia: increasing public debt reduces the amount of credit given to economic agents (quantity channel) and increases the lending rate (price channel).
17
-200
-100
0
100
200
300
400
500
600
0 5 10 15 20 25 30 35
DEP

Budget: more realistic, but conservative
*outlook kementerian keuangan as of Agustus 2017
Realisasi APBN APBNP
Δ% dari
realisasi
2016
Outlook
realisasi*
Δ% dari
realisasi
2016
RAPBN
Δ% dari
outlook
2017
A. Pendapatan dan Hibah 1,555.8 1,750.3 1,736.0 11.6 1,736.1 11.6 1,878.4 8.2
1. Penerimaan Perpajakan 1,284.9 1,498.9 1,472.7 14.6 1,472.7 14.6 1,609.4 9.3
a. Pajak Dalam Negeri 1,249.4 1,464.8 1,436.8 15.0 1,436.7 15.0 1,570.7 9.3
i. Pajak Penghasilan 657.2 787.7 783.9 19.3 784.0 19.3 852.9 8.8
-Migas 36.1 35.9 41.8 15.7 41.8 15.7 35.9 (14.0)
-Non Migas 621.1 751.8 742.2 19.5 742.2 19.5 817.0 10.1
ii. Pajak Pertambahan Nilai 412.2 493.9 475.4 15.3 475.5 15.4 535.3 12.6
iii. Pajak Bumi dan Bangunan 19.4 17.3 15.4 (20.6) 15.4 (20.6) 17.4 12.7
iv. Cukai 143.5 157.2 153.4 6.9 153.2 6.7 155.4 1.5
v. Pajak Lainnya 17.2 8.7 8.7 (49.3) 8.7 (49.3) 9.7 11.4
b. Pajak Perdagangan Internasional 35.5 34.1 35.9 1.1 36.0 1.3 38.7 7.6
2. Penerimaan Bukan Pajak 261.9 250.0 260.2 (0.6) 260.2 (0.6) 267.9 2.9
a. Penerimaan Sumber Daya Alam 65.0 87.0 95.6 47.2 95.6 47.2 99.3 3.8
b. Bagian Laba BUMN 37.1 41.0 41.0 10.5 41.0 10.5 43.7 6.6
c. PNBP Lainnya 118.0 84.4 85.1 (27.9) 85.1 (27.9) 82.0 (3.7)
d. Pendapatan BLU 41.9 37.6 38.5 (8.1) 38.5 (8.1) 43.0 11.5
Hibah 9.0 1.4 3.1 (65.5) 3.1 (65.4) 1.2 (61.5)
B. Belanja Negara 1,864.3 2,080.5 2,133.2 14.4 2,098.9 12.6 2,204.4 5.0
I. Belanja Pemerintah Pusat 1,154.0 1,315.5 1,366.8 18.4 1,343.1 16.4 1,443.3 7.5
Belanja K/L 684.2 763.6 798.5 16.7 769.2 12.4 814.1 5.8
Belanja Non-K/L 469.8 552.0 568.3 21.0 573.9 22.1 629.2 9.6
a. 1. Pembayaran Kewajiban Utang 182.8 221.2 219.2 19.9 218.6 19.6 247.6 13.3
2.. Subsidi 174.2 160.1 168.9 (3.1) 168.9 (3.1) 172.4 2.1
a. Subsidi Energi 106.8 77.3 89.9 (15.9) 89.9 (15.9) 103.4 15.0
b. Subsidi Non Energi 67.4 82.7 79.0 17.2 79.0 17.2 69.0 (12.6)
II. Transfer ke Daerah 710.3 764.9 766.4 7.9 755.9 6.4 761.1 0.7
C. Keseimbangan Primer (308.5) (109.0) (178.0) (42.3) (144.3) (53.2) (78.4) (45.7)
D. Surplus/Defist (308.5) (330.2) (397.2) 28.8 (362.9) 17.6 (325.9) (10.2)
% of gdp (2.46) (2.41) (2.92) (2.67) (2.19)
E. Pembiayaan 331.0 330.2 397.2 20.0 362.9 9.6 325.9 (10.2)
2017 2018
URAIAN
2016
Monetary expansion in RAPBN 2018 is slightly smaller than
APBN-P 2017
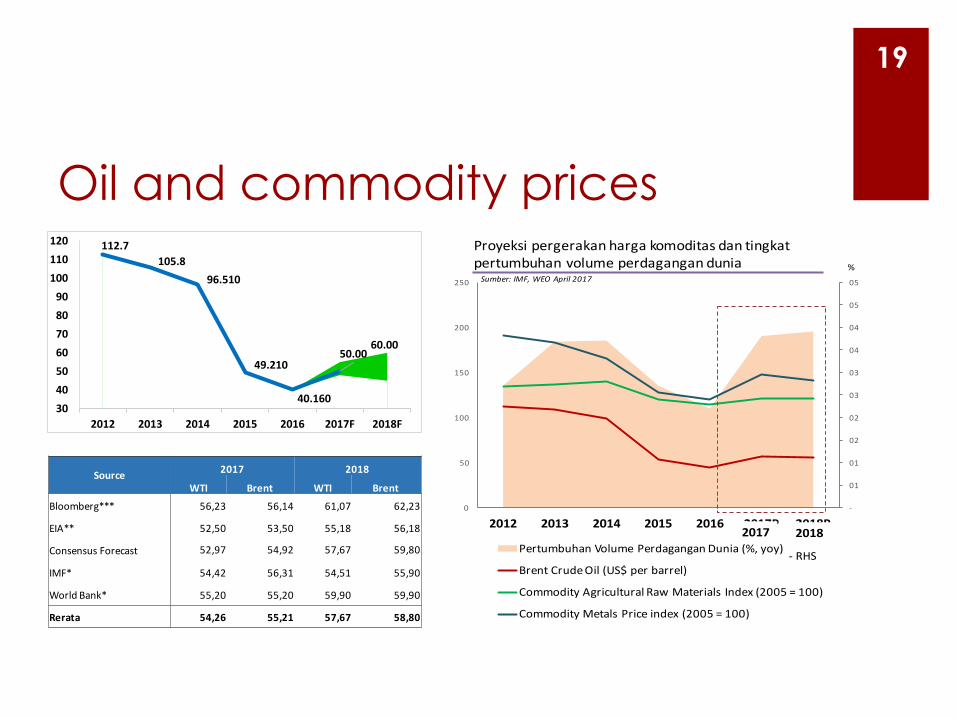
Oil and commodity prices
-
01
01
02
02
03
03
04
04
05
05
0
50
100
150
200
250
2012 2013 2014 2015 2016 2017P 2018P
PertumbuhanVolumePerdaganganDunia(%,yoy)
BrentCrudeOil(US$perbarrel)
CommodityAgriculturalRawMaterialsIndex(2005=100)
CommodityMetalsPriceindex(2005=100)
Proyeksi pergerakan harga komoditas dan tingkatpertumbuhan volumeperdagangan dunia
2017 2018
%
- RHS
Sumber:IMF,WEOApril 2017
Source2017 2018
WTI Brent WTI Brent
Bloomberg*** 56,23 56,14 61,07 62,23
EIA** 52,50 53,50 55,18 56,18
ConsensusForecast 52,97 54,92 57,67 59,80
IMF* 54,42 56,31 54,51 55,90
WorldBank* 55,20 55,20 59,90 59,90
Rerata 54,26 55,21 57,67 58,80
19
60.00
112.7
105.8
96.510
49.210
40.160
50.00
30
40
50
60
70
80
90
100
110
120
2012 2013 2014 2015 2016 2017F 2018F

Commodity prices, export and
GDPThe Movement of Commodity Prices, Exports Growth, and GDP Growth in Indonesia
-40
-20
0
20
40
60
80
020406080
100120140160180200
Jan
-94
Ap
r-9
5
Jul-
96
Oct
-97
Jan
-99
Ap
r-0
0
Jul-
01
Oct
-02
Jan
-04
Ap
r-0
5
Jul-
06
Oct
-07
Jan
-09
Ap
r-1
0
Jul-
11
Oct
-12
Jan
-14
Ap
r-1
5
Jul-
16
Commodity Prices and Indonesian Exports Growth (Monthly Data)
Energy Price Index (USD) - LHS Non-Energy Price Index (USD) - LHS
Exports Growth (Yearly, %) - RHS
-20
-15
-10
-5
0
5
10
15
0
50
100
150
200
Mar
-94
Jun
-95
Sep
-96
Dec
-97
Mar
-99
Jun
-00
Sep
-01
Dec
-02
Mar
-04
Jun
-05
Sep
-06
Dec
-07
Mar
-09
Jun
-10
Sep
-11
Dec
-12
Mar
-14
Jun
-15
Sep
-16
Commodity Prices and Indonesian GDP Growth (Quarterly Data)
Energy Price Index (USD) - LHS Non-Energy Price Index (USD) - LHS
GDP Growth (Yearly, %) - RHS
The Movement of Commodity Prices, Exports Growth, and GDP Growth in Indonesia
-40
-20
0
20
40
60
80
020406080
100120140160180200
Jan
-94
Ap
r-9
5
Jul-
96
Oct
-97
Jan
-99
Ap
r-0
0
Jul-
01
Oct
-02
Jan
-04
Ap
r-0
5
Jul-
06
Oct
-07
Jan
-09
Ap
r-1
0
Jul-
11
Oct
-12
Jan
-14
Ap
r-1
5
Jul-
16
Commodity Prices and Indonesian Exports Growth (Monthly Data)
Energy Price Index (USD) - LHS Non-Energy Price Index (USD) - LHS
Exports Growth (Yearly, %) - RHS
-20
-15
-10
-5
0
5
10
15
0
50
100
150
200
Mar
-94
Jun
-95
Sep
-96
Dec
-97
Mar
-99
Jun
-00
Sep
-01
Dec
-02
Mar
-04
Jun
-05
Sep
-06
Dec
-07
Mar
-09
Jun
-10
Sep
-11
Dec
-12
Mar
-14
Jun
-15
Sep
-16
Commodity Prices and Indonesian GDP Growth (Quarterly Data)
Energy Price Index (USD) - LHS Non-Energy Price Index (USD) - LHS
GDP Growth (Yearly, %) - RHS
20

Commodity and energy prices:
impact on GDP growth
-2
-1
0
1
2
3
4
1 2 3 4 5 6 7 8 9 10 11 12
Response of REAL_GDP_GROW TH to REAL_GDP_GROW TH
-2
-1
0
1
2
3
4
1 2 3 4 5 6 7 8 9 10 11 12
Response of REAL_GDP_GROW TH to ENERGY_PRICE_INDEX__USD_
-2
-1
0
1
2
3
4
1 2 3 4 5 6 7 8 9 10 11 12
Response of REAL_GDP_GROWTH to NON_ENERGY_PRICE_INDEX__
-10
-5
0
5
10
15
20
1 2 3 4 5 6 7 8 9 10 11 12
Response of ENERGY_PRICE_INDEX__USD_ to REAL_GDP_GROW TH
-10
-5
0
5
10
15
20
1 2 3 4 5 6 7 8 9 10 11 12
Response of ENERGY_PRICE_INDEX__USD_ to ENERGY_PRICE_INDEX__USD_
-10
-5
0
5
10
15
20
1 2 3 4 5 6 7 8 9 10 11 12
Response of ENERGY_PRICE_INDEX__USD_ to NON_ENERGY_PRICE_INDEX__
-4
0
4
8
12
1 2 3 4 5 6 7 8 9 10 11 12
Response of NON_ENERGY_PRICE_INDEX__ to REAL_GDP_GROW TH
-4
0
4
8
12
1 2 3 4 5 6 7 8 9 10 11 12
Response of NON_ENERGY_PRICE_INDEX__ to ENERGY_PRICE_INDEX__USD_
-4
0
4
8
12
1 2 3 4 5 6 7 8 9 10 11 12
Response of NON_ENERGY_PRICE_INDEX__ to NON_ENERGY_PRICE_INDEX__
Response to Cholesky One S.D. Innovations ± 2 S.E.
IV. Impulse Response Function of Commodity Prices to Real GDP
Variables: Index of Energy and Non-Energy Price, and GDP in Constant Price (Quarterly Data)
IV. Impulse Response Function of Commodity Prices to Real GDP Growth
Variables: Index of Energy and Non-Energy Price, and Real GDP Growth (Quarterly Data)
-20,000
0
20,000
40,000
60,000
1 2 3 4 5 6 7 8 9 10 11 12
Response of REAL_GDP to REAL_GDP
-20,000
0
20,000
40,000
60,000
1 2 3 4 5 6 7 8 9 10 11 12
Response of REAL_GDP to ENERGY_PRICE_INDEX__USD_
-20,000
0
20,000
40,000
60,000
1 2 3 4 5 6 7 8 9 10 11 12
Response of REAL_GDP to NON_ENERGY_PRICE_INDEX__
-10
-5
0
5
10
15
20
1 2 3 4 5 6 7 8 9 10 11 12
Response of ENERGY_PRICE_INDEX__USD_ to REAL_GDP
-10
-5
0
5
10
15
20
1 2 3 4 5 6 7 8 9 10 11 12
Response of ENERGY_PRICE_INDEX__USD_ to ENERGY_PRICE_INDEX__USD_
-10
-5
0
5
10
15
20
1 2 3 4 5 6 7 8 9 10 11 12
Response of ENERGY_PRICE_INDEX__USD_ to NON_ENERGY_PRICE_INDEX__
-2
0
2
4
6
8
10
1 2 3 4 5 6 7 8 9 10 11 12
Response of NON_ENERGY_PRICE_INDEX__ to REAL_GDP
-2
0
2
4
6
8
10
1 2 3 4 5 6 7 8 9 10 11 12
Response of NON_ENERGY_PRICE_INDEX__ to ENERGY_PRICE_INDEX__USD_
-2
0
2
4
6
8
10
1 2 3 4 5 6 7 8 9 10 11 12
Response of NON_ENERGY_PRICE_INDEX__ to NON_ENERGY_PRICE_INDEX__
Response to Cholesky One S.D. Innovations ± 2 S.E.
-20,000
0
20,000
40,000
60,000
1 2 3 4 5 6 7 8 9 10 11 12
Response of REAL_GDP to REAL_GDP
-20,000
0
20,000
40,000
60,000
1 2 3 4 5 6 7 8 9 10 11 12
Response of REAL_GDP to ENERGY_PRICE_INDEX__USD_
-20,000
0
20,000
40,000
60,000
1 2 3 4 5 6 7 8 9 10 11 12
Response of REAL_GDP to NON_ENERGY_PRICE_INDEX__
-10
-5
0
5
10
15
20
1 2 3 4 5 6 7 8 9 10 11 12
Response of ENERGY_PRICE_INDEX__USD_ to REAL_GDP
-10
-5
0
5
10
15
20
1 2 3 4 5 6 7 8 9 10 11 12
Response of ENERGY_PRICE_INDEX__USD_ to ENERGY_PRICE_INDEX__USD_
-10
-5
0
5
10
15
20
1 2 3 4 5 6 7 8 9 10 11 12
Response of ENERGY_PRICE_INDEX__USD_ to NON_ENERGY_PRICE_INDEX__
-2
0
2
4
6
8
10
1 2 3 4 5 6 7 8 9 10 11 12
Response of NON_ENERGY_PRICE_INDEX__ to REAL_GDP
-2
0
2
4
6
8
10
1 2 3 4 5 6 7 8 9 10 11 12
Response of NON_ENERGY_PRICE_INDEX__ to ENERGY_PRICE_INDEX__USD_
-2
0
2
4
6
8
10
1 2 3 4 5 6 7 8 9 10 11 12
Response of NON_ENERGY_PRICE_INDEX__ to NON_ENERGY_PRICE_INDEX__
Response to Cholesky One S.D. Innovations ± 2 S.E.
A standard deviation shock in energy price
increases real GDP in the second quarter and the
effect continue to increase until more than 12
quarters/ 3 years.
A standard deviation shock in non-energy price
increases real GDP in the third quarter and the
same effect persists until the 12th quarter/ for 3
years.
A standard deviation shock in energy price
increases real GDP growth slightly in the 3rd
quarter, moving slightly more upward until 4th – 5th
quarter and continue to persist for 12 quarters/ 3
years.
-2
-1
0
1
2
3
4
1 2 3 4 5 6 7 8 9 10 11 12
Response of REAL_GDP_GROWTH to REAL_GDP_GROWTH
-2
-1
0
1
2
3
4
1 2 3 4 5 6 7 8 9 10 11 12
Response of REAL_GDP_GROWTH to ENERGY_PRICE_INDEX__USD_
-2
-1
0
1
2
3
4
1 2 3 4 5 6 7 8 9 10 11 12
Response of REAL_GDP_GROWTH to NON_ENERGY_PRICE_INDEX__
-10
-5
0
5
10
15
20
1 2 3 4 5 6 7 8 9 10 11 12
Response of ENERGY_PRICE_INDEX__USD_ to REAL_GDP_GROWTH
-10
-5
0
5
10
15
20
1 2 3 4 5 6 7 8 9 10 11 12
Response of ENERGY_PRICE_INDEX__USD_ to ENERGY_PRICE_INDEX__USD_
-10
-5
0
5
10
15
20
1 2 3 4 5 6 7 8 9 10 11 12
Response of ENERGY_PRICE_INDEX__USD_ to NON_ENERGY_PRICE_INDEX__
-4
0
4
8
12
1 2 3 4 5 6 7 8 9 10 11 12
Response of NON_ENERGY_PRICE_INDEX__ to REAL_GDP_GROWTH
-4
0
4
8
12
1 2 3 4 5 6 7 8 9 10 11 12
Response of NON_ENERGY_PRICE_INDEX__ to ENERGY_PRICE_INDEX__USD_
-4
0
4
8
12
1 2 3 4 5 6 7 8 9 10 11 12
Response of NON_ENERGY_PRICE_INDEX__ to NON_ENERGY_PRICE_INDEX__
Response to Cholesky One S.D. Innovations ± 2 S.E.
A standard deviation shock in non-energy price
increases real GDP growth in the 2nd quarter and it
peaks at 4th quarter/ after a year. The effect
decreases eventually until it goes back to the
previous value at the 8th- 9th quarter or after 2
years.
21

Challenges to the future
22

New normal growth?
Success story of East Asia: Industrialization and
trade
A world with creeping protectionism
Services is not a perfect substitute to
manufacturing
23

Why services are not like manufactures
Taken from Dani Rodrik (2014)
High-productivity (tradable) services
sector cannot absorb as much labor
Preimum skill-intensive
Requires good institution
Low productivity (non-tradable) services cannot
act as growth poles
since they cannot expand without turning their terms
of trade against themselves
continued expansion in one segment relies on
expansion on others
limited gains from sectoral “winners”
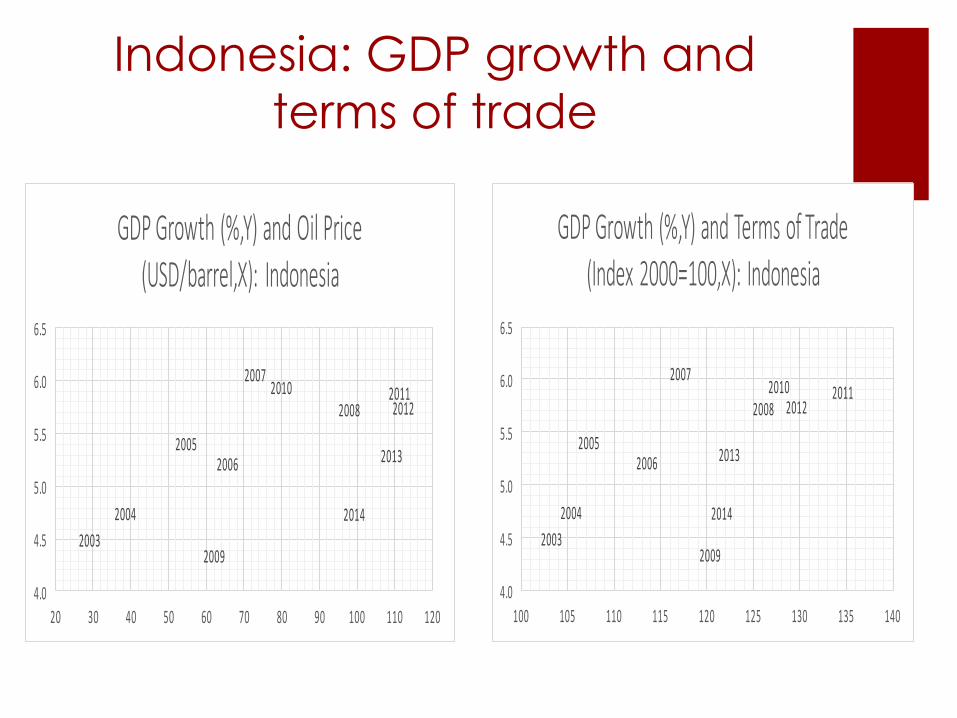
Indonesia: GDP growth and
terms of trade
2003
2004
20052006
2007
2008
2009
2010 20112012
2013
2014
4.0
4.5
5.0
5.5
6.0
6.5
20 30 40 50 60 70 80 90 100 110 120
GDPGrowth(%,Y)andOilPrice(USD/barrel,X):Indonesia
2003
2004
20052006
2007
2008
2009
2010 20112012
2013
2014
4.0
4.5
5.0
5.5
6.0
6.5
100 105 110 115 120 125 130 135 140
GDPGrowth(%,Y)andTermsofTrade(Index2000=100,X):Indonesia
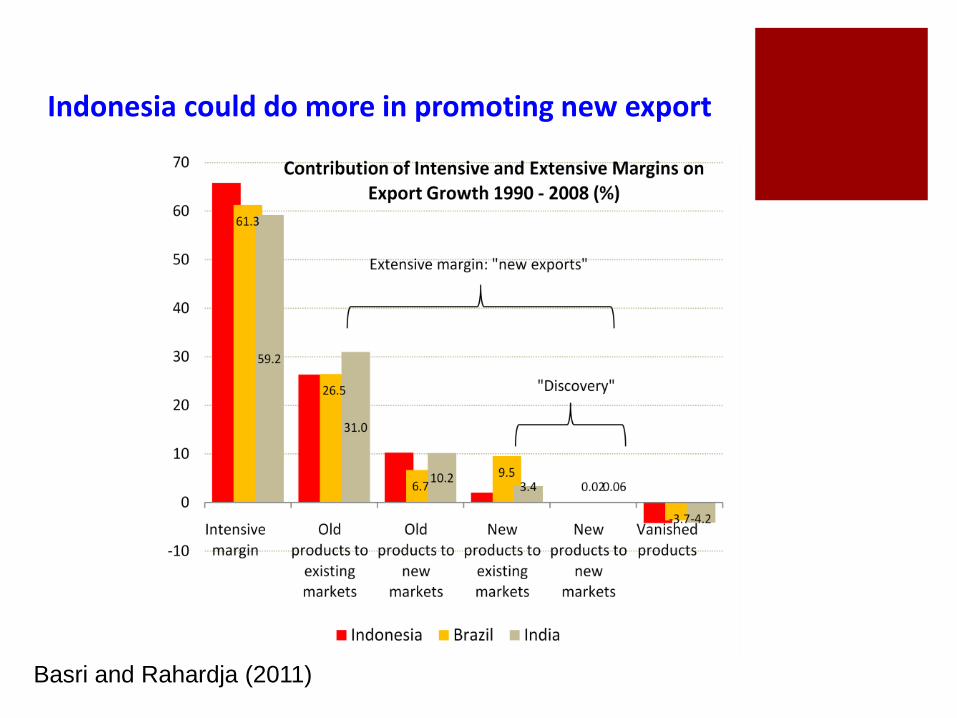
Indonesia could do more in promoting new export
Basri and Rahardja (2011)

Growth of manufactured
exports, 2002-2016
Indon
esia
Vietn
amIndia Kenya
Bangl
adeshPeru
Thaila
nd
Growth 2002-2016 136% 1631% 558% 440% 525% 295% 262%
Value 2016, bn $69 $143 $198 $3 $35 $5 $181
0%250%500%750%
1000%1250%1500%
Taken from Papanek, 2017
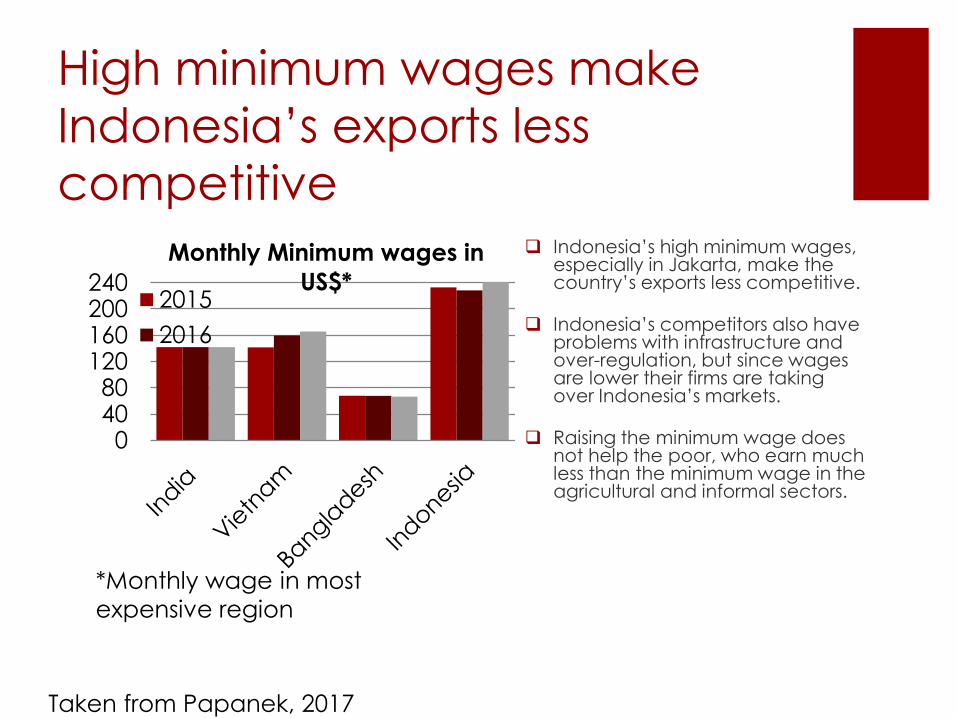
High minimum wages make
Indonesia’s exports less
competitive Indonesia’s high minimum wages,
especially in Jakarta, make the country’s exports less competitive.
Indonesia’s competitors also have problems with infrastructure and over-regulation, but since wages are lower their firms are taking over Indonesia’s markets.
Raising the minimum wage does not help the poor, who earn much less than the minimum wage in the agricultural and informal sectors.
04080
120160200240
Monthly Minimum wages in
US$*2015
2016
*Monthly wage in most
expensive region
Taken from Papanek, 2017

Export volatility and
concentrationFigure 8: Export volatility and concentration in medium & high tech manufacturing
Figure 9: Export Volatility and concentration in resource based manufacturing

Development challenges are
beyond macro-stability
30
Brazil China India Indonesia Malaysia Philippines Thailand Vietnam
Characteristics (2013)
Population (person mn) 200.4 1,357.4
1,252.
1 249.9 29.7 98.4 67.0 89.7
GDP Per Capita (in PPP, USD) 5,823 3,583 1,165 1,810 6,998 1,581 3,438 1,029
Density (person/sq km) 24.0 144.6 421.1 137.9 90.4 330.0 131.2 289.3
Real Exchange Rate Movement (%)
2003-2013 (average 68.3 31.4 -0.3 6.4 2.5 39.2 25.0 50.9
PISA Test Score (2012)
Math 391 613 351* 375 421 427 511
Science 406 580 348* 382 420 438 528
Broadband Penetration
Fixed (wired)-broadband
subscriptions per 100 inhabitants
(2013)
10.08 13.36 1.16 1.3 8.22 9.12 7.36 5.62
Logistics Performance Index (2014) 2.94 3.53 3.08 3.08 3.59 3.00 3.43 3.15
Percentage of shipment met quality 82 76 67 70 97 71 83 76
Government effectiveness score -0.08 -0.03 -0.19 -0.24 1.10 0.06 0.21 -0.30* Tamil Nadu dan Himachal Pradesh Sources: World Bank, ITU, BIIS and others

Thank you
31


