Download - Mahindra Finance 070415 - IndiaInfoline
Sector: Financials
Sector view: Positive
Sensex: 28,504
52 Week h/l (Rs): 345/230
Market cap (Rscr) : 15,283
6m Avg vol (‘000Nos): 2,089
Bloomberg code: MMFS
BSE code: 532720
NSE code: M&MFIN
FV (Rs): 2
Price as on April 06, 2015
Company rating grid
Low High
1 2 3 4 5
Earnings Growth
RoA Progression
B/S Strength
Valuation appeal
Risk
Share price trend
70
100
130
160
Apr‐14 Aug‐14 Nov‐14 Mar‐15
MMFS Sensex
Share holding pattern (%) Jun‐14 Sep‐14 Dec‐14
Promoter 52.1 52.1 52.1
Insti 42.6 42.6 43.3
Others 5.3 5.3 4.6
Rating: AccumulateTarget (12‐month): Rs303
CMP: Rs268
Upside: 13.1%
Research Analyst: Rajiv Mehta
Akshay Dalmia [email protected]
Mahindra & Mahindra Finance
Company Report
April 07, 2015
This report is published by IIFL ‘India Private Clients’ research desk. IIFL has other business units with independent research teams separated by 'Chinese walls' catering to different sets of customers having varying objectives, risk profiles, investment horizon, etc. The views and opinions expressed in this document may at times be contrary in terms of rating, target prices, estimates and views on sectors and markets.
Waiting for good times!
Our interaction with MMFS did not inspire any confidence with respect to a significant recovery in asset growth and asset quality in FY16. Contrary to the wide perception of economy being on the mend, the company is yet to spot any tangible signs of recovery in its end market (vehicle sales in rural and semi urban market). Management believes that any macro level recovery though would ease pressure on the asset quality promptly will only impact asset growth with a lag given substantial unabsorbed capacity in the market. Thus, we forecast a modest 14% AUM CAGR over FY15‐17, much lower than 35% CAGR witnessed during FY10‐14. The key drivers would be the upcoming monsoon (expected to be normal) and the extent of revival in infra and industrial activity. Beyond FY17, growth recovery could be prominent as MMFS has substantially invested in deepening its network over the past 18 months.
While the incremental stress on asset quality is likely to stabilize in coming quarters, the Gross NPL ratio could inch‐up due to further deceleration in asset growth. Also with customer cash flows remaining stressed, even the intense collection and recovery effort by MMFS is unlikely to drive material correction in NPL situation. Further, shift to 90dpd NPL recognition by FY18 could partially offset the cyclical easing in asset quality ratios. So though credit cost would moderate from current high levels, it will be elevated in comparison to history.
RoA is expected to recover from the current cyclical low of 2%. Apart from a decline in credit cost, expansion in NIM would be a major contributor to profitability recovery. Easing of funding cost and lower amount of interest reversals would improve margin over the medium term. RoE is estimated to reach 18% in FY17 and with asset growth remaining moderate over FY14‐17, the company is unlikely to resort to equity issuance.
Over the past 12 months, MMFS has significantly underperformed the market and peers and justifiably so, as the period was very stressful and near term outlook has not been improving too. However, the inherent business franchise has not been undermined and remains extremely robust which would be manifested again when the rural economy starts turning around. We recommend to Accumulate MMFS with a 12‐month price target of Rs303. Financial summary Y/e 31 Mar (Rs cr) FY14 FY15E FY16E FY17E
Total operating income 2,765 2,974 3,415 4,176
Yoy growth (%) 21.5 7.6 14.8 22.3
Operating profit (pre‐provisions) 1,852 1,946 2,233 2,770
Net profit 887 693 883 1,217
yoy growth (%) 0.5 (21.9) 27.4 37.9
EPS (Rs) 15.7 12.3 15.7 21.6
Adj. BVPS (Rs) 80.2 81.6 95.3 110.8
P/E (x) 17.0 21.8 17.1 12.4
P/Adj.BV (x) 3.3 3.3 2.8 2.4
ROE (%) 18.6 13.0 14.9 18.2
ROA (%) 3.1 2.1 2.4 2.8 Source: Company, India Infoline Research
Mahindra & Mahindra Finance Ltd.
2
Weak farm cycle and lackluster commercial activity weighing on growth Predominantly linked to the health of the rural and semi‐urban economy, MMFS’s AUM growth has witnessed a steep slowdown over the past couple of years. The end market for the company has been impacted by a) below average monsoon that delayed sowing and impacted the overall crop yield b) no major improvement in MSPs c) decline in prices of some crops and grains in certain states and d) lower commercial and economic activity. Apart from vehicle sales growth being weak in rural belt, the increase in price discounts has impacted MMFS’s disbursement growth. Thus even if the business volumes were similar, the disbursement would represent a de‐growth. Nearly 20% of MMFS’s AUM is directly linked to farm incomes but there is high indirect linkage as typically a crop failure impacts agri‐related activity and spending ability and habits of rural population (tend to save for bad times). About 90‐95% of company’s 1088 branches are located in the rural and semi‐urban areas.
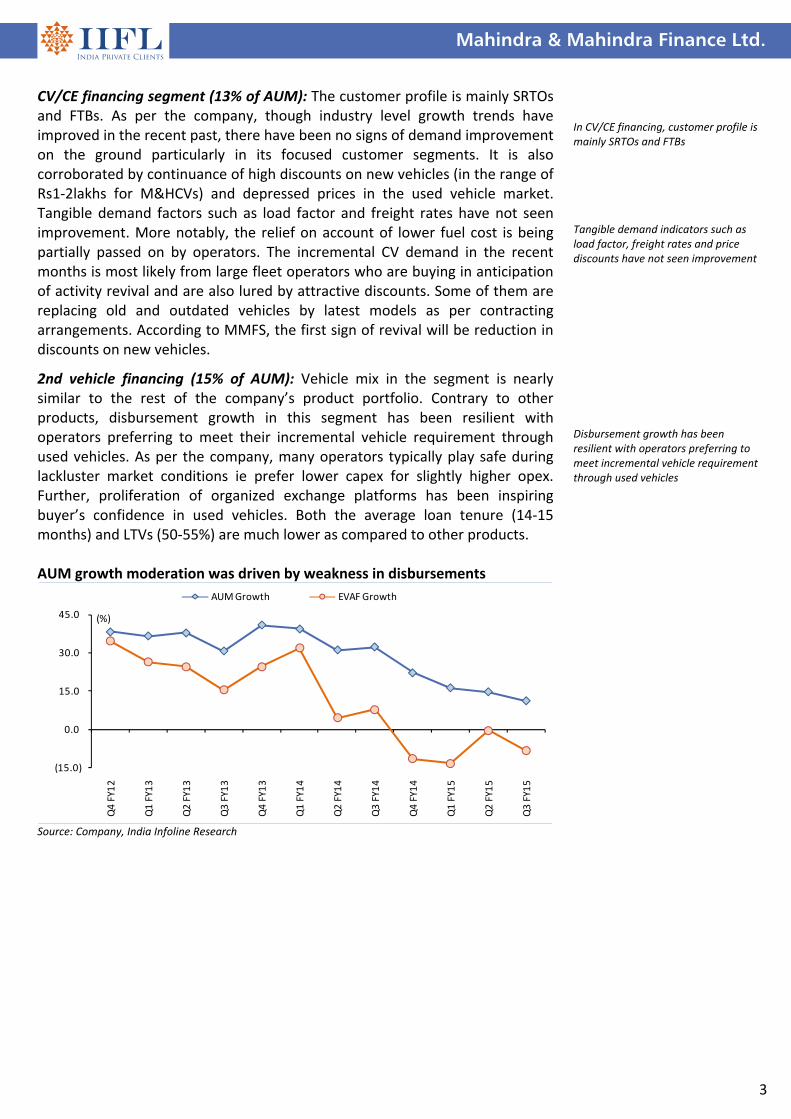
Company’s disbursements in 9m FY15 de‐grew by 8% yoy with all products segments except for second‐hand vehicle financing witnessing a decline in new business generation. Notwithstanding the swift trend reversal in disbursement growth since the start of FY13, AUM growth is in positive zone (but has come‐off sharply) courtesy longer tenure of the portfolio and still reasonable amount of disbursements which are higher than repayments.
UV financing segment (30% of AUM): About 80% of the volumes financed here are M&M vehicles which largely comprise of Bolero and pick‐ups having a significant rural market. Though M&M’s market share in the overall UV industry has fallen to 38‐40%, MMFS’s business volumes have not been significantly impacted as M&M’s rural product portfolio growth has been resilient. The market share loss for the company has been mainly in the urban market where MMFS exposure is low. MMFS’s representative market share in M&M volumes has been stable over the past few years.
Tractor financing segment (19% of AUM): Within the segment, 80‐85% of the volume financed is M&M tractors. In the overall tractor market, M&M’s share stands at 40‐41%. MMFS has a market share of 30‐35% in M&M tractor sales which has been largely stable. At the industry level, MMFS’s market share is 14‐15% with SBI and Magma being closest competitors with individual share of 8‐9%. As per the company, about 50‐60% of the tractors financed are for farm applications while the rest are used for other purposes. MMFS expects tractor industry volumes to continue to de‐grow in coming months but at a slower pace.
Car financing segment (23% of AUM): Entry‐level Maruti and Hyundai cars make up 75‐80% of volumes in this segment. With slowdown in rural consumption and weakness in farm income, MMFS has been witnessing a decline in business volume contrary to growth at the overall industry level. In the past two years, the industry volume growth has been mainly driven by urban centric and mid‐level products where company has a low exposure. MMFS’s market share in overall Maruti volumes is at 8‐10%.
AUM growth has witnessed a steep slowdown over the past couple of years Apart from vehicle sales being weak in rural belt, increase in price discounts has impacted disbursement growth ~90‐95% of co’s branches are located in the rural and semi‐urban areas Disbursements in 9m FY15 de‐grew by 8% yoy About 80% of UVs financed are M&M vehicles MMFS’s representative market share in M&M volumes has been stable over the past few years About 80‐85% of tractors financed are M&M tractors MMFS has a share of 30‐35% in M&M tractor sales which has been largely steady Entry‐level Maruti and Hyundai cars make up 75‐80% of MMFS’ car financing volumes
Mahindra & Mahindra Finance Ltd.
3
CV/CE financing segment (13% of AUM): The customer profile is mainly SRTOs and FTBs. As per the company, though industry level growth trends have improved in the recent past, there have been no signs of demand improvement on the ground particularly in its focused customer segments. It is also corroborated by continuance of high discounts on new vehicles (in the range of Rs1‐2lakhs for M&HCVs) and depressed prices in the used vehicle market. Tangible demand factors such as load factor and freight rates have not seen improvement. More notably, the relief on account of lower fuel cost is being partially passed on by operators. The incremental CV demand in the recent months is most likely from large fleet operators who are buying in anticipation of activity revival and are also lured by attractive discounts. Some of them are replacing old and outdated vehicles by latest models as per contracting arrangements. According to MMFS, the first sign of revival will be reduction in discounts on new vehicles.
2nd vehicle financing (15% of AUM): Vehicle mix in the segment is nearly similar to the rest of the company’s product portfolio. Contrary to other products, disbursement growth in this segment has been resilient with operators preferring to meet their incremental vehicle requirement through used vehicles. As per the company, many operators typically play safe during lackluster market conditions ie prefer lower capex for slightly higher opex. Further, proliferation of organized exchange platforms has been inspiring buyer’s confidence in used vehicles. Both the average loan tenure (14‐15 months) and LTVs (50‐55%) are much lower as compared to other products. AUM growth moderation was driven by weakness in disbursements
(15.0)
0.0
15.0
30.0
45.0
Q4 FY12
Q1 FY13
Q2 FY13
Q3 FY13
Q4 FY13
Q1 FY14
Q2 FY14
Q3 FY14
Q4 FY14
Q1 FY15
Q2 FY15
Q3 FY15
(%)
AUM Growth EVAF Growth
Source: Company, India Infoline Research
In CV/CE financing, customer profile is mainly SRTOs and FTBs Tangible demand indicators such as load factor, freight rates and price discounts have not seen improvement Disbursement growth has been resilient with operators preferring to meet incremental vehicle requirement through used vehicles
Mahindra & Mahindra Finance Ltd.
4
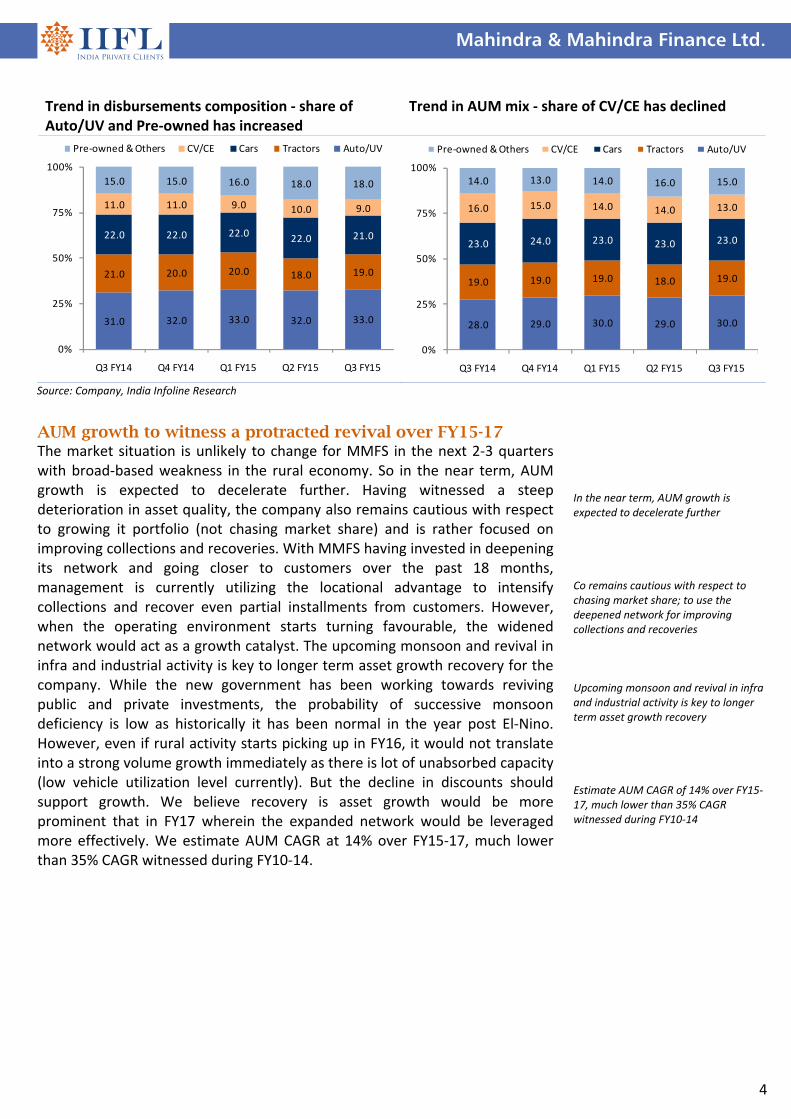
Trend in disbursements composition ‐ share of Auto/UV and Pre‐owned has increased
Trend in AUM mix ‐ share of CV/CE has declined
31.0 32.0 33.0 32.0 33.0
21.0 20.0 20.0 18.0 19.0
22.0 22.0 22.0 22.0 21.0
11.0 11.0 9.0 10.0 9.0
15.0 15.0 16.0 18.0 18.0
0%
25%
50%
75%
100%
Q3 FY14 Q4 FY14 Q1 FY15 Q2 FY15 Q3 FY15
Pre‐owned & Others CV/CE Cars Tractors Auto/UV
28.0 29.0 30.0 29.0 30.0
19.0 19.0 19.0 18.0 19.0
23.0 24.0 23.0 23.0 23.0
16.0 15.0 14.0 14.0 13.0
14.0 13.0 14.0 16.0 15.0
0%
25%
50%
75%
100%
Q3 FY14 Q4 FY14 Q1 FY15 Q2 FY15 Q3 FY15
Pre‐owned & Others CV/CE Cars Tractors Auto/UV
Source: Company, India Infoline Research
AUM growth to witness a protracted revival over FY15-17 The market situation is unlikely to change for MMFS in the next 2‐3 quarters with broad‐based weakness in the rural economy. So in the near term, AUM growth is expected to decelerate further. Having witnessed a steep deterioration in asset quality, the company also remains cautious with respect to growing it portfolio (not chasing market share) and is rather focused on improving collections and recoveries. With MMFS having invested in deepening its network and going closer to customers over the past 18 months, management is currently utilizing the locational advantage to intensify collections and recover even partial installments from customers. However, when the operating environment starts turning favourable, the widened network would act as a growth catalyst. The upcoming monsoon and revival in infra and industrial activity is key to longer term asset growth recovery for the company. While the new government has been working towards reviving public and private investments, the probability of successive monsoon deficiency is low as historically it has been normal in the year post El‐Nino. However, even if rural activity starts picking up in FY16, it would not translate into a strong volume growth immediately as there is lot of unabsorbed capacity (low vehicle utilization level currently). But the decline in discounts should support growth. We believe recovery is asset growth would be more prominent that in FY17 wherein the expanded network would be leveraged more effectively. We estimate AUM CAGR at 14% over FY15‐17, much lower than 35% CAGR witnessed during FY10‐14.
In the near term, AUM growth is expected to decelerate further Co remains cautious with respect to chasing market share; to use the deepened network for improving collections and recoveries Upcoming monsoon and revival in infra and industrial activity is key to longer term asset growth recovery Estimate AUM CAGR of 14% over FY15‐17, much lower than 35% CAGR witnessed during FY10‐14

Mahindra & Mahindra Finance Ltd.
5
Revival in disbursements to improve asset growth
35.3
22.2
6.5
(8.0)
14.0
25.0
38.2 40.8
22.3
10.0 12.0
20.0
(10.0)
0.0
10.0
20.0
30.0
40.0
50.0
FY12 FY13 FY14 FY15E FY16E FY17E
(%)
EVAF Growth AUM Growth
Source: Company, India Infoline Research NIM to recover significantly by FY17 MMFS’s NIM has been substantially dented in the recent quarters by income reversals on NPLs (during 9m FY15 at close to Rs200cr). But with cost of funding easing and incremental NPL stress likely to abate in the medium term, company’s NIM is expected to improve. While the company is yet to witness any reduction in the cost of bank borrowings (46% of total borrowings), the incremental cost of bond borrowings has declined significantly over the past 6‐9 months. Currently, the incremental cost of 3‐5 year NCDs (8.7‐8.8%) stands more than 125bps lower than bank borrowings. Therefore, MMFS intends to meet large portion of its incremental funding requirement (including renewals) through NCDs. Abundant liquidity in the bond market should aid this cause. The share of NCDs in total borrowings is expected to rise to 25‐26% over the coming 12 months from current 21%. As we also expect commercial banks to start cutting their Base Rate soon, the cost of bank funding should also start declining. All of MMFS’s term loans are linked to Base Rate of the lending banks, thus the entire portfolio would get re‐priced lower with immediate effect on a cut. As per the management, there is no pressure on MMFS’s long‐term credit rating despite depressed profitability performance and increase in Gross NPLs since the start of FY14. While the company does not plan to raise rate in any of the product segments, it is also unwilling to pass on the benefits of lower cost of funds to borrowers in the wake of challenging credit environment. We estimate NIM (based on our computation) to improve from 8% in FY15 to 8.7% in FY17.
Income reversals on NPLs substantially dented NIMs in recent quarters Incremental cost of bond borrowings has declined significantly over the past 6‐9 months Expect commercial banks to start cutting Base Rate soon As per the management, there is no pressure on MMFS’s long‐term credit rating

Mahindra & Mahindra Finance Ltd.
6
Spread/NIM was impacted by substantial increase in delinquencies
While funding cost was largely stable, income yield declined notably
7.0
8.0
9.0
10.0
11.0
Q4 FY12
Q1 FY13
Q2 FY13
Q3 FY13
Q4 FY13
Q1 FY14
Q2 FY14
Q3 FY14
Q4 FY14
Q1 FY15
Q2 FY15
Q3 FY15
(%)
Gross Spread NIM (Computed)
6.0
9.0
12.0
15.0
18.0
Q4 FY12
Q1 FY13
Q2 FY13
Q3 FY13
Q4 FY13
Q1 FY14
Q2 FY14
Q3 FY14
Q4 FY14
Q1 FY15
Q2 FY15
Q3 FY15
(%)
Income Yield Cost of Funds
Source: Company, India Infoline Research
Well‐diversified borrowing franchise NIM (computed) to improve significantly in longer term
49.5 54.5 50.3 48.6 46.4
21.0 22.0
20.6 18.7 21.3
13.0 13.6
15.1 15.8 16.4
10.8 0.2 5.6 9.3 9.4
5.7 9.8 8.4 7.6 6.5
0%
25%
50%
75%
100%
Q3 FY14 Q4 FY14 Q1 FY15 Q2 FY15 Q3 FY15
Assignment CP/ICD FD NCD Bank TLs
10.2
9.3 9.2
8.6
8.0 8.3
8.7
6.0
7.0
8.0
9.0
10.0
11.0
FY11 FY12 FY13 FY14 FY15E FY16E FY17E
(%)
Source: Company, India Infoline Research
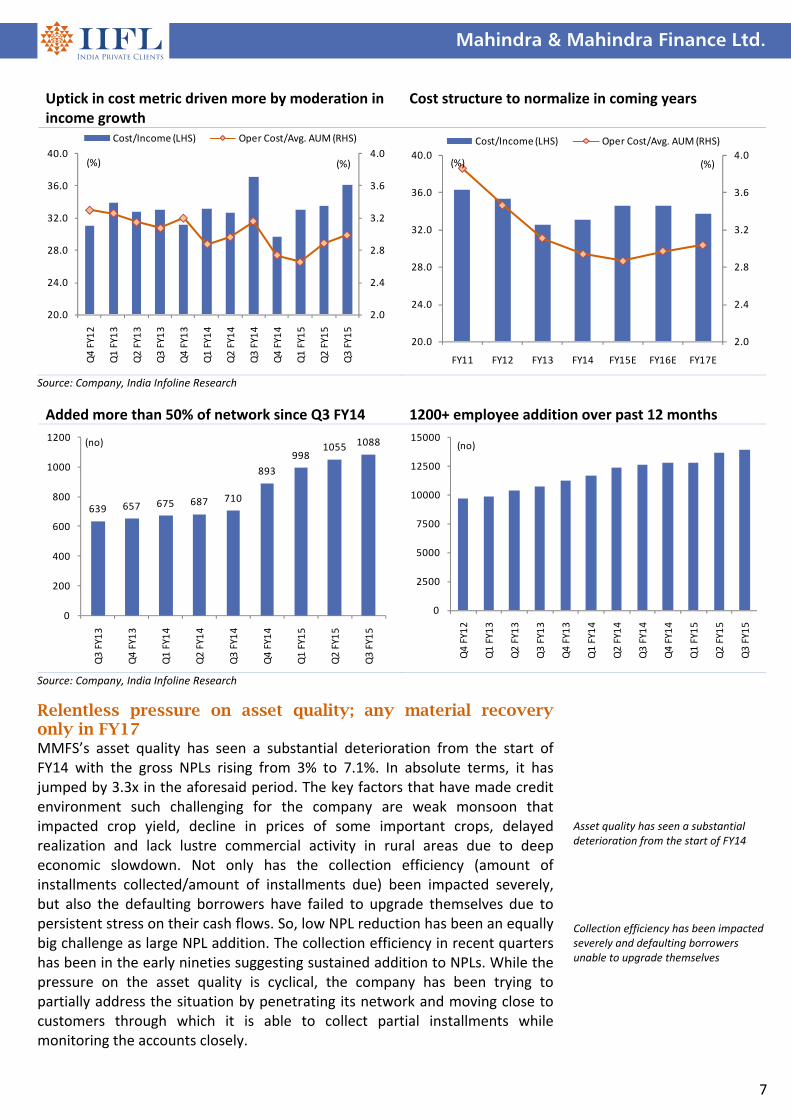
Cost/income ratio unlikely to improve in the near term In the wake of significant stress on the asset quality, MMFS has stepped up its efforts towards recoveries and collections. The company has substantially ramped its network and employee base; since the start of FY15, MMFS has added 195 centers and 1000+ employees to penetrate deeper into regions and move close to the borrowers. Notwithstanding these investments, the opex growth has been contained at modest 10% yoy in 9m FY15 due to a) cost control b) lower expenses that are directly related to business generation (incentives, commissions, etc) 3) smaller size of the new branches (minimal staffing with lower opex). It is only when the credit situation starts to improve, would the company be willing to chase growth and that will drive operating leverage and a decline in the cost/income ratio from the current level of 34‐35%.
Cost control, small size of new branches and lower variable costs has kept cost metric in check
Mahindra & Mahindra Finance Ltd.
7
Uptick in cost metric driven more by moderation in income growth
Cost structure to normalize in coming years
2.0
2.4
2.8
3.2
3.6
4.0
20.0
24.0
28.0
32.0
36.0
40.0
Q4 FY12
Q1 FY13
Q2 FY13
Q3 FY13
Q4 FY13
Q1 FY14
Q2 FY14
Q3 FY14
Q4 FY14
Q1 FY15
Q2 FY15
Q3 FY15
(%)(%)
Cost/Income (LHS) Oper Cost/Avg. AUM (RHS)
2.0
2.4
2.8
3.2
3.6
4.0
20.0
24.0
28.0
32.0
36.0
40.0
FY11 FY12 FY13 FY14 FY15E FY16E FY17E
(%)(%)
Cost/Income (LHS) Oper Cost/Avg. AUM (RHS)
Source: Company, India Infoline Research
Added more than 50% of network since Q3 FY14 1200+ employee addition over past 12 months
639 657 675 687 710
893
998 1055 1088
0
200
400
600
800
1000
1200
Q3 FY13
Q4 FY13
Q1 FY14
Q2 FY14
Q3 FY14
Q4 FY14
Q1 FY15
Q2 FY15
Q3 FY15
(no)
0
2500
5000
7500
10000
12500
15000
Q4 FY12
Q1 FY13
Q2 FY13
Q3 FY13
Q4 FY13
Q1 FY14
Q2 FY14
Q3 FY14
Q4 FY14
Q1 FY15
Q2 FY15
Q3 FY15
(no)
Source: Company, India Infoline Research
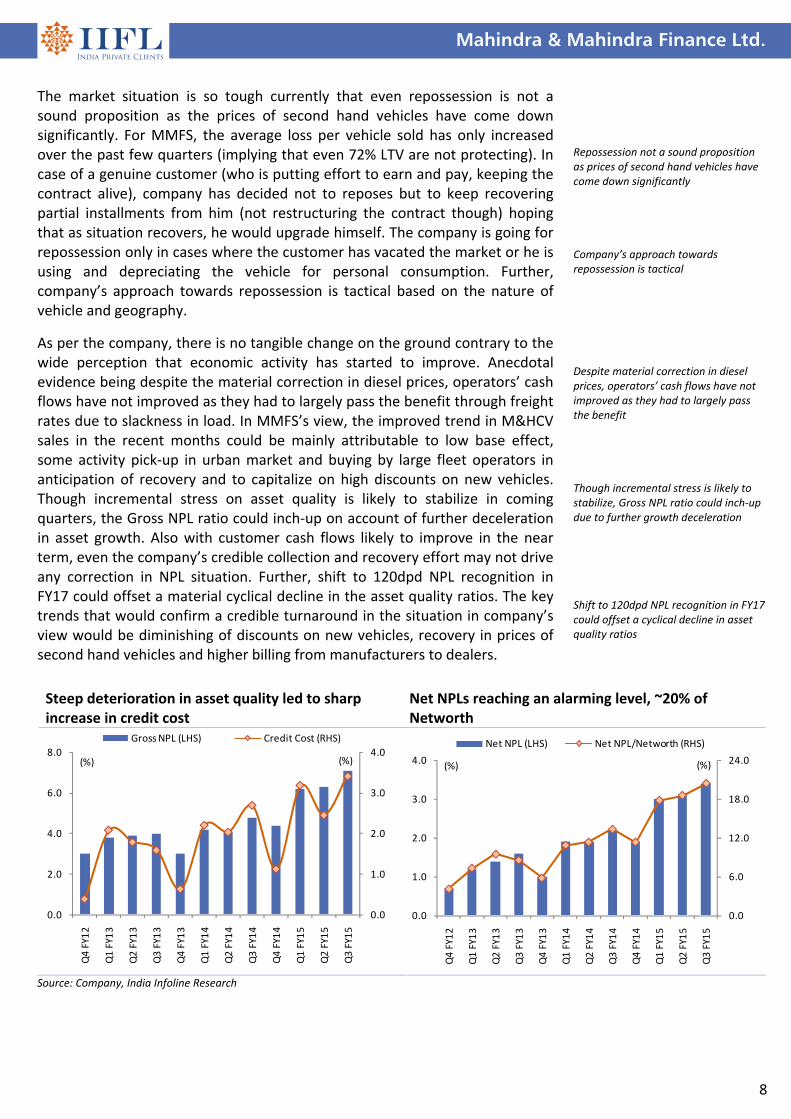
Relentless pressure on asset quality; any material recovery only in FY17 MMFS’s asset quality has seen a substantial deterioration from the start of FY14 with the gross NPLs rising from 3% to 7.1%. In absolute terms, it has jumped by 3.3x in the aforesaid period. The key factors that have made credit environment such challenging for the company are weak monsoon that impacted crop yield, decline in prices of some important crops, delayed realization and lack lustre commercial activity in rural areas due to deep economic slowdown. Not only has the collection efficiency (amount of installments collected/amount of installments due) been impacted severely, but also the defaulting borrowers have failed to upgrade themselves due to persistent stress on their cash flows. So, low NPL reduction has been an equally big challenge as large NPL addition. The collection efficiency in recent quarters has been in the early nineties suggesting sustained addition to NPLs. While the pressure on the asset quality is cyclical, the company has been trying to partially address the situation by penetrating its network and moving close to customers through which it is able to collect partial installments while monitoring the accounts closely.
Asset quality has seen a substantial deterioration from the start of FY14 Collection efficiency has been impacted severely and defaulting borrowers unable to upgrade themselves
Mahindra & Mahindra Finance Ltd.
8
Steep deterioration in asset quality led to sharp increase in credit cost
Net NPLs reaching an alarming level, ~20% of Networth
0.0
1.0
2.0
3.0
4.0
0.0
2.0
4.0
6.0
8.0
Q4 FY12
Q1 FY13
Q2 FY13
Q3 FY13
Q4 FY13
Q1 FY14
Q2 FY14
Q3 FY14
Q4 FY14
Q1 FY15
Q2 FY15
Q3 FY15
(%)(%)
Gross NPL (LHS) Credit Cost (RHS)
0.0
6.0
12.0
18.0
24.0
0.0
1.0
2.0
3.0
4.0
Q4 FY12
Q1 FY13
Q2 FY13
Q3 FY13
Q4 FY13
Q1 FY14
Q2 FY14
Q3 FY14
Q4 FY14
Q1 FY15
Q2 FY15
Q3 FY15
(%)(%)
Net NPL (LHS) Net NPL/Networth (RHS)
Source: Company, India Infoline Research
The market situation is so tough currently that even repossession is not a sound proposition as the prices of second hand vehicles have come down significantly. For MMFS, the average loss per vehicle sold has only increased over the past few quarters (implying that even 72% LTV are not protecting). In case of a genuine customer (who is putting effort to earn and pay, keeping the contract alive), company has decided not to reposes but to keep recovering partial installments from him (not restructuring the contract though) hoping that as situation recovers, he would upgrade himself. The company is going for repossession only in cases where the customer has vacated the market or he is using and depreciating the vehicle for personal consumption. Further, company’s approach towards repossession is tactical based on the nature of vehicle and geography.
As per the company, there is no tangible change on the ground contrary to the wide perception that economic activity has started to improve. Anecdotal evidence being despite the material correction in diesel prices, operators’ cash flows have not improved as they had to largely pass the benefit through freight rates due to slackness in load. In MMFS’s view, the improved trend in M&HCV sales in the recent months could be mainly attributable to low base effect, some activity pick‐up in urban market and buying by large fleet operators in anticipation of recovery and to capitalize on high discounts on new vehicles. Though incremental stress on asset quality is likely to stabilize in coming quarters, the Gross NPL ratio could inch‐up on account of further deceleration in asset growth. Also with customer cash flows likely to improve in the near term, even the company’s credible collection and recovery effort may not drive any correction in NPL situation. Further, shift to 120dpd NPL recognition in FY17 could offset a material cyclical decline in the asset quality ratios. The key trends that would confirm a credible turnaround in the situation in company’s view would be diminishing of discounts on new vehicles, recovery in prices of second hand vehicles and higher billing from manufacturers to dealers.
Repossession not a sound proposition as prices of second hand vehicles have come down significantly Company’s approach towards repossession is tactical Despite material correction in diesel prices, operators’ cash flows have not improved as they had to largely pass the benefit Though incremental stress is likely to stabilize, Gross NPL ratio could inch‐up due to further growth deceleration Shift to 120dpd NPL recognition in FY17 could offset a cyclical decline in asset quality ratios

Mahindra & Mahindra Finance Ltd.
9
Gross NPLs and Credit cost to ease in FY16/17 Subsequently, Net NPLs to decline significantly
0.0
1.0
2.0
3.0
4.0
0.0
2.0
4.0
6.0
8.0
FY11 FY12 FY13 FY14 FY15E FY16E FY17E
(%)(%)
Gross NPL (RHS) Credt Cost (LHS)
0.0
5.0
10.0
15.0
20.0
0.0
1.0
2.0
3.0
4.0
FY11 FY12 FY13 FY14 FY15E FY16E FY17E
(%)(%)
Net NPL (LHS) Net NPL/Networth (RHS)
Source: Company, India Infoline Research
Provisioning coverage ratio to stabilize near 60%
86.4
78.0
65.9
59.1 58.3 60.8 61.5
0.0
20.0
40.0
60.0
80.0
100.0
FY11 FY12 FY13 FY14 FY15E FY16E FY17E
(%)
Source: Company, India Infoline Research

Mahindra & Mahindra Finance Ltd.
10
RoA and RoE have been under severe strain … but worst behind, to see gradual improvement
0.0
5.0
10.0
15.0
20.0
25.0
0.0
1.0
2.0
3.0
4.0
5.0
Q4 FY12
Q1 FY13
Q2 FY13
Q3 FY13
Q4 FY13
Q1 FY14
Q2 FY14
Q3 FY14
Q4 FY14
Q1 FY15
Q2 FY15
Q3 FY15
(%)(%)
RoA (LHS) RoE (RHS)
0.0
5.0
10.0
15.0
20.0
25.0
0.0
1.0
2.0
3.0
4.0
5.0
FY11 FY12 FY13 FY14 FY15E FY16E FY17E
(%)(%)
RoA (LHS) RoE (RHS)
Source: Company, India Infoline Research
Profitability to recover gradually; no need for equity issuance till FY17 The significant increase in credit cost and decline in NIMs has lowered MMFS’s RoA from 4% in FY13 to near 2% in 9m FY15. The RoEs have consequently fallen sharply from 22‐23% to 12‐13%. We believe that company’s profitability is at the cyclical bottom and would improve gradually over the coming three years. The key drivers would be a sharp recovery in NIMs and moderation in the credit cost. By FY17, we expect RoA to improve to 2.8% and RoE to improve to 18%. With AUM estimated to witness a CAGR of 14‐15% over FY14‐17, which would be at par with average RoE of 15% during the period. MMFS would not need to raise any equity capital as currently the Tier‐1 ratio stands at healthy 15.6%.
Capital adequacy sufficient to fund a healthy asset growth recovery
20.3
18.0 19.7
17.1 16.9 16.6 15.5
17.0
15.1
17.0
15.0 15.0 14.9 14.1
0.0
5.0
10.0
15.0
20.0
25.0
FY11 FY12 FY13 FY14 FY15E FY16E FY17E
(%)
CAR Tier‐1
Source: Company, India Infoline Research
Significant increase in credit cost and decline in NIMs lowered RoA to 2% and RoE to 12‐13% Expect material recovery in profitability by FY17
Mahindra & Mahindra Finance Ltd.
11
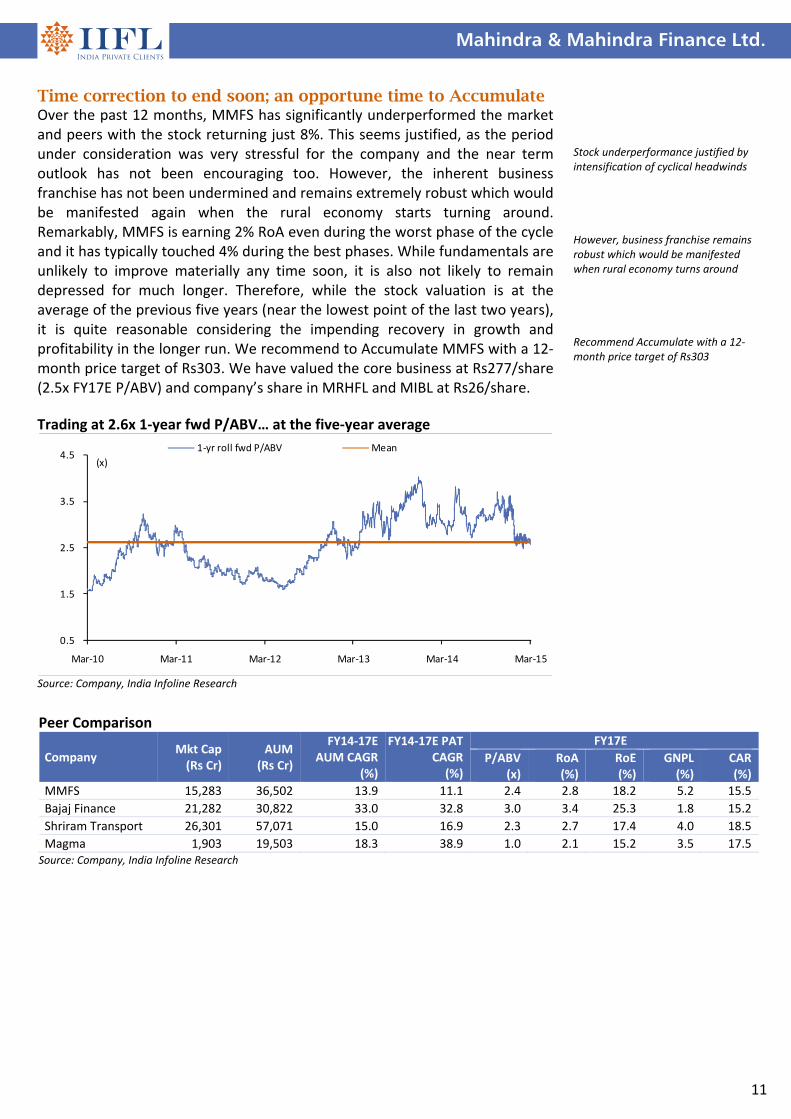
Time correction to end soon; an opportune time to Accumulate Over the past 12 months, MMFS has significantly underperformed the market and peers with the stock returning just 8%. This seems justified, as the period under consideration was very stressful for the company and the near term outlook has not been encouraging too. However, the inherent business franchise has not been undermined and remains extremely robust which would be manifested again when the rural economy starts turning around. Remarkably, MMFS is earning 2% RoA even during the worst phase of the cycle and it has typically touched 4% during the best phases. While fundamentals are unlikely to improve materially any time soon, it is also not likely to remain depressed for much longer. Therefore, while the stock valuation is at the average of the previous five years (near the lowest point of the last two years), it is quite reasonable considering the impending recovery in growth and profitability in the longer run. We recommend to Accumulate MMFS with a 12‐month price target of Rs303. We have valued the core business at Rs277/share (2.5x FY17E P/ABV) and company’s share in MRHFL and MIBL at Rs26/share. Trading at 2.6x 1‐year fwd P/ABV… at the five‐year average
0.5
1.5
2.5
3.5
4.5
Mar‐10 Mar‐11 Mar‐12 Mar‐13 Mar‐14 Mar‐15
(x)
1‐yr roll fwd P/ABV Mean
Source: Company, India Infoline Research
Stock underperformance justified by intensification of cyclical headwinds However, business franchise remains robust which would be manifested when rural economy turns around Recommend Accumulate with a 12‐month price target of Rs303
Peer Comparison
Company Mkt Cap (Rs Cr)
AUM (Rs Cr)
FY14‐17E AUM CAGR
(%)
FY14‐17E PAT CAGR (%)
FY17E
P/ABV (x)
RoA (%)
RoE (%)
GNPL (%)
CAR (%)
MMFS 15,283 36,502 13.9 11.1 2.4 2.8 18.2 5.2 15.5
Bajaj Finance 21,282 30,822 33.0 32.8 3.0 3.4 25.3 1.8 15.2
Shriram Transport 26,301 57,071 15.0 16.9 2.3 2.7 17.4 4.0 18.5
Magma 1,903 19,503 18.3 38.9 1.0 2.1 15.2 3.5 17.5 Source: Company, India Infoline Research

Mahindra & Mahindra Finance Ltd.
12
Financials Income statement Y/e 31 Mar (Rs cr) FY14 FY15E FY16E FY17E
Income from Operatns 4,922 5,444 6,005 6,980
Interest expense (2,188) (2,514) (2,643) (2,870)
Net interest income 2,734 2,930 3,362 4,110
Non‐interest income 31 44 53 66
Total op income 2,765 2,974 3,415 4,176
Total op expenses (913) (1,028) (1,182) (1,406)
Op profit (pre‐prov) 1,852 1,946 2,233 2,770
Provisions (506) (896) (895) (925)
Exceptional Items 0 0 0 0
Profit before tax 1,346 1,050 1,338 1,845
Taxes (459) (357) (455) (627)
Net profit 887 693 883 1,217
Balance sheet Y/e 31 Mar (Rs cr) FY14 FY15E FY16E FY17E
Equity Capital 113 113 113 113
Reserves 4,982 5,477 6,124 7,012
Shareholder's funds 5,094 5,590 6,236 7,125
Long‐term borrow 16,903 18,303 20,086 23,925
Other long‐term liabi 276 304 334 368
Long term provi 318 740 1,054 1,377
Total non‐curr liab 17,498 19,347 21,474 25,670
Short Term Borrow 1,244 1,347 1,479 1,761
Other current liab 438 482 530 583
Trade payables 6,491 7,029 7,713 9,188
Short term prov 901 1,374 1,957 2,558
Total current liab 9,074 10,232 11,678 14,089
Equity + Liab 31,666 35,170 39,388 46,884
Fixed Assets 120 105 110 116
Non‐current inv 526 526 605 726
Deferred tax assets 315 331 347 365
Long‐term loans/adv 15,779 17,928 20,375 24,746
Other non‐curr asset 136 150 164 181
Total non‐curr asset 16,876 19,040 21,602 26,134
Curr Investments 343 343 394 473
Trade receivables 14 17 21 26
Cash & equivalents 553 623 837 972
Short‐term loan/adv 13,838 15,102 16,484 19,225
Other current assets 41 46 50 55
Total Current assets 14,789 16,130 17,786 20,751
Total Assets 31,666 35,170 39,388 46,884
Key ratios Y/e 31 Mar FY14 FY15E FY16E FY17E
Growth matrix (%)
Net interest income 22.1 7.2 14.8 22.2
Total op income 21.5 7.6 14.8 22.3
Op profit (pre‐prov) 20.7 5.1 14.7 24.0
Net profit 0.5 (21.9) 27.4 37.9
Advances 23.2 11.5 11.6 19.3
Borrowings 26.8 8.3 9.7 19.1
Total assets 24.2 11.1 12.0 19.0
Profitability Ratios (%)
NIM 8.6 8.0 8.3 8.7
Return on Avg Equity 1.1 1.5 1.5 1.6
Return on Avg Assets 18.6 13.0 14.9 18.2
Per share ratios (Rs)
EPS 15.7 12.3 15.7 21.6
Adj.BVPS 80.2 81.6 95.3 110.8
DPS 3.8 3.0 3.6 5.0
Valuation ratios (x)
P/E 17.0 21.8 17.1 12.4
P/Adj.BVPS 3.3 3.3 2.8 2.4
Other key ratios (%)
Loans/Borrowings 163.2 168.1 170.9 171.2
Cost/Income 33.0 34.6 34.6 33.7
CAR 17.1 16.9 16.6 15.5
Tier‐I capital 15.0 15.0 14.9 14.1
Gross NPLs/Loans 4.4 7.2 6.0 5.2
Credit Cost 0.0 0.0 0.0 0.0
Net NPLs/Net loans 1.9 3.0 2.4 2.0
Tax rate 34.1 34.0 34.0 34.0
Dividend yield 1.5 1.2 1.4 2.0
‘Best Broker of the Year’ – by Zee Business for contribution to brokingNirmal Jain, Chairman, IIFL, received the award for The Best Broker of the Year (for contribution to broking in India) at India's Best Market Analyst Awards 2014 organised by the Zee Business in Mumbai. The award was presented by the guest of Honour Amit Shah, president of the Bharatiya Janata Party and Piyush Goel, Minister of state with independent charge for power, coal new and renewable energy.
'Best Equity Broker of the Year' – Bloomberg UTV, 2011IIFL was awarded the 'Best Equity Broker of the Year' at the recently held Bloomberg UTV Financial Leadership Award, 2011. The award presented by the Hon'ble Finance Minister of India, Shri Pranab Mukherjee. The Bloomberg UTV Financial Leadership Awards acknowledge the extraordinary contribution of India's financial leaders and visionaries from January 2010 to January 2011.
'Best Broker in India' – Finance Asia, 2011IIFL has been awarded the 'Best Broker in India' by Finance Asia. The award is the result of Finance Asia's annual quest for the best financial services firms across Asia, which culminated in the Country Awards 2011
Other awards
2012BEST BROKING HOUSE WITH
GLOBAL PRESENCE
2009, 2012 & 2013BEST MARKET
ANALYSTBEST BROKERAGE,
INDIAMOST IMPROVED,
INDIABEST BROKER,
INDIA
2009FASTEST GROWING
LARGE BROKING HOUSE
Recommendation parameters for fundamental reports:
Buy – Absolute return of over +15%
Accumulate – Absolute return between 0% to +15%
Reduce – Absolute return between 0% to ‐10%
Sell – Absolute return below ‐10%
Call Failure ‐ In case of a Buy report, if the stock falls 20% below the recommended price on a closing basis, unless otherwise specified by the analyst; or, in case of a Sell report, if the stock rises 20% above the recommended price on a closing basis, unless otherwise specified by the analyst
India Infoline Group (hereinafter referred as IIFL) is engaged in diversified financial services business including equity broking, DP services, merchant banking, portfolio management services, distribution of Mutual Fund, insurance products and other investment products and also loans and finance business. India Infoline Ltd (“hereinafter referred as IIL”) is a part of the IIFL and is a member of the National Stock Exchange of India Limited (“NSE”) and the BSE Limited (“BSE”). IIL is also a Depository Participant registered with NSDL & CDSL, a SEBI registered merchant banker and a SEBI registered portfolio manager. IIL is a large broking house catering to retail, HNI and institutional clients. It operates through its branches and authorised persons and sub‐brokers spread across the country and the clients are provided online trading through internet and offline trading through branches and Customer Care. Terms & Conditions and Other Disclosures:‐ a) This research report (“Report”) is for the personal information of the authorised recipient(s) and is not for public distribution and should not be
reproduced or redistributed to any other person or in any form without IIL’s prior permission. The information provided in the Report is from publicly available data, which we believe, are reliable. While reasonable endeavors have been made to present reliable data in the Report so far as it relates to current and historical information, but IIL does not guarantee the accuracy or completeness of the data in the Report. Accordingly, IIL or any of its connected persons including its directors or subsidiaries or associates or employees shall not be in any way responsible for any loss or damage that may arise to any person from any inadvertent error in the information contained, views and opinions expressed in this publication.
b) Past performance should not be taken as an indication or guarantee of future performance, and no representation or warranty, express or implied, is
made regarding future performance. Information, opinions and estimates contained in this report reflect a judgment of its original date of publication by IIFL and are subject to change without notice. The price, value of and income from any of the securities or financial instruments mentioned in this report can fall as well as rise. The value of securities and financial instruments is subject to exchange rate fluctuation that may have a positive or adverse effect on the price or income of such securities or financial instruments.
c) The Report also includes analysis and views of our research team. The Report is purely for information purposes and does not construe to be
investment recommendation/advice or an offer or solicitation of an offer to buy/sell any securities. The opinions expressed in the Report are our current opinions as of the date of the Report and may be subject to change from time to time without notice. IIL or any persons connected with it do not accept any liability arising from the use of this document.
d) Investors should not solely rely on the information contained in this Report and must make investment decisions based on their own investment
objectives, judgment, risk profile and financial position. The recipients of this Report may take professional advice before acting on this information.
e) IIL has other business segments / divisions with independent research teams separated by 'chinese walls' catering to different sets of customers having varying objectives, risk profiles, investment horizon, etc and therefore, may at times have, different and contrary views on stocks, sectors and markets.
f) This report is not directed or intended for distribution to, or use by, any person or entity who is a citizen or resident of or located in any locality, state,
country or other jurisdiction, where such distribution, publication, availability or use would be contrary to local law, regulation or which would subject IIL and its affiliates to any registration or licensing requirement within such jurisdiction. The securities described herein may or may not be eligible for sale in all jurisdictions or to certain category of investors. Persons in whose possession this Report may come are required to inform themselves of and to observe such restrictions.
g) As IIL along with its associates, are engaged in various financial services business and so might have financial, business or other interests in other
entities including the subject company/ies mentioned in this Report. However, IIL encourages independence in preparation of research report and strives to minimize conflict in preparation of research report. IIL and its associates did not receive any compensation or other benefits from the subject company/ies mentioned in the Report or from a third party in connection with preparation of the Report. Accordingly, IIL and its associates do not have any material conflict of interest at the time of publication of this Report.
h) As IIL and its associates are engaged in various financial services business, it might have:‐
(a) received any compensation (except in connection with the preparation of this Report) from the subject company in the past twelve months; (b) managed or co‐managed public offering of securities for the subject company in the past twelve months; (c) received any compensation for investment banking or merchant banking or brokerage services from the subject company in the past twelve months; (d) received any compensation for products or services other than investment banking or merchant banking or brokerage services from the subject company in the past twelve months; (e) engaged in market making activity for the subject company.
i) IIL and its associates collectively do not own 1% or more of the equity securities of the subject company/ies mentioned in the report as of the last day of the month preceding the publication of the research report.
j) The Research Analyst/s engaged in preparation of this Report or his/her relative
(a) does not have any financial interests in the subject company/ies mentioned in this report; (b) does not own 1% or more of the equity securities of the subject company mentioned in the report as of the last day of the month preceding the publication of the research report; (c) does not have any other material conflict of interest at the time of publication of the research report.
k) The Research Analyst/s engaged in preparation of this Report:‐ (a) has not received any compensation from the subject company in the past twelve months; (b) has not managed or co‐managed public offering of securities for the subject company in the past twelve months; (c) has not received any compensation for investment banking or merchant banking or brokerage services from the subject company in the past twelve months; (d) has not received any compensation for products or services other than investment banking or merchant banking or brokerage services from the subject company in the past twelve months; (e) has not received any compensation or other benefits from the subject company or third party in connection with the research report; (f) has not served as an officer, director or employee of the subject company; (g) is not engaged in market making activity for the subject company.
We submit that no material disciplinary action has been taken on IIL by any regulatory authority impacting Equity Research Analysis. A graph of daily closing prices of securities is available at http://www.nseindia.com/ChartApp/install/charts/mainpage.jsp, www.bseindia.com and http://economictimes.indiatimes.com/markets/stocks/stock‐quotes. (Choose a company from the list on the browser and select the “three years” period in the price chart).
Published in 2015. © India Infoline Ltd 2015 India Infoline Limited (Formerly “India Infoline Distribution Company Limited”), CIN No.: U99999MH1996PLC132983, Corporate Office – IIFL Centre, Kamala City, Senapati Bapat Marg, Lower Parel, Mumbai – 400013 Tel: (91‐22) 4249 9000 .Fax: (91‐22) 40609049, Regd. Office – IIFL House, Sun Infotech Park, Road No. 16V, Plot No. B‐23, MIDC, Thane Industrial Area, Wagle Estate, Thane – 400604 Tel: (91‐22) 25806650. Fax: (91‐22) 25806654 E‐mail: [email protected] Website: www.indiainfoline.com, Refer www.indiainfoline.com for detail of Associates. National Stock Exchange of India Ltd. SEBI Regn. No. : INB231097537/ INF231097537/ INE231097537, Bombay Stock Exchange Ltd. SEBI Regn. No.:INB011097533/ INF011097533/ BSE‐Currency, MCX Stock Exchange Ltd. SEBI Regn. No.: INB261097530/ INF261097530/ INE261097537, United Stock Exchange Ltd. SEBI Regn. No.: INE271097532, PMS SEBI Regn. No. INP000002213, IA SEBI Regn. No. INA000000623, SEBI RA Regn.:‐ Applied for
For Research related queries, write to: Amar Ambani, Head of Research at [email protected] For Sales and Account related information, write to customer care: [email protected] or call on 91‐22 4007 1000


