
1
Paper 2180-2015
Maintaining a 'Look and Feel' throughout a Reporting Package Created with Diverse SAS® Products
Barbara B Okerson, Anthem, Inc.
ABSTRACT
SAS® provides a number of tools for creating customized professional reports. While SAS provides point-and-click interfaces through products such as SAS® Web Report Studio, SAS® Visual Analytics or even SAS® Enterprise Guide®, unfortunately, many users do not have access to the high-end tools and require customization beyond the SAS Enterprise Guide point-and-click interface. Fortunately, Base SAS procedures such as the REPORT procedure, combined with graphics procedures, macros, ODS, and Annotate can be used to create very customized professional reports.
When toggling together different solutions such as SAS Statistical Graphics, the REPORT procedure, ODS, and SAS/GRAPH®, different techniques need to be used to keep the same look and feel throughout the report package. This presentation looks at solutions that can be used to keep a consistent look and feel in a report package created with different SAS products.
INTRODUCTION Available documentation and instruction classes that focus on creating reports with SAS provide information on how to use procedures such as REPORT, TABULATE, and GCHART to create a polished client report. But clients often expect and receive report packages that combine a variety of report types. What is not covered in written material and classes is how to keep a 'look and feel' whether the report is mainly graphic, is a frequency table, or other formatted output. In the context of this presentation, the term 'report package' refers to a series of related reports used together to tell a story to a client and does not refer to, or include, the packaging of like or disparate reports for upload or download. To successfully create a package of analysis and reporting deliverables for a client, a set of requirements needs to be established that is followed throughout the programming of the package. The requirements not only add uniformity to the look and feel of the reporting package, they add to the usability of the information by establishing standards and conventions that allow the end user to know what to expect. These standards also aid in the replicability and persistence of the overall reporting effort. The concept of 'look and feel' in report development refers to aspects and elements of the report design such as colors, shapes, layout, fonts and formats. For dynamic reports, this also refers to the behavior of these elements. This paper looks at examples from an 18-report quarterly client reporting package that illustrate techniques required to maintain cohesion. Standards for this package are set for the following elements:
• Headers • Color patterns • Fonts • Naming conventions • Column formats
The examples below show four reports that are part of a multi-report package. The reports are created with the following SAS disparate procedures:
1. Proc GCHART/table combination 2. Proc GMAP 3. Proc SGPANEL 4. Proc REPORT
2
ODS PDF The SAS Output Delivery System or ODS was designed to provide flexibility in procedure output, adding additional output data set options as well as greater flexibility in formatting output. Additionally, ODS allows output to multiple formats simultaneously.ODS can output to the following filetypes:
• Listing • Postscript • HTML (Hypertext Markup Language) • RTF (Rich Text Format) • PDF (Portable Document Format) • XML (Extensible Markup Language) • Excel
ODS language statements are used to control the output. The ODS PDF statement is one of several third-party formatted statements and is part of the SAS printer family destination statements that produce output suitable for high-resolution printers. In addition to the PDF destination, PCL, PRINTER and PS are also members of this family. The PDF output is read by Adobe Acrobat and other applications.
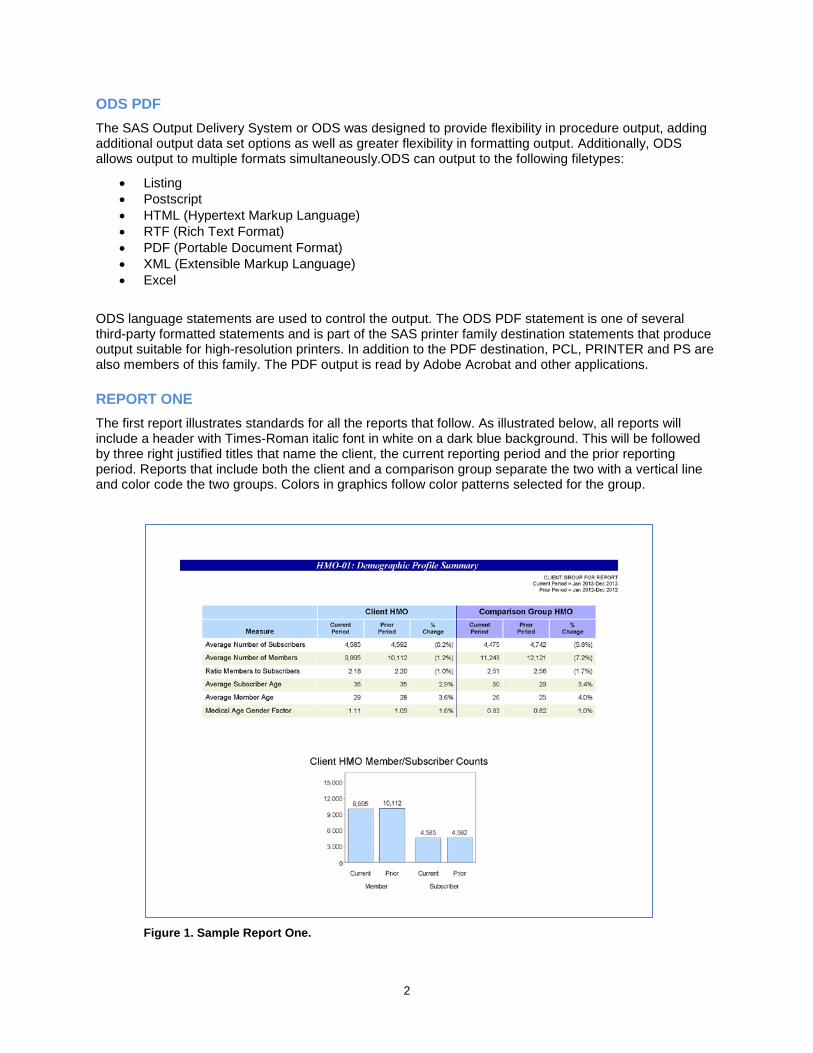
REPORT ONE The first report illustrates standards for all the reports that follow. As illustrated below, all reports will include a header with Times-Roman italic font in white on a dark blue background. This will be followed by three right justified titles that name the client, the current reporting period and the prior reporting period. Reports that include both the client and a comparison group separate the two with a vertical line and color code the two groups. Colors in graphics follow color patterns selected for the group.
Figure 1. Sample Report One.
3
In addition to the colors, all tables in the reporting package will have shading behind every other line. Pages in the report may include both tables and graphics as illustrated above. Below is the code to create this report, divided into sections.
The first section of code sets the banner at the top of the page and the titles. Also set is an ODS escape character that can be used to insert style commands directly into statements. The carat (^) is selected for this character. Any character that would not otherwise appear in the ODS statements can be used. Because this report is run for many clients as a recurring report, any references to the client or to the time of the report are stored in macros.
ods escapechar='^'; ODS PDF file="&dir" notoc style=custom; Title f='Times New Roman' '^S={font_size=5.5 font_style=italic font_weight=bold}HMO-01: Demographic Profile Summary'; Title2 h=.2 "^S={background=white foreground=black} "; Title3 j=r h=1.1 "^S={background=white foreground=black font_style=roman font_weight=medium}&client"; title4 j=r h=1.1 "^S={background=white foreground=black font_style=roman font_weight=medium}Current Period = &curr"; title5 j=r h=1.1 "^S={background=white foreground=black font_style=roman font_weight=medium}Prior Period=&prior";
This section of code defines and creates the report table which serves as the main body of the report. Border commands set the line between the client group and comparison group. These need to be set three places, one for the top header, one for the sub-header and one for the body of the report. The top header is set in the columns statement, the sub-header is set in the define statement, and the body line is set in a compute statement.
Proc REPORT data=rpt1 nowd split='/' missing style(header)={background=cxBBDAFF borderrightcolor=white borderleftcolor=white bordertopcolor=white borderbottomcolor=white} style={rules=none frame=void font_size=7pt}; columns grp Measure ('^S={font_size=4 borderrightcolor=cx000099 }&clnt HMO' c p change) ('^S={background=cxAAAAFF font_size=4 borderleftwidth=.15mm borderleftcolor=cx000099}Comparison Group HMO' ac ap achange); define grp/order noprint; define measure/group "Measure" style=[cellwidth= 2.5 in font_size=3]; define current/ "Current/ Period" f=digi. style=[cellwidth= 1 in]; define prior /"Prior/ Period" f=digi. style=[cellwidth= 1 in]; define change /"^S={borderrightcolor=cx000099}%/ Change" f=percent6.1 style=[cellwidth= 1 in]; define acurrent/ "^S={background=cxAAAAFF borderleftwidth=.15mm borderleftcolor=cx000099}Current/ Period" style=[cellwidth= 1 in]; define aprior /"^S={background=cxAAAAFF }Prior/ Period" style=[cellwidth= 1 in]; define achange/"^S={background=cxAAAAFF }%/ Change" f=percent6.1 style=[cellwidth= 1 in];
The top compute statement sets the background shading for every other line in the table. The mod function is used to find these lines.
Compute measure; line_count+1; if mod(line_count,2)=0 then do; call define (_row_, "style", "style=[background=cxF2F2DF ]"); end; Endcomp;

4
The second compute statement sets the separator line for the body of the report. Since the line is to the left of the acurrent field, borderleftcolor is set with the separator color.
COMPUTE acurrent; CALL DEFINE(_COL_, "style", "STYLE =[borderleftcolor=cx000099 borderleftwidth=.25mm bordertopcolor=white bordertopwidth=0mm borderrightcolor=white borderbottomcolor=white borderbottomwidth=0mm]"); ENDCOMP; run;
The third section of code creates the graph and places it beneath the table. The STARTPAGE command keeps the output from going to a new page. The ^2n command creates two line breaks. The GOPTIONS command sets the colors and font to match the overall report. The VSIZE option makes sure the graphic is created at a size that will fit on the page. After the GCHART code the ODS PDF destination is closed.
ODS PDF startpage=no; ODS PDF text="^2n"; axis1 order=(0 to 15000 by 3000) label=none minor=none; axis2 label=none; axis3 label=none; goptions vsize=3 in colors=('cxBBDAFF') ftitle='Helvetica' ftext='Helvetica'; title; title1 h=1.6 "&clnt HMO Member/Subscriber Counts"; pattern1 v=solid; Proc GCHART data=rpt2; vbar timeperiod /sumvar=n group=type raxis=axis1 maxis=axis2 gaxis=axis3 outside=sum coutline=black; format n comma6.; quit; run; ODS PDF close;
In the code above, the escape character is used two ways. First, it is used to insert style attributes. For this use, the syntax is as follows (with ^ set as the escape character): ^S={attribute=value}. The second usage is for line commands. In addition to the line breaks created above, line wraps, non-breaking spaces and other line commands that format the output file. Although not illustrated here, for the PDF destination, the escape character can also be used to insert predefined functions. An example of a function that could be set with the escape character would be the SUPER function which would superscript the designated text.
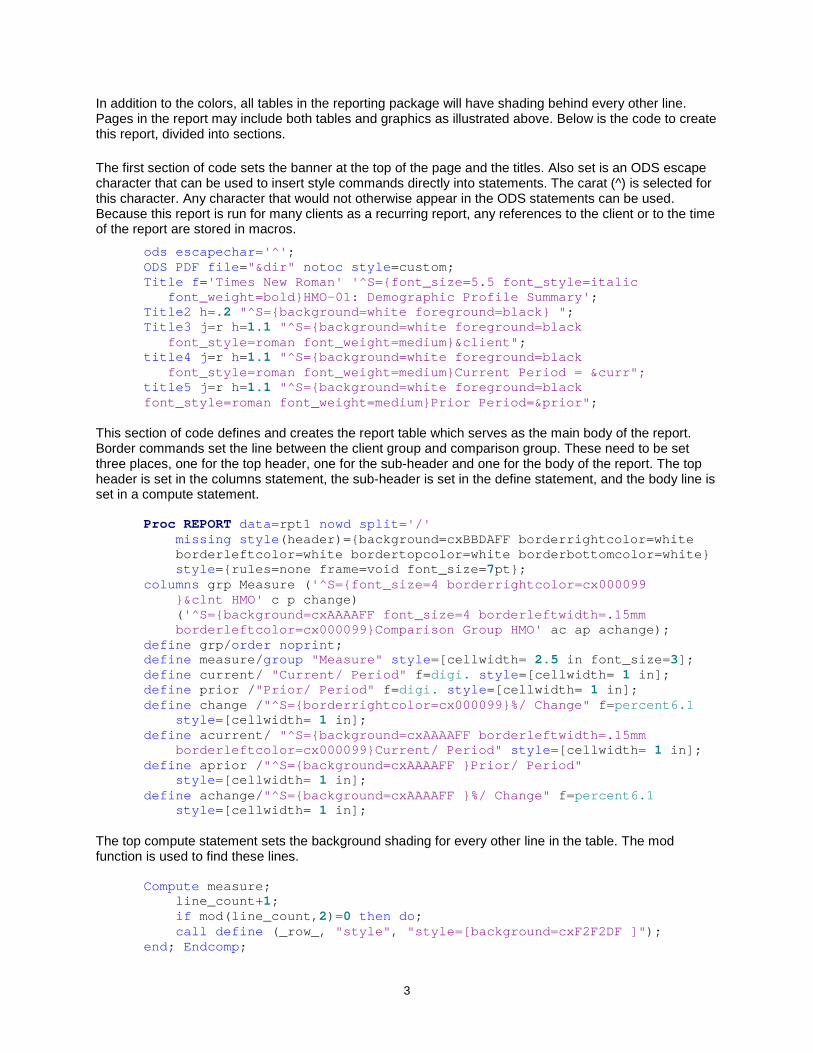
REPORT TWO The second report provides a geographic illustration of the population covered by the report. This report is created with Proc GMAP and ANNOTATE. GMAP is a device-based procedure where the graphics environment is controlled with a GOPTIONS statement. Newer graphics procedures are template based and are controlled with ODS GRAPHICS, allowing greater control over the output through Graphics Template Language or GTL.
One of the problems with device-based graphics is that extra white space is often created around the graphic. To get around this issue and maintain the look and feel of the first report, ODS Layout is used to divide the output area into regions and place elements in absolute locations. The map region is created large enough to accommodate any extra white space. Below is the sample report, prepared for a California based population.
5
Figure 2. Sample Report Two.
The code below illustrates how absolute regions were created for the header, each of the three lines of titles, and for the graphic. For example, for the header, x is set at 1 inch from the edge of the page and y is set at .2 inches from the top of the page. Because the dark blue background for text is set in the custom template, foreground and background need to be set for the other text statements.
ods escapechar='^'; ODS PDF file="r:\bokerson\a_prod\samples\HMO_02s.pdf" style=custom startpage=never notoc; ods layout start width=11in height=8.5in; ods region width=9in height=.75in x=1in y=.2in; ODS PDF text= '^S={ just=c font_size=6.5 font_style=italic font_weight=medium}HMO-02: Membership Geographic Distribution'; ods region width=8in height=1in x=2in y=.55in; ODS PDF text= "^S={just=r font_size=1 font_face=helvetica font_style=roman foreground=black background=white}&client"; ods region width=8in height=1in x=2in y=.67in; ODS PDF text= "^S={just=r font_size=1 font_face=Helvetica font_style= roman foreground=black background=white}Current Period = &curr"; ods region width=8in height=1in x=2in y=.79in; ODS PDF text= "^S={just=r font_size=1 font_face=helvetica font_style= roman foreground=black background=white}Prior Period = &prior"; ods region width=9in height=6in x=1in y=.96in;
The second part of the code includes the statements used for the map itself. Mapping is at the zip code level using zip code tabulation area boundaries (ZCTA5CE10) from the U.S. Census Bureau. The boundaries around the zip code tabulation areas are suppressed so both the county boundaries and the county names are added to the map with SAS ANNOTATE. Additionally, the custom legend is added to the map with ANNOTATE.
6
Proc GMAP data=for_map map=ca_map anno=annos; id ZCTA5CE10; /* matches values between response and map dataset */ choro grp/* response variable */ /nolegend /* pattern/color levels */ coutline=same /* turn off boundary lines*/ anno=annolegend; format grp grp.; run; quit; ODS PDF close;
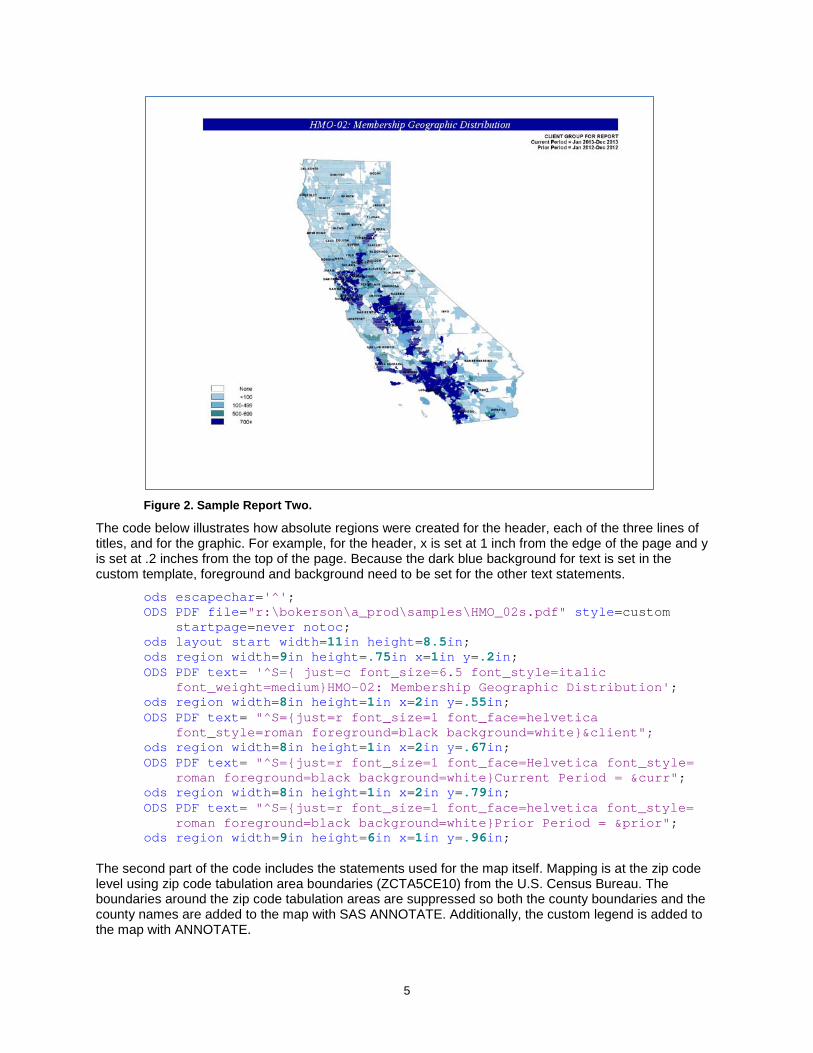
REPORT THREE The third report uses Proc SGPANEL to produce a report comparing age groups between the client and comparison group for the current and prior time period. The SGPANEL procedure creates paneled charts and plots using one or more classification fields. Graphs or plots are created for each combination of classification fields.
SGPANEL is a statistical graphics procedure that uses ODS GRAPHICS to control many aspects of the graph or plot. In addition to SGPANEL, SAS includes two other template based statistical graphics procedures: SGSCATTER and SGPLOT. ODS GRAPHICS statements are the primary control for template based graphics procedures and are global. GOPTIONS statements have no effect on these procedures.
Figure 3. Sample Report Three
Like the previous graphic, the titles are created with ODS PDF Text statements, but for this report it is not necessary to use ODS Layout. Here is the code for this report. Note the call to ODS GRAPHICS. This sets the graphics output area that was set by the ODS Layout region in the previous graphic. Since the ODS GRAPHICS statement is global, all options listed on the ODS GRAPHICS statement remain in effect until a RESET statement or an ODS GRAPHICS OFF statement. In addition to setting the size of the graphics area, the ODS GRAPHICS statement in the code below also suppresses the default border.
7
ODS PDF file="&dir" notoc style=styles.custom startpage=no; ODS PDF text= "^S={just=c vjust=m font_size=15pt font_style=italic font_weight=medium background=cx000099 foreground=white}HMO-03: Membership Age-Sex Distribution Summary"; ODS PDF text= "^S={font_weight=medium font_face=Helvetica}&name"; ODS PDF text= "^S={font_face=Helvetica font_weight=medium font_style=Roman}Current Period = &curr"; ODS PDF text="^S={font_face=Helvetica font_weight=medium font_style=Roman}Prior Period = &prior"; ODS GRAPHICS / reset width=9in height=6.8in border=off; Title;
The code below controls the paneled plot. A lattice layout is selected. Data is formatted so that males and females can be shown on a single axis. Male ages are subtracted from 1 in the dataset and then formatted as positive for the graphic. The transparency setting allows some of the grid to be visible in the graph. Note that the graphic, title banner, and titles continue to follow the set standards, although a new color is introduced in this graphic to differentiate between males and females. The ROWAXIS and COLAXIS statements are used to control the external axes. The KEYLEGEND statement creates the legend at the bottom of the graphic.
Proc SGPANEL data=plot; panelby in year/layout=lattice novarname start=bottomleft; hbar agegrp / response=mpct transparency=.4 datalabel legendlabel="Male" name="mpct"; hbar agegrp/ response=fpct transparency=.4 datalabel legendlabel="Female" name="fpct"; keylegend "mpct" "fpct" / across=2; colaxis grid values=( -15 to 15 by 5) label=" "; rowaxis grid ; format fpct mpct positive. agegrp agefmt. year $yr. in plt. ; label agegrp="Age Group (Age in Years)"; run; quit; ODS PDF close;
Because the above procedure uses ODS GRAPHICS, features such as the font used in the banner title and the text size for the three title statements are stored in the custom template. In production, many of the other options listed on the ODS PDF TEXT lines are also stored in the template but are included in the code here for illustrative purposes.
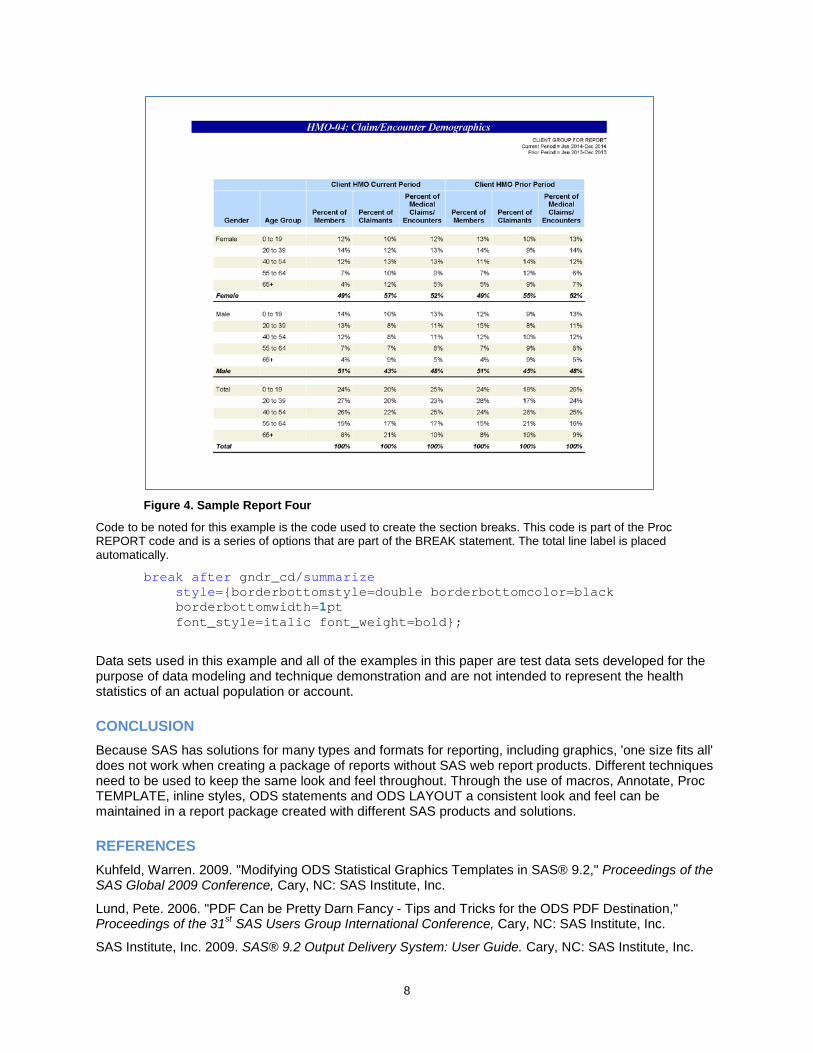
REPORT FOUR The fourth report compares members and claimants by age group. This report is created entirely with Proc REPORT and is the least complex of the four reports, as it does not combine a table with graphics or compare the client group with a comparison group. Therefore the color pattern and other formatting properties are simpler and more straightforward. Some new standards that are introduced in this report that will be carried through to later reports in the reporting package include:
• Italics for group labels • Bold italics for totals • Bold italics for total labels • Black solid line between groups
8
Figure 4. Sample Report Four
Code to be noted for this example is the code used to create the section breaks. This code is part of the Proc REPORT code and is a series of options that are part of the BREAK statement. The total line label is placed automatically.
break after gndr_cd/summarize style={borderbottomstyle=double borderbottomcolor=black borderbottomwidth=1pt font_style=italic font_weight=bold};
Data sets used in this example and all of the examples in this paper are test data sets developed for the purpose of data modeling and technique demonstration and are not intended to represent the health statistics of an actual population or account.
CONCLUSION Because SAS has solutions for many types and formats for reporting, including graphics, 'one size fits all' does not work when creating a package of reports without SAS web report products. Different techniques need to be used to keep the same look and feel throughout. Through the use of macros, Annotate, Proc TEMPLATE, inline styles, ODS statements and ODS LAYOUT a consistent look and feel can be maintained in a report package created with different SAS products and solutions.
REFERENCES Kuhfeld, Warren. 2009. "Modifying ODS Statistical Graphics Templates in SAS® 9.2," Proceedings of the SAS Global 2009 Conference, Cary, NC: SAS Institute, Inc.
Lund, Pete. 2006. "PDF Can be Pretty Darn Fancy - Tips and Tricks for the ODS PDF Destination," Proceedings of the 31st SAS Users Group International Conference, Cary, NC: SAS Institute, Inc.
SAS Institute, Inc. 2009. SAS® 9.2 Output Delivery System: User Guide. Cary, NC: SAS Institute, Inc.
9
Thornton, Patrick. 2012. " Essential SAS® ODS PDF," Proceedings of the SAS Global 2012 Conference, Cary, NC: SAS Institute, Inc.
Zender, Cynthia. 2007. "Funny ^Stuff~ in My Code: Using ODS ESCAPECHAR," Proceedings of the SAS Global 2007 Conference, Cary, NC: SAS Institute, Inc.
Zender, Cynthia. 2010. "SAS® Style Templates: Always in Fashion," Proceedings of the SAS Global 2009 Conference, Cary, NC: SAS Institute, Inc.
ACKNOWLEDGMENTS I would like to thank Bari Lawhorn and Jane Eslinger of SAS Institute for their assistance in figuring out parts of this process.
CONTACT INFORMATION Your comments and questions are valued and encouraged. Contact the author at:
Barbara B. Okerson, Ph.D., CPHQ, FAHM Health Information Manager Health Care Analytics Anthem, Inc. [email protected]
SAS and all other SAS Institute Inc. product or service names are registered trademarks or trademarks of SAS Institute Inc. in the USA and other countries. ® indicates USA registration.
Other brand and product names are trademarks of their respective companies.


