

Maize Breeding Research in
Eastern and Southern Africa:
Current Status and Impacts of Past
Investments Made by the Public and
Private Sectors, 1966-97
Rashid M. Hassan, Mulugetta Mekuria, and Wilfred Mwangi*
Economics ProgramInternational Maize and Wheat Improvement Center
CIMMYT
* R.M. Hassan is a Professor, Natural Resources and Agricultural Economics, Department of AgriculturalEconomics, Extension, and Rural Development, University of Pretoria, South Africa, and Affiliate Scientist,CIMMYT Economics Program. Mulugetta Mekuria is a Senior Scientist, CIMMYT Economics Program, Harare,Zimbabwe. Wilfred Mwangi is a Principal Scientist, CIMMYT Economics Program, Addis Ababa, Ethiopia

ii
CIMMYT® (www.cimmyt.org) is an internationally funded, nonprofit, scientific research and training organization.Headquartered in Mexico, CIMMYT works with agricultural research institutions worldwide to improve the productivity,profitability, and sustainability of maize and wheat systems for poor farmers in developing countries. It is one of 16 food andenvironmental organizations known as the Future Harvest Centers. Located around the world, the Future Harvest Centersconduct research in partnership with farmers, scientists, and policymakers to help alleviate poverty and increase food securitywhile protecting natural resources. The centers are supported by the Consultative Group on International Agricultural Research(CGIAR) (www.cgiar.org), whose members includes nearly 60 countries, private foundations, and regional and internationalorganizations. Financial support for CIMMYT’s research agenda also comes from many other sources, including foundations,development banks, and public and private agencies.
Future Harvest® builds awareness and support for food and environmental research for a world with less poverty, a healthierhuman family, well-nourished children, and a better environment. It supports research, promotes partnerships, and sponsorsprojects that bring the results of research to rural communities, farmers, and families in Africa, Asia, and Latin America(www.futureharvest.org).
International Maize and Wheat Improvement Center (CIMMYT) 2001. All rights reserved. The opinions expressed in thispublication are the sole responsibility of the authors. The designations employed in the presentation of materials in thispublication do not imply the expressions of any opinion whatsoever on the part of CIMMYT or its contributory organizationsconcerning the legal status of any country, territory, city, or area, or of its authorities, or concerning the delimitation of itsfrontiers or boundaries. CIMMYT encourages fair use of this material. Proper citation is requested.
Printed in Mexico.
Correct citation: Rashid M. Hassan, Mulugetta Mekuria, and Wilfred Mwangi. 2001. Maize Breeding Research in Eastern andSouthern Africa: Current Status and Impacts of Past Investments Made by the Public and Private Sectors 1966-97. Mexico, D.F.: CIMMYT.
Abstract: This report documents the impacts of international maize breeding research in eastern and southern Africa. It drawson information from a comprehensive 1998/99 survey of public and private maize breeding and seed production organizationsactive in the region. In many countries of eastern and southern Africa, policy reforms introduced in the 1980s and 1990sencouraged private sector participation in the maize seed industry. The private sector now supplies most of the maize seed inthe region, spends more on research, and generates a larger number of maize releases than the public sector. Hybrids dominatevarietal releases and seed sales, a trend that may negatively affect subsistence-oriented farmers who lack resources to buyfresh seed every season. Although farmers’ adoption of improved maize varies throughout the region, it has increased steadily.Survey data show that CIMMYT’s maize breeding program has had significant impacts in eastern and southern Africa, especiallyin recent years. Of the maize varieties released in the region since 1990, 31% (55% if South Africa is excluded) were developedusing CIMMYT breeding materials. In 1996, more than 1.6 million hectares in eastern and southern Africa were planted tovarieties developed using CIMMYT germplasm. The varietal release data and adoption data indicate growing demand forCIMMYT breeding materials from both public and private breeding programs, as well as growing acceptance by farmers ofvarieties developed using those materials.
ISBN: 970-648-072-2AGROVOC Descriptors: Maize; Zea mays; Hybrids; Plant breeding; Seed production; Seed industry;Public sector; Private sector; Germplasm; Development projects; On farm research; East Africa; Southern Africa
AGRIS Category Codes: E14 Development Economics and PoliciesF30 Plant Genetics and BreedingDewey Decimal Classification: 338.1968

iii
Contents
iv Tables
v Figures
vi Executive Summary
ix Acknowledgements
1 Introduction
1 Motivation and objectives of the study
2 Data collection
3 The Maize Economy of Eastern and Southern Africa
3 Maize production environments
4 Maize production and consumption trends
5 Maize breeding research and seed supply
5 Policies affecting national maize seed industries
7 Structure of national maize seed industries
8 Organization of maize research
10 Public and private investment in maize breeding
12 Patterns of Maize Varietal Releases
13 Maize varietal releases
16 Ecological adaptation
18 Grain characteristics
19 Maturity classes
20 Impacts of CIMMYT’s Maize Breeding Program
21 Use of CIMMYT germplasm
23 Popular CIMMYT materials
24 Manner of use of CIMMYT germplasm
24 Farm Level Impacts of Maize Breeding Research
25 Direct NARS estimates of area under improved maize
26 Estimates of area under improved maize based on seed sales
27 Role of the private sector and importance of hybrids
29 Estimates of area under CIMMYT germplasm
30 Summary and Conclusions
33 References

iv
Tables
Table 1. Coverage of the 1998/99 CIMMYT maize research impacts survey,...............................................2eastern and southern Africa
Table 2. Trends in maize area planted, yield, and production, 1961-97 (% annual growth) .......................4
Table 3. Maize imports, consumption, and utilization, 1994-96 .....................................................................5
Table 4. Policies affecting national maize seed industries, eastern and southern Africa, 1998 ..................6
Table 5. Maize seed organizations and seed sales, eastern and southern Africa, 1996................................8
Table 6. Number of public and private maize breeding programs,eastern and southern Africa, 1998.........................................................................................................9
Table 7. Human resources invested in maize research, public sector, eastern and .................................... 11southern Africa, 1998
Table 8. Human resources invested in maize research, private sector, eastern and................................... 11southern Africa, 1998
Table 9. Cost (US$/year) of supporting a senior maize scientist, eastern and ...........................................12southern Africa, 1998
Table 10. Number of maize varieties released by public breeding programs, eastern and ........................14southern Africa, 1966-98
Table 11. Number of maize varieties (available in 1998) released by private seed ......................................15companies, eastern and southern Africa
Table 12. Ecological adaptation of maize varieties released by public breeding programs,.......................17eastern and southern Africa, 1966-98 (number of varieties)
Table 13. Ecological adaptation of maize varieties (available in 1998) released by .....................................17private seed companies, eastern and southern Africa (number of varieties)
Table 14. Grain characteristics of maize varieties released by public ............................................................18breeding programs, eastern and southern Africa, 1966-98 (number of varieties)
Table 15. Grain characteristics of maize varieties (available in 1998) ............................................................18released by private seed companies, eastern and southern Africa (number of varieties)
Table 16. Maturity classes of maize varieties released by public ....................................................................19breeding programs, eastern and southern Africa, 1966-98 (number of varieties)
Table 17. Maturity classes of maize varieties (available in 1998) released by private .................................20seed companies, eastern and southern Africa (number of varieties)
Table 18. Use of CIMMYT germplasm by public and private breeding programs,.....................................21eastern and southern Africa, 1966-98
Table 19. Trends in use of CIMMYT germplasm by public and private breeding programs, ....................22eastern and southern Africa, 1966-98
Table 20. Percentage of public and total maize varietal releases containing.................................................23CIMMYT germplasm, by ecological zone, eastern and southern Africa
Table 21. Manner of use of CIMMYT source materials by public and private breeding ............................24programs, eastern and southern Africa, 1966-98 (% of varietal release)

v
Table 22. Area planted to maize in eastern and southern Africa, 1996 ..........................................................25(comparison of survey respondents’ direct estimates with FAO data)
Table 23. Percentage of total national maize area planted to improved OPVs and hybrids,......................26eastern and Southern Africa, 1996 (comparison of survey respondents’ direct estimates andcalculations based on commercial seed sales)
Table 24. Evolution of commercial maize seed sales by public and private seed ........................................27organizations, eastern and southern Africa, 1990-96
Table 25. Area planted to maize varieties developed using CIMMYT germplasm, eastern ......................29and southern Africa, 1996
FiguresFigure 1. Public maize varietal releases, by type of cultivar, eastern and .....................................................14
southern Africa, 1966-95
Figure 2. Private maize varietal releases, by type of cultivar, eastern and southern Africa, 1976-98........15
Figure 3a. Trends in maize varietal releases, by sector, eastern and southern Africa, 1966-98.....................16
Figure 3b. Trends in maize varietal releases, by type of cultivar, eastern and southern Africa, 1966-98 ....16
Figure 4. Use of CIMMYT maize germplasm, eastern and southern Africa, 1966-96..................................22
Figure 5a. Commercial maize seed sales, by sector, eastern and southern Africa, 1990-96 ..........................28
Figure 5b. Commercial maize seed sales, by region, eastern and southern Africa, 1990-96 .........................28
Figure 6. Compostion of commercial maize seed sales, eastern and southern Africa, 1990-96 .................28

vi
In 1997, the International Maize and Wheat
Improvement Center (CIMMYT) launched a major
study designed to document the impacts of
international maize breeding research in developing
countries. The study was intended to update and
extend the findings of CIMMYT’s first global
research impacts study, which had been published
three years earlier in a report entitled Impacts of
International Maize Breeding Research in the Developing
World, 1966-90 (López-Pereira and Morris 1994).
Given the enormity of the data collection task, the
follow-up study was divided into three regional
studies—one each for Latin America, Asia, and sub-
Saharan Africa. The sub-Saharan Africa study
focused specifically on eastern and southern Africa;
a separate impacts study for western and central
Africa was conducted by the International Institute
for Tropical Agriculture (IITA), which holds the
mandate for maize germplasm improvement work
in that region. This report presents the results of the
eastern and southern Africa study.
The results presented in this report are based on
information collected during 1998 and 1999 through
a comprehensive survey of public and private maize
breeding organizations and seed production
agencies in 12 countries of eastern and southern
Africa. The survey collected information on many
aspects of maize research, seed production, and seed
distribution (e.g., maize breeding activities, products
of breeding programs, maize seed production and
sales operations, seed industry regulations and
policies). The countries covered by the survey
accounted for more than 95% of all maize produced
in the region in 1998/99. The organizations
contacted as part of the survey currently control
about 97% of the total maize seed market in the 12
countries.
Executive Summary
Major findings of the study are summarized below.
Policy reforms have led to increasedprivate-sector participation in manynational maize seed industries
In many countries of eastern and southern Africa,
policy reforms introduced during the 1980s and
1990s have succeeded in liberalizing national maize
seed industries by opening up maize seed markets
to increased private sector participation. This
represents a major change from earlier years, when
maize seed industries in most countries throughout
the two regions were dominated by public agencies.
Major policy reforms have included the lifting of
outright bans on private seed companies, removal
of restrictions on importation of commercial maize
seed, and elimination of direct seed price controls.
In a number of countries, however, implicit
restrictions in the form of strict seed certification
requirements and lengthy varietal registration
procedures continue to limit the participation of
private firms, both local companies and multi-
nationals. Moreover, governments in some countries
still are trying to influence maize seed prices
indirectly by subsidizing maize seed production,
especially where public agencies continue to operate
and control large shares in the seed market.
Rapid growth in private-sectorinvestment in maize breedingresearch has been accompanied bychanges in varietal release patterns
Throughout eastern and southern Africa, private-
sector investment in maize breeding research has
been growing rapidly. In eastern Africa, public-sector

vii
scientists still significantly outnumber private-sector
scientists; in southern Africa, the numbers are
roughly equal. Numbers of scientists provide an
imperfect measure of total research investment,
however, since private seed companies tend to
support each scientist with considerably more
operating funds. Adjusting for the difference in
operating funds, total research investment by the
private sector probably exceeds total research
investment by the public sector, at least in southern
Africa and possibly in eastern Africa as well.
Private-sector maize breeders have on average
released a larger number of varieties than public-
sector maize breeders. This difference in varietal
release rates can be attributed to differences in the
quantity and quality of investment, as well as to the
commercial orientation of private seed companies
compared to public breeding programs, which focus
more on non-commercial breeding objectives. The
composition of varietal releases reflects steady
growth in the role of the private sector; by 1996, all
maize varieties released in eastern and southern
Africa originated from private seed companies. The
recent decline in public-sector varietal releases also
reflects reductions in public funding for agricultural
research that have occurred in many countries in
the region.
Increased private-sector participationin the maize seed industry has beenaccompanied by greaterconcentration of the industry
During the 1990s, the private sector effectively
took over the seed supply function throughout most
of eastern and southern Africa. In 1996, the most
recent year for which complete data are available,
private seed companies controlled more than 97%
of all commercial maize seed sales in the region.
Efforts to privatize maize seed markets were thus
largely successful. It is important to note, however,
that in a number of major maize producing
countries (e.g., Kenya, Zambia, Zimbabwe), the
leading private seed company is simply a
transformed version of a previously public or
parastatal seed agency that had long monopolized
the local seed market. In several instances, these
privatized parastatals continue to control more
than 80% of the national seed market.
With privatization, the maize seed industry is
becoming more concentrated as a relatively small
number of large multinationals acquire, merge
with, or buy large shares in local seed companies.
While consolidation could lead to scale economies,
reduced competition is a concern to farmers, who
worry that they may eventually face restricted
choices and have to pay higher prices. The fact that
seed prices in many countries have not risen
significantly may reflect continued attempts by
governments to keep maize seed prices affordable
by subsidizing public seed production agencies.
Hybrids now dominate varietalreleases and seed sales
With the emergence of a flourishing private
seed industry, the share of hybrids in varietal
releases and seed sales has risen steadily. Coupled
with the fact that public breeding programs are also
concentrating increasingly on hybrids, this has led
to a situation in which varietal releases and seed
sales are now completely dominated by hybrids.
This could have negative impacts on small-scale
subsistence-oriented farmers, many of whom may
lack the resources needed to buy fresh seed every
season. To date, little empirical evidence has
emerged to indicate that small-scale farmers have
been adversely affected by the shift to hybrids, but
the matter will require careful attention, because
supplying seed to smallholders may not be of
interest to profit-motivated private firms.

viii
Adoption of improved maize varietiesincreased during the 1990s
Commercial maize seed sales data support
estimates made by researchers and seed industry
insiders that adoption of improved varieties increased
steadily during the 1990s in eastern and southern
Africa. However, adoption patterns have differed
between countries and regions. Total sales of
improved maize seed have fluctuated around 20,000
tons per year in eastern Africa, whereas in southern
Africa total seed sales grew steadily in the early 1990s,
peaking in 1992 at just under 100,000 tons before
declining. Within individual countries, the percentage
area planted to improved maize seed varies from less
than 10% to nearly 100% in several major maize
producing countries. The variability between
countries in adoption rates can be attributed to
differences in economic, institutional, and policy
factors that affect the availability and affordability of
improved seed.
Use by researchers of CIMMYTgermplasm continues to increase, asdoes adoption by farmers of CIMMYT-derived varieties
CIMMYT’s maize breeding program has had
significant impacts in eastern and southern Africa,
especially in recent years. Of all maize varieties
released by public and private breeding programs
since 1966, about 24% (35% if South Africa is
excluded) were developed using CIMMYT source
materials. Use of CIMMYT germplasm showed a
strong positive growth over time; of the varieties
released since 1990, over 31% (55% if South Africa
is excluded) were developed using CIMMYT
source materials. In 1996, more than 1.6 million ha
in eastern and southern Africa were planted to
varieties that had been developed using CIMMYT
germplasm, representing over 20% of the area
planted to modern varieties. Excluding South
Africa, where farmers grow mainly temperate
materials not targeted by CIMMYT’s breeding
program, nearly 37% of the area planted to modern
varieties in eastern and southern Africa was
planted to varieties containing CIMMYT
germplasm. Taken together, the varietal release
data and the adoption data indicate growing
demand for CIMMYT source materials on the part
of public and private breeding programs, as well
as growing acceptance by farmers of varieties
developed using those materials. The observed
growth in demand for and use of CIMMYT
germplasm in eastern and southern Africa over
recent years validates the decision by the CIMMYT
Maize Program to establish regional maize
breeding programs in eastern and southern Africa
and to allocate increased resources to local adaptive
breeding.

ix
Acknowledgements
The authors of this report are grateful for assistance provided by numerous colleagues
within CIMMYT, by collaborators working in public national agricultural research
systems (NARSs), and by representatives of private seed companies involved in maize
improvement research and seed supply in eastern and southern Africa.
We would like to express our appreciation to the following collaborators from NARS
and private seed companies who kindly completed the questionnaire and responded to
many questions: Mike Barrow, Calisto Bias, F. Chilenge, Cosmos Magorokosho Claude,
T.G. Cowie, G.J. Cullen, M. Denie, H. Faki, Calvin Fambisaui, P. Herbst, M. Kanungwe,
P. Kireru, Denis Kyetere, Nick Lyimo, Barry MacCater, Lewis Machida, W.O. Mangheni,
Gerald Makhale, Worede W. Mariam, E.J. Matee, Mampiti Matete, S.B. McCarter, Zubeda
Mduruma, Lieketso Moremoholo, P. Muchena, Catherine Mungoma, T. Nakhumwa,
Francis Ndambuki, Pip Nelson, Gresham Nhlane, Kiarie Njoroge, J. Odendaal, C.A.
Price, J. Prinslo, Yonas Sahlu, Johnson Shaiya, Kent Short, Fernando Sito, J. Shuma, P.
Thole, Benti Tolessa, and Simba Zengeni.
Our special thanks to Strafford Twumasi-Afriye, Marianne Banziger, Alpha Diallo,
Paul Heisey, Michael Morris, Shivaji Pandey, Prabhu Pingali, Kevin Pixley, Ganesan
Srinivasan, Steve Waddington, and others from CIMMYT Zimbabwe and Mexico for
their comments and suggestions on the draft of the report. Thanks also to Satwant Kaur
for her editorial assistance and to Miguel Mellado and Antonio Luna for the design and
layout of this publication.

1
Introduction
Motivation and Objectives of theStudy
The International Maize and Wheat
Improvement Center (CIMMYT) holds a global
mandate to increase maize production and boost the
productivity of maize-based cropping systems in
developing countries. In pursuing this mandate,
CIMMYT collaborates with many public, private,
and non-governmental organizations (NGOs)
involved in technology development and diffusion
activities. A crucial component of CIMMYT’s
strategy is to develop and distribute improved
maize germplasm through an international network
of maize breeding and seed production
organizations.
During the early 1990s, CIMMYT carried out a
study designed to document the impacts of
international maize breeding research in developing
countries, the results of which were published in
1994 in a report entitled Impacts of International Maize
Breeding Research in the Developing World, 1966-90
(López-Pereira and Morris 1994). The objectives of
the study were to document—for CIMMYT, its
collaborators, and the donor community—the
impacts of international maize breeding efforts in
developing countries. The study generated a wealth
of useful information about levels of investment in
maize breeding research, the spread of modern
varieties throughout the developing world, and
farm-level impacts of varietal adoption.1
In subsequent years, CIMMYT’s maize research
impacts database served as an important source of
information for organizations involved in maize
research and development activities. Based on the
continuing strong demand for this information, the
decision was taken to update and expand the
database periodically. Accordingly, a follow-up
study was launched in 1997. An additional factor
motivating the follow-up study was the need to
include more and better data from the private sector,
given that limited effort was made during the first
study to comprehensively survey private seed
companies.
Given the enormity of the data collection task,
the follow-up study was divided into three regional
studies—one each for Latin America, Asia, and sub-
Saharan Africa. The sub-Saharan Africa study
focused specifically on eastern and southern Africa;
Maize Breeding Research in Easternand Southern Africa: Current Status andImpacts of Past Investments Made by the Publicand Private Sectors, 1966-97
1 Throughout this report, the term varieties is used in a generic sense to refer to both open-pollinated varieties andhybrids. The term OPVs refers much more specifically to open-pollinated varieties that have been improved by abreeding program.
Rashid M. Hassan, Mulugetta Mekuria, and Wilfred Mwangi

2
a separate study focusing on western and central
Africa was conducted by the International Institute
for Tropical Agriculture (IITA), which holds the
mandate for maize improvement work in that
region. This report presents the results of the eastern
and southern Africa study.
The objectives of the eastern and southern Africa
regional impacts study resembled those of the Latin
American and Asian regional impacts studies:
• to estimate the level of public and private sector
investment in maize breeding research;
• to document the germplasm outputs of public
and private maize breeding programs;
• to document the use of CIMMYT source
materials by public and private maize breeding
programs; and
• to estimate the rate of farm level adoption of
improved maize germplasm.
Data Collection
The information and analysis presented in this
report are based on data collected in 1998 and 1999
through a comprehensive survey of research
organizations and seed production agencies located
throughout eastern and southern Africa. A
structured questionnaire was used to gather
information about each organization’s maize
research activities, maize seed production activities,
and/or maize seed distribution activities. Secondary
sources also were tapped for additional information
about seed regulations and seed policies.
The survey covered 12 countries (Table 1).
Collectively, these countries include more than 90%
of the total area planted to maize in eastern and
southern Africa and account for more than 95% of
all maize produced in the region. All major public
organizations that engage in maize improvement
research and/or seed production were contacted,
Table 1. Coverage of the 1998/99 CIMMYT maize research impacts survey, eastern and southern Africa
Public agenciesNumber of
Number of Number of private Total Share of formalresearch seed seed agencies seed sales
Country-region organizations companies companies surveyed (%) in 1996
Ethiopia 1 1 2 4 100Kenya 1 0 3 4 96Uganda 1 0 1 2 100
Eastern Africa 3 1 6 10 96
Angola 1 1 2 4 81Lesotho 1 0 1 2 50Malawi 1 0 1 2 83Mozambique 1 0 1 2 100South Africa 1 0 7 8 100Swaziland 1 0 1 2 52Tanzania 1 1 2 4 78Zambia 1 0 2 3 100Zimbabwe 1 0 5 6 100
Southern Africa 9 2 22 33 97Southern Africa, excluding South Africa 8 2 15 25 93
Eastern and southern Africa 12 3 28 43 97Eastern and southern Africa,
excluding South Africa 11 3 21 35 94
Source: CIMMYT Maize Research Impacts Survey, 1998/99.

3
as were 31 private seed companies (including all of
the industry leaders). Between them, these
organizations controlled 97% of the total maize seed
market in 1996. The survey could not be
administered in a few countries due to civil strife,
but given that these countries account for a
negligible proportion of total regional maize area
and production, the omissions are of minimal
significance.
Data collection proceeded in stages. First, copies
of the questionnaire were mailed to directors of
national maize research programs and to senior
researchers (mainly plant breeders) in public seed
agencies and private seed companies. After the
respondents had been given time to review the
questionnaire and assemble information, they were
personally interviewed, in most cases by one or
more of the study authors, and in a few cases by
experienced non-CIMMYT researchers. Following
the interviews, data recorded in the questionnaires
were extensively cross-checked for accuracy and
consistency. During this process, staff of the
CIMMYT Maize Program helped to resolve
numerous questions related to the genetic
backgrounds of commercial varieties. In a number
of cases, the original respondents were contacted a
second time to clear up inconsistencies.
The Maize Economy ofEastern and Southern Africa
Maize dominates the food economy of eastern
and southern Africa, where it is by far the dominant
staple crop grown by the vast majority of rural
households.
Maize Production Environments
Maize in sub-Saharan Africa is produced in a
wide range of production environments. Based on
agro-climatic factors and grain maturity
characteristics, the CIMMYT Maize Program has
identified eight distinct maize production
environments, known as mega-environments:
• Tropical lowlands
• Tropical mid-altitude zones
• Tropical highlands
• Subtropical lowlands
• Subtropical mid-altitude zones
• Subtropical highlands
• Subtropical winter zones
• Temperate/subtropical zones
These eight mega-environments can be grouped
into four basic agro-ecological zones:
1. Lowland tropical zones (0-1,000 masl) located
in Ethiopia, Kenya, Malawi, Mozambique,
Tanzania, Somalia, South Africa, and Zambia
cover about 18% of the maize area in eastern and
southern Africa. Some areas feature a distinct
rainy season, while in other areas rainfall is
bimodally distributed. Maize is usually grown
as a monocrop or intercropped with grain
legumes, sesame, cassava, cowpea, pigeon peas,
tomatoes, or rice.
2. Wet subtropical zones (900-1,500 masl, >1,000
mm annual rainfall) located in Angola, Burundi,
Kenya, Malawi, Mozambique, Rwanda,
Swaziland, Tanzania, Uganda, Zambia, and
Zimbabwe constitute 49% of the area planted to
maize in the region. Rainfall generally decreases
as altitude increases. Some areas are
characterized by bimodally distributed rainfall,
which enables two maize crops to be grown each
year. Soils range from deep fertile soils along
river bottoms and in lake basins to well drained
and easily worked upland soils.
3. Dry subtropical zones (900 –1,500 masl, < 1,000
mm annual rainfall) located in Ethiopia, Kenya,
Tanzania, Uganda, and Zimbabwe constitute
16% of the area under maize in eastern and
southern Africa. These zones are characterized
by unreliable and inadequate rainfall, which
discourages farmers from investing in inputs
such as improved seed and chemical fertilizer.

4
4. Highland zones (>1,800 masl) located in
Burundi, Ethiopia, Kenya, Lesotho, Rwanda,
South Africa, Tanzania, and Uganda cover about
16% of the total area planted to maize in eastern
and southern Africa. Highland zones are
endowed with adequate to excessive rainfall,
cool temperatures, and long growing seasons.
The soils are highly fertile, well drained, and
have high organic matter content.
Maize Production andConsumption Trends
Maize production statistics for sub-Saharan
Africa show pronounced variability through time,
reflecting the vulnerability of Africa’s mostly rainfed
maize production systems to extremely
unpredictable weather patterns (Table 2).
Disregarding short-term variability, over the longer
term the area planted to maize has been expanding
in eastern and southern Africa, growing at an annual
average rate of 1.8% from 1961-70 before accelerating
to 2.5% during the 1991-97 period. In contrast, no
clear long-term pattern has been discernible in
western and central Africa; during the past four
decades, the area planted to maize in this region
alternately expanded and contracted.
Maize yield growth has been similarly variable
(Table 2). Throughout sub-Saharan Africa, annual
growth in maize yields fluctuated around 1% during
the 1960s and 1970s before accelerating noticeably
during the 1980s and 1990s. In eastern and southern
Africa, particularly large yield increases were
realized during the mid- and late 1990s as maize
production recovered from the devastating drought
that affected southern Africa in 1991/92. During the
latter part of the 1990s, El Niño-related weather
phenomena again disrupted maize production in a
number of countries, especially in southern Africa,
but on the whole the effects were less devastating
than expected.
Maize production trends reflect combined effects
of area and yield variability (Table 2). In eastern and
southern Africa, periods of unfavorable weather
have often been followed by periods of favorable
weather, which has served to reduce the variability
in production growth over the longer term. For
eastern and southern Africa as a whole, maize
production growth averaged about 2.2% throughout
most of the 1960s, 1970s, and 1980s before
accelerating sharply during the 1990s. Production
growth has been much more variable in western and
central Africa and actually fell to negative levels
during the 1970s as a result of the Sahelian drought.
Consumption of maize is high throughout most
of the region, reflecting its role as the primary food
staple (Table 3). Maize accounts for over 50% of total
calories consumed in eastern Africa and 30% of total
calories consumed in southern Africa. In southern
Africa, per capita annual consumption of maize
averages more than 100 kg in several countries,
including Lesotho (149 kg), Malawi (181 kg), South
Africa (195 kg), Swaziland (138 kg), Zambia (168 kg),
and Zimbabwe (153 kg) (CIMMYT 1999). In eastern
Africa, per capita annual consumption is somewhat
lower, ranging from a low of 40 kg in Burundi to a
high of 105 kg in Kenya.
Table 2. Trends in maize area planted, yield, and production, 1961-97 (% annual growth)
1961-70 1971-80 1981-90 1991-97
Eastern Western Eastern Western Eastern Western Eastern Westernand and All and and All and and All and and All
southern central developing southern central developing southern central developing southern central developingAfrica Africa countries Africa Africa countries Africa Africa countries Africa Africa countries
Area 1.8 0.9 2.0 0.4 -0.8 0.8 1.6 10.2 1.5 2.5 -0.9 1.4Yield 0.7 1.9 2.8 1.9 0.4 3.0 0.5 3.3 1.6 3.6 2.5 1.9Production 2.4 2.8 4.8 2.3 -0.4 3.8 2.1 13.4 3.1 6.1 1.7 3.3
Source: FAOSTAT online database.

5
Maize Breeding Research andSeed Supply
In eastern and southern Africa, as in other
developing regions, seed of modern maize varieties
reaches farmers through the efforts of many different
organizations, including public national research
institutes, public and parastatal seed production
agencies, private multinational and national seed
companies, public international agricultural
research centers, NGOs, and farmer cooperatives.
Over the years as the institutional and policy
environment has evolved, some division of labor has
emerged, and many of these organizations have
become quite specialized.
Policies Affecting National MaizeSeed Industries
During the 1980s and 1990s, many countries in
eastern and southern Africa made significant
progress in liberalizing and restructuring their maize
sectors. Policy and institutional reforms targeted
both output markets (markets for maize grain) as
well as input markets (markets for maize seed).
Reform of maize grain markets started earlier,
however, and therefore has gone on longer.
The distinction between output and input
markets is important, because reforms needed to
restructure grain markets often differ from those
required to induce desired changes in seed markets.
In attempting to reform output markets, policy
makers are interested mainly in the welfare of
consumers, given the importance of maize as the
major food staple for the vast majority of the
population. In the case of input markets, policy
makers are interested mainly in the welfare of
producers, since improved maize seed is a key
component of maize production technology. The
distinction is to some extent arbitrary, however,
because output and input markets are linked,
directly and indirectly. For instance, efforts to help
consumers by imposing a ceiling on grain prices
represent a disincentive to maize farmers; if price
controls reduce the profitability of maize production,
farmers may respond by reducing the area planted,
which in turn will depress the demand for seed and
reduce availability of maize grain to consumers.
Similarly, improved seed is an important input in
maize production, the price of which directly
influences production costs and hence farmers’
income. Thus the availability and price of maize seed
influence farmers’ production decisions, which in
turn affect the total supply of grain maize and
determine its price and availability to consumers.
Given the importance of seed as a key technology
component, the maize seed industry often receives
special attention from policy makers (Tripp 1998,
Pray and Tripp 1998). In eastern and southern Africa,
as in many regions of the world, targeted
institutional and policy provisions are in place to
ensure that national seed industries perform well.
For example, varietal registration and seed
certification are mandatory in most countries,
ostensibly to control the genetic and physical purity
of commercial seed sold to farmers. Moreover,
policies related to restricting or increasing
participation in the seed industry, foreign investment
and trade in commercial seed, price controls and
intellectual property rights for protection of
germplasm ownership are the norm.
Table 3. Maize imports, consumption, and utilization,1994-96
Eastern Westernand and All
southern central developingAfrica Africa countries World
Net imports (000 t),1994-96 -588 119 27,937 -
Per capita netimports (kg/yr), 1994-96 -2 <1 6 -
Per capita consumption(kg/yr), 1994-96 79 43 66 98
Growth in consumption percapita (%/yr), 1987-96 -0.7 1.7 2.6 0.9
Percentage used for humanconsumption, 1994-96 73 95 30 17
Percentage used for animalfeed, 1994-96 18 NA 56 66
Note: NA = Not available.Source CIMMYT (1999).

6
How have national maize seed industries in
eastern and southern Africa been affected by recent
changes in the prevailing policy environment?
Private seed companies are currently operating in
all of the surveyed countries. The presence of an
active private seed industry reflects a fundamental
shift in policy, as private-sector participation was
legally proscribed in most countries until recently.
However, implicit restrictions limiting the
participation of private seed companies are still in
place in most countries. Barriers to entry faced by
private firms include lengthy varietal registration
procedures and mandatory seed certification
requirements (Table 4).
One important policy change affecting national
maize seed industries in all of the surveyed countries
has been the lifting of restrictions on the importation
of commercial maize seed. This change promises to
be particularly beneficial for small countries in
which the limited size of the seed market makes
establishment of local seed production capacity
uneconomic. It may also benefit countries in which
multinational firms have refrained from selling their
best hybrids for fear of losing the valuable inbred
lines to competitors. In several countries, however,
commercial seed imports are still subject to import
duties; if these duties are passed along in the form
of higher prices, imported seed may be unaffordable
for many farmers. While direct controls on maize
seed prices have significantly diminished,
governments in some countries continue to attempt
to influence seed prices indirectly, for example by
subsidizing the price of seed produced by public
agencies.
The recent policy reforms are encouraging, but
one area in which significant progress has yet to be
made is in the area of intellectual property rights.
As of 1998, no country in eastern and southern Africa
was a signatory to the International Union for the
Protection of New Varieties (UPOV) agreement,
although several countries had enacted plant
varietal protection laws or had extended patent
protection statutes to plant varieties and/or plant
genetic materials (Table 4). Yet even if intellectual
property regimes relating to plant germplasm are
still relatively undeveloped, some organizations are
successfully using legal measures to appropriate
benefits from investments in breeding research. For
example, in Malawi, Mozambique, South Africa, and
Tanzania, public research institutes collect royalties
from private companies on the use of public
varieties.
Table 4. Policies affecting national maize seed industries, eastern and southern Africa, 1998
Plant Average timeSeed Public Seed Mandatory variety Plant Varietal needed for Royalties
Country/ price seed imports seed protection laws patents registration completing on publicregion control production allowed certification on maize for maize required registration material
Eastern Africa:Ethiopia - Yes Yes Yes Yes Yes Yes 3 NoKenya - No Yes Yes Yes Yes Yes 3 NoUganda - No Yes Yes No No Yes - No
Southern Africa:Angola - - - - - - - - -Lesotho - Yes Yes Yes No No Yes 0.5 NoMalawi No No Yes No No No No 3 NoMozambique - No Yes Yes No No No 3 YesSouth Africa - No Yes Yes No No Yes 2 YesSwaziland No No Yes No Yes No Yes 1 YesTanzania No No Yes Yes No No Yes - NoZambia - Yes Yes Yes Yes Yes Yes 1.5 NoZimbabwe - No Yes Yes No No Yes 4 Yes
Source: CIMMYT Maize Research Impacts Survey, 1998/99.

7
Structure of National Maize SeedIndustries
Following widespread efforts to liberalize
national seed industries, today there are only four
public maize seed organizations operating in eastern
and southern Africa, compared to 47 private seed
companies (Table 5). Between 1992 and 1998, the
number of public maize seed organizations
decreased by nearly half, whereas the number of
private maize seed companies more than doubled.
Changes in the relative numbers of public and
private seed companies were reflected in a shift in
the composition of seed sales. At the beginning of
the 1990s, public and parastatal seed agencies
accounted for most of the commercial maize seed
sold in eastern and southern Africa, but by the latter
half of the decade, private companies were
supplying about 95% of the total amount sold (just
over 90,000 tons were sold in 1996).
In the four countries that still have public seed
organizations, only in Tanzania has the importance
of the public seed industry declined in the face of
growing competition from the private sector. In
Angola, Ethiopia, and Uganda, public seed
organizations continue to hold sizeable market
shares, and private seed companies have made few
inroads. The factors that have contributed to the
continuing dominance of the public seed industry
in these three countries are unique to each country.
In Angola, the political atmosphere is not yet ripe
for private seed companies to start doing business,
mainly due to continuing civil strife. (The eight
“private companies” listed for Angola in Table 5 are
all NGOs, some of which distribute seed at no cost.)
In Ethiopia, policy makers have been unusually
reluctant to encourage the emergence of a private
maize seed industry. In Uganda, commercial
incentives needed to attract private-sector
investment have been lacking, and the only maize
seed company currently in operation is a public seed
production project based at Kwanda Agricultural
Research Centre.
The data presented in Table 5 clearly show that
except for the four countries mentioned earlier,
during the 1990s the private sector assumed control
of national maize seed industries throughout most
of eastern and southern Africa. It is important to note
however, that in several countries (e.g., Malawi,
Zimbabwe, Zambia), the leading private seed
company is merely a transformed version of what
was previously a public or parastatal agency. Since
often these public or parastatal agencies had enjoyed
monopoly status, their privatization has left the
national maize seed market heavily dominated by a
single firm. Although the entry of additional private
companies is expected to improve industry
competitiveness in the future, currently the
transformed parastatals remain in control of more
than 80% of the national maize seed market in several
countries.
The ability of the transformed state and parastatal
seed agencies to maintain their dominant position
can be explained by a number of factors. At the time
of their privatization, these companies inherited
well-established networks of seed growers,
conditioning and storage facilities, distribution
depots, and wholesale and retail distribution
networks. Furthermore, these companies enjoyed
(and in many cases continue to enjoy) a privileged
relationship with the public research systems that
have been the source of most of the popular
commercial hybrids grown in the region.2
The situation is hardly static, however, and
indeed the structure of many national maize seed
industries continues to change. Since the initial wave
of privatization, additional concentration has taken
2 For a more detailed review of the evolution of maize seed production and marketing in eastern and southern Africa,see Rusike and Smale (1998), Rusike (1998) Howard and Mungoma (1997), Smale and Heisey (1997), Hassan andKaranja (1997), Rusike and Eicher (1997) and Eicher and Kupfuma (1997).

8
Organization of Maize Research
Many countries in eastern and southern Africa
feature very strong public maize breeding programs.
Historically, these public breeding programs have
played a crucial role in transforming local maize
production practices. For example in Kenya, South
Africa, and Zimbabwe, public maize breeding
efforts began more than 50 years ago, and public
breeding programs in these countries continue to
be the main source of improved germplasm (see van
Rensburg 1994, Byerlee and Jewell 1997, Eicher and
Kupfuma 1997, Hassan et al. 1998). Until quite
place in several countries as a result of mergers and
acquisitions among private companies. Although
industrial concentration could be beneficial if it
allows seed companies to capture scale economies
and to pass the resulting cost savings along to
farmers in the form of lower seed prices, industrial
concentration could also be harmful if it leads to
reduced competition in the seed industry. Reduced
competition could allow companies to engage in
monopolistic pricing practices, which might
threaten the affordability of improved maize seed
for the small-scale, subsistence-oriented farmer.
Table 5. Maize seed organizations and seed sales, eastern and southern Africa, 1996
Public seed companies Private seed companiesTotal
Percentage Percentage maizeNumber Number of seed of seed seed
in in sales in Total in Multi- sales in sales inCountry/region 1992a 1996 1996 1992 National national Otherb Total 1996 1996 (t)
Ethiopia 1 1 92 1 0 1 1 2 8 2,630Kenya 0 0 0 1 2 2 1 5 100 17,220Uganda 1 1 0 0 0 0 1 1 100 796
Eastern Africa 2 2 9 2 2 3 3 8 88 20,646
Angola - 1 74 - 0 0 8 8 26 1,859Lesotho 0 0 0 4 0 3 1 4 100 1,302Malawi 0 0 0 2 1 1 1 3 100 3,140Mozambique 2 0 0 0 1 0 0 1 100 1,780South Africa 1 0 0 5 3 2 2 7 100 39,257Swaziland - 0 0 - 0 3 1 4 100 723Tanzania 1 1 52 4 0 2 1 3 48 1,340Zambia 1 0 0 1 2 1 1 4 100 2,600Zimbabwe 0 0 0 4 2 2 1 5 100 19,000
Southern Africa 5 2 3 20 9 14 16 39 97 71,000Southern Africa,
excludingSouth Africa 4 2 6 5 6 12 14 32 94 31,743
Eastern andsouthern Africa 7 4 5 22 11 17 18 47 95 91,646
Eastern andsouthern Africa,excludingSouth Africa 6 4 9 17 8 15 16 40 91 52,389
Source: CIMMYT Maize Research Impacts Survey, 1998/99.a CIMMYT (1994).b Mainly NGOs (in Angola and South Africa) and national seed dealers importing seed from multinational companies based in other countries
(in the remaining countries).
Number in 1996

9
recently, in almost all of the countries covered by
the CIMMYT survey, public breeding programs
were the only source of improved maize germplasm
adapted to local conditions.
Traditionally, public breeding programs in
eastern and southern Africa did not engage directly
in seed production. Improved varieties released by
public breeding programs were usually handed over
to public or parastatal seed agencies, which
multiplied seed for sale to farmers. The public and
parastatal seed agencies often enjoyed a de facto
legal monopoly; regulations restricting the
participation of private companies in the maize seed
industry were common in almost all countries
(López-Pereira and Morris 1994).
Except for Lesotho and Swaziland,3 all of the
countries covered by the CIMMYT survey currently
feature public maize breeding programs that engage
in varietal development activities (Table 6). Public
and parastatal seed organizations no longer engage
in varietal improvement research; the four public
seed companies still in operation (in Angola,
Ethiopia, Tanzania, and Uganda) have eliminated
their research divisions and now serve exclusively
as the seed multiplication arm of the national
breeding program. Half of the private seed
companies surveyed (14 out of 28) maintain in-
house breeding programs and produce improved
germplasm. The rest of the private companies that
operate in the region either import seed from foreign
affiliates or restrict themselves to multiplying seed
of varieties developed by another branch of their
company located elsewhere in the region.
Two international agricultural research centers
that are members of the Consultative Group for
International Agricultural Research (CGIAR)
provide support to national maize research
programs in Africa: CIMMYT and the International
Institute for Tropical Agriculture (IITA). These two
centers, whose mandate is to strengthen and support
maize research capacity in developing countries,
have developed strong linkages with national maize
research programs.
Since IITA focuses mainly on western and central
Africa, CIMMYT has by far the stronger presence
in eastern and southern Africa. Through offices in
Ethiopia, Kenya, and Zimbabwe, CIMMYT provides
direct and indirect support to national maize
programs throughout the two regions. CIMMYT
does not provide finished varieties intended for
release directly to farmers. Instead, CIMMYT
Table 6. Number of public and private maize breedingprograms, eastern and southern Africa, 1998
Public agenciesPrivate Total
Research Seed seed agenciesCountry/region organizations companies companies surveyed
Ethiopia 1 0 0 1Kenya 1 0 2 3Uganda 1 0 0 1
Eastern Africa 3 0 2 5
Angola 1 0 0 1Lesotho 0 0 0 0Malawi 1 0 0 1Mozambique 1 0 1 2South Africa 1 0 5 6Swaziland 0 0 0 0Tanzania 1 0 0 1Zambia 1 0 1 2Zimbabwe 1 0 5 6
Southern Africa 7 0 12 19Southern Africa,
excludingSouth Africa 6 0 7 13
Eastern andsouthern Africa 10 0 14 24
Eastern andsouthern Africa,
excludingSouth Africa 9 0 9 18
Source: CIMMYT Maize Research Impacts Survey, 1998/99.
3 Swaziland’s small public breeding program tests varieties released elsewhere (mainly in South Africa) to determinetheir suitability for Swaziland farmers.

10
develops and distributes intermediate germplasm
products that are designed to be used as inputs into
public and private breeding programs.
During the 1960s and 1970s, much of the maize
germplasm provided by CIMMYT to national
breeding programs in eastern and southern Africa
originated from CIMMYT’s breeding program in
Mexico. After it became evident that materials
developed in Mexico required substantial additional
selection in order to become adapted to African
production environments, in 1985 CIMMYT
established a major regional research station in
Zimbabwe to strengthen its maize breeding efforts
in eastern and southern Africa. The function of the
regional breeding program in Zimbabwe is to
develop stress-tolerant, high-yielding maize
germplasm adapted to the mid-altitude
environments of eastern and southern Africa.
Germplasm products of the CIMMYT regional
breeding program include sources of resistance to
prevalent biotic and abiotic constraints, open
pollinated varieties, and inbred lines for use in
hybrid formation.
Currently more than 100 seed shipments are
distributed each year from the CIMMYT Harare
program to breeding programs located throughout
eastern and southern Africa. These shipments
include more than 200 yield trials (each consisting
of a set of elite varieties) and several hundred
experimental lines. In accordance with standard
CIMMYT policy, germplasm developed by
CIMMYT is available free of charge to researchers
in public and private breeding programs, both
within the region as well as elsewhere throughout
the world.
Public and Private Investment inMaize Breeding
Managers of public and private maize breeding
programs contacted for the CIMMYT impacts survey
were asked to provide information about human and
financial investments in maize breeding research. In
eastern Africa, the number of maize scientists
employed in the public sector far exceeds the number
employed in the private sector (Tables 7 and 8). In
southern Africa, by contrast, the number of scientists
employed in the two sectors is very similar. These
numbers suggest that maize breeding in eastern
Africa remains largely concentrated within the
public sector, unlike in southern Africa, where
private breeding programs have made considerable
advances.
With regards to the intensity of research
investment (measured here as the number of
research scientists employed per million hectares of
maize area planted), significant differences are
evident by sector and region. Public research
organizations in eastern Africa employ more than
twice as many maize scientists per million hectares
of maize area planted as public research
organizations in southern Africa. This pattern is
reversed in the private sector: private breeding
programs have concentrated their investments in
southern Africa, while largely ignoring eastern
Africa.
What can be said about the productivity of maize
scientists employed in the public and private sectors?
Based on the average number of varieties released,
scientists employed in the private sector have been
twice as productive as scientists employed in the
public sector, both in eastern and southern Africa.4
The figures can be expected to change, however, as
the private seed industry matures. Since private seed
4 The figures in Tables 7 and 8 may understate the relative productivity of scientists working in the private sector,because the productivity measure for private-sector scientists takes into account only varieties being sold in 1998. Bycontrast, the productivity measure for public-sector scientists takes into account all varieties released between 1966and 1998, a much longer period.

11
Table 7. Human resources invested in maize research, public sector, eastern and southern Africa, 1998
Human resources in research (FTE)a Number of Number ofNumber of scientists cultivars
Number of Number of non- Total per releasedsenior junior research human million ha per senior
Country/region scientists scientists Other Total support resources maize scientist
Ethiopia 3.0 14.0 60.0 77.0 0.0 77.0 1.7 4.0Kenya 30.0 10.0 910.0 950.0 51.0 1,001.0 21.7 0.7Uganda 2.0 2.0 14.0 18.0 0.0 18.0 3.6 1.0
Eastern Africa 35.0 26.0 984.0 1,045.0 51.0 1,096.0 9.4 1.0
Angola 3.3 11.0 3.0 17.5 5.0 22.5 5.0 2.0Lesotho 0.5 0.5 1.2 2.2 3.4 5.6 2.7 0.0Malawi 7.0 4.0 27.0 38.0 13.0 51.0 5.4 3.4Mozambique 2.0 2.0 37.0 41.0 0.0 41.0 1.8 3.0South Africa 20.0 0.0 40.0 60.0 0.0 60.0 5.3 0.4Swaziland 0.0 6.0 25.7 31.7 0.0 31.7 0.0 -Tanzania 11.0 0.0 18.0 29.0 81.0 110.0 6.1 1.6Zambia 3.5 1.0 50.0 54.5 0.0 54.5 5.4 6.3Zimbabwe 0.2 2.0 24.0 26.2 9.2 35.4 0.2 60.0
Southern Africa 47.7 26.5 225.9 300.1 111.6 411.7 4.4 2.2Southern Africa,
excluding South Africa 27.7 26.5 185.9 240.1 111.6 351.7 3.9 3.5
Eastern and southern Africa 72.7 52.5 1,209.9 1,345.1 162.6 1,507.7 5.0 1.9Eastern and southern Africa,
excluding South Africa 62.7 52.5 1,169.9 1,285.1 162.6 1,447.7 5.8 2.1
Source: CIMMYT Maize Research Impacts Survey, 1998/99.a FTE = Full-time equivalents.
Table 8. Human resources invested in maize research, private sector, eastern and southern Africa, 1998
Human resources in research (FTE)a Number of Number ofNumber of scientists cultivars
Number of Number of non- Total per releasedsenior junior research human million ha per senior
Country/region scientists scientists Other Total support resources maize scientist
Ethiopia - - - - - - - -Kenya 3.0 2.0 51.0 56.0 176.0 232.0 2.2 1.7Uganda 0.0 0.0 0.0 0.0 65.0 65.0 - -
Eastern Africa 3.0 2.0 51.0 56.0 241.0 297.0 0.8 2.0
Angola - - - - - - - -Lesotho - - - - - - - -Malawi 0.0 0.0 0.0 0.0 1.0 1.0 0.0 -Mozambique 1.0 0.0 9.0 10.0 482.0 492.0 0.9 6.0South Africa 35.0 11.5 155.5 202.0 227.5 429.5 9.3 1.9Swaziland - - - - - - - -Tanzania 2.0 1.0 11.0 14.0 209.0 223.0 1.1 2.8Zambia 1.0 0.5 20.0 21.5 66.0 87.5 1.5 2.0Zimbabwe 5.5 6.0 137.5 149.0 685.5 834.5 4.1 6.2
Southern Africa 44.5 19.0 333.0 396.5 1,671.0 2,067.5 4.1 2.9Southern Africa,
excluding South Africa 9.5 7.5 177.5 194.5 1,443.5 1,638.0 1.3 6.6
Eastern and southern Africa 47.5 21.0 384.0 452.5 1,912.0 2364.5 3.3 2.9Eastern and southern Africa,
excluding South Africa 12.5 9.5 228.5 250.5 1684.5 1,935.0 1.2 5.5
Source: CIMMYT Maize Research Impacts Survey, 1998/99.a FTE = Full-time equivalents.

12
companies are still relatively new in most countries
of eastern and southern Africa, they have been
releasing varieties at an unusually high rate in an
effort to win a greater share of markets that have
long been dominated by public agencies.
Investment indicators and productivity indices
based on numbers of scientists can be misleading if
they conceal significant differences in levels of
financial support received by each scientist. Table 9
summarizes data on the cost of supporting senior
maize scientists in the public and private sectors
(salary and benefits, operating budgets). In both
eastern and southern Africa, maize scientists
employed in the private sector receive nearly twice
as much financial support as maize scientists
employed in the public sector. These data may
explain the productivity difference between the
public and private sectors; private-sector scientists
produce twice as many varieties as public-sector
scientists, but they do so with double the financial
resources.
In interpreting the data relating to research
investment and research productivity, it is important
to remember that the average number of varieties
released per scientist is not an ideal measure of
research productivity, because all scientists may not
have the same objectives. For example, scientists
working in public breeding programs typically place
greater emphasis on “upstream” research activities,
such as population improvement, development of
special trait materials, and other forms of “pre-
breeding” work, whereas scientists working for
private seed companies typically place greater
emphasis on development of finished varieties.
Furthermore, scientists working in the private sector
are usually supported by well-established testing,
production, and marketing systems, whose goal is
to increase seed sales and maximize profits. By
contrast, scientists working in the public sector
normally face less pressure to increase sales and
profits; instead, they are often encouraged to focus
on activities that are expected to generate important
social benefits.
Patterns of MaizeVarietal Releases
The impacts of maize breeding research
ultimately are felt when modern varieties are
adopted and grown in farmers’ fields. Farm-level
technology adoption decisions are affected by many
factors that cannot be controlled directly by breeders,
however, so varietal adoption rates provide an
imperfect measure of breeding productivity.
Widespread adoption of modern varieties indicates
that breeding efforts have been productive, but lack
of adoption does not necessarily mean that breeding
efforts have been unproductive. In many instances
breeding programs have developed excellent
varieties, only to see adoption stymied by
Table 9. Cost (US$/year) of supporting a senior maizescientist, eastern and southern Africa, 1998
Public sector Private sector
Salary Salaryand Operating and Operating
Country/region benefits budget benefits budget
Ethiopia 3,429 - - -Kenya 6,667 8,333 - -Uganda 5,100 - - -
Eastern Africa 5,065 7,276 - -
Angola 3,117 - - -Lesotho - - - -Malawi 1,750 3,205 - -Mozambique 7,200 - 19,667 28,111South Africa 31,915 51,643 50,531 -Swaziland 19,557 - - -Tanzania 1,440 - 12,000 24,000Zambia 2,400 2,248 750 5,875Zimbabwe 10,667 13,201 11,667 -
Southern Africa 9,756 12,161 18,923 11,597Southern Africa,
excludingSouth Africa 6,590 6,520 11,021 14,497
Eastern andsouthern Africa 7,410 9,718 18,923 11,597
Eastern andsouthern Africa,excluding South Africa 5,827 6,898 11,021 14,497
Source: CIMMYT Maize Research Impacts Survey, 1998/99.

13
bottlenecks in the seed supply system, lack of
economic incentives, lack of awareness on the part
of farmers about new varieties, or other factors.
Numbers and types of varietal releases therefore
provide useful intermediate indicators for judging
the productivity of breeding programs. One
objective of the 1998/99 survey was to update
CIMMYT’s varietal releases database for eastern and
southern Africa. Compared to the original 1992
survey, the 1998/99 survey went to much greater
lengths to collect data from the private sector. Based
on the information provided by many private seed
companies, the varietal releases database was
updated and considerably expanded.
Varietal release data are analyzed in this section
of the report. In comparing the results of the 1998/
99 survey with the results of the earlier 1992 survey,
minor differences can be observed in varietal release
data. Most of these differences arose because a
number of research organizations that were formerly
public or parastatal had been privatized since the
original impacts report was published; varieties
released by these organizations were reclassified as
private-sector releases. In addition, two adjustments
were made to avoid multiple counting of individual
varieties. In cases where two or more organizations
were found to be selling the same variety in a given
country, the variety was listed only once in the
varietal releases database. Similarly, in cases where
the same variety was being sold in two or more
countries, it was listed only once.
Last but not least, it is important to keep in mind
that the temporal coverage of the public- and
private-sector varietal releases databases is not the
same. The public-sector varietal releases database
includes information about all public varieties
released from 1966 through 1998. Since the data form
a complete time series, they provide insights into
changes through time in the numbers and types of
varieties developed by public breeding programs.
In contrast, the more limited private-sector varietal
releases database includes information only about
private-sector varieties that were being sold in the
late 1990s; it does not include information about
private-sector varieties that may have been sold in
the past but that had been discontinued by the late
1990s. The private-sector varietal releases database
thus provides a detailed snapshot of the varieties
available in the market in the late 1990s, but it does
not provide a complete picture of changes that have
occurred through time in the numbers and types of
varieties developed by private seed companies.
Maize Varietal Releases
Summary information about the maize varieties
released by public breeding programs in eastern and
southern Africa between 1966 and 1998 appears in
Table 10. Of 133 total releases, one-quarter (35) were
varieties developed in eastern Africa, and three-
quarters (98) were varieties developed in southern
Africa. While the absolute number of releases was
much greater in southern Africa, since the area
planted to maize is also much greater in southern
Africa, the number of releases per million hectares
of maize was similar across the two regions.
Regional differences are evident in the types of
materials developed by public breeding programs.
In eastern Africa, public-sector releases have been
evenly divided between OPVs and hybrids, while
in southern Africa hybrids have dominated.
Summing across both regions, hybrids have
constituted a 30% greater share in the overall
number of releases. Interestingly, the composition
of public-sector varietal releases has not changed
appreciably in recent years. The share of hybrids
increased during the 1960s and 1970s before
stabilizing in the 1980s at about 55% (Figure 1).
Regional differences also are evident in the types
of hybrids that have been released. Almost all the
hybrids released in eastern Africa have been double-
cross hybrids, top-cross hybrids, or varietal hybrids.
In contrast, breeding programs in southern Africa
seem to have emphasized “large hybrid vigor,” as
more than 70% of the hybrids released in southern
Africa have been single-cross hybrids or three-way-
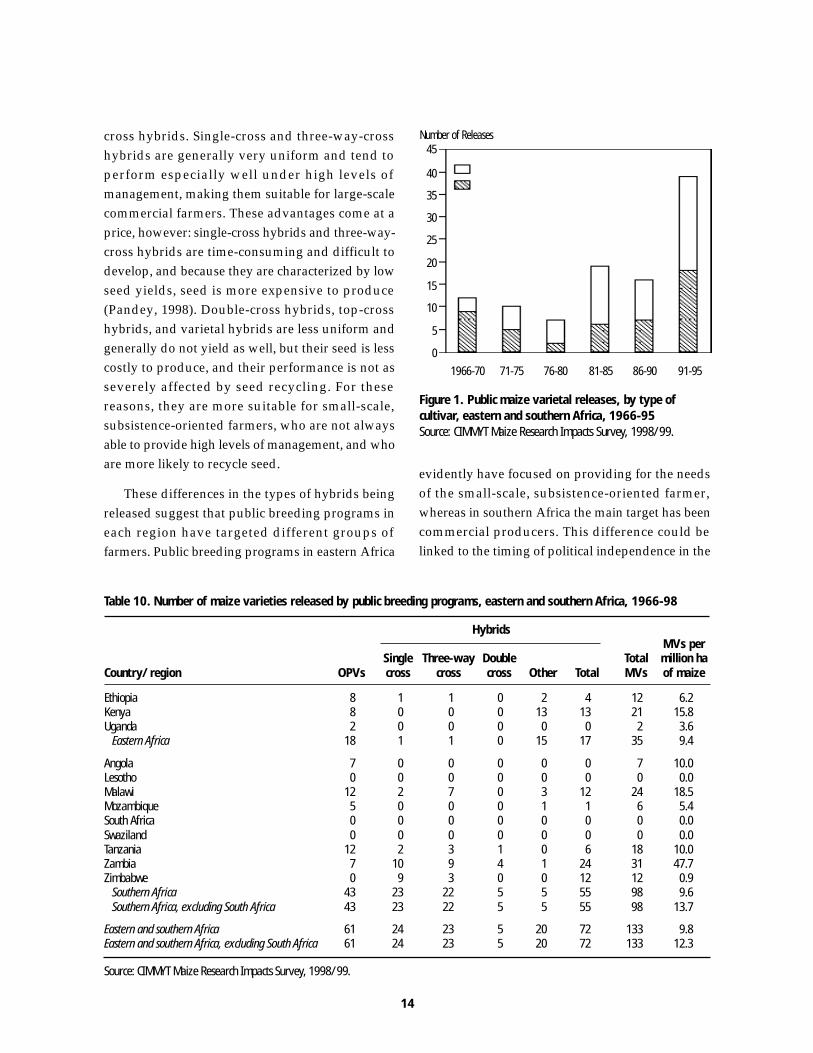
14
cross hybrids. Single-cross and three-way-cross
hybrids are generally very uniform and tend to
perform especially well under high levels of
management, making them suitable for large-scale
commercial farmers. These advantages come at a
price, however: single-cross hybrids and three-way-
cross hybrids are time-consuming and difficult to
develop, and because they are characterized by low
seed yields, seed is more expensive to produce
(Pandey, 1998). Double-cross hybrids, top-cross
hybrids, and varietal hybrids are less uniform and
generally do not yield as well, but their seed is less
costly to produce, and their performance is not as
severely affected by seed recycling. For these
reasons, they are more suitable for small-scale,
subsistence-oriented farmers, who are not always
able to provide high levels of management, and who
are more likely to recycle seed.
These differences in the types of hybrids being
released suggest that public breeding programs in
each region have targeted different groups of
farmers. Public breeding programs in eastern Africa
Table 10. Number of maize varieties released by public breeding programs, eastern and southern Africa, 1966-98
HybridsMVs per
Single Three-way Double Total million haCountry/region OPVs cross cross cross Other Total MVs of maize
Ethiopia 8 1 1 0 2 4 12 6.2Kenya 8 0 0 0 13 13 21 15.8Uganda 2 0 0 0 0 0 2 3.6
Eastern Africa 18 1 1 0 15 17 35 9.4
Angola 7 0 0 0 0 0 7 10.0Lesotho 0 0 0 0 0 0 0 0.0Malawi 12 2 7 0 3 12 24 18.5Mozambique 5 0 0 0 1 1 6 5.4South Africa 0 0 0 0 0 0 0 0.0Swaziland 0 0 0 0 0 0 0 0.0Tanzania 12 2 3 1 0 6 18 10.0Zambia 7 10 9 4 1 24 31 47.7Zimbabwe 0 9 3 0 0 12 12 0.9
Southern Africa 43 23 22 5 5 55 98 9.6Southern Africa, excluding South Africa 43 23 22 5 5 55 98 13.7
Eastern and southern Africa 61 24 23 5 20 72 133 9.8Eastern and southern Africa, excluding South Africa 61 24 23 5 20 72 133 12.3
Source: CIMMYT Maize Research Impacts Survey, 1998/99.
Number of Releases45
40
35
30
25
20
15
10
5
0
1966-70 71-75 76-80 81-85 86-90 91-95
Figure 1. Public maize varietal releases, by type ofcultivar, eastern and southern Africa, 1966-95Source: CIMMYT Maize Research Impacts Survey, 1998/99.
Open-pollinated varietiesHybrids
evidently have focused on providing for the needs
of the small-scale, subsistence-oriented farmer,
whereas in southern Africa the main target has been
commercial producers. This difference could be
linked to the timing of political independence in the

15
two regions: many countries in eastern Africa
achieved independence earlier and therefore were
quicker to shift the focus of breeding away from
large-scale commercial production systems (which
had been favored under colonial rule) to smallholder
farming systems (which had traditionally been
neglected).
Summary information about the maize varieties
being sold during the late 1990s by private seed
companies in eastern and southern Africa appears
in Table 11. Compared to public breeding programs,
private seed companies have placed much greater
emphasis on hybrids. Out of 137 total private-sector
releases, only six were OPVs; the remaining 131 (or
95%) were hybrids. Private-sector varietal releases
have originated mainly from southern Africa,
reflecting the much greater amount of private-sector
activity in that region. Only six varieties have been
released by private seed companies in eastern Africa;
the remaining 131 have been released by seed
companies operating in southern Africa (mainly in
Malawi, South Africa, and Zimbabwe).
Table 11. Number of maize varieties (available in 1998) released by private seed companies, eastern and southern Africa
HybridsMVs per
Single Three-way Double Total million haCountry/region OPVs cross cross cross Other Total MVs of maize
Ethiopia 0 0 1 0 0 1 1 0.6Kenya 0 0 1 1 3 5 5 3.6Uganda 0 0 0 0 0 0 0 0.0
Eastern Africa 0 0 2 1 3 6 6 1.6
Angola 0 0 0 0 0 0 0 0.0Lesotho 0 0 0 0 0 0 0 0.0Malawi 0 0 17 0 0 17 17 13.1Mozambique 3 0 1 1 1 3 6 5.4South Africa 0 14 21 26 7 68 68 20.8Swaziland 0 0 0 0 0 0 0 0.0Tanzania 0 1 3 1 0 5 5 2.8Zambia 0 0 0 2 0 2 2 3.1Zimbabwe 3 2 27 0 1 30 33 24.9
Southern Africa 6 17 69 30 9 125 131 12.0Southern Africa, excluding South Africa 6 3 48 4 2 57 63 8.8
Eastern and southern Africa 6 17 71 31 12 131 137 9.4Eastern and southern Africa, excluding South Africa 6 3 50 5 5 63 69 6.4
Source: CIMMYT Maize Research Impacts Survey, 1998/99.
Similar to public-sector varietal releases, the
composition of private-sector varietal releases has
not changed appreciably in recent years.
Summarizing across the two regions, the share of
hybrids increased during the 1960s and 1970s before
stabilizing in the 1980s at about 95% (Figure 2).
Number of Releases60
50
40
30
20
10
01976-80 81-85 86-90 91-95 post-1995
Figure 2. Private maize varietal releases, by type ofcultivar, eastern and southern Africa, 1976-98Source: CIMMYT Maize Research Impacts Survey, 1998/99.
Open-pollinated varietiesHybrids

16
In terms of the types of hybrids that have been
released by private seed companies, regional
differences are evident. In eastern Africa, the number
of “high vigor” hybrids (single crosses, three-way
crosses) has been half as large as the number of “low
vigor” hybrids (double crosses, top crosses, varietal
hybrids). By contrast, in southern Africa “high
vigor” hybrids have clearly dominated.
Taking into account both public-sector and
private-sector releases, and adjusting for differences
in the area planted to maize in each region, relatively
more varieties have been developed for southern
Africa (21.6 varieties per million ha maize area) than
for eastern Africa (11.0 varieties per million ha maize
area). This could be due to the greater diversity of
maize production environments found in southern
Africa, to the higher level of competition prevailing
in the private seed industry in southern Africa, or
both.
In attempting to discern trends through time in
patterns of varietal releases, it is important to
remember that the temporal coverage of the public-
sector varietal releases database is much more
complete than that of the private-sector varietal
releases database. Despite the lack of information
Proportion of releases100%
80%
60%
40%
20%
01966-70 71-75 76-80 81-85 86-90 91-95
Figure 3b. Trends in maize varietal releases, by type ofcultivar, eastern and southern Africa, 1966-98Source: CIMMYT Maize Research Impacts Survey, 1998/99.
Open-pollinated varieties Hybrids
about private-sector releases in earlier years,
however, there has clearly been significant growth
through time in the proportion of releases coming
from the private sector. Of all new varieties released
since 1995, close to 100% have come from private
seed companies (Figure 3a). Not surprisingly, given
the commercial orientation of private seed
companies, nearly 95% of these releases consisted
of hybrids (Figure 3b).
Ecological Adaptation
The ecological adaptation of maize varieties
released by public breeding programs and private
seed companies in eastern and southern Africa
reflects the characteristics of local production
environments (Tables 12 and 13). About two-thirds
(66%) of all released varieties have been adapted to
subtropical environments, which is roughly
congruent with the share of subtropical
environments in the region. Another 13% of all
released varieties have been adapted to lowland
tropical environments, and an additional 10% have
been adapted to mid-altitude environments. Just
under 6% of all released varieties have been adapted
to highland environments; these highland varieties
Proportion of releases100%
80%
60%
40%
20%
01966-70 71-75 76-80 81-85 86-90 91-95
Figure 3a. Trends in maize varietal releases, by sector,eastern and southern Africa, 1966-98Source: CIMMYT Maize Research Impacts Survey, 1998/99.
Public-sector releases Private-sector releases
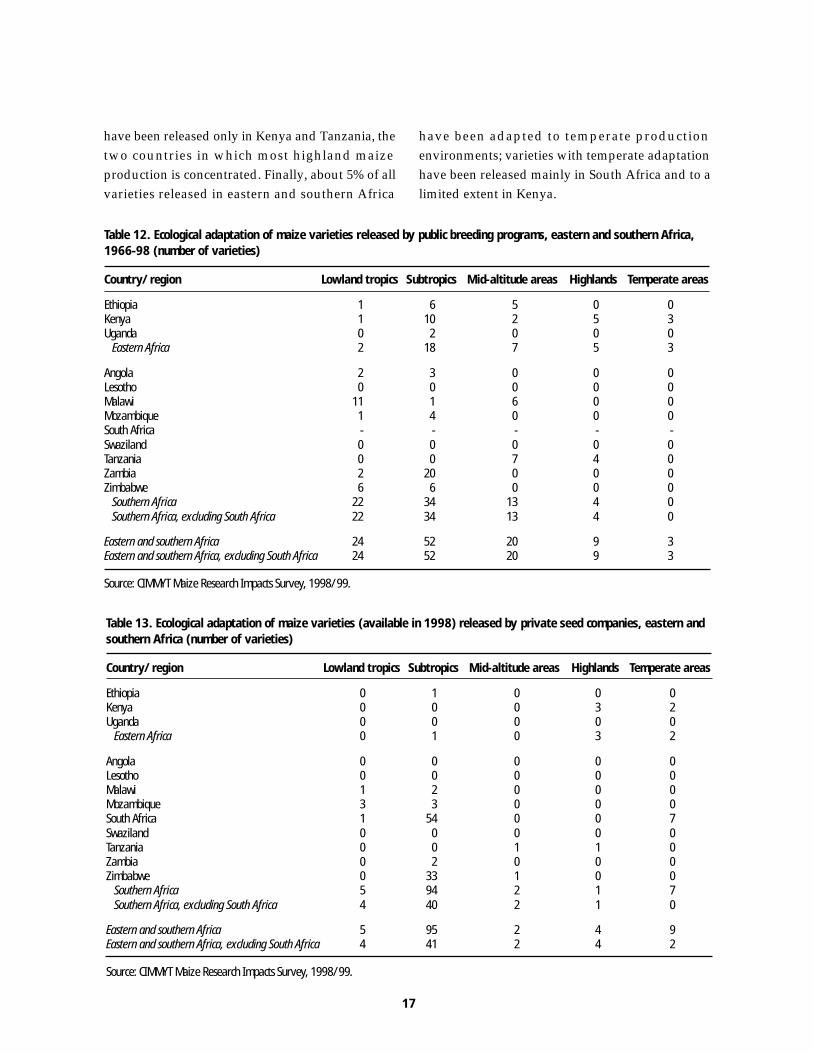
17
Table 12. Ecological adaptation of maize varieties released by public breeding programs, eastern and southern Africa,1966-98 (number of varieties)
Country/region Lowland tropics Subtropics Mid-altitude areas Highlands Temperate areas
Ethiopia 1 6 5 0 0Kenya 1 10 2 5 3Uganda 0 2 0 0 0
Eastern Africa 2 18 7 5 3
Angola 2 3 0 0 0Lesotho 0 0 0 0 0Malawi 11 1 6 0 0Mozambique 1 4 0 0 0South Africa - - - - -Swaziland 0 0 0 0 0Tanzania 0 0 7 4 0Zambia 2 20 0 0 0Zimbabwe 6 6 0 0 0
Southern Africa 22 34 13 4 0Southern Africa, excluding South Africa 22 34 13 4 0
Eastern and southern Africa 24 52 20 9 3Eastern and southern Africa, excluding South Africa 24 52 20 9 3
Source: CIMMYT Maize Research Impacts Survey, 1998/99.
Table 13. Ecological adaptation of maize varieties (available in 1998) released by private seed companies, eastern andsouthern Africa (number of varieties)
Country/region Lowland tropics Subtropics Mid-altitude areas Highlands Temperate areas
Ethiopia 0 1 0 0 0Kenya 0 0 0 3 2Uganda 0 0 0 0 0
Eastern Africa 0 1 0 3 2
Angola 0 0 0 0 0Lesotho 0 0 0 0 0Malawi 1 2 0 0 0Mozambique 3 3 0 0 0South Africa 1 54 0 0 7Swaziland 0 0 0 0 0Tanzania 0 0 1 1 0Zambia 0 2 0 0 0Zimbabwe 0 33 1 0 0
Southern Africa 5 94 2 1 7Southern Africa, excluding South Africa 4 40 2 1 0
Eastern and southern Africa 5 95 2 4 9Eastern and southern Africa, excluding South Africa 4 41 2 4 2
Source: CIMMYT Maize Research Impacts Survey, 1998/99.
have been released only in Kenya and Tanzania, the
two countries in which most highland maize
production is concentrated. Finally, about 5% of all
varieties released in eastern and southern Africa
have been adapted to temperate production
environments; varieties with temperate adaptation
have been released mainly in South Africa and to a
limited extent in Kenya.
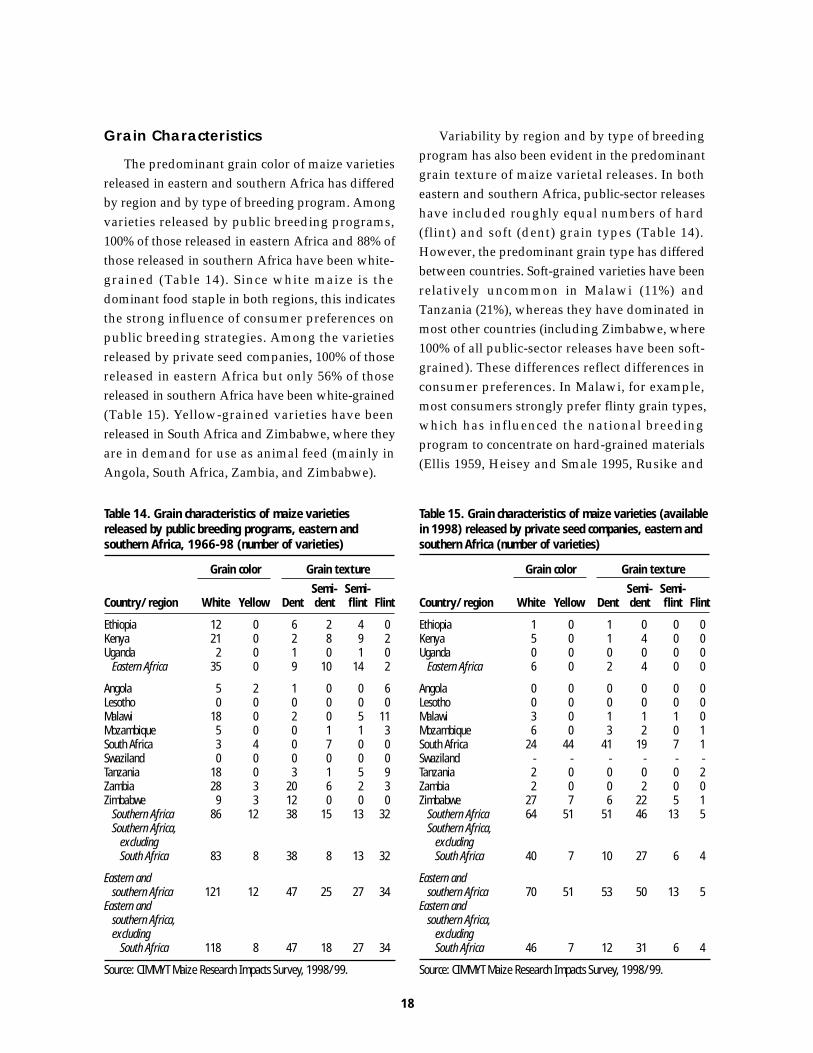
18
Table 14. Grain characteristics of maize varietiesreleased by public breeding programs, eastern andsouthern Africa, 1966-98 (number of varieties)
Grain color Grain texture
Semi- Semi-Country/region White Yellow Dent dent flint Flint
Ethiopia 12 0 6 2 4 0Kenya 21 0 2 8 9 2Uganda 2 0 1 0 1 0
Eastern Africa 35 0 9 10 14 2
Angola 5 2 1 0 0 6Lesotho 0 0 0 0 0 0Malawi 18 0 2 0 5 11Mozambique 5 0 0 1 1 3South Africa 3 4 0 7 0 0Swaziland 0 0 0 0 0 0Tanzania 18 0 3 1 5 9Zambia 28 3 20 6 2 3Zimbabwe 9 3 12 0 0 0
Southern Africa 86 12 38 15 13 32Southern Africa,
excludingSouth Africa 83 8 38 8 13 32
Eastern andsouthern Africa 121 12 47 25 27 34
Eastern andsouthern Africa,excluding
South Africa 118 8 47 18 27 34
Source: CIMMYT Maize Research Impacts Survey, 1998/99.
Table 15. Grain characteristics of maize varieties (availablein 1998) released by private seed companies, eastern andsouthern Africa (number of varieties)
Grain color Grain texture
Semi- Semi-Country/region White Yellow Dent dent flint Flint
Ethiopia 1 0 1 0 0 0Kenya 5 0 1 4 0 0Uganda 0 0 0 0 0 0
Eastern Africa 6 0 2 4 0 0
Angola 0 0 0 0 0 0Lesotho 0 0 0 0 0 0Malawi 3 0 1 1 1 0Mozambique 6 0 3 2 0 1South Africa 24 44 41 19 7 1Swaziland - - - - - -Tanzania 2 0 0 0 0 2Zambia 2 0 0 2 0 0Zimbabwe 27 7 6 22 5 1
Southern Africa 64 51 51 46 13 5Southern Africa,
excludingSouth Africa 40 7 10 27 6 4
Eastern andsouthern Africa 70 51 53 50 13 5
Eastern andsouthern Africa,
excludingSouth Africa 46 7 12 31 6 4
Source: CIMMYT Maize Research Impacts Survey, 1998/99.
Grain Characteristics
The predominant grain color of maize varieties
released in eastern and southern Africa has differed
by region and by type of breeding program. Among
varieties released by public breeding programs,
100% of those released in eastern Africa and 88% of
those released in southern Africa have been white-
grained (Table 14). Since white maize is the
dominant food staple in both regions, this indicates
the strong influence of consumer preferences on
public breeding strategies. Among the varieties
released by private seed companies, 100% of those
released in eastern Africa but only 56% of those
released in southern Africa have been white-grained
(Table 15). Yellow-grained varieties have been
released in South Africa and Zimbabwe, where they
are in demand for use as animal feed (mainly in
Angola, South Africa, Zambia, and Zimbabwe).
Variability by region and by type of breeding
program has also been evident in the predominant
grain texture of maize varietal releases. In both
eastern and southern Africa, public-sector releases
have included roughly equal numbers of hard
(flint) and soft (dent) grain types (Table 14).
However, the predominant grain type has differed
between countries. Soft-grained varieties have been
relatively uncommon in Malawi (11%) and
Tanzania (21%), whereas they have dominated in
most other countries (including Zimbabwe, where
100% of all public-sector releases have been soft-
grained). These differences reflect differences in
consumer preferences. In Malawi, for example,
most consumers strongly prefer flinty grain types,
which has influenced the national breeding
program to concentrate on hard-grained materials
(Ellis 1959, Heisey and Smale 1995, Rusike and

19
Smale 1998). In Tanzania, farmers similarly prefer
flinty grain types, which not only lend themselves
more easily to traditional processing methods (hand
pounding) but also store better. With regard to grain
texture, private seed companies also have
demonstrated sensitivity to consumer preferences,
although in this case the consumers being targeted
are often different. Soft-textured grain types have
dominated among private-sector varietal releases,
accounting for 100% of all releases in eastern Africa
and 84% of all releases in southern Africa (Table
15). Soft-grained dent maize has superior industrial
processing qualities that millers prefer and hence
is preferred by many commercial farmers.
Maturity Classes
Most of the maize varieties released by public
breeding programs since 1966 have been
intermediate or late maturing (Table 16). In eastern
Africa, 20% of all public-sector releases have been
intermediate maturing, and 66% have been late
maturing. In southern Africa, 26% of all public-
sector releases have been intermediate maturing,
and 64% have been late maturing. In contrast, a
larger proportion of the varieties released by private
seed companies have been early maturing. Of all
private-sector releases, 43% of those released in
eastern Africa and 18% of those released in southern
Africa have been early maturing (Table 17).
Breeders in the private sector evidently have placed
more emphasis on developing short-duration
materials that are less vulnerable to drought
occurring late in the growing season.
Since many maize-growing environments in
eastern and southern Africa are susceptible to
drought, especially in areas populated mainly by
small-scale, subsistence-oriented farmers, the
relatively small proportion of short-duration
varieties among all releases suggests that the supply
of germplasm suited to these environments is quite
limited. In an effort to expand the range of
technology choices available to farmers, CIMMYT
recently initiated a major breeding project in
southern Africa, the Southern Africa Drought and
Low Fertility Project. The objective of the project,
which is being carried out in collaboration with
public NARSs and private seed companies, is to
develop materials showing increased drought
tolerance and enhanced nitrogen use efficiency.
Early results appear extremely promising, and
improved germplasm developed through the
project is rapidly making its way into breeding
programs throughout the region.
Table 16. Maturity classes of maize varieties released bypublic breeding programs, eastern and southern Africa,1966-98 (number of varieties)
Extra ExtraCountry/region early Early Intermediate Late late
Ethiopia 1 0 0 6 5Kenya 2 2 6 1 10Uganda 0 0 1 1 0
Eastern Africa 3 2 7 8 15
Angola 2 0 1 2 0Lesotho 0 0 0 0 0Malawi 1 0 14 1 2Mozambique 0 0 1 2 2South Africa 0 0 0 0 0Swaziland 0 0 0 0 0Tanzania 0 2 1 7 1Zambia 0 2 2 3 15Zimbabwe 0 0 0 9 3
Southern Africa 3 4 19 24 23Southern Africa,
excludingSouth Africa 3 4 19 24 23
Eastern andsouthern Africa 6 6 26 32 38
Eastern andsouthern Africa,
excludingSouth Africa 6 6 26 32 38
Source: CIMMYT Maize Research Impacts Survey, 1998/99.

20
Impacts of CIMMYT’s MaizeBreeding Program
The CIMMYT Maize Program, working out of
its headquarters in Mexico and out of regional offices
located in Central and South America, sub-Saharan
Africa, and Asia, produces improved germplasm
that is distributed to public and private breeding
programs around the world for use in developing
finished varieties. Since CIMMYT does not release
finished varieties, the impacts of CIMMYT’s maize
breeding efforts are best estimated by investigating
the extent to which CIMMYT germplasm has been
used by public and private breeding programs. This
is not an easy task. Tracking the use of CIMMYT
germplasm is difficult for several reasons. To begin
with, modern maize breeding is an extremely
complex undertaking. The development of OPVs
and hybrids normally involves repeated cycles of
crossing involving a wide range of source materials;
consequently, it is often very difficult to trace the
complete genetic history of individual varieties.
Documenting the origins of individual varieties is
greatly complicated by the fact that the pedigrees
(genetic background and crossing history) of most
commercial hybrids are confidential, since most
private breeding programs and even some public
ones are reluctant to disclose pedigree information
for fear of providing information that might be
useful to potential competitors.
Despite these difficulties, for this study an
attempt was made to compile information on the
use of CIMMYT-derived germplasm by public and
private maize breeding programs in eastern and
southern Africa. Although it was not possible to
obtain complete pedigree information for most
varieties, especially commercial hybrids developed
by private seed companies, the survey respondents
were asked the following three questions about each
cultivar that had been developed by their breeding
program:
1. Does the cultivar contain CIMMYT germplasm?
2. If it does contain CIMMYT germplasm, which
CIMMYT population(s), pool(s), and/or inbred
line(s) were used in developing the cultivar?
3. How were the CIMMYT population(s), pool(s),
and/or inbred line(s) used? 5
In the analysis that follows, data for southern
Africa are often reported in two ways: (a) including
South Africa, and (b) excluding South Africa. South
Africa is sometimes excluded from the analysis
because commercial maize hybrids cultivated in
South Africa contain mainly temperate germplasm,
most of which comes from the US and Europe.
CIMMYT maize breeders do not work with
temperate germplasm, so most of South Africa’s
maize-growing area falls outside the area targeted
Table 17. Maturity classes of maize varieties (availablein 1998) released by private seed companies, easternand southern Africa (number of varieties)
Extra ExtraCountry/region early Early Intermediate Late late
Ethiopia 0 0 1 0 0Kenya 2 0 3 0 0Uganda 0 0 0 0 0
Eastern Africa 3 0 4 0 0
Angola 0 0 0 0 0Lesotho 0 0 0 0 0Malawi 0 1 1 1 0Mozambique 0 2 1 3 0South Africa 2 8 19 18 15Swaziland 0 0 0 0 0Tanzania 0 0 1 0 0Zambia 0 0 0 2 0Zimbabwe 0 4 7 12 11
Southern Africa 2 15 29 36 26Southern Africa,
excludingSouth Africa 0 7 10 18 11
Eastern andsouthern Africa 5 15 33 36 26
Eastern andsouthern Africa,
excludingSouth Africa 3 7 14 18 11
Source: CIMMYT Maize Research Impacts Survey, 1998/99.5 For information about the survey instrument, see
Morris and López-Pereira (1998).
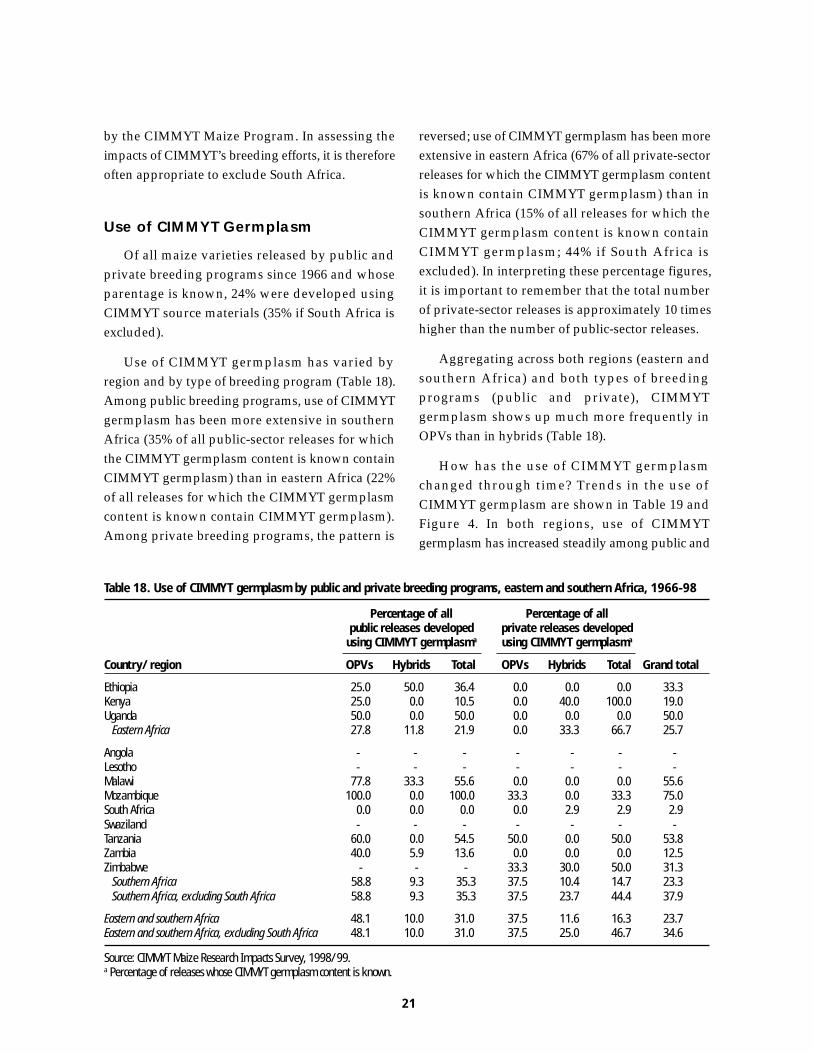
21
by the CIMMYT Maize Program. In assessing the
impacts of CIMMYT’s breeding efforts, it is therefore
often appropriate to exclude South Africa.
Use of CIMMYT Germplasm
Of all maize varieties released by public and
private breeding programs since 1966 and whose
parentage is known, 24% were developed using
CIMMYT source materials (35% if South Africa is
excluded).
Use of CIMMYT germplasm has varied by
region and by type of breeding program (Table 18).
Among public breeding programs, use of CIMMYT
germplasm has been more extensive in southern
Africa (35% of all public-sector releases for which
the CIMMYT germplasm content is known contain
CIMMYT germplasm) than in eastern Africa (22%
of all releases for which the CIMMYT germplasm
content is known contain CIMMYT germplasm).
Among private breeding programs, the pattern is
reversed; use of CIMMYT germplasm has been more
extensive in eastern Africa (67% of all private-sector
releases for which the CIMMYT germplasm content
is known contain CIMMYT germplasm) than in
southern Africa (15% of all releases for which the
CIMMYT germplasm content is known contain
CIMMYT germplasm; 44% if South Africa is
excluded). In interpreting these percentage figures,
it is important to remember that the total number
of private-sector releases is approximately 10 times
higher than the number of public-sector releases.
Aggregating across both regions (eastern and
southern Africa) and both types of breeding
programs (public and private), CIMMYT
germplasm shows up much more frequently in
OPVs than in hybrids (Table 18).
How has the use of CIMMYT germplasm
changed through time? Trends in the use of
CIMMYT germplasm are shown in Table 19 and
Figure 4. In both regions, use of CIMMYT
germplasm has increased steadily among public and
Table 18. Use of CIMMYT germplasm by public and private breeding programs, eastern and southern Africa, 1966-98
Percentage of all Percentage of allpublic releases developed private releases developedusing CIMMYT germplasma using CIMMYT germplasma
Country/region OPVs Hybrids Total OPVs Hybrids Total Grand total
Ethiopia 25.0 50.0 36.4 0.0 0.0 0.0 33.3Kenya 25.0 0.0 10.5 0.0 40.0 100.0 19.0Uganda 50.0 0.0 50.0 0.0 0.0 0.0 50.0
Eastern Africa 27.8 11.8 21.9 0.0 33.3 66.7 25.7
Angola - - - - - - -Lesotho - - - - - - -Malawi 77.8 33.3 55.6 0.0 0.0 0.0 55.6Mozambique 100.0 0.0 100.0 33.3 0.0 33.3 75.0South Africa 0.0 0.0 0.0 0.0 2.9 2.9 2.9Swaziland - - - - - - -Tanzania 60.0 0.0 54.5 50.0 0.0 50.0 53.8Zambia 40.0 5.9 13.6 0.0 0.0 0.0 12.5Zimbabwe - - - 33.3 30.0 50.0 31.3
Southern Africa 58.8 9.3 35.3 37.5 10.4 14.7 23.3Southern Africa, excluding South Africa 58.8 9.3 35.3 37.5 23.7 44.4 37.9
Eastern and southern Africa 48.1 10.0 31.0 37.5 11.6 16.3 23.7Eastern and southern Africa, excluding South Africa 48.1 10.0 31.0 37.5 25.0 46.7 34.6
Source: CIMMYT Maize Research Impacts Survey, 1998/99.a Percentage of releases whose CIMMYT germplasm content is known.

22
private breeding programs. During the 1990s, 50%
of all public-sector releases in eastern Africa
contained CIMMYT germplasm, as did 53% of all
public-sector releases in southern Africa (excluding
South Africa). During the same period, 100% of all
private-sector releases in eastern Africa contained
CIMMYT germplasm, as did 55% of all private-
sector releases in southern Africa (excluding South
Africa). Aggregating the data for both regions and
for both types of breeding program, 31% of all
varieties released during the 1990s contained
CIMMYT germplasm (55% if South Africa is
excluded), indicating strong and increasing demand
for CIMMYT germplasm. The observed growth in
the use of CIMMYT germplasm during recent years
strongly validates the decision of the CIMMYT
Maize Program to establish a breeding station within
the region to concentrate on local adaptive breeding.
Table 19. Trends in use of CIMMYT germplasm by public and private breeding programs, eastern and southern Africa,1966-98
Percentage of all Percentage of all Percentage of allpublic releases developed private releases developed releases developed
using CIMMYT germplasma using CIMMYT germplasma using CIMMYT germplasma
Country/region 1966-96 1980-96 1985-96 1990-96 1966-96 1980-96 1985-96 1990-96 1966-96 1980-96 1985-96 1990-96
Ethiopia 36.4 50.0 50.0 50.0 - - - - 33.3 50.0 50.0 50.0Kenya 10.5 20.0 22.2 33.3 100.0 100.0 100.0 100.0 19.0 33.3 36.4 60.0Uganda 50.0 100.0 100.0 100.0 0.0 - - - 50.0 100 100 100
Eastern Africa 21.9 36.8 38.9 50.0 66.7 100.0 100.0 100.0 25.7 42.9 45.0 60.0
Angola - - - - - - - - - - - -Lesotho - - - - - - - - - - - -Malawi 55.6 62.5 71.4 69.2 0.0 0.0 0.0 0.0 55.6 62.5 71.4 69.2Mozambique 100.0 100.0 100.0 100.0 33.3 33.3 33.3 50.0 75.0 75.0 71.4 80.0South Africa - - - - 2.9 2.9 2.9 3.7 2.9 2.9 2.9 3.7Swaziland - - - - - - - - - - - -Tanzania 54.5 71.4 50.0 66.7 50.0 50.0 50.0 0.0 53.8 66.7 50.0 66.7Zambia 13.6 15.8 20.0 22.2 0.0 0.0 0.0 0.0 12.5 14.3 16.7 18.2Zimbabwe - 0.0 0.0 0.0 50.0 52.6 55.6 62.5 31.3 40.0 47.6 55.6Southern Africa 35.3 43.4 51.4 53.3 14.7 14.9 15.1 17.6 23.3 25.2 25.0 27.9Southern Africa,
excludingSouth Africa 35.3 43.4 51.4 53.3 44.4 46.2 48.0 55.0 37.9 44.3 50.0 54.0
Eastern andsouthern Africa 31.0 41.7 47.2 52.6 16.3 16.7 16.8 19.7 23.7 27.4 27.7 30.7
Eastern andsouthern Africa,
excludingSouth Africa 31.0 41.7 47.2 52.6 46.7 50.0 51.9 59.1 34.6 44.0 48.8 55.0
Source: CIMMYT Maize Research Impacts Survey, 1998/99.a Percentage of releases whose CIMMYT germplasm content is known.
Releases containing CIMMYT germplasm (%)100%
80%
60%
40%
20%
0%All releases Public Private Eastern Southern
Africa Africa
Figure 4. Use of CIMMYT maize germplasm, eastern andsouthern Africa, 1966-96Source: CIMMYT Maize Research Impacts Survey, 1998/99.
1966-96 1985-961980-96 1990-96
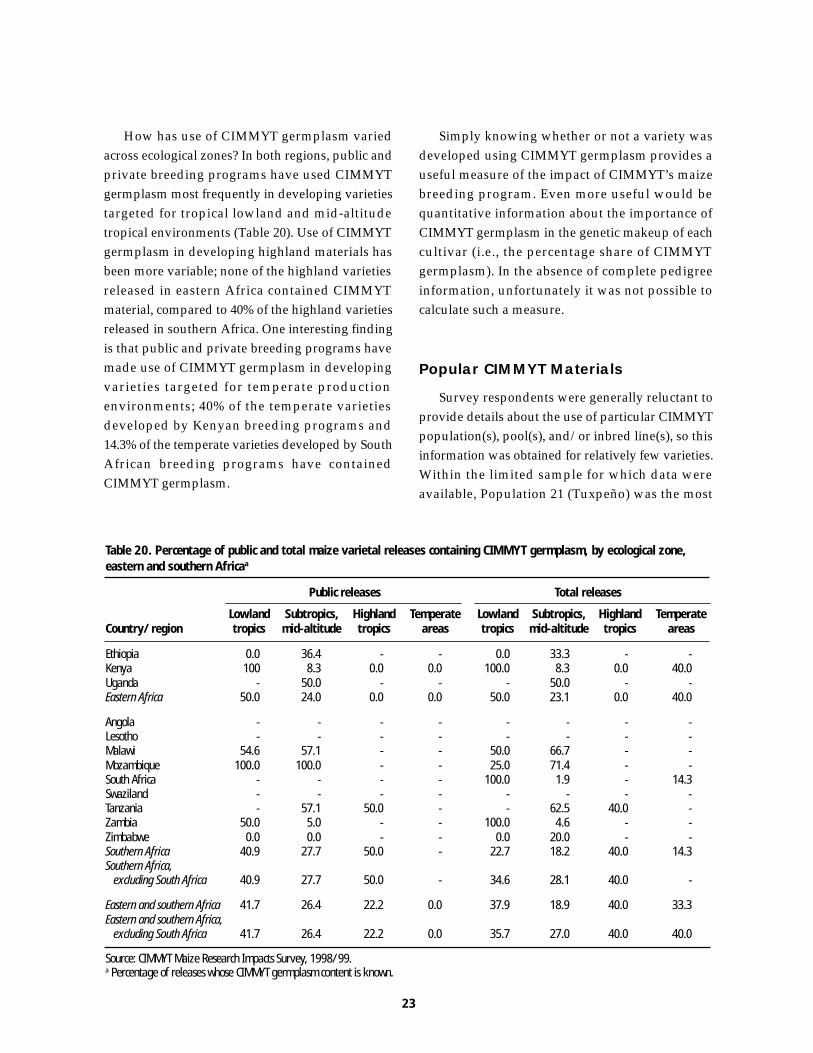
23
Table 20. Percentage of public and total maize varietal releases containing CIMMYT germplasm, by ecological zone,eastern and southern Africaa
Public releases Total releases
Lowland Subtropics, Highland Temperate Lowland Subtropics, Highland TemperateCountry/region tropics mid-altitude tropics areas tropics mid-altitude tropics areas
Ethiopia 0.0 36.4 - - 0.0 33.3 - -Kenya 100 8.3 0.0 0.0 100.0 8.3 0.0 40.0Uganda - 50.0 - - - 50.0 - -Eastern Africa 50.0 24.0 0.0 0.0 50.0 23.1 0.0 40.0
Angola - - - - - - - -Lesotho - - - - - - - -Malawi 54.6 57.1 - - 50.0 66.7 - -Mozambique 100.0 100.0 - - 25.0 71.4 - -South Africa - - - - 100.0 1.9 - 14.3Swaziland - - - - - - - -Tanzania - 57.1 50.0 - - 62.5 40.0 -Zambia 50.0 5.0 - - 100.0 4.6 - -Zimbabwe 0.0 0.0 - - 0.0 20.0 - -Southern Africa 40.9 27.7 50.0 - 22.7 18.2 40.0 14.3Southern Africa,
excluding South Africa 40.9 27.7 50.0 - 34.6 28.1 40.0 -
Eastern and southern Africa 41.7 26.4 22.2 0.0 37.9 18.9 40.0 33.3Eastern and southern Africa,
excluding South Africa 41.7 26.4 22.2 0.0 35.7 27.0 40.0 40.0
Source: CIMMYT Maize Research Impacts Survey, 1998/99.a Percentage of releases whose CIMMYT germplasm content is known.
How has use of CIMMYT germplasm varied
across ecological zones? In both regions, public and
private breeding programs have used CIMMYT
germplasm most frequently in developing varieties
targeted for tropical lowland and mid-altitude
tropical environments (Table 20). Use of CIMMYT
germplasm in developing highland materials has
been more variable; none of the highland varieties
released in eastern Africa contained CIMMYT
material, compared to 40% of the highland varieties
released in southern Africa. One interesting finding
is that public and private breeding programs have
made use of CIMMYT germplasm in developing
varieties targeted for temperate production
environments; 40% of the temperate varieties
developed by Kenyan breeding programs and
14.3% of the temperate varieties developed by South
African breeding programs have contained
CIMMYT germplasm.
Simply knowing whether or not a variety was
developed using CIMMYT germplasm provides a
useful measure of the impact of CIMMYT’s maize
breeding program. Even more useful would be
quantitative information about the importance of
CIMMYT germplasm in the genetic makeup of each
cultivar (i.e., the percentage share of CIMMYT
germplasm). In the absence of complete pedigree
information, unfortunately it was not possible to
calculate such a measure.
Popular CIMMYT Materials
Survey respondents were generally reluctant to
provide details about the use of particular CIMMYT
population(s), pool(s), and/or inbred line(s), so this
information was obtained for relatively few varieties.
Within the limited sample for which data were
available, Population 21 (Tuxpeño) was the most

24
popular CIMMYT source material, followed by
Population 22 (Mezcla Tropical Blanco) and
Population 32 (ETO Blanco). All three of these
populations are adapted to lowland topical
environments.
Manner of Use of CIMMYT Germplasm
Public and private breeding programs in eastern
and southern Africa have tended to use CIMMYT
germplasm in different ways (Table 21). Public
breeding programs have made extensive use of
CIMMYT populations, pools and experimental
varieties; most of the time, the CIMMYT source
materials have been used directly, with little or no
additional selection. In contrast, private seed
companies have used mainly CIMMYT inbred lines;
in most cases, the CIMMYT lines were subjected to
further selection before being used.
Aggregating across public and private breeding
programs, among all varieties that were developed
using CIMMYT germplasm, in 43% of cases
CIMMYT source materials were incorporated with
little or no additional improvement at the hands of
local breeders. Conversely, in 57% of cases CIMMYT
source materials were further improved before being
used. This suggests that although many national
breeding programs have developed the capacity to
do their own improvement work, a considerable
number of breeding programs—especially public
breeding programs—continue to make direct use of
CIMMYT germplasm.
Farm Level Impacts ofMaize Breeding Research
Previous sections of this report have presented
information about the numbers and types of maize
varieties that have been produced by public and
private breeding programs in eastern and southern
Africa, as well as information about the CIMMYT
germplasm content of these varieties. Information
about varietal releases provides an important
measure of the productivity of breeding programs,
but it does not provide a complete measure of the
impacts of breeding programs on maize production.
Improved varieties are able to increase maize
production and to improve farmers’ incomes and
welfare only when they are planted in farmers’
fields. In assessing the impacts of public and private
maize breeding efforts, it is therefore important to
estimate the extent to which modern varieties have
been adopted by farmers and to estimate the
resulting productivity gains.
The most reliable way to measure the adoption
of modern varieties is through farm-level surveys.
Unfortunately, relatively few of the countries
covered by this report have carried out
comprehensive national surveys in recent years to
document farmers’ use of improved maize varieties.
Only in Kenya (Hassan et al. 1998), Tanzania (Moshi
et al. 1997), and Malawi (Smale and Heisey 1997)
have national surveys been carried out.
In the absence of survey data, it is necessary to
rely on alternative sources of information to estimate
varietal adoption rates. For this report, two methods
were used to estimate farmers’ use of improved
Table 21. Manner of use of CIMMYT source materials bypublic and private breeding programs, eastern andsouthern Africa, 1966-98 (% of varietal releases)a
Public Private AllLevel of improvement releases releases releases
No additionalimprovement of material 25.8 0.0 17.0
No improvement ofhybrids/inbred lines 0.0 0.0 0.0
Some improvement of material 32.3 12.5 25.5Some improvement of
hybrids/inbred lines 0.0 0.0 0.0Substantial improvement of material 41.9 25.0 36.2Substantial improvement of
hybrids/inbred lines 0.0 62.5 21.3
Source: CIMMYT Maize Research Impacts Survey, 1998/99.a Percentage of varietal releases whose manner of use CIMMYT source
materials is known.

25
maize germplasm. Through the questionnaire,
individuals with knowledge of the maize sector (e.g.,
scientists working in public research organizations,
representatives of private seed companies) were
asked to estimate (a) the total area planted to maize
in 1996, and (b) the proportions within that total area
planted to local varieties, improved OPVs, and
hybrids. In addition, data were collected on
commercial seed sales by public seed agencies and
private companies in 1996. Based on the seed sales
data, and using knowledge of average planting rates
in each country, it was possible to estimate the area
theoretically planted to commercial seed. These area
estimates were then compared with direct area
estimates to provide a consistency check.
Direct NARS Estimates of Area UnderImproved Maize
Table 22 shows the estimates made by the survey
respondents of the total area planted to maize in each
country in 1996, along with the 1996 maize area
reported by the Food and Agriculture Organization
of the United Nations (FAO). With the exception of
Angola6 and Lesotho, where the FAO figures were
about 22% lower than the survey respondents’
estimates, in all countries the estimates made by the
survey respondents closely matched the FAO data
(difference of less than 10%). Aggregating to the
regional level, the divergence between two estimates
was negligible (1.2% difference in eastern Africa and
2.4% difference in southern Africa).
Table 23 shows the estimates of the percentage
area in each country planted to improved OPVs and
hybrids. According to the national program
respondents, in 1996, more than one-half of the
maize area in eastern and southern Africa was
planted to modern varieties. Adoption rates varied,
between individual countries, however. Adoption
of modern varieties was highest in South Africa
(98%), Zimbabwe (95%), Swaziland (75%), Lesotho
(75%), and Kenya (72%). Adoption was lowest in
Ethiopia (6%), Mozambique (8%), Tanzania (10%),
and Malawi (11%). The pronounced inter-country
variability in adoption rates presumably reflects
differences between countries in terms of
institutional and policy factors, including seed
delivery infrastructure, economic incentives to adopt
modern varieties, and the strength of the local
extension service. These factors may be more
important than agroclimatic suitability for the
successful diffusion of modern varieties.
6 When shown the difference between their estimate and the FAO figure, the Angolan respondents confirmed theirestimate and challenged the accuracy of the FAO figure.
Table 22. Area planted to maize in eastern and southernAfrica, 1996 (comparison of survey respondents’ directestimates with FAO data)
Estimateof scientists Differencein national between
FAO research twoCountry-region estimate programs estimates
(000/ha) (000/ha) (%)
Ethiopia 1,881 1,776 -5.6Kenya 1,300 1,383 6.4Uganda 584 560 -4.1
Eastern Africa 3,765 3,719 -1.2
Angola 570 700 22.8Lesotho 151 184 21.8Malawi 1,243 1,300 4.6Mozambique 1,008 1,113 10.4South Africa 3,761 3,761 0.0Swaziland 61 65 0.7Tanzania 1,646 1,800 9.4Zambia 676 649 -4.0Zimbabwe 1,535 1,330 -13.4
Southern Africa 10,651 10,902 2.4Southern Africa,
excluding South Africa 6,890 7,141 3.6
Eastern andsouthern Africa 14,416 14,621 1.4
Eastern andsouthern Africa,
excluding South Africa 10,655 10,860 1.9
Source: CIMMYT Maize Research Impacts Survey, 1998/99.

26
The varietal adoption estimates reveal interesting
patterns in the types of modern varieties being
grown in eastern and southern Africa. Generally
speaking, use of hybrids was much more extensive
than use of improved OPVs. According to the
national program respondents, in 1996, hybrids
occupied approximately 46% of the maize area
planted, compared to only 7% occupied by OPVs.
The greater use of hybrids reflects the increasing
dominance of the private seed industry.
Estimates of Area Under ImprovedMaize Based on Seed Sales
Seed sales data for 1996 collected from public and
private companies were used to derive an alternative
set of estimates of the area planted to commercial
maize seed in eastern and southern Africa. This was
done by dividing total commercial seed sales in each
country by the average planting rate for that country.
In eastern and southern Africa, recommended
planting rates for maize generally range from 20-25
kg/ha, although they are lower in some countries,
including South Africa (10kg/ha), Lesotho (10 kg/
ha), Uganda (16 kg/ha), and Swaziland (16 kg/ha).
Many of the survey respondents indicated that
farmers often plant at rates lower than the
recommended rate, however, so the recommended
planting rates were adjusted downward. Accordingly,
an average planting rate of 17.5 kg/ha was used for
all countries except South Africa and Lesotho, where
an average rate of 12.5 kg/ha was used. These
planting rates implicitly accommodate a certain
amount of wastage, since the seed sales data were
not adjusted to allow for the fact that in most years a
certain amount of seed remains unplanted, some
farmers replant the same field several times in order
to establish a satisfactory stand, some of the area
planted to commercial seed is never harvested, etc.
Table 23. Percentage of total national maize area planted to improved OPVs and hybrids, eastern and southern Africa,1996 (comparison of survey respondents’ direct estimates and calculations based on commercial seed sales)
OPVs Hybrids All MVsPercentage
National National National deviation fromprogram Seed program Seed program Seed national program
Country/region estimates sales estimates sales estimates sales estimates
Ethiopia 1.89 2.99 3.94 5.47 5.83 8.46 45.1Kenya 7.49 9.42 64.96 61.69 72.45 71.11 -1.8Uganda 50.00 4.42 4.68 4.46 54.68 8.88 -83.8
Eastern Africa 11.62 5.60 28.09 26.24 39.71 31.83 -19.8
Angola 25.00 11.30 0.05 - 25.50 11.80 -53.7Lesotho 10.87 13.05 63.94 57.72 74.81 70.76 -5.4Malawi 4.38 1.05 7.00 12.75 11.38 13.80 21.3Mozambique 7.96 9.10 0.05 0.04 8.01 9.14 14.1South Africa 3.06 3.66 94.5 92.23 97.56 95.90 -1.7Swaziland 2.23 0.00 73.22 78.37 75.45 78.37 3.9Tanzania 4.00 1.92 6.00 2.33 10.00 4.25 -57.5Zambia 0.62 0.72 18.63 22.17 19.25 22.89 18.9Zimbabwe 4.51 0.00 90.98 81.63 95.49 81.63 -14.5
Southern Africa 5.24 3.77 51.73 43.51 56.97 47.28 -17.0Southern Africa,
excluding South Africa 6.49 3.82 27.37 21.76 33.86 25.57 -24.5
Eastern and southern Africa 6.88 4.24 45.67 39.02 52.55 43.27 -17.7Eastern and southern Africa,
excluding South Africa 8.29 4.41 27.62 23.26 35.91 27.68 -22.9
Source: CIMMYT Maize Research Impacts Survey, 1998/99.
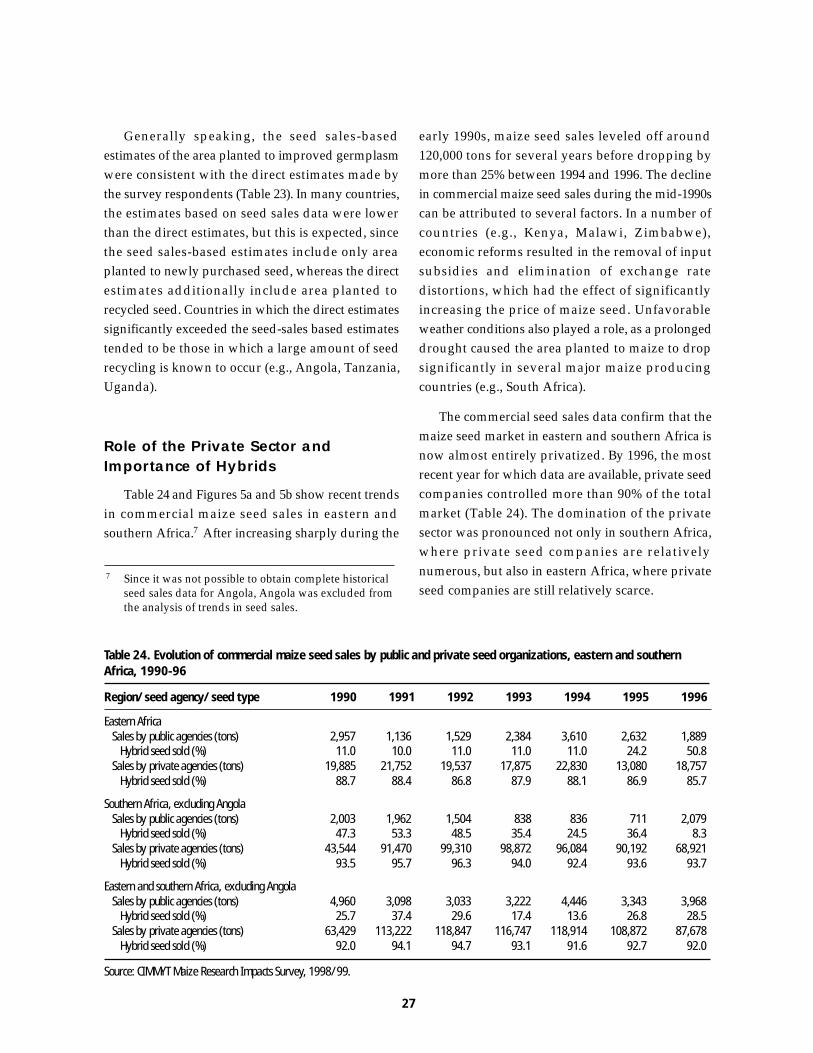
27
Generally speaking, the seed sales-based
estimates of the area planted to improved germplasm
were consistent with the direct estimates made by
the survey respondents (Table 23). In many countries,
the estimates based on seed sales data were lower
than the direct estimates, but this is expected, since
the seed sales-based estimates include only area
planted to newly purchased seed, whereas the direct
estimates additionally include area planted to
recycled seed. Countries in which the direct estimates
significantly exceeded the seed-sales based estimates
tended to be those in which a large amount of seed
recycling is known to occur (e.g., Angola, Tanzania,
Uganda).
Role of the Private Sector andImportance of Hybrids
Table 24 and Figures 5a and 5b show recent trends
in commercial maize seed sales in eastern and
southern Africa.7 After increasing sharply during the
early 1990s, maize seed sales leveled off around
120,000 tons for several years before dropping by
more than 25% between 1994 and 1996. The decline
in commercial maize seed sales during the mid-1990s
can be attributed to several factors. In a number of
countries (e.g., Kenya, Malawi, Zimbabwe),
economic reforms resulted in the removal of input
subsidies and elimination of exchange rate
distortions, which had the effect of significantly
increasing the price of maize seed. Unfavorable
weather conditions also played a role, as a prolonged
drought caused the area planted to maize to drop
significantly in several major maize producing
countries (e.g., South Africa).
The commercial seed sales data confirm that the
maize seed market in eastern and southern Africa is
now almost entirely privatized. By 1996, the most
recent year for which data are available, private seed
companies controlled more than 90% of the total
market (Table 24). The domination of the private
sector was pronounced not only in southern Africa,
where private seed companies are relatively
numerous, but also in eastern Africa, where private
seed companies are still relatively scarce.7 Since it was not possible to obtain complete historical
seed sales data for Angola, Angola was excluded fromthe analysis of trends in seed sales.
Table 24. Evolution of commercial maize seed sales by public and private seed organizations, eastern and southernAfrica, 1990-96
Region/seed agency/seed type 1990 1991 1992 1993 1994 1995 1996
Eastern AfricaSales by public agencies (tons) 2,957 1,136 1,529 2,384 3,610 2,632 1,889
Hybrid seed sold (%) 11.0 10.0 11.0 11.0 11.0 24.2 50.8Sales by private agencies (tons) 19,885 21,752 19,537 17,875 22,830 13,080 18,757
Hybrid seed sold (%) 88.7 88.4 86.8 87.9 88.1 86.9 85.7
Southern Africa, excluding AngolaSales by public agencies (tons) 2,003 1,962 1,504 838 836 711 2,079
Hybrid seed sold (%) 47.3 53.3 48.5 35.4 24.5 36.4 8.3Sales by private agencies (tons) 43,544 91,470 99,310 98,872 96,084 90,192 68,921
Hybrid seed sold (%) 93.5 95.7 96.3 94.0 92.4 93.6 93.7
Eastern and southern Africa, excluding AngolaSales by public agencies (tons) 4,960 3,098 3,033 3,222 4,446 3,343 3,968
Hybrid seed sold (%) 25.7 37.4 29.6 17.4 13.6 26.8 28.5Sales by private agencies (tons) 63,429 113,222 118,847 116,747 118,914 108,872 87,678
Hybrid seed sold (%) 92.0 94.1 94.7 93.1 91.6 92.7 92.0
Source: CIMMYT Maize Research Impacts Survey, 1998/99.

28
In terms of market size, southern Africa is a much
more important market for private seed companies
than eastern Africa; the volume of private-sector
seed sales in southern Africa is more than three times
larger than the volume of seed sales in eastern Africa
(Table 24). For public seed companies, the reverse is
true; public seed companies continue to sell more
maize seed in eastern Africa than they do in southern
Africa (Table 24).
Aggregating across the two regions, sales of
hybrid seed have grown as a proportion of total seed
sales. By 1996, hybrid seed accounted for more than
92% of total seed sales (Table 24 and Figure 6). The
only significant exception to the trend toward
greater emphasis on hybrids has occurred in
southern Africa, where public-sector seed sales have
become increasingly dominated by OPVs. This
finding can be attributed to the fact that with Angola
excluded from the analysis, the only public seed
company still operating in southern Africa is in
Tanzania, where public seed agencies have made a
conscious decision to concentrate on OPVs. Given
the current environment, most smallholders in
Tanzania cannot afford to purchase hybrid seed and
other inputs such as chemical fertilizer.
The rise of the private maize seed industry and
the related increase in the production of hybrid seed
raises difficult questions for policy makers. In
particular, it is justifiable to ask whether current
trends will lead eventually to further
marginalization of small-scale, subsistence-oriented
farmers, many of whom are likely to find it difficult
Commercial seed sales (000 t)180
160
140
120
100
80
60
40
20
01990 1991 1992 1993 1994 1995 1996
Figure 5a. Commercial maize seed sales, by sector,eastern and southern Africa, 1990-96Source: CIMMYT Maize Research Impacts Survey, 1998/99.
Sales by public seed organizationsSales by private seed companies
Commercial seed sales (000 t)180
160
140
120
100
80
60
40
20
01990 1991 1992 1993 1994 1995 1996
Figure 5b. Commercial maize seed sales, by region,eastern and southern Africa, 1990-96Source: CIMMYT Maize Research Impacts Survey, 1998/99.
Eastern AfricaSouthern Africa
Commercial seed sales (000 t)100%
80%
60%
40%
20%
0%1990 1991 1992 1993 1994 1995 1996
Figure 6. Compostion of commercial maize seed sales,eastern and southern Africa, 1990-96Source: CIMMYT Maize Research Impacts Survey, 1998/99.
Public OPVs Private OPVs
Public hybrids Private hybrids

29
to buy fresh hybrid seed every year. To date, no
definitive answer has emerged to this important
question. Despite the widespread belief that hybrid
technology is inappropriate for smallholders,
evidence from a number of countries in the region
suggests that hybrids can be adopted successfully
by small-scale producers. In Kenya (Hassan et al.
1998b), Zimbabwe (Eicher and Kupfuma 1997,
Eicher 1995), Lesotho, Swaziland and South Africa,
smallholders have achieved rates of adoption of
hybrid maize that are comparable to those achieved
by large commercial farmers.
Estimates of Area Under CIMMYTGermplasm
How extensive is the area planted in eastern and
southern Africa to maize varieties that were
developed using CIMMYT germplasm? In the
absence of detailed information about the area
planted to individual varieties, the area planted to
varieties containing CIMMYT germplasm had to be
calculated indirectly based on (1) estimates of the
area planted to all modern varieties, (2) quantitative
data on the use of CIMMYT germplasm in all
varietal releases, and (3) qualitative information
provided by public- and private-sector breeders. For
most countries, it was assumed that of the total area
planted to modern varieties, the proportion planted
to varieties containing CIMMYT germplasm was
identical to the proportion of all varietal releases that
have contained CIMMYT germplasm. Implicit in
this approach is the assumption that on average,
varieties developed using CIMMYT germplasm
have been adopted at the same rate as varieties
developed without the use of CIMMYT germplasm.
For five countries in which only limited information
was available about the CIMMYT germplasm
content of varietal releases (Angola, Lesotho, South
Africa, Swaziland, Uganda), the proportion of
modern varieties containing CIMMYT germplasm
was subjectively estimated based on information
provided by breeders in the public and private
sectors about the use of CIMMYT source materials
in their breeding programs.
Based on these estimates, it is estimated that in
1996 over 1.6 million hectares in eastern and
southern Africa were planted to varieties containing
CIMMYT germplasm (Table 25). Of this amount,
0.32 million ha were located in eastern Africa
(representing 8% of the total maize area in that
region, and 21% of the area planted to modern
varieties) and 1.31 million ha were located in
southern Africa (representing 12% of the total maize
area in that region, and 21% of the area planted to
modern varieties). Excluding South Africa, where
maize is grown mainly in temperate production
environments that are not directly targeted by
CIMMYT’s breeding program, 16% of the total
maize area in southern Africa was planted to
CIMMYT derived varieties, representing 47% of the
area planted to modern varieties.
Table 25. Area planted to maize varieties developed usingCIMMYT germplasm, eastern and southern Africa, 1996
Area planted to materials
containing CIMMYT Percentagegermplasm of total area
Country/region (000/ha) under MVs
Ethiopia 36.4 36.4Kenya 121.1 11.1Uganda 163.5 50.0
Eastern Africa 321.1 21.2
Angola 52.7 33.3Lesotho 5.4 5.0Malawi 78.0 55.6Mozambique 69.3 75.0South Africa 196.3 5.0Swaziland 2.3 5.0Tanzania 52.1 33.3Zambia 17.0 13.6Zimbabwe 835.3 53.3
Southern Africa 1,308.4 20.7Southern Africa,
excluding South Africa 1,112.1 46.5
Eastern and southern Africa 1,629.4 20.8Eastern and southern Africa,
excluding South Africa 1,433.2 36.7
Source: CIMMYT Maize Research Impacts Survey, 1998/99.

30
Summary and Conclusions
In 1997, CIMMYT launched a major study
designed to document the impacts of international
maize breeding research in developing countries.
The study was intended to update and extend the
findings of CIMMYT’s first global research impacts
study, which had been published three years earlier
in a report entitled Impacts of International Maize
Breeding Research in the Developing World, 1966-90
(López-Pereira and Morris 1994). Due to the
enormity of the data collection task, the follow-up
study was divided into three regional impacts
studies. This report has presented the results of the
regional impacts study carried out for eastern and
southern Africa.
The results presented in this report are based on
information collected during 1998 and 1999 through
a comprehensive survey of public and private maize
breeding organizations and seed production
agencies in 12 countries of eastern and southern
Africa. The survey generated information on many
aspects of maize research, seed production, and seed
distribution (e.g., maize breeding activities, products
of breeding programs, maize seed production and
sales operations, seed industry regulations and
policies). The countries covered by the survey
accounted for more than 95% of all maize produced
in the region. The organizations contacted as part
of the survey currently control about 97% of the total
maize seed market in the 12 countries.
Major findings of the study are summarized below.
Policy reforms have led to increasedprivate-sector participation in manynational maize seed industries
During the past decade, national maize seed
industries in eastern and southern Africa have
undergone major structural changes. In most
countries, policy reforms introduced in an effort to
scale back the role of the state have paved the way
for increased private sector participation in seed
research, seed production, and seed distribution
activities. These policy reforms have induced
marked changes in the organization and
performance of national maize seed industries.
The most obvious change has been the
emergence of a flourishing private maize seed sector.
Private maize seed companies currently operate in
every country in the region. This represents a major
difference compared to earlier years, when maize
research and maize seed production were largely
restricted to monopolistic government agencies and
parastatals. Major reforms that were instrumental
in bringing about this change included the lifting of
prohibitions on private seed companies, removal of
restrictions on importation of commercial maize
seed, and elimination of direct seed price controls.
Despite the recent liberalization measures,
however, in many countries the participation of
private seed companies continues to be constrained
by implicit restrictions in the form of cumbersome
seed certification requirements and lengthy varietal
registration procedures. Moreover, a number of
governments are still trying to influence maize seed
prices indirectly, for example by subsidizing maize
seed production. This practice is especially prevalent
in countries in which public agencies continue to
operate and control large shares in the seed market.
Interestingly, the rise of the private seed industry
appears to have happened in the absence of well-
defined intellectual property regimes. In most
countries of eastern and southern Africa, little
progress has been achieved in establishing
intellectual property rights and implementing plant
varietal protection legislation. Private seed
companies apparently are relying mainly on trade
secrets approaches to keep their most valuable
germplasm out of the hands of potential
competitors, thereby protecting the investments
they have made in maize breeding research.

31
Rapid growth in private-sectorinvestment in maize breedingresearch has been accompanied bychanges in varietal release patterns
The recent policy reforms have had a pronounced
effect on research investment patterns. Although
data on research investment are difficult to come by,
private investment in maize breeding research
clearly has increased as a share of total research
investment in many countries. In eastern Africa,
public-sector maize breeders still outnumber private-
sector breeders, but in southern Africa the number
of breeders is now roughly the same. Numbers of
scientists provide an imperfect measure of total
research investment, however, since they reveal very
little about the cost of supporting each researcher.
In eastern and southern Africa, as elsewhere in the
developing and developed world, the cost of
supporting a senior scientist (salary and benefits plus
operating funds) tends to be considerably higher in
the private sector. Adjusting for the difference in
support costs, total research investment by the
private sector probably exceeds total research
investment by the public sector, certainly in southern
Africa and probably for both regions.
The productivity of investments in breeding
research can be judged by examining the rate at
which breeding programs release new varieties. In
both eastern and southern Africa, maize breeders
employed by private seed companies have on
average released more varieties than maize breeders
working in public research organizations. This
difference in varietal release rates can be attributed
to differences in the quantity and quality of
investment, as well as to the commercial orientation
of private seed companies compared to public
breeding programs, which focus more on non-
commercial breeding objectives.
The composition of varietal releases reflects
steady growth in the role of the private sector. By
the late 1990s, all maize varieties released in eastern
and southern Africa were originating from private
companies. The recent decline in public-sector
varietal releases no doubt also reflects reductions in
public funding for agricultural research that have
occurred in many countries in the region.
Increased private-sector participationin the maize seed industry has beenaccompanied by greaterconcentration of the industry
Seed industry liberalization has led to a
significant decline in the role of public seed agencies
throughout eastern and southern Africa. Seed sales
data make clear that the private sector has effectively
taken over the maize seed market in many countries.
In 1996, the most recent year for which seed sales
data are available, more than 90% of total
commercial seed sales were made by private
companies. It is important to note, however, that in
a number of major maize producing countries (e.g.,
Kenya, Zambia, Zimbabwe), the leading private
seed company is simply a transformed version of a
previously public or parastatal seed agency that had
long monopolized the local seed market. In several
instances, these privatized parastatals continue to
control more than 80% of the national seed market.
At the time of their creation, these companies
already had an edge over potential competitors
because they inherited well established networks of
seed production facilities, conditioning plants, and
distribution depots.
With privatization, the maize seed industry is
becoming more concentrated as a relatively small
number of large multinationals acquire, merge with,
or buy large shares in local seed companies. While
consolidation could lead to scale economies,
reduced competition is a concern to farmers, who
worry that they may eventually face restricted
choices and have to pay higher prices. The fact that
seed prices in many countries have not risen
significantly may reflect continued attempts by
governments to keep maize seed prices low through
the supply of subsidized public maize seed.

32
Hybrids now dominate varietalreleases and seed sales
Since private seed companies have strong
commercial incentives to concentrate on hybrids, it is
not surprising that the emergence of a flourishing
private seed industry has been accompanied by a
rising share of hybrids in new varietal releases and
seed sales. Because many public breeding programs
are now also concentrating on hybrids (because of
their superior performance), this has led to a situation
in which varietal releases and seed sales are now
completely dominated by hybrids.
Some observers have raised questions about the
increasing popularity of hybrids, pointing out that
hybrid technologies may not be suitable for small-
scale, subsistence-oriented farmers, many of whom
lack the resources needed to buy fresh seed every
season. Little empirical evidence has emerged to
indicate that small-scale farmers have been adversely
affected by the shift to hybrids, but the matter will
require careful attention, because supplying seed to
smallholders may not be of interest to profit-motivated
private firms.
Adoption of improved maize varietiesincreased during the 1990s
Commercial maize seed sales data support
estimates made by researchers and seed industry
insiders that adoption of improved varieties increased
during the 1990s in most countries of eastern and
southern Africa. However, significant differences in
adoption patterns are evident between countries and
regions. Total sales of improved maize seed have
fluctuated around a modest 20,000 tons per year in
eastern Africa, whereas in southern Africa total maize
seed sales grew during the early 1990s to peak at just
over 100,000 tons in 1992 before declining. Within
individual countries, the area planted to modern
varieties varies from less than 10% to nearly 100%.
The large differences between countries in adoption
rates can be attributed partly to differences in
economic, institutional, and policy factors that
affect the availability and affordability of improved
seed.
Use by researchers of CIMMYTgermplasm continues to increase, asdoes adoption by farmers ofCIMMYT-derived varieties
CIMMYT’s maize breeding program has had
significant impacts in eastern and southern Africa.
Of all maize varieties released by public and private
breeding programs since 1966 and whose parentage
is known, 24% were developed using CIMMYT
source materials (35% if South Africa is excluded).
Use of CIMMYT germplasm increased steadily
over time; of the varieties released since 1990 and
whose parentage is known, over 31% were
developed using CIMMYT source materials (55%
if South Africa is excluded). In 1996, approximately
1.6 million ha in eastern and southern Africa were
planted to varieties that had been developed using
CIMMYT germplasm, representing nearly 21% of
the area planted to all modern varieties. Excluding
South Africa, where farmers grow mainly
temperate materials not targeted by CIMMYT’s
breeding program, nearly 37% of the area planted
to modern varieties in eastern and southern Africa
was planted to varieties containing CIMMYT
germplasm. Taken together, the varietal release data
and the adoption data indicate growing demand
for CIMMYT source materials on the part of public
and private breeding programs, as well as growing
acceptance by farmers of varieties developed using
those materials. The observed growth in demand
for and use of CIMMYT germplasm in eastern and
southern Africa over recent years validates the
decision by the CIMMYT Maize Program to
establish regional maize breeding programs in
eastern and southern Africa and to allocate
increased resources to local adaptive breeding.

33
ReferencesCIMMYT. 1999. 1997/98 CIMMYT World Maize Facts and Trends; Maize
Production in Drought-Stressed Environments: Technical Optionsand Research Resource Allocation. Mexico, D.F. CIMMYT.
Eicher, C.K., and B. Kupfuma. 1997. Zimbabwe’s emerging maizerevolution. In D. Byerlee and C.K. Eicher (eds.), Africa’sEmerging Maize Revolution. Boulder, Colorado: Lynne RiennerPublishers.
Ellis, R. T. 1959. The food properties of flint and dent maize. East AfricanJournal (24): 251-253.
Hassan, R. 1998. Maize Technology Development and Transfer: A GISApplication for Research Planning in Kenya. Wallingford, U.K.:CAB International.
Hassan, R. and D. Karanja. 1997. Increasing maize production in Kenya:Technology, institutions and policy. In D. Byerlee and C.K. Eicher(eds.), Africa’s Emerging Maize Revolution. Boulder, Colorado:Lynne Rienner Publishers.
Hassan, R., J. Lynam, and P. Okoth. 1998. The spatial sampling frameand design for farmer and village surveys. In R. Hassan (ed.),Maize Technology Development and Transfer: A GIS Applicationfor Research Planning in Kenya. Wallingford, U.K.: CABInternational.
Heisey, P., and M. Smale. 1995. Maize Technology in Malawi: A GreenRevolution in the Making. CIMMYT Research Report No. 4.Mexico, D.F.: CIMMYT.
Howard, J., and C. Mungoma. 1997. Zambia’s stop-and-go maizerevolution. In D. Byerlee and C.K. Eicher (eds.), Africa’sEmerging Maize Revolution. Boulder, Colorado: Lynne RiennerPublishers.
López-Pereira, M.A., and M.L. Morris. 1994. Impacts of InternationalMaize Breeding Research in the Developing World, 1966-90.Mexico, D.F.: CIMMYT.
Lynam J., and R. Hassan, 1998. A new approach to securing sustainedgrowth in Kenya’s maize sector. In R. Hassan (ed.), MaizeTechnology Development and Transfer: A GIS Application forResearch Planning in Kenya. Wallingford, U.K.: CAB International.
Morris, M.L., and M.A. López-Pereira. 1998. Impacts of Maize BreedingResearch in Latin America: 1966-97. Mexico, D.F.: CIMMYT.
Moshi, A., P. Anandajayasekeram, A. Kaliba, D. Martella, W. Mwangi,and F. Shao. 1997. Economic Impact of Maize Research inTanzania. Gaborone, Botswana: SADC-SACCAR.
Pandey, S. 1998. Varietal development: Conventional plant breeding. InM.L. Morris (ed.), Maize Seed Industries in Developing Countries.Boulder, Colorado: Lynne Reinner Publishers.
Pray, C., and R. Tripp. 1998. Industrial policy issues: Participation, pricesand property rights. In M.L. Morris (ed.), Maize Seed Industriesin Developing Countries. Boulder, Colorado: Lynne ReinnerPublishers.
Rusike, J. 1998. Zimbabwe. In M.L. Morris (ed.), Maize Seed Industriesin Developing Countries. Boulder, Colorado: Lynne ReinnerPublishers.
Rusike, J., and M. Smale. 1998. Malawi. In M.L. Morris (ed.), MaizeSeed Industries in Developing Countries. Boulder, Colorado: LynneReinner Publishers.
Smale, M., and P. Heisey. 1997. Maize technology and productivity inMalawi. In D. Byerlee and C.K. Eicher (eds.), Africa’s EmergingMaize Revolution. Boulder, Colorado: Lynne Rienner Publishers.
Tripp, R. 1998. Regulatory Issues: Varietal registration and seed qualitycontrol. In M.L. Morris (ed.), Maize Seed Industries in DevelopingCountries. Boulder, Colorado: Lynne Reinner Publishers.
Van Rensburg, J.B. 1996. The History of Maize. Grain Crops Institute,Agricultural Research Council, Potchefstroom, South Africa.


