
'Ailli
RESEARCH N!'P()RT
MiIC 83· 1
MANAGEMENT OF DAIRY PRODUCTS AND
UTILIZATION OF POINT-OF-PURCHASE
ADVERTISING IN RETAIL FOOD STORES
-----------~A~---TEXAS AGRICULTURAL MARKET V RESEARCH & DEVELOPMENT CENTER
TEXA:, A&M UNIVERSITY. TEXAS AGRICULTURAL EXPERIMENT STATION. TEXAS A.GRICULTURAL EXTENSION SERVICE. CoII0l:901: S.ot.on, T...o,

MANAGEMENT OF DAIRY PRODUCTS AND UTILIZATION OF POINT-OF-PURCHASE ADVERTISING IN RETAIL FOOD STORES
by
M. Dean Ethridge John P. Nichols
Robert E. Branson
A Report to: ASSOCIATED NILK PRODUCERS, INC.
January 1983
THE TEXAS AGRICULTURAL MARKET RESEARCH AND DEVELOPMENT CENTER
in cooperation with
Department of Agricultural Economics The Texas Agricultural Experiment Station
Texas A&M University College Station, Texas

THE TEXAS AGRICULTURAL MARKET RESEARCH AND DEVELOPMENT CENTER
An Education and Research Service of
The Texas Agricultural Experiment Station and
The Texas Agricultural Extension Service
The purpose of the Center is to be of service to agricultural producers. groups and organizations, and governmental agencies. as well as processing and marketing firms in the solution of present and merging marketing problems. Primary emphasis is given to research and educational activities designed to improve and expand the markets for food and fiber products of present or prospective interest to Texas agriculture. Analyses are also directed toward an analysis of consumer food and fiber needs.
The Center is staffed by a basic group of professional agricultural and marketing economists from both the Experiment Station and Extension Service. In addition, support is provided by food technologists, statisticians and specialized consultants as determined by the requirements of individual projects.
Robert E. Branson Coordinator
ACKNO~~EDGEMENTS
This report is a documentation of results of a survey conducted by the Southern Region Promotion Division of AMPI. The authors wish to acknowledge the contributions of the staff in this division, especially Shelly Zuber who handled all of the development, questionnaire design and fieldwork coordination. The assistance of Dr. Robert Shwart in designing the analysis and evaluating the results is greatly appreciated. The authors also wish to express thanks to Mary Lou Price. Cynthia Burgeson and Cynthia Chervenka for assisting with data handling and manuscript preparation.
ii

LIST OF TABLES
Page
Table 1 Frequency of sampling within designated classifications of parent retail organizations . . . . . . . . . . . .. 3
Table 2 Frequency of sampling according of floor space in stores .
to estimated square feet . . . . . . . . . .. 3
Table 3 Frequencies of alternative types of dairy cream cases . ·
cases and ice
· · · . . 5
Table 4 Frequencies of alternative types of dairy cases, to store classifications . . · . ·
according 5
Table 5 Frequencies of alternative types of according to store classifications
ice cream cases, . · · 5
Table 6 Selected housekeeping and to dairy cases
stocking practices pertaining
· · . 7
Table 7 Temperature readings in dairy cases, for alternative classifications
for all stores and
· 8
Table 8 Stocking levels relative to shelf products in the dairy case ·
space for . ·
selected
· · · · 9
Table 9 Selected housekeeping and stocking practices pertaining to cheese displays . . . . . . . . . . . . . . . . . .. 11
Table 10 Selected housekeeping and to ice cream cases .
stocking practices pertaining 12
Table 11 Temperature readings in ice cream cases, and for alternative classifications
for all stores 13
Table 12 General attitudes and awareness about POP materials 14
Table 13 Attitudes and materials
awareness about June Dairy Month POP 16
Table 14 Frequency and amounts of dairy in sample stores . . . .
case POP materials found . . . . . . . . . . . 17
Table 15 Frequency of appearance of dairy sample stores
case POP materials in . . .. ..... 18
Table 16 Selected observation regarding condition and of dairy case POP materials
appearance
· · 19
Table 17 Height of milk, butter, cheese and installed in retail stores · .
ice cream mobiles
· 19
iv

TABLE OF CONTENTS
Page
SUMMARY AND HIGHLIGHTS vi
INTRODUCTION . • . 1 Obj ectives 1 Procedures 1
DESCRIPTION OF SAMPLE 2 General Descriptive Data 2 Dairy Products Departments 4
MANAGEMENT PRACTICES 6 Dairy Cases . . . . . . . 6
Housekeeping Practices 6 Stocking Practices 10
Cheese Displays 10 Ice Cream Cases . . . 12
OPINIONS ABOUT POINT-OF-PURCHASE 13 POP Materials in General 13 June Dairy Month Materials 15
USE OF POINT-OF-PURCHASE MATERIALS 16 Dairy Case . . . . . . . . 16
Installation . . . . . . . 16 Condition and Location . 18
Cheese Case . . . . . . . 20 Installation . . . . . . 20 Condition and Location 20
Ice Cream Cases . . . 21 Sunnnary 21
APPENDIX A 22
A"PPENDIX B . 26
iii

Page
Table 18 Frequency and sample stores
amount of cheese POP materials found . . . .. .....
in 20
Table A-1 Frequency of various food retailing organizations included in the AMPI survey, summer 1980. .... 23
Table A-2 Frequency of sampling within designated AMPI market areas, summer 1980 . . • . . . . . . . . . . . . . . 25
v

Summary and Highlights
This study reports the results of a survey of 504 retail food stores
in five South Central states in June and July 1980. The purpose of the
study was to evaluate the management of retail displays of dairy products
and the use of June Dairy Month pOint-of-purchase (POP) promotion materials.
The questionnaire was developed and field work conducted by the Southern
Region Promotion Division of Associated Milk Producers, Inc. (AMPI). The
data were tabulated and analyzed by the Texas Agricultural Market Research
and Development Center at Texas A&M University.
A wide range of data describing the types of dairy product displays
found, the nature of management practices and quality of displays is pre
sented. Conventional "chest type" of display cases with shelves were found
in over 90 percent of the stores surveyed. The traditional "coffin type"
chest freezer was found in ice cream displays in nearly two-thirds of the
stores. These percentages were found to vary somewhat by the Chainstore's
distribution area. Seventeen percent of the stores surveyed had delica
tessen sections.
Over 88 percent of the dairy cases in surveyed stores were judged to
have a generally neat appearance. Organization of displays was not con
sistent with a many failing to capitalize on techniques known to reduce
customer traffic congestion or promote customer inspection of all products
in the dairy case. Pull date~ were found to be exceeded in 1.8 percent of
stores for whole milk, 3.4 percent for low-fat and 3.6 percent for butter
milk. Beer or wine were found in dairy cases in 3.4 percent of the stores.
Approximately 80 to 90 percent of the stores had adequately stocked dis
plays at the time of the interview.
In general, 73 percent of store managers interviewed believed that POP
promotional materials were useful in generating sales. The June Dairy Month
POP materials were found in 38 percent of the retail stores at the time of
the interview (from two to 8 weeks after the display was to have been ini
tiated). This varied by market area. Stores where independent installers
were used had a higher frequency of POP material (58 percent). Where store
personnel were responsible for putting up material the frequency was much
IOVler (26 percent). The most frequently observed item was the mobile;
vi

each of the three (milk, cheese and ice cream mobiles) were found in approxi
mately 30 percent of the stores. In those stores displaying material it was
generally found to be installed properly and in good condition.
vii

Introduction
This report summarizes results of a survey planned and conducted by
the Southern Region Promotion Division of Associated Milk Producers,
Incorporated (AMPI). The survey was conducted primarily during the months
of June and July, 1980, for the purpose of providing information about (a)
installation and effectiveness of June Dairy Month instore, point-of-pur
chase advertising materials and (b) related marketing techniques used by
regional grocery stores.
Objectives
The agreement between A}~I and the Texas Agricultural Market Research
and Development Center (MRC) prOVided that the MRC analyze results of the
AMPI field survey in order to:
(1) Determine the installation rate of June Dairy Month in-store
display materials.
(2) Describe the use made of alternative display materials and the
attractiveness of such materials.
(3) Analyze management practices and attitudes relevant to the effec
tiveness of in-store promotion materials.
Procedures
Some preliminary consultation with A}WI personnel on formulation of
the questionnaire to use in the survey was provided. However. the ultimate
form of the questionnaire, as well as administration of the survey, was the
responsibility of AMPI. A copy of the questionnaire used is shown in
Appendix B.
Upon receiving the original, unedited field questionnaires, the MRC
(a) edited, coded, and entered these data into the computer system at Texas
A&M University, (b) verified the accuracy of the computerized data, and
(c) carried out analyses in accordance with the above objectives. Over 500
computer tabulations were made on the data, all of which were made avail
able to AMPI personnel.
The remainder of this report is organized as follows: First, a des
cription of the sample stores is given, with emphasis on the dairy depart
1
2
ment. Then selected management practices are explored, stressing the house
keeping, stocking, and maintenance practices applicable to the dairy depart
ments. This is followed by an analysis of awareness and opinions about point
of-purchase (POP) promotional materials. Finally, utilization of the June
Dairy Month POP materials in 1980 is examined.
Description of Sample
General Descriptive Data
The survey included stores located in six states (Texas, New Mexico,
Oklahoma, Kansas, Arkansas, and Tennessee) and associated with 36 distinct
food retailing organizations. A total of 504 food stores were surveyed by
AMPI. A basic, pre-selected sample consisted of 307 stores. This was sup
plemented by random visitations to 197 additional stores. The total sample
of 504 stores was used for deriving the results in the report (Appendix
Table 1).
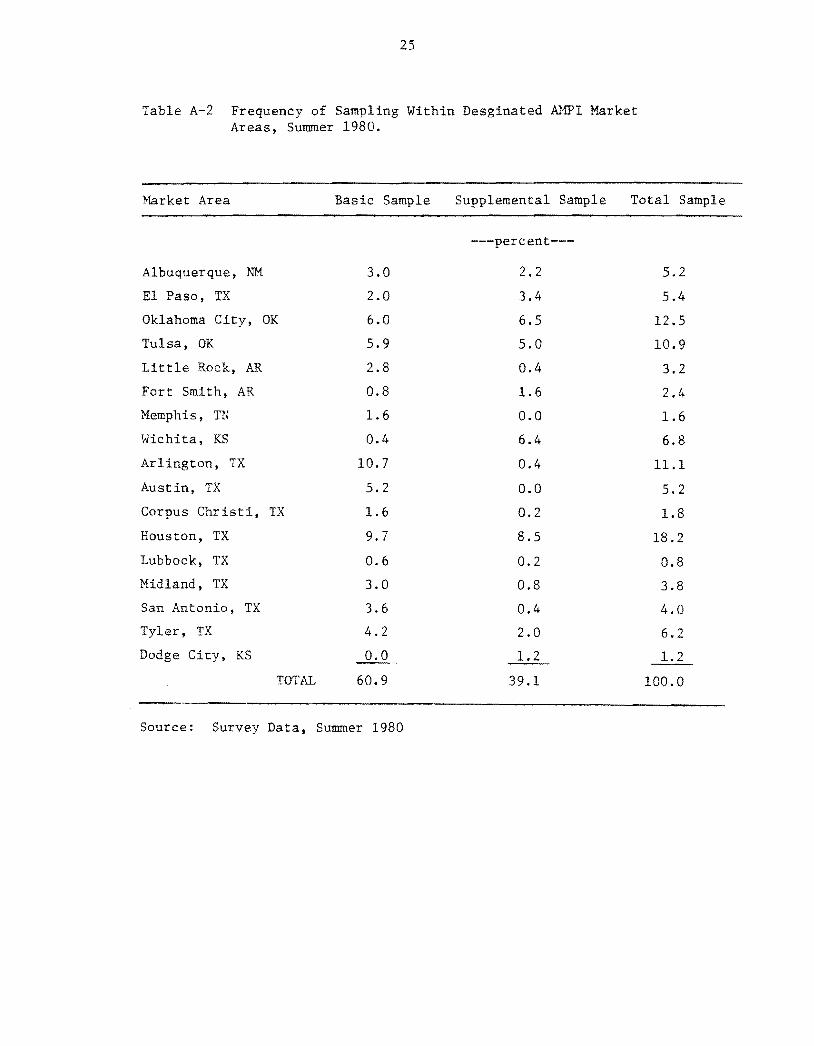
The promotional activities of MWI are organized around designated
"market areas", which are identified by the names of prominent cities within
these areas. There were 17 market areas represented in this survey. These
are given in Appendix Table 2, along with frequencies of representation by
stores within each market area.
The stores may also be classified according to the geographic outreach
of the food retailing organizations with which they are associated. The
four main classifications used are national, interstate, intrastate, and
metro stores. These were arbitrarily classified with national referring to
chains with stores in most areas of the country while interstate were those
having stores in more than one state but not national in scope. Intrastate
were those with stores only in one state but not confined to a single metro
politan area. Metro were those where the retailing firm was confined to
one metropolitan area. National and intrastate stores dominate the sample
with a combined total of 73.4 percent of all stores interviewed (Table 1).
A fifth, somewhat distinct classification is also shown: convenience stores.
However, since only 1 percent of the sample was made up of these convenience
stores, information collected on them is not adequate to make valid infer
ences from the data (Table 1).

3
Another useful classification is according to the size of individual
stores. Stores with more than 25,000 square feet of floor space comprised
40.9 percent of the sample (Table 2). Stores of more than 6,000 square
feet comprised 87.5 percent of the sample, leaving only 12.5 percent of the
stores with 6,000 square feet or less.
Table 1 Frequency of Sampling Within Designated Classifications of Parent Retail Organizations.
Classification Share of Stores
National
Interstate
Intrastate
Metro
Convenience
---percent--
31. 7
13.7
41. 7
11. 9
1.0
100.0
Source: Survey Data, Summer 1980
Table 2 Frequency of Sampling According to Estimated Square Feet of Floor Space in Stores.
Size Class Share of Stores
---percent--
1,000 sq. ft. & smaller 3.8
1,001 - 6,000 sq. ft. 8.7
6,001 - 25,000 sq. ft. 46.6
25,001 sq. ft. & larger 40.9
100.0
Source: Survey Data, Summer 1980

4
Dairy Products Departments
There are two major types of dairy cases. The "conventional" dairy
case consists of upright refrigerated shelves which have no coverage
in front so that the various diary products may be simply lifted off.
These cases often have doors or curtains behind the shelves which
may be opened for re-stocking. Alternatively, the dairy case may be
an upright case with doors (usually glass) which seal the case much like a
home refrigerator.
Ice cream cases are also of two major types. The conventional "coffin"
type is simply a chest type freezer, with or without coverings for the top,
which lets the customer reach down into the case for the ice cream. The
other type of ice cream case is essentially identical to the upright case
with doors described above. It is necessary to keep ice cream cases colder
than general-purpose dairy cases in order to prevent thawing.
The frequency by types of dairy and ice cream cases is summarized in
Table 3. The conventional dairy case dominates, comprising over 90 percent
of the total. The conventional ice cream case is also dominant, but less
so, with almost 64 percent of all ice cream cases being this type (Table J).
Comparison of frequencies of dairy and ice cream cases across the
different classes of stores reveals some differences. Thus, almost 99 per
cent of all dairy cases in the national store chains are the conventional
type. Interstate chains' dairy cases are about 94 percent of the conven
tional type. The dominance within intrastate and metro stores is somewhat
less, about 85-87 percent (Table 4).
The pattern among the classes of stores is somewhat similar for use of
ice cream cases. The national stores are again the largest users of the
conventional cases, with over 81 percent being this type. The interstate,
intrastate, and metro stores are somewhat smaller in their use of the con
ventional cases, with 53-67 percent being this type (Table 5).
Cheese products are often displayed in various places in the stores.
About 17 percent of the stores surveyed had delicatessen sections in which
cheeses were sold, while four percent had cheese and wine sections. Addi
tional detail on cheese products is given in the following discussion of
management practices.

5
Table 3 Frequencies of Alternative Types of Dairy Cases and Ice Cream Cases.
Type Dairy Cases Ice Cream Cases
---percent--
Conventional type
Upright w/doors
Other
90.3
8.9
0.8
63.7
28.6
7.7
Source: Survey Data, Summer 1980
Table 4 Frequencies of Alternative Types of Dairy Cases, According to Store Classifications.
Type National Interstate Intrastate Metro Conventional
---percent--
Conventional Type 98.8 94.2 85.2 86.7 20.0
Upright w/doors 0.0 5.8 14.3 11. 7 80.0
Other 1.2 0.0 0.5 1.6 0.0
Source: Survey Data, Summer 1980
Table 5 Frequencies of Alternative Types of Ice Cream Cases, According to Store Classifications.
Type National Interstate Intrastate Metro Conventional
---percent--
Conventional Type 81. 3 53.6 53.8 66.7 20.0
Upright w/doors 8.7 43.5 36.7 31. 7 80.0
Other 10.0 2.9 9.5 1.6 0.0
Source: Survey Data, Summer 1980
6
Management Practices
Interviewers observed several specified display case housekeeping
maintenance practices as well as stocking practices followed by the manage
ment of each store visited. These were mostly subjective, visual observa
tions.
Dairy Cases
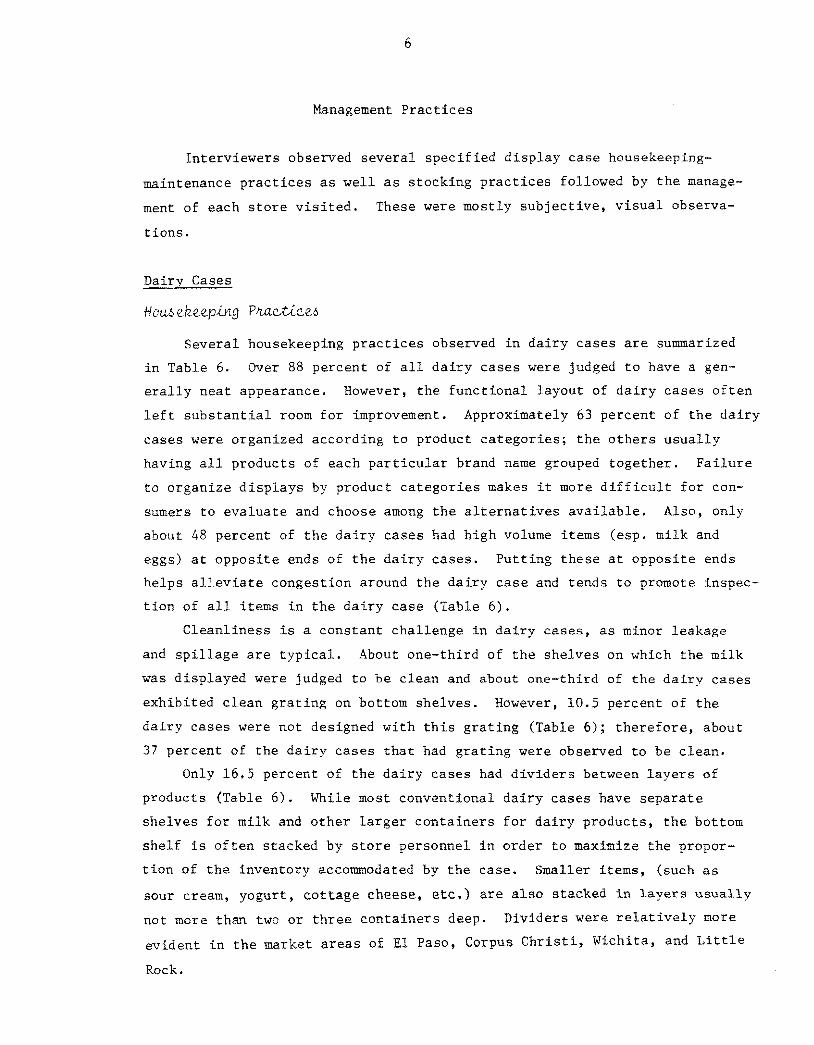
Several housekeeping practices observed in dairy cases are summarized
in Table 6. Over 88 percent of all dairy cases were judged to have a gen
erally neat appearance. However, the functional layout of dairy cases often
left substantial room for improvement. Approximately 63 percent of the dairy
cases were organized according to product categories; the others usually
having all products of each particular brand name grouped together. Failure
to organize displays by product categories makes it more difficult for con
sumers to evaluate and choose among the alternatives available. Also, only
about 48 percent of the dairy cases had high volume items (esp. milk and
eggs) at opposite ends of the dairy cases. Putting these at opposite ends
helps alleviate congestion around the dairy case and tends to promote inspec
tion of all items in the dairy case (Table 6).
Cleanliness is a constant challenge in dairy cases, as minor leakage
and spillage are typical. About one-third of the shelves on which the milk
was displayed were judged to be clean and about one-third of the dairy cases
exhibited clean grating on bottom shelves. However, 10.5 percent of the
dairy cases were not designed with this grating (Table 6); therefore, about
37 percent of the dairy cases that had grating were observed to be clean.
Only 16.5 percent of the dairy cases had dividers between layers of
products (Table 6). While most conventional dairy cases have separate
shelves for milk and other larger containers for dairy products, the bottom
shelf is often stacked by store personnel in order to maximize the propor
tion of the inventory accommodated by the case. Smaller items, (such as
sour cream, yogurt, cottage cheese, etc.) are also stacked in layers usually
not more than two or three containers deep. Dividers were relatively more
evident in the market areas of El Paso, Corpus Christi, Wichita, and Little
Rock.
7
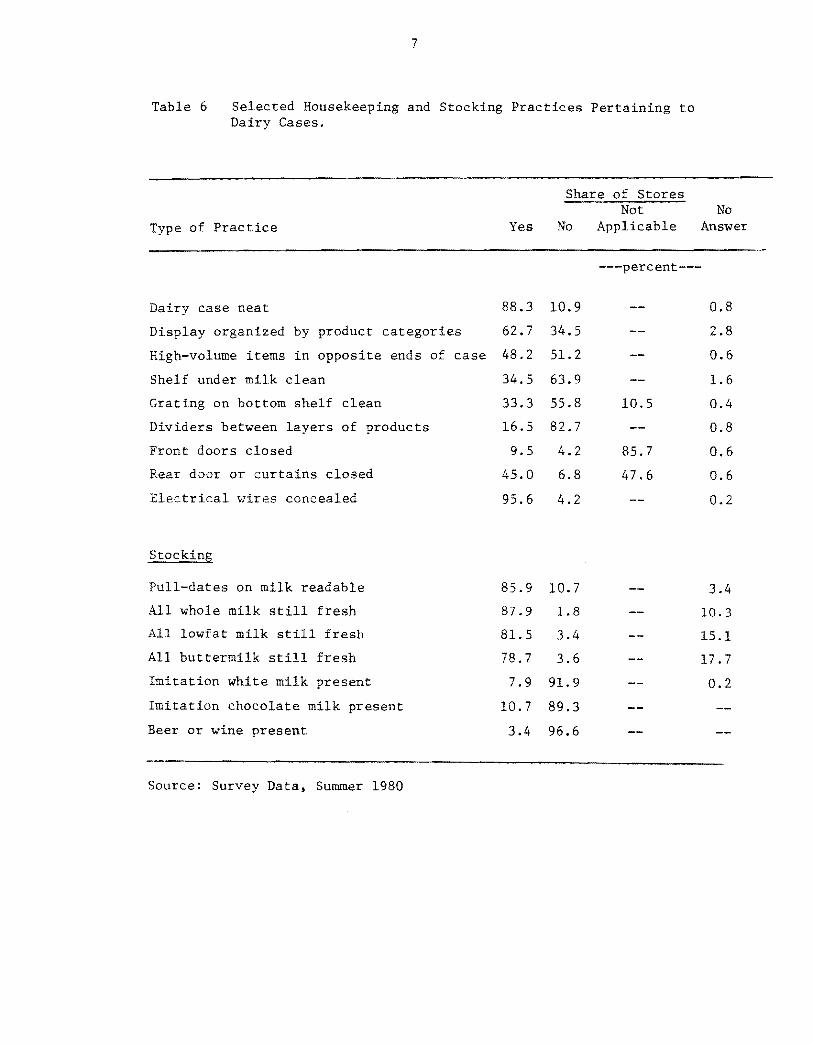
Table 6 Selected Housekeeping and Stocking Practices Pertaining to Dairy Cases.
Share of Stores Not No
Type of Practice Yes No Applicable Answer
---percent--
Dairy case neat 88.3 10.9 0.8
Display organized by product categories 62.7 34.5 2.8
High-volume items in opposite ends of case 48.2 51. 2 0.6
Shelf under milk clean 34.5 63.9 1.6
Grating on bottom shelf clean 33.3 55.8 10.5 0.4
Dividers between layers of products 16.5 82.7 0.8
Front doors closed 9.5 4.2 85.7 0.6
Rear door or curtains closed 45.0 6.8 47.6 0.6
Electrical wires concealed 95.6 4.2 0.2
Stocking
Pull-dates on milk readable 85.9 10.7 3.4
All whole milk still fresh 87.9 1.8 10.3
All lowfat milk still fresh 81.5 3.4 15.1
All buttermilk still fresh 78.7 3.6 17.7
Imitation white milk present 7.9 91. 9 0.2
Imitation chocolate milk present 10.7 89.3
Beer or wine present 3.4 96.6
Source: Survey Data, Summer 1980

8
Front doors on the dairy cases were observed to be open in 4.3 percent
of the stores (Table 6). However, since 85.7 percent of the cases did not
have front doors, this translates to about 29.4 percent of the cases with
doors having the doors open, resulting in unnecessary energy losses. Like
wise, 47.6 percent of the dairy cases did not have either doors or curtains
in the rear (Table 6). Therefore, the fact that rear doors or curtains were
observed to be open in 6.8 percent of the stores means that about 13 percent
of existing rear doors or curtains were left open.
There were no exposed electrical wires in 95.6 percent of the dairy
cases (Table 6). This already high percentage should be even closer to 100
percent, because exposed electrical wires are not just unsightly -- they
pose a potential danger to customers.
Readings of temperature gauges on dairy cases indicated temperatures
of 32 0 F or lower (which, if accurate, suggests a possible threat to fluid
and cultured dairy foods) in 63 percent of the stores. Readings of 42 0 F
or lower occurred in over 93 percent of the stores. There were only minor
variations in these readings across the alternative classes of stores con
sidered (Table 7). Apparently, the dairy cases in convenience stores
which are predominantly the upright-with-doors type -- are kept colder than
Table 7 Temperature Readings in Dairy Cases, for all Stores and for Alternative Classifications.
1/ All Temperature Stores National Interstate Intrastate Metro Convenience
---percent--
27 0 or lower 42.4 26.9 46.4 47.1 58.3 100.0 28 0 320to 20.6 27.5 27.5 17.1 8.3 0.0 330 to 370 15.5 17.5 15.9 14.8 13.3 0.0 380 420to 14.9 19.4 7.2 14.8 13 .3 0.0 430 to 470 2.6 3.7 1.5 1.4 5.0 0.0
480 or higher 4.0 5.0 1.5 4.8 1.7 0.0
Temperature recorded in Fahrenheit1/ Source: Survey Data, Summer 1980

Table 8 Stocking Levels Relative to Shelf Space for Selected Products in the Dairy Case.
Over No Empty Low Adequate Stocked Answer
---percent--
Whole Milk 0.4 11.7 83.9 3.8 0.2
Lowfat Milk 0.8 17 .0 79.4 2.4 0.4
Yogurt 2.0 15.3 81. 7 0.2 0.8
Cottage Cheese 1.4 16.9 80.5 0.2 1.0
Sour Cream 1.0 10.5 87.3 0.6 0.6 \0
Cream 3.6 14.5 80.5 0.4 1.0
Butter 1.2 8.3 88.3 0.8 1.4
Source: Survey Data, Summer 1980

10
the other stores (Table 7). But, as previously emphasized, the small number
of convenience stores surveyed makes conclusions about them difficult.
The pull-dates stamped on dairy cartons indicate when the products are
no longer considered to be fresh. These dates were judged to be readable in
almost 86 percent of the dairy cases. Observations on pull-dates for whole
milk, lowfat milk and buttermilk were made; however, no answer was recorded
in several instances (Table 6). Whole milk was verified to be fresh in only
87.9 percent of the stores with pull-dates exceeded in 1.8 percent and no
answer in 10.3 percent. The percentage dropped to 81.5 percent for lowfat
milk and dropped again to 78.8 percent for buttermilk. Pull-dates were ex
ceeded in 3.4 percent of the stores for lowfat milk and in 3.6 percent for
buttermilk. The higher percentages for lowfat milk and buttermilk may re
flect either the lower turnover of these items or the absence of them in
some dairy cases. Probably both explanations apply.
About 8 percent of the dairy cases stocked imitation white milk and
almost 11 percent had imitation chocolate milk. Beer or wine were included
in the dairy cases by 3.4 percent of the stores (Table 6).
Stocking levels of selected dairy case products relative to available
shelf space are summarized in Table 8. An "adequate" notation was given
when dairy case shelves were 80-100 percent full while "overstocked" was
indicated when products were covering return air vents or sitting in the
aisle. Approximately 80-90 percent of all products were adequately stocked.
Lowfat milk and cottage cheese were most frequently understocked, while whole
milk and lowfat milk were the only products exhibiting a slight tendency to
be overstocked from time to time (Table 8).
Cheese Displays
Use of alternative store locations for displaying cheese are indicated
in Table 9. The most common locations are in .a separate cheese case (49.6
percent of the stores) and in the dairy case (45.0 percent of the stores).
Cheese was stocked in only one location in the store about 69 percent of the
time, in two locations about 25 percent of the time, and in three or more
locations about five percent of the time. These other locations included
delicatessens, cheese/wine boutiques, meat counters, etc. (Table 9).

11
Stocking levels were observed to be adequate in more than 86 percent
of the stores. Imitation cheese products were on display with the cheeses
in almost 78 percent of the stores (Table 9).
Cheese display areas were judged to be clean in almost 88 percent of
the stores. However, expanded or moldy cheese was visible in 29 percent of
the stores (Table 9).
Table 9 Selected Housekeeping and Stocking Practices Pertaining to Cheese Displays.
Response No
Display and Stocking Practices Yes No Answer
Cheese displayed in:
Separate cheese case
Meat counter
Delicatessen
Dairy Case
Cheese/wine boutique
Other
Nothing (not displayed)
One location
Two locations
Three locations
Four locations
Stocking level adequate
Imitation cheese products present
Cheese display areas clean
Expanded or moldy cheese visible
Source: Survey Data, Summer 1980
49.6
15.1
17.1
45.0
4.0
4.0
1.2
68.6
25.0
4.6
0.6
86.3
77 .8
87.9
29.2
---percent--
50.4
84.9
82.9
55.0
96.0
96.0
98.8
31.4
75.0
95.4
99.4
13.5 0.2
22.0 0.2
11.1 1.0
69.8 1.0

12
Ice Cream Cases
About 73 percent of the ice cream cases were noted as having a neat
appearance while the shelf under the ice cream was judged to be clean in
only 33.5 percent of the stores. No answer was given on this for 22.4 per
cent of the stores (Table 10). Perhaps the reason for so many "no answer"
situations is that the coffin type ice cream cases were often too full to
permit observation.
Evidence of thawed or melted ice cream was found in over 57 percent of
the ice cream cases (Table 10). Readings of the case temperature gauges,
where possible, revealed only 2.4 percent of the ice cream cases registered
210 F or warmer with 92.5 percent of them registering 00 F or below (Table 11).
Ice cream thawing may be due to inefficiencies of cooling in open-top cases,
redistribution of ice cream by customers, temporary overstocking of cases,
etc.
Vanilla ice cream stocks were observed to be adequate (i.e., 90-100
percent full) in over 80 percent of the stores. For frozen noveleties,
stocking levels were adequate in almost 79 percent of the stores (Table 10).
Table 10 Selected Housekeeping and Stocking Practices Pertaining to Ice Cream Cases.
Response No
Practice Yes No Answer
---percent--
Ice cream case neat 72.8 25.4 1.8
Shelf under ice cream clean 33.5 44.1 22.4
Evidence of thawed or melted ice cream 57.3 40.3 2.4
Stocking level adequate for:
Vanilla ice cream 80.2 17.8 2.0
Frozen novelties 78.6 18.0 3.4
Source: Survey Data, Summer 1980

13
Table 11 Temperature Readings in Ice Cream Cases, for All Stores and for Alternative Classifications.
All11 Temperature Stores National Interstate Intrastate Metro Convenience
---percent--
-20 or lower 66.3 60.0 62.3 69.5 75.0 80.0
-21 to -10 12.7 16.9 10.1 9.5 16.7 0.0
-11 to 0 13.5 13.1 17.4 14.8 5.0 20.0
1 to 10 3.0 4.4 4.4 1.4 3.3 0.0
11 to 20 2.2 2.5 1.5 2.9 0.0 0.0
21 to higher 2.4 3.1 4.3 1.9 0.0 0.0
11 Temperature recorded in Fahrenheit
Source: Survey Data. Summer 1980
Opinions About Point-Of-Purchase
The term "point-of-purchase materials ll refers to graphic advertising
materials placed in the store to attract attention at the location where
consumers decide whether or not to select a product for purchase. Such
materials may take the form of posters, stickers, mobiles, banners, tags,
pamphlets, etc.
Several questions were asked of food store managers to elicit their
opinions about point-of-purchase (POP) materials in general and the June
Dairy Month materials supplied by the American Dairy Association (ADA) in
particular. Also, some indications were obtained about their general aware
ness of availability and variety of POP materials.
POP Materials in General
Over 73 percent of the store managers believed that POP promotional
materials were useful in generating sales (Table 12). Some reasons given
for not using POP materials were: (1) clutters store, company policy against
them, people do not notice them, etc. (mentioned by 9 percent of managers)

14
and (2) must be in correct place and in good taste or they will not help
(mentioned by seven percent of managers).
Less than 22 percent of the managers indicated an awareness of any
contests or prizes for supermarket personnel who develop POP displays for
certain products (Table 12). Many of those who had been aware of such con
tests or prizes could not recall who had sponsored them. The only sponsors
mentioned (by eight percent of the managers) were local food handlers or
brokers. But almost 55 percent indicated that they would be willing to be
come involved in a contest that offered a $100 prize for the best cheese
display (Table 12). There were, however, two major conditions: (1) would
depend on approval from the district office (mentioned by 14.5 percent of
managers) and (2) must not cause too much bother (mentioned by 5.6 percent
of managers).
Table 12 General Attitudes and Awareness About POP Materials.
Response No
Attitude Yes No Answer
Believe that POP materials help sales
Aware of Contests for best POP displays
Would be involved in contest paying $100 for best cheese display
Would use pads of dairy recipes if made available
POP materials put up by:
Store employee
Someone else
Both
73.2
21.6
54.6
81.8
35.9
38.5
25.6
---percent--
16.3 10.5
69.9 8.5
27.2 18.2
8.1 10.1
Source: Survey Data, Summer 1980

15
Almost 82 percent of the managers indicated that they would make use
of dairy recipe pads if they were available (Table 12). Qualifying com
ments indicated that the recipe pads must be attractively designed to go in
a convenient place; e.g., on bulletin board or in consumer center (men
tioned by nine percent of managers).
In response to a question about the store's policy about who puts up
POP materials, an approximately equal number of managers (35-40 percent)
indicated that store personnel did it or that someone else besides store
personnel did it, while slightly over 25 percent of them said that both
store personnel and others could do it (Table 12). Apparently, if a spon
soring organization wanted to do the installation there would be no objec
tions from about 75 percent of the stores.
June Dairy Month Materials
About 22 percent of the store managers said they believed that
the June Dairy Month POP materials had increased sales of dairy products.
About 12 percent said they believed they had ~ increased sales, with no
answer given by almost 66 percent of the managers (Table 13). The primary
reason for so many "no-response" answers is that--as will be made clear in
the next section--almost 62 percent of the stores had never installed the
POP materials for June Dairy Month. Therefore, they had no basis for an
opinion. However, 4.5 percent of the managers did comment that it was im
possible for them to measure any impact the POP materials may have on sales.
Also, about six percent said that the materials did not last long enough to
determine an impact and/or that the materials needed improvement in design
and durability.
When asked if they would use a larger quantity of the POP materials
furnished by ADA, 22 percent of the managers again responded affirmatively.
However, almost 18 percent said they would not and 60 percent gave no answer
(Table 13). Some comments were that the materials would have to be altered,
that more mobiles would be welcomed, that all materials except the mobiles
would be used, etc.

16
Table 13 Attitudes and Awareness About June Dairy Month POP Materials.
Attitude Yes
Response
No No
Answer
---percent--
Believe that POP materials have increased sales of dairy products 22.2 12.1 65.7
Would use more of the POP materials if they were available 22.2 17.7 60.1
Source: Survey Data, Summer 1980
Use of Point-Of-Purchase Materials
One of the important areas of interest in the survey was to determine
the usage patterns for point-of-purchase (POP) advertising material pro
vided to retail stores. This included an inventory of materials which were
found in each store and an assessment of the appropriateness of their place
ment within the store and selected appearance factors.
POP materials were to be placed in three different areas of the store;
dairy case, cheese case and ice cream case. The POP kit includes 10 pieces
relating to products usually found in the dairy case, three pieces for the
cheese case and one for ice cream. These pieces were of four types: mobiles
to be hung from the ceiling, rail strips and wag-tags to be attached to the
rail or shelf under the product and general purpose banners.
Dairy Case
Of the 504 stores, 61.9 percent had no dairy case materials displayed
at the time of the interview. Approximately seven percent of the stores
had all ten pieces displayed while 27 percent had six or more pieces. Ele
ven percent displayed from one to five pieces (Table 14). If a store had

17
Table 14 Frequency and Amounts of Dairy Case POP Materials Found in Sample Stores.
Number of Pieces Share of Stores
---percent--
o 61.9
1 1.6
2 1.2
3 2.2
4 2.0
5 4.0
6 5.4
7 4.6
8 6.1
9 4.6
10 6.5
Source: Survey Data, Summer 1980
any material at all, there were typically several pieces used. The most
frequently observed item was the milk mobile which appeared in 30 percent
of the stores (Table 15). The butter mobile, rail strips and banners were
found in 25 to 30 percent of the stores, with the wag tags appearing in 20
to 23 percent.
The frequency of appearance varied greatly among the 18 market areas
checked. Three areas (Tulsa, Little Rock and Ft. Smith) showed more than
90 percent of the stores with no materials. Only five market areas
(Albuquerque, E1 Paso, Memphis, Houston and Tyler) had some materials ap
pearing in more than one-half of the stores checked. It should be noted
that all of the stores in the sample were scheduled to have received
materials.
Approximately 36 percent of store managers interviewed indicated that
store employees install point-of-purchase materials. Of those stores 74
percent had no dairy case POP material displayed. Of the stores where

18
someone other than store employees put up POP material approximately 42
percent had no dairy case material at the time of the interview. It con
firms the conventional wisdom that depending on store employees to install
the material is not a good way of insuring that it will be used.
Table 15 Frequency of Appearance of Dairy Case POP Materials in Sample Stores.
Dairy Case Share of Stores POP Item Displaying
Milk mobile
Butter mobile
Rail Strips
"Calcium" "Teeth" "Bones"
Wag tags
Milk Butter Cottage Cheese
Banners
Milk case Butter
---percent--
30
28
30 28 28
20 21 23
26 25
Source: Survey Data, Summer 1980
Condition and Location
In those stores where the dairy case POP materials were found, it was
usually installed properly and in good condition (Table 16). The one major
problem was that the case banners in the 42 percent of the stores where
they appeared were not folded correctly to give them a three-dimensional
appearance.
The height and location of milk and butter mobiles were also evaluated.
In most cases they were hung at the proper height (7-10 ft.) but in about

19
20 percent of the stores they were hung higher than 10 feet (Table 17).
In over 90 percent of the stores these mobiles were hung out over the
aisle and not over the dairy case itself.
Table 16 Selected Observation Regarding Condition and Appearance of Dairy Case POP Materials.
ResEonse Observation Yes No
1. General appearance is clean and attractive
2. Enhances dairy case decor
3. Case banners attached with magnets
4. Case banners in proper places
5. Case banners folded properly
6. Rail strips properly placed in milk section
7. Wag tags placed under proper products
---percent--
94 6
81 19
93 7
94 6
58 42
93 7
91 9
Source: Survey Data, Summer 1980
Table 17 Height of Milk, Butter, Cheese and Ice Cream }1obiles Installed in Retail Stores.
Share of Stores milk butter cheese ice cream
Height mobile mobile mobile mobile
---percent--
Under 7 feet 10 8 8 4
7-10 feet 72 71 67 66
Over 10 feet 18 21 25 30
Source: Survey Data, Summer 1980

20
Cheese Case
Approximately the same number of stores (37 percent) were found to
have cheese POP material as those which displayed dairy case material
(38 percent). Those which had cheese POP material were equally divided
among those displaying 1, 2 or all 3 available pieces (Table 18).
Table 18 Frequency and Amount of Cheese POP Materials Found in Sample Stores
Number of Pieces of Cheese POP Share of Stores
---percent--
o 62.9
1 11.3
2 12.9
3 12.9
Source: Survey Data, Summer 1980
The cheese mobile was the most frequently used (30 percent) while t.he.
cheese wag tag was least (20 percent). Combinations of the three pieces
appeared in a smaller share of the stores checked. The effect of personnel
installing material was the same as observed for dairy case material. A
lower share of stores were found to display the cheese POP among those
stores where the manager indicated that store personnel put up the material.
Frequency of installation varied among market areas in a similar pat
tern to that described earlier for dairy case POP. The range was from no
stores displaying materials in Lubbock to 100 percent of stores sampled in
Memphis and 81 percent of stores in Albuquerque.
The appearance of the cheese POP material was observed to be clean and
attractive in nearly all (96 percent) of the stores where it was used. The

21
range in cheese mobile height was about the same as that noted for milk and
butter mobiles (Table 17).
Ice Cream Cases
The only ice cream POP material supplied in the kit was a mobile. It
was in place in about 28 percent of the stores surveyed and, similarly to
the other material, was more likely to be observed in stores where someone
other than store employees did the installation. The ice cream mobile
appeared in more than 50 percent of sample stores in three market areas
(Albuquerque, El Paso and Memphis). It appeared in less than 10 percent
of the stores in five market areas, most of which were the same as those
listed earlier for dairy and cheese POP.
The ice cream mobiles seen were in good condition in over 90 percent
of the instances. It was hung over the aisle in about 75 percent of the
stores and at the appropriate height (7 to 10 ft) in two-thirds of them.
Summary
Two main points should be emphasized. First, the POP materials were
found in less than 40 percent of the retail stores. In those stores where
the materials were installed, more than half of the individual items were
used and they were generally found to be placed properly and in good con
dition. Significant variation occurred among market areas in the percent
of stores displaying the POP materials and there was also a positive asso
ciation with the use of persons other than store employees as installers.

APPENDIX A

23
Table A-l Frequency of Various Food Retailing Organizations Included in the AMPI Survey, Summer 1980.
Store Basic Supplemental Total Name Sample Sample Sample
---percent---
Skaggs 2.2 1.2 3.4
Albertson's 2.0 0.4 2.4
Smith's 1.4 1.0 2.4
Full's 0.8 1.4 2.2
Safeway 11. 7 9.3 21.0
Piggly Wiggly 1.6 0.4 2.0
Food City 0.4 0.0 0.4
Hinn-Dixie 3.4 0.2 3.6
Tom's 0.0 0.4 0.4
Happy 0.4 0.2 0.6
Humpty Dumpty 1.0 1.2 2.2
Fleming 3.0 3.2 6.2
Affilliated 7.1 3.2 6.2
Family 0.6 0.6 1.2 Heingarten 2.8 2.2 5.0
Kroger 2.2 1.0 3.2
Brookshire Brothers 0.8 0.2 1.0
Big Star 0.6 0.0 0.6
Dillon's 0.0 0.8 0.8
IGA 0.0 3.6 3.6
Minyard's 1.8 0.0 1.8
J.R. Beadel 1.2 0.0 1.2
H.E.B. 5.6 1.0 1.2
Tom Thumb 1.6 0.0 1.6
Handy Andy 2.0 0.2 2.2
Eagle (or Lucky) 1.2 0.6 1.8
Super Duper 0.4 0.4 0.8
Stanley 0.2 0.8 1.0
CONT.

24
Store Basic Supplemental Total Name Sample Sample Sample
---percent--
Dick's 0.2 0.2 0.4
Gerland's 1.4 1.2 2.6
Food town 0.0 0.4 0.4
Lewis & Coker 0.4 0.4 1.0
Randall's 0.6 0.4 1.0
Jack & Jill 0.2 0.4 0.6
Brookshires Grocery 2.4 2.0 4.4
Other 0.0 0.8 0.8
25
Table A-2 Frequency of Sampling Within Desginated AMPI Market Areas, Summer 1980.
'Market Area Basic Sample Supplemental Sample Total Sample
---percent--
Albuquerque, NM 3.0 2.2 5.2
El Paso, TX 2.0 3.4 5.4
Oklahoma City, OK 6.0 6.5 12.5
Tulsa, OK 5.9 5.0 10.9
Little Rock, AR 2.8 0.4 3.2
Fort Smith, AR 0.8 1.6 2.4
Memphis, TN 1.6 0.0 1.6
l.Jichita, KS 0.4 6.4 6.8
Arlington, TX 10.7 0.4 11.1
Austin, TX 5.2 0.0 5.2
Corpus Christi, TX 1.6 0.2 1.S
Houston, TX 9.7 S.5 1S.2
Lubbock, TX 0.6 0.2 O.S
Midland, TX 3.0 O.S 3.8
San Antonio, TX 3.6 0.4 4.0 Tyler, TX 4.2 2.0 6.2
Dodge City, KS 0.0 1.2
TOTAL 60.9 39.1 100.0
Source: Survey Data, Summer 19S0

APPENDIX B

27
DCI MERCHANDISING SURVEY Staff Code _________________________
Store _________________________________ Date ______________________________ _ Address _______________________________
Day of Week _____________
City/State/Zip ___________ Time of Day _____________
If ADA point of purchase material is not installed, do not do questions in boxes.
I. STORE MA..~AGER
Introduce yourself to the store manager or assistant manager as follows:
"I am (name) • a (title) with the Dairy Council. We are doing a survey of 1900 supermarkets for the American Dairy Association who recently placed some point of purchase (POP) material in your store.
ADA will use the information from this survey to improve its services to supermarkets. I would like to check your dairy and frozen food cases and ask you to answer these short questions about pOint of purchase material. Your answers and the information on this survey will be confidential and will be averaged with the responses from other supermarkets in this state.
A. Do you feel point of purchase (POP) materials are useful in 1. yes generating sales? (ie. Kraft cheese materials, Del Monte 2. no canned fruits, in Texas, TAP)
Comments:
B. Are you aware of any contests or prizes for supermarket personnel 3. yes who develop point of purchase displays for certain products? 4. no
Who;
C. 1-1ould you become involved in a contest that offered a $100 prize 5. yes for the best cheese display? 6. no
Do you feel that the American Dairy Association point of purchase (POP) material has increased sales of dairy products since they were installed?
7. yes
8. no
E. Who puts the POP materials up in your store? 9. Store Employee
____10. Someone else
F. Would you use a greater quantity of these ADA POP materials ~f 11. yes they were available? (ie. 5 more wag tags, 2 more milk case banners, ----12. no etc. )
G. If pads of dairy recipes were available, would you use them? __l3. yes
14. no

28
H. To the nearest thousand feet, what is the square footage of _____ sq. ft. this store? (If the manager does not know, give the number of check out stands.)
For purposes of this survey, the dairy case is the refrigerated case where fluid milk, butter, sour cream, yogurt and other 1tams such as yeast and pickled herring are displayed. (Cheese may be located in this case or displayed elsewhere).
A. What type of dairy case is this? ••••••••••••••••.•••• 15. conventional
16. upright w/doors
B. Can the top of this case be used to display ..•.•.••.• 17. yes materials? 18. no
C. Check the pieces displayed ....••.•••.•.•••••.•.••••••
D. How high is the milk mobile hung above the floor? •.•. (Use your own height to help determine this)
E. Where is the milk mobile hung? ••••••••.•.••••••••••••
F. How high is the butter mobile hung above the floor? ••
G. Where is the butter mobile hung? •••••••••••••••••••••
H. Are the case banners attached with magnets? ...••..•••
19.
20.
21.
22.
23.
24.
25.
26.
27.
28.
29.
30.
31
32.
33.
34.
35.
36.
37.
38.
39.
40.
milk mobile
butter mobile
"calcium" rail strip
"teeth" rail strip
flbones" rail strip
milk wag tag
butter wag tag
cottage cheese wag tag
milk case banner
butter case banner
under 7 ft.
7-10 ft.
over 10 ft.
over the case
over the aisle
under 7 ft.
7-10 ft.
over 10 ft.
over the case
over the aisle
yes
no

____________
____________
____________
____________
29
I. Are the top of the case banners displayed close to .•••••••••••• the proper products?
~. Are the case banners folded to achieve a three-dimensional ••••. effect?
~. Are the rail strips displayed in the milk section? ••••••••••.••
IL. Are the wag tags displayed over or under the appropriate •.••.•• products?
~. Is the general appearance of the point of purchase ..••.•••••••• material clean and attractive?
~. Does the ADA point of purchase material enhance the ••.•••.••••. dairy case decor?
O. Is other point of purchase material (such as shelf talkers .•••• or price tags) present?
HOUSEKEEPI~G AND STOCKING
A. Do you consider this dairy case to be neat? .••••.••..•••••..•••
B. Is the shelf under the milk as clean as you would •.•••••..•.••. keep your kitchen?
C. Is there any evidence of leaking milk containers? •.••••••.•.•••
D. Can you read the product pull dates on half gallon •••.••••••••• cartons of milk?
E. What pull dates do you see on the following private brand products?
whole milk, 1/2 gal. 63.
64.
lowfat milk, 1/2 gao 65. ____________
66. ____________
buttermilk, quart 67. only 68.
41.
42.
43.
44.
45.
46.
47.
48.
49.
50.
51.
52.
53.
54.
yes
no
yes
no
yes
no
yes
no
yes
no
yes
uo
yes
no
55. yes
56. no
57. yes
58. no
59. yes
60. no
61- yes
62. no
earliest
latest
earliest
latest
earliest
latest

30
F. Is the grating at the front of the bottom shelf dirty? 69. yes (dirty- dried milk or food, dust and other UFO's) 70. no
71. NA, no grating
G. Are there any exposed wires on the front edge of the ...•..•. 72. yes dairy case near the floor? 73. no
H. Are there any torn metal edges on the dairy case that .••.•.• 74. yes might injure someone? 75. no
I. Are there dividers between the layers of dairy products? .••. 76. yes
77. no
J. If there are dividers between layers of dairy products •..•.. 78. yes are there holes to allow air circulation?
79. no
80. NA, no dividers
K. If there are doors at the front of the case are they ......•• 81. yes closed?
82. no
83. NA, no doors
L. If there are doors or curtains behind the shelves, are ••.••• 84. yes they closed?
85. no
86. NA, no doors
M. Is imitation white "milk" present in the dairy case? .••••••• 87. yes
88. no
N. Is (imitation) chocolate "milk" present in the dairy case? •• 89. yes
90. no
O. Is beer or wine located in the dairy case between the •••••.• 91. yes milk and the eggs? 92. no
P. Is beer or wine in a refrigerated case adjacent .••.••..••.•. 93. yes to the dairy case? 94. no
Q. Has shelving been set at staggered 95. yes, various heights heights in the dairy case to break up
96. little variety in ht.horizontal lines? 97. no, all horizontal

31
R. Are products organized or departmentalized by product ••••.••. 98. yes, by (rather than brand) in the dairy case? product
99. no, by brand
S. Has vertical display been used? ••••••••••••.•••••.••••••••.• 100. yes (milk/cream. cottage cheese/yogurt, butter/margarine 101. nostocked top to bottom in case)
T. Are high volume items like eggs and milk placed at .•••.••••• 102. yes opposite ends of the dairy case? 103. no
U. Within the outline given below, indicate briefly the placement of onlv the following products: milk, butter/margarine, eggs, biscuits and and juice and if cheese, wine or beer is placed here add them also.
V. Check the status of the shelf space for the following products. (Adequate means 80-100% full and overstocked means product sitting on the grating or in the aisle.)
Empty Low Adequate Overstocked
!
l.Jhole milk 104. 105. 106. 107.
Lowfat milk 108. 109. 110. 111.
Yogurt 112. 113. 114. 115.
Cottage Cheese 116. 117. 118. 119. i
Sour Cream 120. 121. 122. 123.
Cream 124. 125. 126. 127.
Butter
!
128. 129. 130. 131.

32
W. If you can see a temperature gaQge at of the dairy case, what does it read. gauges, give the reading for each.
the top or sides ••.••• If there are several
132.
133.
134.
13S.
136. no ~s visible
X. Looking at only the dairy case, frOlll it?
would you buy products •••••• 137.
138.
yes
no
III. Cheese Display
The cheese display is any refrigerated area containing process, natural and imitation cheeses. (doesn't include cottage cheese)
A. Check the places where cheese is displayed in .••••• this supermarket.
139.
140.
cheese case
meat counter
14L deli
142.
143.
144.
dairy case
cheese/wine boutique
other
B. Check the pieces displayed ..•..••...••••••.••...•••. 14S. cheese mobile
146. cheese wag tag
147. cheese case banner
C. How high is the cheese mobile hung above the •....••• 148. under 7 ft. floor? 149. 7-10 ft.
ISO. over 10 ft.
D. Where is the cheese mobile hung? ••.••.•••••.•••.•.•• 151. over the case
lS2. over the aisle
E. Is the general appearance of the point of purchase •• lS3. yes material clean and attractive?
lS4. no
F. Is there other point of purchase material present? .••.•••••. 156. yes
157. no

33
G. Is the cheese display area clean? ..•••••••••••••••••• 158.
159.
H. Are there any expanded and/or moldy packages of •••••.• 160. cheese? (check Swiss cheese particularly) __ 161.
I. Are there any imitation cheese products in the ..•.••• 162. cheese case. (ie. Kraft's Golden Image, Fisher 163.Cheese Co.'s Count-Down or Cheezo1a, or imitation !Ilozzarella)
J. Check the status of display space for cheese •...••••• 164. (Adequate !Ileans 80-100% full and overstocked !Ileans 165.product sitting on the grating or in the aisle.)
166.
167.
The ice cream case is the area in the frozen food section where ice cream and frozen novelties (ice cream sandwiches, ice cream sticks, etc.) are displayed.
yes
no
yes
no
yes
no
eIIlpty
low
adequate
overstocked
A. Is the ice cream mobile displayed? .•••••••.•.••••.•••
B. How high is the mobile hung above the floor? ••.••••••
C. Where is the mobile hung? .•••.••.•.••••••••••••••••••
D. Is the general appearance of the mobile clean and ..•• attractive?
168. yes
169. no
170. under 7 ft.
171. 7-10 ft.
172. over 10 ft.
173. over the case
174. over the aisl
175. yes
176. no
E. Is other point of purchase material present? ••••••••. 177.
178.
yes
no
F. What type of ice cream freezer is this? •.•••••.•.•••• 179.
180.
coffin style
upright "/doors
HOUSEKEEPING AND STOCKING
A. Is the ice cream case neat? •..••••..•••••••••.•.••••• 181.
182.
yes
no
B. Is the shelf under the ice cream clean? .•••..•••.•.•• 183.
184.
yes
no

34
C. Is ice cream stocked over the loadline in the case? ••• 185. yes
186. no
D. Check the outside of more than one brand of ice ••.•••• 187. yes cream, do the containers show ice crystals the texture 188. noof granulated sugar or leaking ice cream indicating that the product has been refrozen?
E. Check the status of the case for the following products.
empty low adequate overstocked
189. 192.1190'1191. lvanilla ice cream I IFrozen novelties 193. \194. \195. 1196 .
F. If you can see a temperature gauge case what does it read?
in the ice cream ••• 197.
198.
199.
200.
201. _____ no gauge visible
G. Looking at only the products from it?
ice cream case, would you buy •.•.• 202.
203.
yes
no
V. GENERAL HOUSEKEEPING
A. On the baSis of cleanliness and appeal to you as a •••• 204. yes consumer, if this store were you shop here?
convenient for you, would 205. no


