Dr Lindiwe Mvusi
14 April 2016
MANAGING AND MONITORING THE TB
PROGRAMME

Outline
• Burden of disease of TB globally
• Progress towards MDG targets
• Burden of disease of TB globally
• Monitoring and evaluation of the programme
• Conclusion
2

Global TB Burden : 2014
3
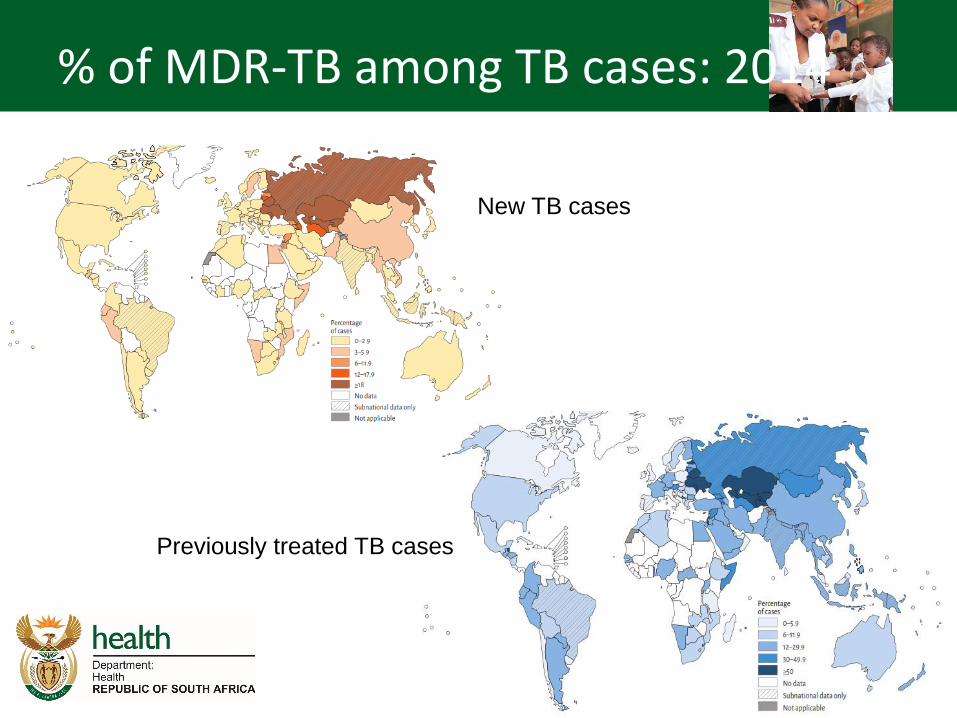
% of MDR-TB among TB cases: 2014
4
New TB cases
Previously treated TB cases

XDR-TB patients on treatment: 2014
5

South African Situation
6

TB Burden by province: 2008-2014
7
0
20000
40000
60000
80000
100000
120000
140000
EC FS GP KZN LP MP NW NC WC
2008
2009
2010
2011
2012
2013
2014

TB Case notification rates by district: 2014 (per 100 000)
8

Rifampicin Resistant TB by District 2014 (% of Xpert Dx)
9

TB and HIV Co-infection rates by gender and age: 2009 - 2014
10

Improved TB Treatment Outcomes Year TB case
notification Successful
treatment rate Cure rate Defaulter Rate
2000 151 239 63 54 13
2001 188 695 61 50 11
2002 224 420 63 50 12
2003 255 422 63 51 11
2004 279 260 66 51 10
2005 302 467 71 58 10
2006 341 165 73 62 9
2007 336 328 71 63 8
2008 340 559 71 69 8
2009 406 082 74 67 8
2010 401 048 79 71 7
2011 389 974 79 74 6
2012 349 582 81 76 6
2013 328 896 82 77 6
2014 - - - - 11

Data Collection tools
Dis
tric
t H
ealt
h In
form
atio
n S
yste
m
(D
HIS
)
Data entry
into
computer
system
All the fields
in the TB
register
entered
Facility data
collated for
the sub-
district
Beyond this
point only
aggregated
data
transmitted
upwards

Complete GW20/12 & GW20/15
Transfer data to TB Register
Submit TB Register forms to ‘sub-district
Pink; Yellow; Green As soon as forms are completed and validated
– at least on a monthly basis (1st week of the month)
Case Identification Register (GW20/13)
Laboratory Request form
Laboratory Results
Data validation
Analysis/Interpretation/Action
(Facility Case Load Forms)
- PHC/Facility
Supervisor
- TB Coordinator
(CDC/HAST)
Co
nfirm
ed
TB
Submit Summary of Case Identification &
Follow-up Register 1st week of the month
To the Sub-district Information Officer
FA
CIL
ITY
LE
VEL

Capture data into etr.net and
update reporting rate tracking form
Validate data during
Data Capturing
Submit DISPATCH ETR.Net File to next level
Submit DHIS Export and NMD Export files to DIO
Run Data Checks Validate, identify problems and take action
RUN and ANALYSE Reports (Case Finding; Smear Conversion,
Treatment Outcomes;
Facility Summary Report and Detailed Facility Reports)
Record received Register Forms
on the Reporting Rate Tracking form
Give FEEDBACK to All levels (Back to Facilities, Horizontal – to Managers; Vertical to higher levels)
ACTION Identification of Challenges/Planned Actions
Data
Capturer
Data
Capturer
- TB
Coordinator
- - Sub-District
information
Officer
TB Coordinator
Update incompleteness and
incorrect data from Facilities
TB Coordinator,
Data Capturer & Facility TB Nurse
TB Coordinator
- TB
Coordinator
- - Sub-District
information
Officer
DA
TA
EN
TR
Y L
EV
EL

15
Submit DISPATCH ETR.Net File to next level
Receive Dispatch file from Sub-district level
RUN and ANALYSE Reports (Case Finding; Smear Conversion,
Treatment Outcomes; Facility Summary Report and Detailed Facility Reports)
Give FEEDBACK to All levels
(Back to Facilities, Horizontal – to Managers; Vertical to higher levels)
ACTION Identification of Challenges/ Planned Actions
- TB
Coordinator
- - Information
Manager
TB Coordinator
TB Coordinator
TB Coordinator
DIS
TRIC
T/ P
RO
VIN
CIA
L LE
VELS
TB Coordinator

Standard Operational Procedures for TB Surveillance
A Practical guide for Sub-district TB Managers (Facility-focus)
Facilities should be visited AND SUPERVISED on a monthly basis where possible -
but at least once a quarter
At each facility
check the Suspect Register; Blue
cards; Green cards and Patient
Treatment Register for completeness:
Before tear out papers from
TB Treatment Register for
next level:
CASE FINDING:
Check Pink sheets for:
• Completeness
• Correctness
• Sequence of Pt registration
numbers
• Correct Registration of Pt -
Newly Registered versus
Moved-In
• Correct Treatment Start
date
SMEAR CONVERSION:
Check Yellow sheets for;
• 2-month and 3-month
follow-up sputums
• dates and results
• Cultures – if a patient was
till positive at end of 2/3-
months
• If patients already
• ‘Transferred-Out’;
• ‘Moved-Out’;
• Died or
• Defaulted, that it has
been recorded – as
well as the last known
date that the patient
had treatment
TREATMENT OUTCOME:
Check green sheet:
• Follow-up sputa – for
initial ‘NewSm+ve’
PTB patients
• at end of intensive
phase
• as well as end of
treatment
• Ensure that all patients
have an outcome and end-
of-treatment date
• For “New” TB patients that
completed treatment
• after 6-months
• For re-treatment patients
that completed treatment
• after 8-months
Facility Case Load Forms
• What is the facility staff’s
knowledge about the number
of TB cases that they treat per
quarter?
• Do they know what their
Smear Conversion rate is?
• Do they know how many
patients interrupted treatment,
and were traced?
• Do they know what their
Defaulter rate is?
Data Analysis:
1. Case Finding: - Look at trends:
• Increase; decrease or
constant number of patients
• Bacteriological Coverage
• New versus Re-treatment
cases
• TB in Children
2. Smear Conversion
• Smear conversion for
• New Smear Positive
cases - @ 2-months
• Re-treatment Smear
Positive cases - @ 3-
months
• Trends: Does it improve or not
– Investigate reasons
• Smear Positivity rate
3. Treatment Outcomes
• What is their Cure rate?
• What is their ‘Treatment
completion rate’
• If High, why?
• What is their Defaulter rate
• Are there patients that do not
have outcomes?
1
2
3
DATA FLOW:
After data has been validated at
the facility level,
• forms are sent to the sub-
district office
• For data entry (into
ETR.Net)
• Data validation
• Data analysis
• Feedback & Action
• The electronic data are then
dispatched to the next level,
District and/or Provincial
• Provinces then dispatch to
National
Critical Factors
• Clear measurable indicators
• Simple data collection tools
• Continuous quality improvement
• Data management
• Impact measurement
– Drug resistant surveys
– Prevalence surveys
17

Challenges
• Poor quality of data
• Incomplete and late reporting
• Data analysis not done at facility level
• Data not used for planning
• Lack of data capturers at facility level
• Too many registers for completion
18

Conclusion
We know what to do – “basics right”,
Prevent, find, treat until cure
We know who the target populations are, have the tools though not the ideal.
Measure the progress towards the 2035 targets
19

THANK YOU
20


