Download - Manildra Group

Manildra Group
Air Quality Assessment
Mod 17, 2019
December 2019

GHD | Report for Manildra Group - Air Quality Assessment, 2127188 | i
Table of contents
1. Introduction..................................................................................................................................... 1
1.1 Introduction .......................................................................................................................... 1
1.2 Background .......................................................................................................................... 1
1.3 Current proposal: Modification 17 ........................................................................................ 3
1.4 Scope ................................................................................................................................... 3
1.5 Assumptions ........................................................................................................................ 4
1.6 Report structure ................................................................................................................... 4
1.7 Limitations ............................................................................................................................ 5
2. Site location and context ................................................................................................................ 2
2.1 Site description .................................................................................................................... 2
3. Operation description ..................................................................................................................... 6
3.1 General overview ................................................................................................................. 6
3.2 Flour mill .............................................................................................................................. 6
3.3 Starch plant .......................................................................................................................... 6
3.4 Glucose plant ....................................................................................................................... 7
3.5 Ethanol and distillation plants .............................................................................................. 7
3.6 DDG plant ............................................................................................................................ 7
3.7 Steam production ................................................................................................................. 8
3.8 Environmental farm .............................................................................................................. 8
3.9 Packing plant (proposed) ..................................................................................................... 8
3.10 Other activities ..................................................................................................................... 8
3.11 Proposed modifications...................................................................................................... 10
4. Criteria for assessment ................................................................................................................ 12
4.1 Odour ................................................................................................................................. 12
4.2 Other air quality impacts .................................................................................................... 14
5. Meteorological data ...................................................................................................................... 16
6. Background air quality .................................................................................................................. 18
7. Odour assessment ....................................................................................................................... 20
7.1 Emissions inventory ........................................................................................................... 20
7.2 Dispersion modelling.......................................................................................................... 26
7.3 Predicted odour impacts .................................................................................................... 26
8. Air quality assessment ................................................................................................................. 29
8.1 Emissions inventory ........................................................................................................... 29
8.2 Dispersion modelling.......................................................................................................... 35
8.3 Predicted air quality impacts .............................................................................................. 35
9. Conclusions .................................................................................................................................. 49
10. References ................................................................................................................................... 50

GHD | Report for Manildra Group - Air Quality Assessment, 2127188 | ii
Table index
Table 1-1 Summary of recent proposed modifications on site (2015-2017) ........................................ 2
Table 2-1 Location of identified sensitive receptors ............................................................................. 3
Table 4-1 Odour criterion for the assessment of odour ..................................................................... 13
Table 4-2 Air quality impact assessment criteria - other pollutants ................................................... 14
Table 6-1 Background Air Quality Data – Albion Park South (2016) ................................................. 18
Table 6-2 Review of particulate monitoring at Albion Park South and Wollongong, g/m3 ............... 19
Table 7-1 Comparison of odour emissions from previous mods to current mod ............................... 22
Table 7-2 Predicted peak (99th percentile, short term averaged) odour impact at nearby
receptors ............................................................................................................................ 27
Table 8-1 Boiler 2: Measured operating with 100% woodchip and 100% coal .................................. 30
Table 8-2 Emission inventory – Particulate matter ............................................................................ 31
Table 8-3 Emission inventory – Products of combustion ................................................................... 32
Table 8-4 Maximum predicted incremental ground level PM10, PM2.5 and TSP
concentrations .................................................................................................................... 35
Table 8-5 Summary of highest measured and predicted PM10 levels, µg/m3 (R1) ............................ 37
Table 8-6 Summary of highest measured and predicted PM2.5 levels, µg/m3 (R1) ........................... 37
Table 8-7 Summary of highest measured and predicted PM10 levels, µg/m3 (C1) ............................ 38
Table 8-8 Summary of highest measured and predicted PM2.5 levels, µg/m3 (C1) ........................... 38
Table 8-9 Maximum predicted ground level Sulfur Dioxide concentrations ....................................... 43
Table 8-10 Maximum predicted ground level Nitrogen Dioxide concentrations .................................. 43
Table 8-11 Maximum predicted ground level Carbon Monoxide concentrations ................................. 44
Table 8-12 Maximum predicted ground level Hydrogen Fluoride concentrations ............................... 44
Table 8-13 Maximum predicted ground level Hydrogen Chloride concentrations ............................... 45
Table 8-14 Maximum predicted ground level PAH, VOC and metals concentrations ......................... 48
Figure index
Figure 1 Proposed modification 17 changes (Source: Manildra) ....................................................... 1
Figure 2 Site location and layout ........................................................................................................ 4
Figure 3 Site context .......................................................................................................................... 5
Figure 4 Site layout and major odour sources ................................................................................. 11
Figure 5 Extract from NSW Approved Methods ............................................................................... 13
Figure 6 CALMET wind rose for the factory ..................................................................................... 17

GHD | Report for Manildra Group - Air Quality Assessment, 2127188 | iii
Figure 7 Odour impacts, 99th percentile, short term averaged – Modification 17 ........................... 28
Figure 8 Maximum Predicted Incremental Ground Level PM10 Concentrations (24-hour
Average) ............................................................................................................................ 39
Figure 9 Maximum Predicted Cumulative Ground Level PM10 Concentrations (24-hour
Average) ............................................................................................................................ 40
Figure 10 Maximum Predicted Cumulative Ground Level PM2.5 Concentrations (24-hour
Average) ............................................................................................................................ 41
Figure 11 Maximum Predicted Cumulative Ground Level SO2 Concentrations (1 hour
Average) ............................................................................................................................ 46
Appendices
Appendix A – Meteorological analysis
Appendix B – Complete odour emission inventory

GHD | Report for Manildra Group - Air Quality Assessment, 2127188 | 1
1. Introduction
1.1 Introduction
GHD was engaged by Shoalhaven Starches Pty Ltd (Manildra) to conduct an air quality impact
assessment for a proposed modification to the approved Shoalhaven Starches Expansion
Project (SSEP) (Modification 17). The existing Shoalhaven Starches factory is located at Bolong
Road in Bomaderry, New South Wales.
This report describes the background and scope of the proposed modifications, the pollutant
inventory for odorous and non-odorous emission sources and the predicted air quality impacts
at identified sensitive receptors.
1.2 Background
Flour and grains are processed at the factory to produce ethanol, starch, gluten, glucose and
distiller’s dried grain (DDG). Shoalhaven Starches is the holder of Environment Protection
Licence number 883 issued for the plant by the NSW EPA.
The Shoalhaven Starches Bomaderry plant currently produces around 225 million litres (ML) of
ethanol per year. On 28 January 2009 the (then) Minister for Planning issued Project Approval
MP 06_0228 for the Shoalhaven Starches Expansion Project. The Project Approval for the
SSEP enabled Shoalhaven Starches, subject to certain conditions, to increase ethanol
production in a staged manner at its Bomaderry Plant from the previous approved level of 126
million litres per year to 300 million litres per year. Following the Minister’s determ ination
Shoalhaven Starches have been implementing and commissioning works in accordance with
this approval. Work on the change in operations has been completed, coupled to quarterly
testing (independent audits) of emissions from licensed discharge points (a condition of the
Licence), with the purpose to validate the predicted impacts against the original predictions in
2008 for the ethanol expansion.
The increase in ethanol production associated with the SSEP Project Approval was made in
response to the NSW Government’s ethanol mandate which increased the mandated ethanol
content by volume in petrol in NSW from 2% to 6% in October 2011. The SSEP sought to
increase ethanol production capacity at the Shoalhaven Starches site to meet the expected
increase in demand for ethanol arising from this site. The increase in ethanol production
required upgrades to the Stillage Recovery Plant including six additional Dried Distillers Grains
Syrup (DDGS) dryers.
However, the anticipated increase in demand for ethanol has not occurred. In response,
Manildra have undertaken a series of modifications to the site with a focus on exploring
alternative options. These are summarised in Table 1-1.
Modifications 11, 12, 13 and 16 were assessed by GHD in the following documents:
Shoalhaven Starches expansion project – Modification 11 and 12 (Project approval MP_06_0228) Revised odour and air quality assessment (GHD 2017)
Shoalhaven Starches Mod 13 Air Quality Assessment Cumulative odour assessment (GHD
2017)
Shoalhaven Starches Mod 13 Air Quality Assessment Updated Cumulative Air Quality Assessment (GHD 2017).
Shoalhaven Starches Proposed modification application MP 06_0228 Shoalhaven Starches Expansion Project, Proposed new speciality processing facility, new gluten dryer and other

GHD | Report for Manildra Group - Air Quality Assessment, 2127188 | 2
associated works at 22, 24 and 171 Bolong Rd, Bomaderry, NSW (Mod 16) (GHD,
February 2019).
Modification 14 did not require an air quality assessment. Modification 15 was separately
assessed by GHD for SupaGas in 2017.
Table 1-1 Summary of recent proposed modifications on site (2015-2017)
Modification Summary of changes
Modification 11 Reducing the number of approved DDGS Dryers from six to four.
A minor modification to the footprint of the four DDG dryers.
Relocation of the cooling towers in the DDG Plant.
A Mill Feed Silo and structure to feed DDG dryers.
Expanded use of the existing coal and woodchip storage area within the
SS Environmental farm.
The addition of two biofilters to cope with the increased number of DDG
Dryers.
A forklift maintenance building adjacent to the relocated DDG dryers,
along with a container preparation area adjacent to the relocated DDG
Dryers.
Modification 12 Modifications to the existing Ethanol Distillery Plant to:
increase the proportion of ‘beverage” grade ethanol that is able to
be produced on the site. This modification will enable increased
flexibility in terms of the range of types of ethanol produced at the
site (i.e. between fuel, industrial and beverage grade ethanol) to
meet market demands; and
modify the type and location of the Water Balance Recovery
Evaporator that has been previously approved under MOD 2
adjacent to the Ethanol Plant.
Modification 13 Modification of boilers 2 and 4, with the conversion of boiler 4 from gas
fired to coal fired.
Installation of an additional baghouse on boiler 6.
Modification 14 Modifications to the former paper mill site.
Modification 15 Construction of the SupaGas CO2 plant at the former Dairy Farmers
factory site.
Modification 16 Installation of a third flour mill C within the existing flour mill B
building
Undertaking modifications to flour mills A and B
The construction of a new industrial building adjoining the Starch
Dryer No. 5 building containing:
– The new product dryer
– Plant and equipment associated with the processing of
specialised speciality products.

GHD | Report for Manildra Group - Air Quality Assessment, 2127188 | 3
Modification Summary of changes
Addition to Starch Dryer No 5 building to house a bag house for this
dryer
Conversion of two existing gluten dryers (1 and 2) to starch dryers
Additional sifter for the interim packing plant
Construction of a coal-fired co-generation plant to the south of the
existing boiler house complex. The co-generation plant will house a
new boiler (No. 8)
Construction of lime silos: The lime injection system will consist of
two storage silos and associated equipment for injecting powdered
lime into each of the coal fired boilers
Relocation of the existing boiler no. 7 to the northern side of the
overall boiler house complex
Construction of an indoor electrical substation on the northern side
of Bolong Road
Construction of an additional rail intake pit for the unloading of rail
wagons
Extension of the existing electrical substation located within the
main factory area.
1.3 Current proposal: Modification 17
Manildra continue to explore alternative markets for products used in the manufacture of
ethanol. In line with this, the following modifications are proposed to the site as part of the
current modification (Mod 17):
To modify the location of the baghouse for the No. 5 Starch Dryer. As part of this baghouse
relocation, an additional stack will be added to starch dryer 5 (shown in Figure 1)
Use of sawmilling residue (woodchips) for boiler fuel by blending woodchip with coal in
Boilers 2 & 4
To install a ‘services lift’ to the outside of the existing staircase adjacent to the No. 5
Starches Dryer Building to allow on-going access for personnel and customers to the floors
within the building
To modify the service conduit extending from the Shoalhaven Starches factory site on the
southern side of Bolong Road to the proposed Packing Plant on the northern side of Bolong
Road by elevating a section of the conduit above ground level.
Amendment to design specifications for silencers to exhaust fans for Flour Mill B.
This Air Quality Impact Assessment addresses those components of the Modification 17 that
have potential air quality impacts, namely the modification to the location of the approved
baghouse and the use of sawmill residue for boiler fuel.
1.4 Scope
The proposed changes (Mod 17) require an application to the EPA assessing the associated
off-site odour and air quality impacts.
In order to meet EPA NSW requirements, this report provides:

GHD | Report for Manildra Group - Air Quality Assessment, 2127188 | 4
A revised emissions inventory for odorous and non-odorous sources on site. A
comparative analysis of the emissions inventory has been undertaken with the last major
air quality assessments for the site (Mod 13 and Mod 16)
A level 2 air quality assessment of odour and air quality in accordance with the Approved Methods for the Modelling and Assessment of Air Pollutants in New South Wales (EPA
2016). Dispersion modelling was undertaken in CALPUFF v5
A comparison of predicted odour and air quality results against the EPA criteria and
against the previous modification results.
1.5 Assumptions
The major assumptions used in this assessment are as follows:
Stack emission testing reports from the past measurements are accurate and
representative of normal operations, and do not vary significantly
The odour dispersion modelling using the NSW EPA and US EPA approved regulatory
Gaussian puff dispersion model CALPUFF v5, which was considered appropriate for the
location. Limitations with the predicted odour are inherent within the model and in its
ability to handle multiple buildings and stacks in a complex setup, with wake effects
included. As such, the layout of the plant was simplified in order for the model to handle
the setup
Odour emissions from the major sources of odour were modelled as both variable
emission and fixed point, volume and area sources in CALPUFF with appropriate
dispersion characteristics
The site representative meteorological data was obtained from previous assessments of
the plant, which have been approved by EPA NSW in the past. The meteorological data
is discussed in Section 5
Small silos in the Packing Plant are conservatively assumed to be filled 24 hours a day
Odour sources with horizontal releases have conservatively been modelled with vertical
velocities of 0.1 m/s
The VOC concentration in the biofilter exhaust is not high enough to induce density flows
of the exhaust plume in ambient air
The emissions inventory, and therefore the dispersion modelling results, is largely based
on estimates and on data measured on site by Stephenson Environmental Management
Australia (SEMA). Actual measurements are dependent on site conditions at the time of
measurement and these conditions may change. GHD does not accept any responsibility
for updating the measurements or estimates made by SEMA.
1.6 Report structure
This report:
Describes the operations of the plant
Describes the site-representative meteorological and background air quality data
Describes the proposed modifications
Characterises odour sources at the plant, accounting for the required changes to the Mod
16 model setup

GHD | Report for Manildra Group - Air Quality Assessment, 2127188 | 5
Presents the results of odour dispersion modelling for the proposed (Mod 17) scenario
using CALPUFF
Characterises non-odour sources at the plant
Presents the results of air quality dispersion modelling for the proposed (Mod 17)
scenario using CALPUFF
Presents a summary of the results and draws conclusions as to the off-site impacts (both
odour and non-odour)
Outlines the limitations of the analyses and conclusions presented.
1.7 Limitations
This report: has been prepared by GHD for Manildra Group and may only be used and relied on by Manildra Group for the purpose agreed between GHD and the Manildra Group as set out in section 1.4 of this report.
GHD otherwise disclaims responsibility to any person other than Manildra Group arising in connection with this report. GHD also excludes implied warranties and conditions, to the extent legally permissible.
The services undertaken by GHD in connection with preparing this report were limited to those specifically detailed in the report and are subject to the scope limitations set out in the report.
The opinions, conclusions and any recommendations in this report are based on conditions encountered and information reviewed at the date of preparation of the report. GHD has no responsibility or obligation to update this report to account for events or changes occurring subsequent to the date that the report was prepared.
GHD has not been involved in the preparation of the planning submission and has had no contribution to, or review of the submission. GHD shall not be liable to any person for any error in, omission from, or false or misleading statement in, any other part of the submission.
The opinions, conclusions and any recommendations in this report are based on explicit assumptions made by GHD, described in section 1.5 and throughout the body of this document, and limitations of the modelling software CALPUFF. GHD disclaims liability arising from any of the assumptions being incorrect. GHD has prepared this report on the basis of information provided by Manildra Group and others who provided information to GHD (including Government authorities), which GHD has not independently verified or checked beyond the agreed scope of work. GHD does not accept liability in connection with such unverified information, including errors and omissions in the report which were caused by errors or omissions in that information.

GHD | Report for Manildra Group - Air Quality Assessment, 2127188 | 1
Figure 1 Proposed modification 17 changes to baghouse location (Source: Manildra)

GHD | Report for Manildra Group - Air Quality Assessment, 2127188 | 2
2. Site location and context
2.1 Site description
Figure 2 shows the location and layout of the Shoalhaven Starches plant in Bomaderry, New
South Wales. It is located between the Shoalhaven River and township of Bomaderry. The plant
comprises a factory, a proposed (but not yet constructed) packing plant and environmental farm.
The packing plant lies immediately to the north of the factory, while the environmental farm is
situated approximately 400 m to the east.
2.1.1 Nearby sensitive receptors
The Approved Methods define a sensitive receptor as “a location where people are likely to
work or reside; this may include a dwelling, school, hospital, office or public recreational area”.
The site is proximate to a number of sensitive receptors. The township of Bomaderry lies to the
northwest of the factory and west of the packing plant. Nowra is situated south of the plant.
Commercial and industrial sensitive receptors are located directly adjacent to the site and
across from it along Bolong Road.
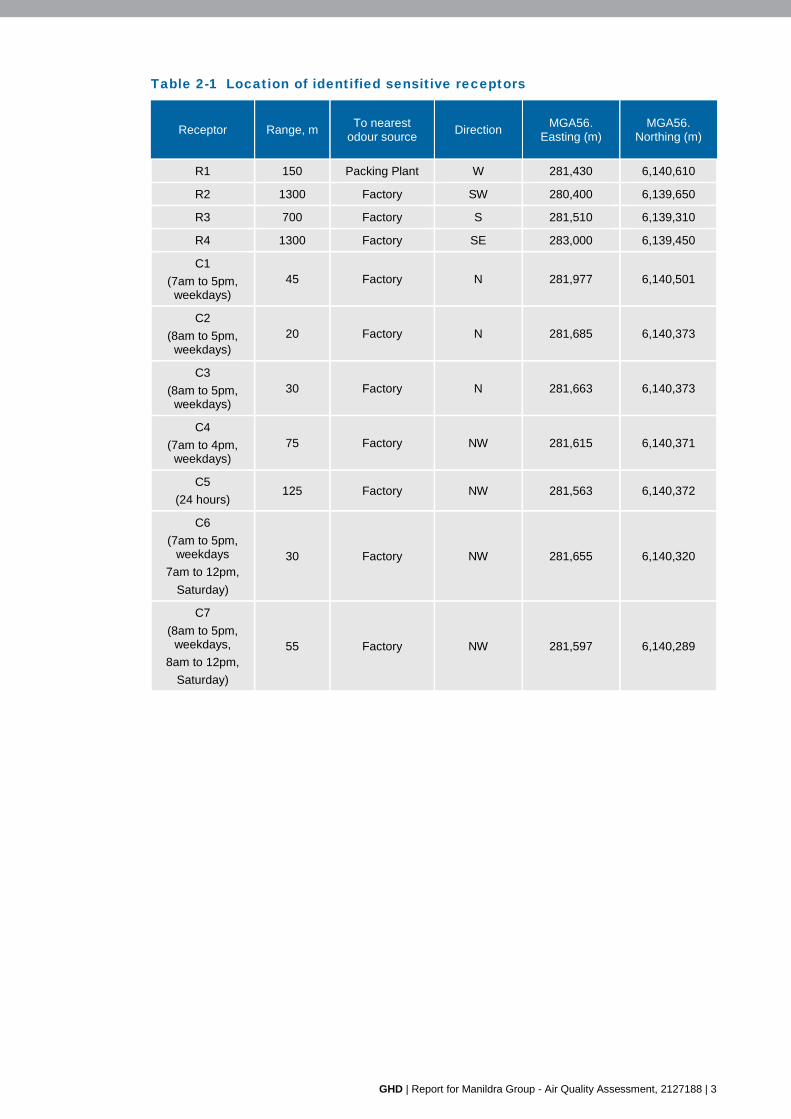
The nearest residential sensitive receptors are located between 150 to 1300 metres from the
site. The nearest commercial/industrial and residential sensitive receptors to the site have been
included in the modelling and are listed in Table 2-1, including the approximate distances and
orientation of each receptor from the site. The commercial/industrial receptors also include the
operating times in brackets.
The sensitive receptors are shown in Figure 3.
GHD | Report for Manildra Group - Air Quality Assessment, 2127188 | 3
Table 2-1 Location of identified sensitive receptors
Receptor Range, m To nearest
odour source Direction
MGA56. Easting (m)
MGA56. Northing (m)
R1 150 Packing Plant W 281,430 6,140,610
R2 1300 Factory SW 280,400 6,139,650
R3 700 Factory S 281,510 6,139,310
R4 1300 Factory SE 283,000 6,139,450
C1
(7am to 5pm, weekdays)
45 Factory N 281,977 6,140,501
C2
(8am to 5pm, weekdays)
20 Factory N 281,685 6,140,373
C3
(8am to 5pm, weekdays)
30 Factory N 281,663 6,140,373
C4
(7am to 4pm, weekdays)
75 Factory NW 281,615 6,140,371
C5
(24 hours) 125 Factory NW 281,563 6,140,372
C6
(7am to 5pm, weekdays
7am to 12pm,
Saturday)
30 Factory NW 281,655 6,140,320
C7
(8am to 5pm, weekdays,
8am to 12pm,
Saturday)
55 Factory NW 281,597 6,140,289

!(
!(
!(
!(
!(
!(!(!(!(
!(
!(
R1
C1
C2C3C4C5
C6
C7
BOLONG ROAD
© Department of Finance, Services & Innovation 2017
Figure 2
Job Number
Revision A
21-27188
G:\21\27188\GIS\Maps\Deliverables\21_27188_SiteLocation.mxd
Map Projection: Transverse Mercator
Horizontal Datum: GDA 1994
Grid: GDA 1994 MGA Zone 56
0 30 60 90 12015
Metres
LEGEND
o© 2018. Whilst every care has been taken to prepare this map, GHD (and DATA CUSTODIAN) make no representations or warranties about its accuracy, reliability, completeness or suitability for any particular purpose and cannot accept liability and responsibility of any kind
(whether in contract, tort or otherwise) for any expenses, losses, damages and/or costs (including indirect or consequential damage) which are or may be incurred by any party as a result of the map being inaccurate, incomplete or unsuitable in any way and for any reason.
Date 12 Dec 2018
Manildra Group Pty Ltd
Shoalhaven Starches
Site location and layout
Data source: Data Custodian, Data Set Name/Title, Version/Date. Created by:afoddy
180 Lonsdale Street Melbourne VIC 3000 Australia T 61 3 8687 8000 F 61 3 8687 8111 E [email protected] W www.ghd.com
Paper Size A4
DRAFT
!( Identified sensitive receptors
Shoalhaven Starches Factory
Packing plant (proposed)
To environmental farm

!(
!(
!(
!(
!(!(!(!(!(!(!(
SHOALHAVEN RIVER
BOMADERRY CREE K
TERARA
BOLONG
NORTH NOWRA
R1
R2
R3
R4
C1C2
C3C4
C5
C6C7
MOSS VALE ROAD
TERARA ROAD
ILLAROO ROAD
COMERONG ISLAND ROAD
BOLONG ROAD
PRINC
ES HI
GHWA
Y
© Department of Finance, Services & Innovation 2017
Figure 3
Job Number
Revision A
21-27188
G:\21\27188\GIS\Maps\Deliverables\21_27188_SiteContext.mxd
Map Projection: Transverse Mercator
Horizontal Datum: GDA 1994
Grid: GDA 1994 MGA Zone 56
0 280 560 840 1,120140
Metres
LEGEND
o© 2018. Whilst every care has been taken to prepare this map, GHD (and DATA CUSTODIAN) make no representations or warranties about its accuracy, reliability, completeness or suitability for any particular purpose and cannot accept liability and responsibility of any kind
(whether in contract, tort or otherwise) for any expenses, losses, damages and/or costs (including indirect or consequential damage) which are or may be incurred by any party as a result of the map being inaccurate, incomplete or unsuitable in any way and for any reason.
Date 12 Dec 2018
Manildra Group Pty Ltd
Shoalhaven Starches
Site context
Data source: Data Custodian, Data Set Name/Title, Version/Date. Created by:afoddy
180 Lonsdale Street Melbourne VIC 3000 Australia T 61 3 8687 8000 F 61 3 8687 8111 E [email protected] W www.ghd.com
Paper Size A4
DRAFT
!( Identified sensitive receptors
Shoalhaven Starches Factory
Packing plant (proposed)
Environmental farm boundary

GHD | Report for Manildra Group - Air Quality Assessment, 2127188 | 6
3. Operation description
3.1 General overview
Wheat flour and grains (wheat) are processed at the Shoalhaven Starches factory to produce
ethanol, starch, gluten and glucose. Solid wastes are treated to produce distiller’s dried grain
(DDG), with liquid wastes being transferred to the environmental farm waste water treatment
plant. Excess treated waste water is irrigated onto pasture. The main processing and materials
treatment areas at Shoalhaven Starches comprise the:
Flour mill
Starch plant
Glucose plant
Ethanol and distillation plants
DDG plant
Packing plant
Pellet Plant
Environmental farm.
A brief description of the production process associated (including emission control) with each
plant is given below. Figure 4 shows the layout of the plant in terms of its operational areas,
along with the major odour sources of the plant, accounting for around 80% of total odour
emissions (excluding the environmental farm).
3.2 Flour mill
Shoalhaven Starches commenced full operations at the flour mill in June 2011. The flour mill
was originally approved by NSW Department of Planning and Environment in 2007 and was
consolidated into the ethanol expansion project approval in 2008.
Proposed modifications to the flour mill were approved in March 2016, which enabled an
increase in the total flour production capacity on the site from the previously approved limit of
265,000 tonnes per annum to 400,000 tonnes per annum.
The flour is used in the plant to produce starch, gluten, glucose and ethanol. All remaining mill
feed and pollard (flour sieving rejects) is processed through the DDG dryers for sale as stock
feed. Flours from the various grinding operations are collected and blended together before
passing through final treatment and weighing operations to bulk storage bins. Flour is taken
from these bins for use in existing site production processes.
All air extracted from the mill is passed through Buhler Airjet bag houses prior to being
discharged to the atmosphere vertically via four individual stacks. Approval has previously been
obtained for the installation of additional plant to increase production, along with two additional
exhausts from the roof of the building.
3.3 Starch plant
Within the starch plant, flour is processed to separate the starch from gluten (the protein
component of flour). The starch is graded, dried and packed for shipment. Different grades of
starch are manufactured for food and paper making applications. Starch that is not used for
these applications is used as a raw material for the ethanol plant. Gluten is dried and sold for
use in the food industry.

GHD | Report for Manildra Group - Air Quality Assessment, 2127188 | 7
Aqueous (water-based) wastes are reused within the plant or are transferred to the
environmental farm waste water treatment plant.
Starch Dryer No.5 has been constructed and is currently operational (see Figure 4). No change
to the production volume is predicted.
3.4 Glucose plant
The glucose plant (contained within the starch plant area) houses two lines; the ‘confectioners’
glucose line and the ‘brewers’ glucose line. Confectioner’s glucose is distinguished by having
been demineralised to remove latent odours and flavours that might be carried through to the
final product by the glucose.
Both processes use starch as the raw material. The starch is broken down to its constituent
glucose molecules using enzymatic and hydrolytic processes. Water is removed from the
resulting solutions using evaporation to produce glucose and brewer’s solutions of desired
concentration. The glucose product is shipped to customers in bulk containers.
The glucose manufacturing process generates aqueous wastes, mostly condensate from the
evaporators, which is reused during regeneration of the ion exchangers.
3.5 Ethanol and distillation plants
Waste starch from the starch plant is transferred to the ethanol plant and fermented to produce
ethanol. Starch (described in section 3.3), which is in suspension, is heated in jet cookers
before being fermented.
Fermentation is carried out in fermentation vessels using the treated substrate to which an
ethanol-producing yeast inoculum has been added. The yeast inoculum is generated using
yeast propagator vessels, these being seeded using commercial strains of yeast.
Wastes from the fermenters are transferred to the DDG plant (refer to section 3.2) for
processing. Fermentation liquor from the ethanol plant is transferred to the distillation plant
where water and other impurities are removed to produce various grades of ethanol.
3.6 DDG plant
Wastes from the ethanol and distillation plant are dewatered in decanter centrifuges and dried in
steam dryers to produce granular DDG. Light phase from the DDG decanters is evaporated to
recover soluble protein (syrup) and produce clear condensate (liquid line). The syrup is added to
the dryer feed for recovery of the solids (solids line). DDG granular product is transferred to the
DDG Pellet Plant for pelletising; the DDG pellets are stored in silos. Some of the granular DDG
product is stored in a storage shed until it is loaded into trucks in the DDG load-out area.
Exhaust gases from the existing DDG dryers (three) are transferred to the boiler air intake in
order to destroy odorous components of the gases by combustion.

GHD | Report for Manildra Group - Air Quality Assessment, 2127188 | 8
3.7 Steam production
Steam is generated at Shoalhaven Starches by using a combination of three gas fired boilers
(numbers 1, 3 and 7) and four coal fired boilers (numbers 2, 4, 5 and 6). The combustion gases
from these boilers are discharged via stacks, with boilers 5 and 6 having a combined stack.
Exhaust from boilers 2 and 4 is treated in a cyclone and baghouse prior to discharge to
atmosphere. Exhaust from boilers 5 and 6 is treated in a baghouse prior to discharge to
atmosphere.
The number of boilers operational at any given time depends on the operational and
maintenance requirements of the plant. With boiler 8 installed and coal-fired boilers operating at
full capacity, only one gas-fired boiler will be operational with the other two gas-fired boilers on
standby. When coal-fired boilers are not at full capacity or offline for maintenance, steam
requirements are met from the natural gas boilers.
3.8 Environmental farm
A number of wastewater streams are produced at the factory. These consist of five clear
condensate streams (distillation plant condensate, evaporator condensate, DDG condensate, a
small flow from the carbon dioxide plant and boiler blowdown) and a combined ‘dirty’ stream
from the factory processes. The ‘dirty’ wastewater streams are combined in the farm tank
(located at the factory) and pumped to the waste water treatment plant. Treated water is
pumped back to the factory for re-use, while excess treated water is stored in dams for irrigation
on the farm.
3.9 Packing plant (proposed)
It is proposed that dried gluten/starch will be pneumatically transferred from the existing site to
the proposed new packing plant via underground pipes. This dried material is proposed to be
stored in silos.
At present, the approved packing plant has not been constructed at the Shoalhaven Starches
sites. The proposed packing plant was assessed by SEMA in 2015.
The packing plant will consist of seven silos that will store either gluten or starch product. The
medium and large silos are to be filled 24 hours a day, seven days a week, while the small silos
can be filled at any time of the day for eight hours.
3.10 Other activities
3.10.1 Product load-out areas
Starch, glucose and ethanol products are loaded into road tankers from bulk storage silos and
tanks. Load out of starch and glucose does not have the potential to generate odours, as these
products have a low inherent odour characteristic.
Given the flammable nature of ethanol, the load out process is strictly controlled for
occupational health and safety purposes. These controls have the secondary effects of
minimising the potential for vapour generation and spillage.
3.10.2 Cooling towers
Cooling towers operate as part of the cooling water circuit for the ethanol glucose and DDG
plants. The recirculated cooling water has the potential to absorb odours and to disperse the
odours to atmosphere during the evaporative cooling (aeration) process within the cooling
towers. In addition, contamination of the cooling water by-product, process intermediates or
wastes can introduce odorous materials direct to the cooling water, which can greatly increase

GHD | Report for Manildra Group - Air Quality Assessment, 2127188 | 9
its odour generating potential. The aeration process readily strips the more volatile (and
potentially odorous) compounds from the water, providing a high-volume potential source of
odour that is released direct to atmosphere.
3.10.3 Biofilters
Exhaust air from odorous sources at the DDG plant is captured and ducted to two existing
soilbed biofilters, each having a surface area of 110 m2, located at the southwest corner of the
factory (on the southern margin of the container storage area – placed to the left lower margin in
Figure 4). The biofilters comprise a bed of organic bark and compost material (the matrix), with
distribution of the odorous airstream through the floor of the biofilter via a manifold. Biological
oxidation of odorous compounds takes place as the foul air percolates upward through the
matrix. The oxidation is achieved by a population of microorganisms in the bed.
While the efficiency of biofilters destroying odorous components of the waste air varies
according to a range of factors including soil moisture, composition and temperature, it is very
high. Any odour in the exhaust air from the biofilter is due to the inherent odour of the matrix
materials and typically has an ‘earthy’ characteristic. The odour level of the matrix is typically in
the range of 250 to 500 OU, and it is this ‘background’ level that limits the efficiency of a soilbed
biofilter.
The two biofilters at the site operate in parallel and are sized so that one biofilter can be taken
offline during periodic replacement of the matrix of the sister filter.
As such, a soilbed biofilter operating as designed, with no malfunctions, will not vary
significantly in its odour emissions; it will emit at the matrix background level independent of
fluctuations in the input odour loading.

GHD | Report for Manildra Group - Air Quality Assessment, 2127188 | 10
3.11 Proposed modifications
3.11.1 Mod 11, 12 and 13
Modifications 11, 12 and 13 focused on changing the configuration of the DDG plant (to the
southwest of the factory), changes to the ethanol distillery and modification to boilers 2 and 4.
These modifications have been discussed in Section 1.3. The resulting air quality impacts have
been addressed in GHD’s previous quality assessments (GHD 2017).
Mod 16 focused on changing the configuration of the flour mill exhausts, conversion of gluten
dryers 1 and 2 to starch, change to boiler 7’s location, a new gluten dryer (no. 8) and a new
coal-fired boiler (boiler 8). The resulting air quality impacts from Mod 16 have been addressed in
GHD’s previous air quality assessment (GHD, February 2019).
3.11.2 Mod 17
Modification 17 is discussed in Section 1.3. The main changes affecting odour and air quality
impacts consist of:
Modifications to the location of the baghouse for starch dryer 5
Installation of an additional stack to starch dryer 5
Use of sawmilling residue (woodchips) for boiler fuel by blending woodchip with coal in
Boilers 2 & 4
Further discussion of these changes in the context of the dispersion modelling is presented in
Section 7.

!(
!(
!(
!(
!(
!(!(
!(!(!(
!(!(
!(
!(
!(!(
!(
!(
!(
!(!(
!( !(!(
!(!(!(!(
!(
!(!(
!(!(
!(
!(!(!(
!(
!( !(
!(!(!(
!(
!(
!(!(
!(!(
!(
!(
!(
!(!(!(!(!(
!(
!( !(!(!(
!(
!(BOLONG ROAD
PPES
ERESCFERM
SD5
GD6
S18
S19
S02
S04S01S05S03
GD7
BOILR5
YP45GRT
VCD
DDG19
DDG46
D6
D2
E13
E10 E22
A4A5
A7
C4
C18
C1S07
S08
S06S13A
S13B
S12
S20
FMP1
FMP2
SSTE7
B7
BOILR4
SDR5FMBC
FMBE
PMFS
FMC2
NGD
CWV
Figure 4
Job Number
Revision A
21-27188
G:\21\27188\GIS\Maps\Deliverables\21_27188_SiteLayout.mxd
Map Projection: Transverse Mercator
Horizontal Datum: GDA 1994
Grid: GDA 1994 MGA Zone 56
0 10 20 30 405
Metres
LEGEND
o© 2018. Whilst every care has been taken to prepare this map, GHD (and DATA CUSTODIAN) make no representations or warranties about its accuracy, reliability, completeness or suitability for any particular purpose and cannot accept liability and responsibility of any kind
(whether in contract, tort or otherwise) for any expenses, losses, damages and/or costs (including indirect or consequential damage) which are or may be incurred by any party as a result of the map being inaccurate, incomplete or unsuitable in any way and for any reason.
Date 18 May 2018
Manildra Group Pty Ltd
Shoalhaven Starches
Site layout andmajor odour sources
Data source: Data Custodian, Data Set Name/Title, Version/Date. Created by:afoddy
180 Lonsdale Street Melbourne VIC 3000 Australia T 61 3 8687 8000 F 61 3 8687 8111 E [email protected] W www.ghd.com
Paper Size A4
DRAFT
!( Odour sources
Shoalhaven Starches Factory
Packing plant (proposed)
Environmental farm boundary
Boiler house
DDG Plant
Ethanol recovery and storage area
Fermenters
Flour Mill
Starch plant

GHD | Report for Manildra Group - Air Quality Assessment, 2127188 | 12
4. Criteria for assessment
4.1 Odour
4.1.1 Odour Concentration
Odour 'strength' or concentration is measured in odour units (OU), where 1 OU represents the
concentration of a sample that can just be detected by 50% of people in a controlled situation
where there is no background ‘ambient ‘ odour.
4.1.2 Measurement of Odour
The most common method of measuring odour concentration is Dynamic Olfactometry using the
‘forced choice’ method. Dynamic olfactometry simply dilutes the odour sample in known ratios
with odour free air. At each dilution, the diluted odour and a zero odour is presented in turn to
six panellists via two ‘sniffing’ ports. Further, the selection of the port with the diluted odour
sample is randomly reassigned at each presentation. Each panellist is required (forced) to
nominate the port (left or right) from which the diluted odour emanates. Each panellist’s
response (i.e. 'guess', 'likely' or 'certain') is recorded. The sequence of presentations generally
follows a decreasing dilution ratio, and when half of the panellists have correctly returned a
‘certain’ response, that dilution ratio is numerically equal to the concentration of the original,
undiluted odour sample. Hence, for example, if the dilution needed to get the 50% response
was 250:1, then by definition the original sample had an odour concentration of 250 OU.
4.1.3 EPA Criterion for Odour
EPA has defined an odour criterion and the Odour Guideline specifies how it should be applied
in dispersion modelling to assess the likelihood of nuisance impact arising from the emission of
odour.
Odour impact is a subjective experience and has been found to depend on many factors, the
most important of which are:
The Frequency of the exposure
The Intensity of the odour
The Duration of the odour episodes
The Offensiveness of the odour
The Location of the source
These factors are often referred to as the FIDOL factors.
DEC defined the odour criterion to take account of two of these factors (F is set at 99 percentile,
I is set at from 2 to 7 OU). The choice of criterion odour level has also been made to be
dependent on the population of the affected area, and to some extent it could be said that
population is a surrogate for location – so that the L factor has also been considered. The
relationship between the criterion odour level C to affected population P is given below.
C = [log P-4.5]÷-0.6 Equation 1
Table 4-1 lists the values of C for various values of affected populations as obtained using
equation 1.

GHD | Report for Manildra Group - Air Quality Assessment, 2127188 | 13
Table 4-1 Odour criterion for the assessment of odour
Population of affected community Odour performance criteria (nose response odour
certainty units at 99th percentile)
Single Residence (≤ ~2) 7
~ 10 6
~ 30 5
~ 125 4
~ 150 3
Urban (~2,000) 2
The NSW Approved Methods specifies a criterion of two odour units at the 99th percentile over
a short term averaging nose-response time of one second for a complex mixture of odorous air
pollutants in an urban area (population greater than 2000 or with schools and hospitals). The
criterion is applied at the location of the nearest sensitive receptor or likely future location of
sensitive receptor.
5 OU is commonly taken as a conservative measure of the odour level which can be
distinguished against the ambient background level of odour, and which if offensive, could result
in complaint.
1 OU generally cannot be detected in a non-laboratory situation (i.e. where the ambient
background odour levels reduce the detectability of a given odorant).
As the CALPUFF dispersion model (utilised in this assessment), when operating in
micrometeorological mode can only predict concentrations over an averaging period of one
hour, a ratio between the one second peak concentration and 60 minute average concentration
has been applied to the source odour emission rates. In this manner, the predicted one hour
odour levels predicted in CALPUFF represent the corresponding one second short-term levels
required to be compared to the DEC criterion. The ratio is known as the peak to mean ratio
(PM60). PM60 is a function of source type, stability category and range (i.e. near or far-field),
and values are tabulated in the modelling Guideline1. This is reproduced below.
Figure 5 Extract from NSW Approved Methods
1 Approved Methods for the Modelling and Assessment of Air Pollutants in NSW (DEC, 2005).
GHD | Report for Manildra Group - Air Quality Assessment, 2127188 | 14
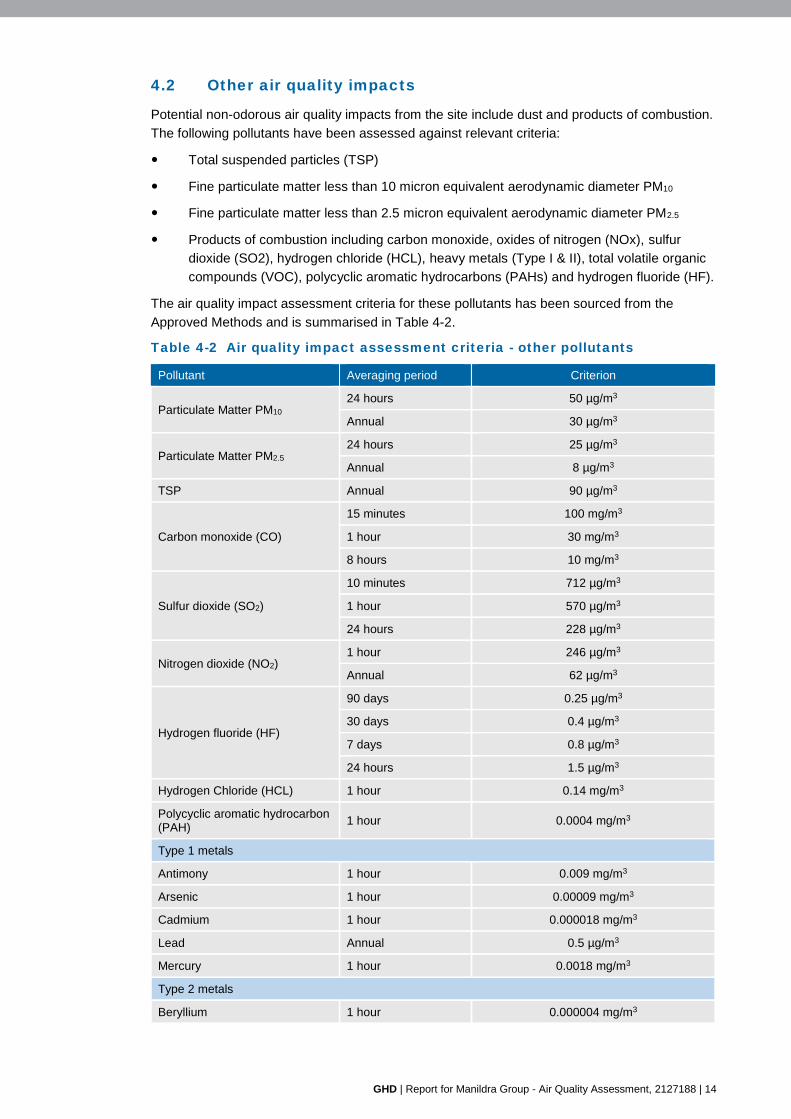
4.2 Other air quality impacts
Potential non-odorous air quality impacts from the site include dust and products of combustion.
The following pollutants have been assessed against relevant criteria:
Total suspended particles (TSP)
Fine particulate matter less than 10 micron equivalent aerodynamic diameter PM10
Fine particulate matter less than 2.5 micron equivalent aerodynamic diameter PM2.5
Products of combustion including carbon monoxide, oxides of nitrogen (NOx), sulfur
dioxide (SO2), hydrogen chloride (HCL), heavy metals (Type I & II), total volatile organic
compounds (VOC), polycyclic aromatic hydrocarbons (PAHs) and hydrogen fluoride (HF).
The air quality impact assessment criteria for these pollutants has been sourced from the
Approved Methods and is summarised in Table 4-2.
Table 4-2 Air quality impact assessment criteria - other pollutants
Pollutant Averaging period Criterion
Particulate Matter PM10 24 hours 50 µg/m3
Annual 30 µg/m3
Particulate Matter PM2.5 24 hours 25 µg/m3
Annual 8 µg/m3
TSP Annual 90 µg/m3
Carbon monoxide (CO)
15 minutes 100 mg/m3
1 hour 30 mg/m3
8 hours 10 mg/m3
Sulfur dioxide (SO2)
10 minutes 712 µg/m3
1 hour 570 µg/m3
24 hours 228 µg/m3
Nitrogen dioxide (NO2) 1 hour 246 µg/m3
Annual 62 µg/m3
Hydrogen fluoride (HF)
90 days 0.25 µg/m3
30 days 0.4 µg/m3
7 days 0.8 µg/m3
24 hours 1.5 µg/m3
Hydrogen Chloride (HCL) 1 hour 0.14 mg/m3
Polycyclic aromatic hydrocarbon (PAH)
1 hour 0.0004 mg/m3
Type 1 metals
Antimony 1 hour 0.009 mg/m3
Arsenic 1 hour 0.00009 mg/m3
Cadmium 1 hour 0.000018 mg/m3
Lead Annual 0.5 µg/m3
Mercury 1 hour 0.0018 mg/m3
Type 2 metals
Beryllium 1 hour 0.000004 mg/m3

GHD | Report for Manildra Group - Air Quality Assessment, 2127188 | 15
Pollutant Averaging period Criterion
Chromium 1 hour 0.00009 mg/m3
Manganese 1 hour 0.018 mg/ m3
Nickel 1 hour 0.00018 mg/ m3

GHD | Report for Manildra Group - Air Quality Assessment, 2127188 | 16
5. Meteorological data
A 12-month dataset was constructed using the 3D prognostic modelling package, TAPM and
the diagnostic 3D meteorological model, CALMET for the period from January to December
2004. This 12 month period was chosen to be consistent with previous modelling undertaken for
the 2008 Air Quality Assessment, approved at the time by EPA and to allow to a direct
comparison to previous modelling. Further detail is provided in Appendix A in regards to the
selection and construction of the meteorological dataset used in the modelling.
The CALMET modelling can be summarised as follows:
Prognostic models TAPM and CALMET were used for initial wind field ‘guesses’
Observations from both the environmental farm Automatic Weather Station (AWS) and
Nowra AWS were used to optimise and check the prognostic model simulations
Wind speeds and direction observations from the environmental farm AWS were
assimilated into the prognostic model to make the data site-specific
The result of assimilating this data into the CALMET simulations makes the data site-specific
(required for a Level 2 assessment), and inter-annual variability is not required to be accounted
for, with the conditions of the Approved Methods met for using “atleast one-year of site-specific meteorological data”.
An annual wind rose generated using CALMET is provided in Figure 6 to show the wind field at
the factory. The following trends are evident from Figure 6:
Annual average wind speed of 3.2 m/s
Winds are most prevalent from the west and west northwest, accounting for around one
third of all winds
Winds are least prevalent along the north-south axis
Light winds (shown in grey) are more prevalent from the northwest
Drainage flows occurring during stable conditions at night time are dominated by the
following distinct features (in order of scale):
– Shoalhaven River running west to east through the site
– Browns Mountains to the northwest of the site
– Yalwal State Forest mountain range to the west.

GHD | Report for Manildra Group - Air Quality Assessment, 2127188 | 17
Figure 6 CALMET wind rose for the factory

GHD | Report for Manildra Group - Air Quality Assessment, 2127188 | 18
6. Background air quality
The OEH runs a state wide air quality monitoring network, with the nearest monitoring site to
Shoalhaven Starches being Albion Park South. Albion Park South commenced operation in
2006 meaning that daily background particulate levels (PM2.5 and PM10) cannot be directly
compared to the GHD CALPUFF model of the site which uses meteorology from 2004.
Background levels of pollutants used in the assessment are provided in Table 6-1, with the
exception of PM2.5 and PM10, which is based on 2004 data from Wollongong. This is because
the nearest monitoring station that operated in 2004 with both PM2.5 and PM10 data is the
Wollongong site, approximately 20 km to the north of Albion Park. Wollongong generally
experiences elevated particulate levels compared to Albion Park South due to the greater
presence of emissions from urban and industrial sources (refer to Table 6-1).
Highest measured levels of particulate for the year 2004 at Wollongong are shown in the
contemporaneous assessment in Section 8.
A reasonable representation of ambient PM2.5 and PM10 (24-hour) concentration levels is the
70th percentile for use in plotting general cumulative impacts. The 70th percentile at Albion Park
South in 2016 was 18.3 g/m3 for PM10 and 8.0 g/m3 for PM2.5.
Table 6-1 Background Air Quality Data – Albion Park South (2016)
Pollutant Averaging Period Concentration (100th percentile)
Units
Nitrogen dioxide (NO2) 1 hour 80.8
g/m3 Annual 7.1
Sulfur dioxide (SO2)
1 hour 57.6
g/m3 24 hour 15.7
Annual 1.6
Carbon monoxide (CO)1 1 hour 1.0
mg/m3 8 hour 0.6
PM10 24 hours 43.2
g/m3 Annual 14.9
PM2.5 24 hours 30.7
g/m3 Annual 7.2
1 CO was sourced from the Wollongong monitoring station as this was not available at Albion Park South
The contemporaneous particulate assessment was undertaken using data from Wollongong in
2004. A review of particulate levels at Wollongong and Albion Park is provided in Table 6-2.
Average particulate levels at Wollongong have reduced from 2004 to 2016. Levels at Albion
Park South in 2016 are lower than the levels at Wollongong over the same period.

GHD | Report for Manildra Group - Air Quality Assessment, 2127188 | 19
Table 6-2 Review of particulate monitoring at Albion Park South and
Wollongong, g/m3
Site and Year Albion Park 2016 Wollongong 2016 Wollongong 2004
Average PM10 14.9 17.3 25.5
70th percentile PM10 18.3 20.7 28.8
90th percentile PM10 25.6 29.7 37.8
Average PM2.5 7.2 7.4 9.7
70th percentile PM2.5 8.0 8.3 12.2
90th percentile PM2.5 11.2 11.6 16.4
Shoalhaven Starches engaged Stephenson Environmental Management Australia to conduct
targeted background ambient air quality monitoring at 26 Coomea Street, Bomaderry over four
seasons. (AMBIENT AIR QUALITY MONITORING –SUMMARY REPORT 2015-2016,
Stephenson Environmental Management Australia, April 2016). The maximum measured levels
of pollutants measured over the monitoring periods with a 24 hour averaging period were:
SO2 – 10.2 g/m3
NO2 – 54.5 g/m3
PM10 – 28.1 g/m3
The results show all pollutants are significantly lower than the levels recorded at Albion Park
South, and would include any emissions from the Shoalhaven Starches site. The maximum
levels all readily comply with the relevant criteria. Using the background data from Albion Park
South in this assessment allows for additional conservatism.

GHD | Report for Manildra Group - Air Quality Assessment, 2127188 | 20
7. Odour assessment
7.1 Emissions inventory
7.1.1 Source identification
Odour emanating from Shoalhaven Starches is comprised of a complex mixture of primarily
odorous volatile organic compounds (VOCs). VOC speciation data from a range of principal
odour sources indicates that the individual VOCs within the mixture tend to be classified under
odour-based air quality criteria rather than toxicity-based2 criteria. Therefore, the identified
sources of odour are modelled collectively as odour.
Consistent with the previous air quality assessments, the following sources contribute to the
majority of the odour impacts from the Shoalhaven Starches sites, in order of significance:
DDG Plant (including Pellet Plant exhaust stack and biofilters)
Starch Plant (Gluten and Starch Dryers)
Ethanol Plant (yeast propagators and retention tank).
A number of other minor odour sources contribute to the remainder of the plant’s odour impact.
These are detailed in Appendix B.
7.1.2 Changes to baseline odour model
The baseline odour model includes all existing and proposed odour sources at the Shoalhaven
Starches plant, including EPA monitored sources and all minor sources, up to Mod 16. The
odour sources associated with these modifications have been discussed in depth in previous air
quality assessments.
The following assumptions and additional changes were made to the baseline odour model:
Peak odour emission rates were sourced from the odour monitoring conducted by SEMA
in the previous four quarters for EPA ID sources. The sources were scaled to a 300 ML
per year production. The quarter with the maximum measured total OER was selected for
use in the assessment and is consistent with guidance in the Approved Methods and the
recommendation from EPA (16 February 2017) that peak emissions should be assessed.
The peak period was found to be quarter 2, 2019 (August 2019)
The exit velocities and temperatures for EPA ID sources were adjusted to the modelled
quarter. These measurements include the mitigation modifications made to No. 3 and No.
4 gluten dryer exhausts as part of the Mod 11 and 12 air quality assessment
recommendations
As part of the current proposal, the starch dryer 5 (SD5) emissions will be split to two
stacks- 16% of the flow will pass through the existing SD5 stack (now relabelled to SD5C)
while 84% of the flow will pass through a new stack (labelled as SD5N). The modelling
proportionately splits the odour emissions to account for this flow split. The new stack
(SD5N) is located south of the proposed baghouse (refer to Figure 1)
No. 1 and No. 2 gluten dryers were proposed to be modified to starch dryers as part of
Mod 16 assessment. Therefore, the emission rates assigned to these dryers remains
unchanged from the Mod 16 assessment as the dryers have not been modified yet
Mod 16 assessed the addition of a new gluten dryer (NGD). The model ID corresponding
to this dryer has been changed to GD8 from NGD to be consistent with the naming
2 Based on VOC speciation data for selected sources in the DDG plant: DDG dryers, palmer cooler and condensate tanks.

GHD | Report for Manildra Group - Air Quality Assessment, 2127188 | 21
conventions used by Shoalhaven Starches. The emission rates assumed in Mod 16
remain unchanged as the dryer has not been constructed yet.
Odour emission rates were assumed to be unchanged for the other emission sources.
7.1.3 Source summary and comparison
Modelling for the proposed Mod 17 scenario comprised the following sources:
68 point sources (each assumed at constant OER) throughout the site
Three point sources with variable emissions within the site
11 area sources (consisting of two biofilters and the effluent treatment ponds)
Five volume sources within the factory area.
These sources are detailed in Table 7-1 and Appendix B.
A comparison of the sources between Mod 13, Mod 16 (the last major air quality assessment3)
and the current modification is also provided in Table 7-1. This shows that the total odour levels
increase of approximately 40% between the previous and current modifications.
This increase is primarily due to the highest quarterly results displaying a significantly higher
source emissions for the following three sources (compared to Mod 16):
Boiler no 4: Increase from an MOER of 5,666 to 22,077. This increase is likely due to
switch in the fuel source from gas-fired to coal fired.
Boiler no 5 & 6: Increase from an MOER of 43,711 to 68,610
Pellet exhaust stack: Increase from an MOER of 31,544 to 88,073. The cause of this
increase is unknown.
3 The changes associated with Mod 13 were not significant- only the MOER associated with Boiler no 4 was
revised in Mod 13.

GHD | Report for Manildra Group - Air Quality Assessment, 2127188 | 22
Table 7-1 Comparison of odour emissions from previous mods to current mod
Source Model
Reference MOER OU.m3/s (Mod 13) MOER OU.m3/s (Mod 16) Modelled Mod 17 MOER OU.m3/s
Boilerhouse
Boiler no 4 BOILR4 3,171 5,666 22,077
Boiler no 5 & 6 BOILR5 38,463 43,711 68,610
Sub total MOER 41,634 49,377 90,687
% of total MOER 15.0% 18.3% 24.1%
DDG Plant
Condenser drain VCD 31 31 31
DDG tent storage area DDG36 1,929 1,929 1,929
Product storage sheds DDG34 1,023 1,023 1,023
Light phase tank DDG19 20 20 20
Cooling towers DDG46 172 172 172
DDG Loadout Shed Awning DDG35 923 923 923
Pellet exhaust stack PPES 38,240 31,544 88,073
Pellet silo S12 350 350 350
Stillage surge tank SST 149 149 149
Pellet plant fugitives (non-DDG sources)
PPF 5,771 5,771 5,771
Additional Cooling towers CTP 172 172 172
Sub total MOER 48,780 42,084 98,613
% of total MOER 17.5% 15.6% 26.2%
Ethanol Plant
Yeast Propagators -tanks 4 and 5
YP45 820 820 820
Grain retention tank GRT 3,250 3,250 3,250
Ethanol recovery scrubber ERESC 3,132 10,660 15,405
Fermenters 10-16 FERM 2,668 3,298 795
Jet cooker 1 retention tank E13 1,067 1,067 1,067
Jet cooker 2/4 grain retention E7 567 567 567

GHD | Report for Manildra Group - Air Quality Assessment, 2127188 | 23
Source Model
Reference MOER OU.m3/s (Mod 13) MOER OU.m3/s (Mod 16) Modelled Mod 17 MOER OU.m3/s
Feed to distillery E22 83 83 83
Sub total MOER 11,587 19,745 21,987
% of total MOER 4.2% 7.3% 5.8%
Distillery
Incondensable gases vent D6 558 558 558
Molec. sieve vacuum drum D2 1,350 1,350 1,350
Column Washing Vent CWV 23 25 27
Sub total MOER 1,931 1,933 1,935
% of total MOER 0.7% 0.7% 0.5%
Starch and Glucose
Cyclone and FF ID4 A4 679 679 679
Cyclone and FF ID5 A5 96 96 96
Cyclone and FF ID6 A6 449 449 449
Cyclone and FF ID7 A7 932 932 932
Drum vac receiver C4 1,400 1,400 1,400
Dry gluten roof bin S07 4,500 4,500 4,500
Enzyme tanks B7 2,042 2,042 2,042
Flash vessel jet cooker C1 970 970 970
Flour bin aspirator S13A 500 500 500
Flourbin aspirator S13B 500 500 500
Flourbin motor drive S06 283 283 283
Flour mill aspiration (Mod 8) FMP1 266 205 205
Flour mill aspiration (Mod 8) FMP2 205 266 266
High protein dust collector S08 600 600 600
Ion exchange effluent tank C18 250 250 250
No 1 gluten dryer baghouse S02 5,925 5,166 5,166
No 1 starch dryer S01 5,193 5,193 11,316
No 2 gluten/starch dryer S04 2,354 5,166 5,166

GHD | Report for Manildra Group - Air Quality Assessment, 2127188 | 24
Source Model
Reference MOER OU.m3/s (Mod 13) MOER OU.m3/s (Mod 16) Modelled Mod 17 MOER OU.m3/s
No 3 gluten dryer baghouse S03 58,917 29,036 21,696
No 3 starch dryer S18 1,663 5,166 5,166
No 4 gluten dryer baghouse S05 31,222 22,433 13,693
No 4 starch dryer S19 1,824 4,008 5,020
No 5 ring dryer gluten/starch SDR5 4,817 4,817 4,817
No 5 starch dryer (existing) SD5 ►SD5C 6,800 6,800 3,393
No 5 starch dryer (new stack) SD5N 17,387
No 6 gluten dryer GD6 12,568 12,568 12,568
No 7 gluten dryer GD7 9,553 9,553 9,553
Spray dryer S20 738 738 738
Starch factory rejects E10 183 183 183
Farm tank F18 3,834 3,834 3,834
Pellet mill silo PMFS 173 173 173
Flour Mill B Exhaust FMBA to FMBM 5,637 4,621 4,621
Flour Mill C Exhaust FMC1 to FMC3 n/a 1,658 1,658
New gluten dryer NGD ►GD8 n/a 12,568 12,568
Sub total MOER 165,073 147,353 152,387
% of total MOER 59.3% 54.7% 40.5%
Packing Plant (Not constructed)
Starch silo 1 PPL1 86 86 86
Starch silo 2 PPL2 86 86 86
Gluten silo 1 PPM1 173 173 173
Gluten silo 2 PPM2 173 173 173
Gluten silo 3 PPM3 173 173 173
Small gluten silo PPS1 92 92 92
Small starch silo PPS2 35 35 35
Sub total MOER 818 818 818
% of total MOER 0.3% 0.3% 0.2%

GHD | Report for Manildra Group - Air Quality Assessment, 2127188 | 25
Source Model
Reference MOER OU.m3/s (Mod 13) MOER OU.m3/s (Mod 16) Modelled Mod 17 MOER OU.m3/s
Area sources: Env farm after WWTP
Biofilter A BIO1 440 1,408 1,386
Biofilter B BIO2 330 803 1,111
Biofilter C BIO3 1,089 1,089 1,089
Biofilter D BIO4 1,280 1,280 1,280
Storage dam 1 PO1 148 71 119
Storage dam 2 PO2 1,656 248 143
Storage dam 3 PO3 192 569 1,231
Storage dam 5 PO5 515 971 1,922
Storage dam 6 PO6 1,775 1,435 793
Sulfur oxidisation basin SOBAS 830 349 535
Membrane bio-reactor MBR 62 62 62
Sub total MOER 8,317 8,286 9,671
% of total MOER 3.0% 3.1% 2.6%
Total (Mod 11 and Mod 12) 278,140
Total (Mod 16) 269,595
Total (Mod 17) 376,099

GHD | Report for Manildra Group - Air Quality Assessment, 2127188 | 26
7.2 Dispersion modelling
The odour dispersion modelling was conducted using the US EPA regulatory Gaussian puff
model CALPUFF Version 5.8. This model is also a recognised regulatory model in NSW.
Where the modelling of odour dispersion is in complex terrain (as is the case at the Shoalhaven
site), CALPUFF is recommended for use under NSW Guidelines. CALPUFF is especially suited
for modelling light to calm wind conditions.
The following settings were used in the simulations:
Model: CALPUFF Version 5.8
The receptor grid was 25 km x 25 km, with a 200 m grid resolution
The nearest receptors from the townships of Bomaderry (to the west) and Nowra (to the
south) were used as sensitive receptors, along with a few isolated residences around the
factory and environmental farm
Ground level receptor heights have been modelled using the same terrain data as the
original 2008 GHD assessment. This terrain data was used in the CALMET 2004 model
which is used for CALPUFF modelling
Emissions were scaled based on a nose-response time for odour of one second, applying
a peak-to-mean ratio to the one hour average concentration of 2.3 for wake affected point
sources and volume sources, and variable scaling for non-wake affected sources and
area sources
Meteorology was taken from the CALMET 2004 synthesised dataset, approved for use in
previous studies
Building wake effects were modelled to the extent practicable.
7.3 Predicted odour impacts
Figure 7 shows the predicted 99th percentile odour impacts (one minute nose-response time) for
the proposed Mod 17 operations and the previous modifications.
Table 7-2 shows the predicted odour levels for the proposal (Mod 17). Table 7-2 also shows the
previous modification results.
The predicted odour levels show an increase at all sensitive receptors. The increase is
attributed to the higher quarterly results in the last four quarters, particularly the pellet plant
stack (PPES). The increase is not a result of the proposed modifications.
The results show that the impact assessment odour criteria are achieved at all residential
sensitive receptors.
Seven commercial/industrial receptors are included in the assessment. These are all located
within approximately 125 m of the site. One hour, 99th percentile odour impacts have been
predicted based on the hours of operation of the receptors as per Section 2.1.1 (i.e. predicted
odour impacts when the sites are not operational have been excluded from the assessment).
Commercial/industrial receptors C2, C3, C4, C5, C6 and C7 marginally exceed the criteria of 6
OU (assumed the same criteria as R1) due to the higher quarterly results.
Commercial receptor C1 is located approximately 45 m from the site and is the BOC CO2 Plant.
Given the industrial nature of C1, and its existing proximity to the site no significant odour
impacts are anticipated from the proposal.
No odour complaints attributed to the Shoalhaven Starches plant were made in the previous
four quarters.

GHD | Report for Manildra Group - Air Quality Assessment, 2127188 | 27
Table 7-2 Predicted peak (99th percentile, short term averaged) odour impact
at nearby receptors
Receptor Range,
m
To nearest odour source
Direction
2009 EA approved
‘base case’ Odour
criterion
Odour impact, OU, 99th percentile, nose-response time
Mod 13 Mod 16 Mod 17 Mod 17 (rounded as per EPA advice)
R1 Bomaderry
150 Packing
Plant W 6 3.3 3.5 4.1 4
R2 North Nowra
1300 Factory SW 3 2.5 2.6 3.3 3
R3 Nowra
700 Factory S 5 4 4.6 4.8 5
R4 Terara
1300 Factory SE 5 3.7 3.7 3.9 4
C1 45 Factory N n/a n/a 10.3 12.1 12
C2 20 Factory N n/a n/a 5.8 7.5 8
C3 30 Factory N n/a n/a 5.3 6.9 7
C4 75 Factory NW n/a n/a 4.4 6.1 6
C5 125 Factory NW n/a n/a 6.1 6.6 7
C6 30 Factory NW n/a n/a 5.4 7.2 7
C7 55 Factory NW n/a n/a 4.8 6.8 7

!(
!(
!(
!(
!(
!(!(!(!(!(!(
R1
R2
R3 R4
C1C2
C3
C4
C5 C6
C7
T E R A R AT E R A R A
FLAT
ROCK
CREEK
NOWR
A CREE
K
SHOALHAVEN RIVER
BOMAD ER
RYC
REEK
ABER
NETH
YS C
REEK
HORSESHOE CREEK
CROOKHAVEN CREEK
BERR
Y STR
EET
BRID
GE R
OADSCENI C
DRIVE
CAMBEWARRA ROAD
MOSS VALE ROAD
WALSHCRESCENT
EAST
STRE
ET
FERR
Y LAN
E
HANSONSROAD
BOMADERRY CREEKWALKINGTRACK
JASM
INED
RI VE
LYREBIR D DRIVE
FAIRWAY DRIVE
COCO
NUT DRIVE
YEOVIL DRIVE
BENS WA LK
PAGE AVENUE
LYNDH
URST
DRIV
E
JENN
INGS
LANE
JONSSONROADMEROO
ROAD
WEST CAMBEWARRA ROAD
WORRIGEE STREET
NORTH STREET
PITT STREET
DOUGLAS STREET
TERARA ROAD
YURUNGA DRIVE
PLUNKETT STREET
MCMAHONS ROAD
MILLB ANK ROAD
PRINCES HIGHWAY
COMERONG ISLAND ROAD
ILLAROO ROADBOLONG ROAD
5 OU
2 OU
5 OU
5 OU
2 OU
5O U
2OU
Figure 7
Job Number
Revision A
2126310
\\ghdnet\ghd\AU\Sydney\Projects\21\27188\GIS\Maps\Deliverables\21_27188_Odour_Mod17.mxd
Map Projection: Transverse Mercator
Horizontal Datum: GDA 1994
Grid: GDA 1994 MGA Zone 56
0 400 800200
Metres
LEGEND
o© 2019. Whilst every care has been taken to prepare this map, GHD, ESRI, SIXMAPS, NSW LPI make no representations or warranties about its accuracy, reliability, completeness or suitability for any particular purpose and cannot accept liability and responsibility of any kind
(whether in contract, tort or otherwise) for any expenses, losses, damages and/or costs (including indirect or consequential damage) which are or may be incurred by any party as a result of the map being inaccurate, incomplete or unsuitable in any way and for any reason.
Date 29 Nov 2019
Manildra Ground Pty Ltd
Shoalhaven Starches
Odour impacts, 99th percentile,
one-second average, Modification 17, OU
Data source: Aerial Imagery: SIXMAPS, 2018. General Topo: NSW LPI DTDB 2012. Created by:ppandey
Level 15, 133 Castlereagh Street Sydney NSW 2000 T 61 2 9239 7100 F 61 2 9239 7199 E [email protected] W www.ghd.com.au
Paper Size A4
DRAFT
!( Identified sensitive receptors
Mod 16 odour unit contour
Mod 13 odour unit contour (with mitigation)
Mod 17 odour unit contour
Shoalhaven Starches Factory
Environmental farm boundary
Packing plant (proposed)

GHD | Report for Manildra Group - Air Quality Assessment, 2127188 | 29
8. Air quality assessment
8.1 Emissions inventory
In addition to odour emissions, the operation of the Shoalhaven Starches plant also has the
potential to generate emissions of particulate matter and products of combustion.
The baseline air quality model includes all existing and proposed air emissions sources at the
Shoalhaven Starches plant up to Mod 16. The sources associated with these modifications have
been discussed in the most recent cumulative air quality assessment undertaken in February
2019.
Assumptions and changes made to the baseline air quality model as part of this assessment are
discussed in detail below for each of the individual source types.
8.1.1 Coal fired boiler emission sources
Emissions modelling undertaken as part of the Mod 16 air quality assessment assumed that
Boilers 2, 4, 5, 6 and 8 would all operate on coal.
Boiler emissions were based on stack emission surveys, the National Pollutant Inventory and
measurements undertaken by SEMA. SO2 emissions from all boilers were conservatively
modelled at the EPA limit. Appropriate mitigation measures, such as a lime dosing system for
boiler 8, were assumed as part of the modelling.
As part of the current (Mod 17) approvals process, Manildra seek to operate Boilers 2 and 4 on
a mix of woodchip and coal:
Boiler 2 is planned to operate on 25% woodchip and 75% coal
Boiler 4 is planned to operate on 16% woodchip and 84% coal.
Overall, a total of 7000 tonnes per annum (tpa) of woodchip is planned to be used, displacing
4,400 tpa of coal.
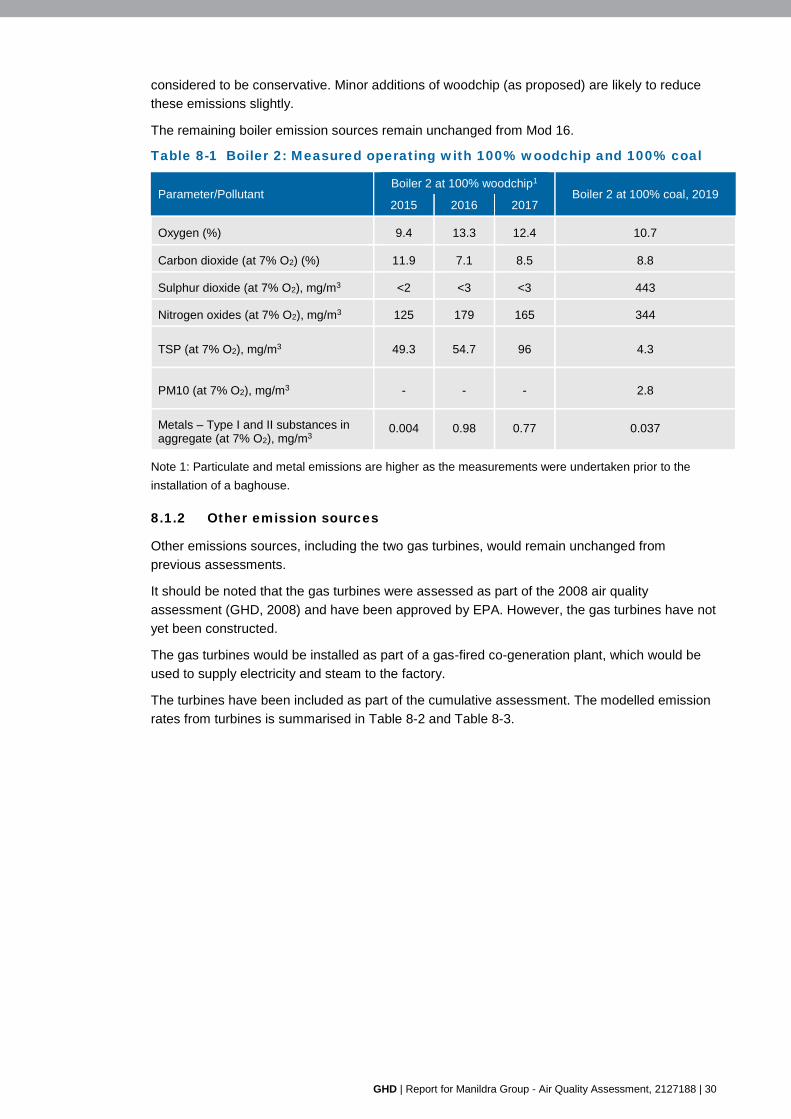
Prior to the Mod 12/13, Boiler 2 used to operate on 100% woodchip. Therefore, past
measurement data has been compared with recent data (assuming 100% coal) in Table 8-1.
The measurement data shows that emissions for key pollutants such as sulphur dioxide and
nitrogen dioxides are significantly lower when the boiler was operating on 100% woodchip.
Emissions for particulates and metals were higher as the emission surveys were undertaken
prior to the addition of a baghouse. A review of the National Pollutant Inventory Emission estimation technique manual for Combustion in boilers Version 3.6 (December, 2011) provides
the following emission factors:
For black coal (spreader stoker, corresponding to the combustion mechanisms in Boilers 2
and 4), the NPI (uncontrolled) emission factors are 6.6 kg/t for PM10 and 2.3 kg/t for PM2.5.
For wood/bark fired boilers, the NPI (uncontrolled) emission factors are 3.24 kg/t for PM10
and 2.74 kg/t for PM2.5.
The emissions factors with coal are higher for PM10 and comparable for PM2.5. Therefore, the
capture efficiencies of the existing baghouse are expected to remain high with a small
proportion of woodchip used as fuel, and particulates and metals will remain below the EPL
emission limits.
In lieu of the above, no changes have been made to the emissions inventory as the Mod 16
modelled emissions (refer to Mod 16 assessment and Table 8-3) are based on 100% coal and
GHD | Report for Manildra Group - Air Quality Assessment, 2127188 | 30
considered to be conservative. Minor additions of woodchip (as proposed) are likely to reduce
these emissions slightly.
The remaining boiler emission sources remain unchanged from Mod 16.
Table 8-1 Boiler 2: Measured operating with 100% woodchip and 100% coal
Parameter/Pollutant Boiler 2 at 100% woodchip1
Boiler 2 at 100% coal, 2019 2015 2016 2017
Oxygen (%) 9.4 13.3 12.4 10.7
Carbon dioxide (at 7% O2) (%) 11.9 7.1 8.5 8.8
Sulphur dioxide (at 7% O2), mg/m3 <2 <3 <3 443
Nitrogen oxides (at 7% O2), mg/m3 125 179 165 344
TSP (at 7% O2), mg/m3 49.3 54.7 96 4.3
PM10 (at 7% O2), mg/m3 - - - 2.8
Metals – Type I and II substances in aggregate (at 7% O2), mg/m3
0.004 0.98 0.77 0.037
Note 1: Particulate and metal emissions are higher as the measurements were undertaken prior to the
installation of a baghouse.
8.1.2 Other emission sources
Other emissions sources, including the two gas turbines, would remain unchanged from
previous assessments.
It should be noted that the gas turbines were assessed as part of the 2008 air quality
assessment (GHD, 2008) and have been approved by EPA. However, the gas turbines have not
yet been constructed.
The gas turbines would be installed as part of a gas-fired co-generation plant, which would be
used to supply electricity and steam to the factory.
The turbines have been included as part of the cumulative assessment. The modelled emission
rates from turbines is summarised in Table 8-2 and Table 8-3.

GHD | Report for Manildra Group - Air Quality Assessment, 2127188 | 31
Table 8-2 Emission inventory – Particulate matter
Discharge Point Emission Control TSP, g/s PM10, g/s
Boiler No. 1 Gas-fired 0.027 0.027
Boiler No. 2 Cyclone and fabric filter 0.042 0.043
Boiler No. 4 Cyclone and fabric filter 0.078 0.080
Boiler No. 5/6 Fabric filter 0.23 0.24
Boiler No. 8 (including co-gen turbine) Cyclone & Fabric filter 0.16 0.16
Gluten dryer No. 1 Fabric filter 0.015 0.0003
Gluten dryer No. 2 Fabric filter 0.015 0.001
Gluten dryer No. 3 Fabric filter 0.02 0.02
Gluten dryer No. 4 Fabric filter 0.02 0.02
Starch dryer No. 1 Wet-scrubber 0.59 0.18
Starch dryer No. 3 Wet-scrubber 0.04 0.013
Starch dryer No. 4 Wet-scrubber 1.2 0.31
Starch dryer No. 5 (combined) Cyclone 0.39 0.12
Spray dryer Fabric filter 0.48 0.14
Ring dryer no. 5 Fabric filter 0.01 0.01
Flour Mill Fabric filter 0.03 0.009
DDG Pellet Plant Fabric Filter 0.25 0.25
Packing Plant (proposed) Fabric Filter 0.016 0.016
Flour Mill B Fabric Filter 0.004 0.004
Flour Mill C (proposed) Fabric Filter 0.001 0.001
Gluten dryer No. 6 Fabric filter 0.02 0.02
Gluten dryer No. 7 Fabric filter 0.03 0.03
Gluten grinder Fabric filter 0.02 0.02
Co-generator turbine No. 1 (approved, not yet constructed)
Gas-fired 0.1 0.1
Co-generator turbine No. 2 (approved, not yet constructed)
Gas-fired 0.1 0.1
New gluten dryer Fabric Filter 0.02 0.02
Silos associated with speciality products building
Fabric Filter 0.051 0.051

GHD | Report for Manildra Group - Air Quality Assessment, 2127188 | 32
Table 8-3 Emission inventory – Products of combustion
Discharge Point Boiler No. 1 Boiler No. 2 Boiler No. 4 Boiler No. 5/6 Boiler No. 8 GD6 GD7 SD5 Turbine No. 1 & 2
Fuel type Natural gas and biogas
Coal and woodchip
Coal and woodchip
Coal Coal Natural gas Natural gas Natural gas Natural gas
Status/ details Existing,
No change
Existing, changing
from gas to coal-fired
Existing, changing from
gas to coal-fired
Existing, coal consumption
increasing
New proposed boiler
Natural gas is fed through to the dryers for combustion. The majority of the gas is fed to
gluten dryers 6 and 7 and starch dryer 5.
Approved, yet to be constructed
Stack height (m) 25 40 41 54 54 35 29 33.5 30
Exhaust temp. (C) 180 162 162 141 141 73 68 56 160
Stack diameter (m) 0.9 0.675 0.9 2 2 1.7 1.7 2.4 0.5
Exhaust velocity (m/s) 25 28.3 29.6 17.0 11.6 18.9 22.4 15 25
Oxygen (%) ND ND 11.2 8.7 ND ND ND ND ND
Moisture (%) ND ND 4.0 5.2 ND ND ND ND ND
Exhaust Flow rate, actual (m3/s)
ND 10.1 18.8 53.5 36.4 ND ND ND ND
Ratio (Actual to normalised flow)
ND 1.7 1.7 1.6 1.6 ND ND ND ND
Emission rates (g/s)
CO 8.77500E-02 9.76439E-02 1.81339E-01 2.40598E+00 1.64044E+00 2.98513E-01 2.26901E-01 1.61512E-01 3.00000E-01
SO2 4.02570E-03 3.66165E+00 6.80020E+00 2.00498E+01 1.36703E+01 4.47769E-03 3.40352E-03 2.42269E-03 1.20000E-02
NO2 6.21000E-01 2.86219E+00 5.31549E+00 1.50039E+01 1.02300E+01 7.01505E-01 5.33218E-01 3.79554E-01 2.00000E+00
VOC 2.01000E-02 2.31904E-02 4.30679E-02 1.47032E-01 1.00249E-01 - - - 4.20000E-03
Antimony (Sb) Type I - 5.85863E-05 1.08803E-04 1.35670E-04 9.25025E-05 - - - -

GHD | Report for Manildra Group - Air Quality Assessment, 2127188 | 33
Discharge Point Boiler No. 1 Boiler No. 2 Boiler No. 4 Boiler No. 5/6 Boiler No. 8 GD6 GD7 SD5 Turbine No. 1 & 2
Arsenic (As) Type I 7.30500E-07 8.54384E-05 1.58671E-04 1.35670E-04 9.25025E-05 - - - -
Cadmium (Cd) Type I 4.02000E-06 2.50213E-06 4.64680E-06 3.04089E-05 2.07333E-05 - - - -
Lead (Pb) Type I 1.82250E-06 7.32329E-04 1.36004E-03 1.21970E-03 8.31611E-04 - - - -
Mercury (Hg) Type I 9.45000E-07 1.83082E-04 3.40010E-04 1.67082E-06 1.13919E-06 - - - -
Beryllium (Be) Type II 4.38750E-09 1.70877E-05 3.17343E-05 2.03840E-05 1.38982E-05 - - - -
Chromium (Cr) Type II 5.11500E-06 6.71302E-05 1.24670E-04 1.39012E-04 9.47809E-05 - - - -
Cobalt (Co) Type II 2.97000E-07 6.71302E-05 1.24670E-04 6.78352E-05 4.62513E-05 - - - -
Manganese (Mn) Type II
1.38750E-06 4.08884E-04 7.59356E-04 7.45184E-04 5.08080E-04 - - - -
Nickel (Ni) Type II 7.65000E-06 2.99034E-04 5.55350E-04 2.88049E-04 1.96397E-04 - - - -
Selenium (Se) Type II 8.62500E-08 1.64774E-04 3.06009E-04 1.35670E-04 9.25025E-05 - - - -
Tin (Sn) Type II - 8.54384E-05 1.58671E-04 3.40847E-04 2.32395E-04 - - - -
Vanadium (V) Type II - 4.21089E-05 7.82023E-05 1.69421E-04 1.15514E-04 - - - -
HCL - 4.35126E-02 8.08091E-02 2.38258E-01 1.62449E-01 - - - -
PAH 2.33250E-06 4.10062E-06 7.61543E-06 3.22191E-05 2.19676E-05 - - - 4.40000E-05
FL - 3.24074E-02 6.01852E-02 2.54630E-01 1.73611E-02 - - - -
Emission rates, normalised (mg/m3)
CO 9 16 16 72 72 - - - -
SO2 0 600 600 600 600 - - - -
NO2 65 469 469 449 449 - - - -
TSP 2.8 7.1 7.1 7.1 7.1 - - - -

GHD | Report for Manildra Group - Air Quality Assessment, 2127188 | 34
Discharge Point Boiler No. 1 Boiler No. 2 Boiler No. 4 Boiler No. 5/6 Boiler No. 8 GD6 GD7 SD5 Turbine No. 1 & 2
Type 1 and 2 metals (combined) 0.0 0.4 0.4 0.1 0.1
- - - -
Cadmium 0.0 0.0 0.0 0.0 0.0 - - - -
Mercury 0.0 0.0 0.0 0.0 0.0 - - - -
VOC 2.1 3.8 3.8 4.4 4.4 - - - -
HCL - 7.1 7.1 7.1 7.1 - - - -
FL - 5.3 5.3 7.6 0.8 - - - -
The emission rate limits are as follows:
Protection of the Environment Operations (Clean Air) Regulation (2010): CO: 125 mg/m3, SO2: 1000 mg/m3, NO2: 500 mg/m3, TSP: 50 mg/m3, Type 1 and 2 metals
(combined): 1 mg/m3, Cadmium: 0.2 mg/m3, Mercury: 0.2 mg/m3, VOC: 40 mg/m3, HCL: 100 mg/m3, FL: 50 mg/m3
EPA: SO2: 600 mg/m3, NO2: 500 mg/m3, TSP: 30 mg/m3, Type 1 and 2 metals (combined): 1 mg/m3, Cadmium: 0.2 mg/m3, Mercury: 0.2 mg/m3, VOC: 40 mg/m3.

GHD | Report for Manildra Group - Air Quality Assessment, 2127188 | 35
8.2 Dispersion modelling
The air quality dispersion modelling was conducted using the US EPA regulatory Gaussian puff
model CALPUFF Version 5.8. The model settings were as described in Section 7.2.
8.3 Predicted air quality impacts
The predicted air quality impacts are reproduced below and remain unchanged from Mod
16.
8.3.1 Particulates
The impact of dust emissions principally relates to the potential effect on human health of
inhalation of particles in the air column, and it is the finer fraction that have the greater potential
to cause respiratory health effects. EPA have advised to assess PM2.5, if PM10 impacts are
significant. The PM2.5 emissions from some sources on site are not known, however guidance is
available for estimates of PM2.5 from boilers in the NPI. NPI emission factors for coal boilers with
a baghouse states that PM2.5 emissions are half of PM10 emissions and the ratio of PM2.5 to
PM10 in gas fired boilers is the same.
A summary of the maximum incremental predicted levels at each receptor site is presented in
Table 8-4. The worst case predicted incremental PM10 level is at R1 with a level of 8.5 µg/m3.
Table 8-4 Maximum predicted incremental ground level PM10, PM2.5 and
TSP concentrations
Receiver Pollutant
PM10 (24 hour) PM10 (Annual) PM2.5 (24 hour) PM2.5 (Annual) TSP
(Annual)
Criteria µg/m3 50 25 25 8 90
R1 8.5 0.8 4.3 0.4 1.8
R2 4.6 0.4 2.3 0.2 0.9
R3 8.1 0.8 4.1 0.4 1.6
R4 6.4 1.2 3.2 0.6 2.3
C1 27.4 3.1 13.7 1.6 8.8
C2 17.0 3.1 8.5 1.5 7.3
C3 15.0 2.8 7.5 1.4 6.5
C4 15.0 2.4 7.5 1.2 5.2
C5 12.5 2.0 6.2 1.0 4.1
C6 17.8 3.2 8.9 1.6 7.0
C7 17.3 2.8 8.6 1.4 5.5

GHD | Report for Manildra Group - Air Quality Assessment, 2127188 | 36
A contemporaneous assessment has been undertaken for the year 2004 in accordance with the
Approved Methods. Predicted 24 hour PM2.5 and PM10 values from the site in 2004 have been
added to the 24 hour measured values at Wollongong for every day in the year.
The top predicted, measured and total concentrations at the most impacted residential receptor
(R1) and commercial receptor (C1) are presented in Table 8-5 to Table 8-8 below. The
background and incremental contributions for the highest cumulative concentrations are also
included.
Results of the assessment show full compliance with the PM2.5 and PM10 24 hour criteria at
sensitive receptor R1.
Results of the assessment show full compliance with the PM2.5 24 hour criteria at sensitive
receptor C1. An exceedance of the PM10 24 hour criteria is predicted for one day of the year at
sensitive receptor C1. This exceedance is bolded in Table 8-7 and includes a background
contribution of 49 µg/m3 and a site contribution of 13.5 µg/m3.
The site contributions at receptor C1 for the exceedance day are dominated by the following top
four sources:
S19 (Starch dryer no. 4): 3.6 µg/m3
S20 (Spray dryer): 3.2 µg/m3
S01 (Starch dryer no. 1): 2.9 µg/m3
PPF (DDG Pellet Plant): 1.5 µg/m3.
In total, these sources account for 82% of the site contribution on the day. The contributions
from the boilers are as follows:
Boiler 1: 0.1 µg/m3
Boiler 2: 0.2 µg/m3
Boiler 4: 0.3 µg/m3
Boiler 5/6: 0.3 µg/m3
Boiler 8: 0.1 µg/m3.
The contributions from all boilers account for 8% of the total concentration on the day, with
boiler 8 accounting for less than 1% of the total contribution. Therefore, the proposal is not
anticipated to increase levels PM10 significantly.
Plots of the predicted 24 hour maximum PM10 levels are provided in Figure 8 (incremental
impact) and in Figure 9 (cumulative impact with 70th percentile PM10 levels at Albion Park South
2016 for comparative purposes).
Plots of the predicted 24 hour maximum PM2.5 levels are provided in Figure 10 (cumulative
impact with 70th percentile PM2.5 levels at Albion Park South 2016 for comparative purposes).

GHD | Report for Manildra Group - Air Quality Assessment, 2127188 | 37
Table 8-5 Summary of highest measured and predicted PM10 levels, µg/m3
(R1)
Top 10 PM10 background Top 10 PM10 incremental
Top 10 PM10 cumulative
Date PM10
background Date
PM10
increment Date
PM10 cumulative
Background
contribution
Site contribution
08/03/2004 49.0 23/03/2004 8.5 08/03/2004 49.3 49.0 0.3
27/11/2004 48.4 11/03/2004 8.0 27/11/2004 48.7 48.4 0.3
21/02/2004 47.0 20/10/2004 5.6 21/02/2004 47.0 47.0 0.0
26/03/2004 46.1 24/09/2004 5.0 26/03/2004 46.1 46.1 0.0
08/12/2004 43.7 18/08/2004 5.0 08/12/2004 44.5 43.7 0.8
10/01/2004 43.4 19/01/2004 4.5 10/01/2004 43.4 43.4 0.0
09/02/2004 43.1 18/01/2004 4.3 09/02/2004 43.1 43.1 0.0
06/02/2004 41.2 02/03/2004 4.1 20/02/2004 41.7 40.4 1.3
07/12/2004 40.8 17/10/2004 4.1 06/02/2004 41.3 41.2 0.1
20/02/2004 40.4 05/04/2004 4.1 07/12/2004 41.1 40.8 0.3
Table 8-6 Summary of highest measured and predicted PM2.5 levels, µg/m3
(R1)
Top 10 PM10 background Top 10 PM10 incremental
Top 10 PM10 cumulative
Date PM2.5
background Date
PM10
increment Date
PM2.5 cumulative
Background
contribution
Site contribution
10/01/2004 22.6 23/03/2004 4.3 10/01/2004 22.6 22.6 0.0
21/02/2004 22.3 11/03/2004 4.0 21/02/2004 22.3 22.3 0.0
26/03/2004 19.9 20/10/2004 2.8 26/03/2004 19.9 19.9 0.0
06/02/2004 19.0 24/09/2004 2.5 06/02/2004 19.0 19 0.0
09/02/2004 18.3 18/08/2004 2.5 11/02/2004 18.6 17.9 0.7
11/02/2004 17.9 19/01/2004 2.3 09/02/2004 18.3 18.3 0.0
09/03/2004 17.6 18/01/2004 2.2 08/03/2004 17.6 17.5 0.1
08/03/2004 17.5 02/03/2004 2.1 27/11/2004 17.6 17.5 0.1
27/11/2004 17.5 17/10/2004 2.1 09/03/2004 17.6 17.6 0.0
13/03/2004 17.0 05/04/2004 2.1 07/02/2004 17.1 16.2 0.8

GHD | Report for Manildra Group - Air Quality Assessment, 2127188 | 38
Table 8-7 Summary of highest measured and predicted PM10 levels, µg/m3
(C1)
Top 10 PM10 background Top 10 PM10 incremental
Top 10 PM10 cumulative
Date PM10
background Date
PM10
increment Date
PM10 cumulative
Background
contribution
Site contribution
08/03/2004 49.0 10/05/2004 27.4 08/03/2004 62.5 49 13.5
27/11/2004 48.4 26/01/2004 26.6 10/01/2004 49.1 48.4 0.7
21/02/2004 47.0 5/04/2004 21.6 21/02/2004 47.2 47 0.2
26/03/2004 46.1 27/01/2004 19.8 26/03/2004 46.4 46.1 0.3
08/12/2004 43.7 20/07/2004 19.3 06/02/2004 44.4 43.1 1.3
10/01/2004 43.4 3/10/2004 19.0 09/02/2004 43.6 43.4 0.2
09/02/2004 43.1 16/08/2004 16.0 11/02/2004 41.3 41.2 0.1
06/02/2004 41.2 19/08/2004 15.9 07/02/2004 39.7 37.7 2.0
07/12/2004 40.8 19/07/2004 15.8 27/11/2004 39.1 38.9 0.2
20/02/2004 40.4 4/02/2004 15.6 09/03/2004 37.2 33.4 3.8
Table 8-8 Summary of highest measured and predicted PM2.5 levels, µg/m3
(C1)
Top 10 PM10 background Top 10 PM10 incremental
Top 10 PM10 cumulative
Date PM2.5
background Date
PM10
increment Date
PM2.5 cumulative
Background
contribution
Site contribution
10/01/2004 22.6 10/05/2004 13.7 08/03/2004 24.3 17.5 6.8
21/02/2004 22.3 26/01/2004 13.3 10/01/2004 22.7 22.6 0.1
26/03/2004 19.9 5/04/2004 10.8 21/02/2004 22.4 22.3 0.1
06/02/2004 19.0 27/01/2004 9.9 26/03/2004 20.1 19.9 0.2
09/02/2004 18.3 20/07/2004 9.7 06/02/2004 19.0 19.0 0.0
11/02/2004 17.9 3/10/2004 9.5 09/02/2004 19.0 18.3 0.7
09/03/2004 17.6 16/08/2004 8.0 11/02/2004 18.9 17.9 1.0
08/03/2004 17.5 19/08/2004 8.0 07/02/2004 18.1 16.2 1.9
27/11/2004 17.5 19/07/2004 7.9 27/11/2004 17.8 17.5 0.3
13/03/2004 17.0 4/02/2004 7.8 09/03/2004 17.7 17.6 0.1

!(
!(
!(
!(
!(
!(!(!(!(!(!(
R1
R2
R3 R4
C1C2
C3
C4
C5 C6
C7
FLATR
OCK C
REEK
MULGEN CREEK
NOWRA CREEK
SHOALHAVEN RIVER
BO
M ADER
RYCR
EEK
HORSESHOE CRE
EK
CROOKHAVEN
CREE K
WALSHCRESCENT
EAS T
STRE
ET
PEAK AVENUE
JASM
INED
RIVE
YU RUNGA
DRIVE
BRINA
WARRS
TREE
T
BENS WALK
PAGE AVENUE
JENN
INGS
LANE
JONSSONROAD
WEST CAMBEWARRA ROAD
NORTH STREET
PITT STRE
ET
DOUGLAS STREET
TERARA ROAD
PLUNKETT STREET
MCMAHONS ROAD
MILLB ANK ROAD
COMERONG ISLAND ROAD
ILLAROO ROADBOLONG ROAD
Figure 8
Job Number
Revision A
21-26310
G:\21\27188\GIS\Maps\Deliverables\21_27188_SMA.mxd (SMA record: 2)
Map Projection: Transverse Mercator
Horizontal Datum: GDA 1994
Grid: GDA 1994 MGA Zone 56
0 400 800200
Metres
LEGEND
o© 2019. Whilst every care has been taken to prepare this map, GHD, ESRI, SIXMAPS, NSW LPI make no representations or warranties about its accuracy, reliability, completeness or suitability for any particular purpose and cannot accept liability and responsibility of any kind
(whether in contract, tort or otherwise) for any expenses, losses, damages and/or costs (including indirect or consequential damage) which are or may be incurred by any party as a result of the map being inaccurate, incomplete or unsuitable in any way and for any reason.
Date 18 Feb 2019
Manildra Group Pty Ltd
Shoalhaven Starches
Maximum Predicted Incremental Ground Level
PM10 Concentrations (24-hour Average), µg/m3
Data source: Aerial Imagery: SIXMAPS, 2018. General Topo: NSW LPI DTDB 2012. Created by:afoddy
Level 15, 133 Castlereagh Street Sydney NSW 2000 T 61 2 9239 7100 F 61 2 9239 7199 E [email protected] W www.ghd.com.au
Paper Size A4
DRAFT
!( Identified sensitive receptors
PM10 24HR concentration contour (µg/m3)5
10
20
Shoalhaven Starches Factory
Environmental farm boundary
Packing plant (proposed)

!(
!(
!(
!(
!(
!(!(!(!(!(!(
R1
R2
R3 R4
C1C2
C3
C4
C5 C6
C7
FLATR
OCK C
REEK NO
WRACR
EEK
SHOALHAVEN RIVER
BOMADERRY CREEK
HORSESHOE CREEK
CROOKHAVEN CREEKBERR
Y STR
EET
WALSHCRESCENT
JASM
I NED
RIVE
YU RUNGA
DRIVE
COCO
NUT DRIVE
YEOVIL DRIVE
BENS WA LK
PAGE AVENUE
JENN
INGS
LANE
JONSSONROAD
MEROOROAD
WORRIGEE STREET
SC
ENIC DRIVE
PITT STREET
DOUGLAS STREET
MCMAHONS ROAD
MILL
BANK
ROAD
COMERONG ISLAND ROAD
ILLAROO ROADBOLONG ROAD
Figure 9
Job Number
Revision A
21-26310
G:\21\27188\GIS\Maps\Deliverables\21_27188_SMA.mxd (SMA record: 3)
Map Projection: Transverse Mercator
Horizontal Datum: GDA 1994
Grid: GDA 1994 MGA Zone 56
0 400 800200
Metres
LEGEND
o© 2019. Whilst every care has been taken to prepare this map, GHD, ESRI, SIXMAPS, NSW LPI make no representations or warranties about its accuracy, reliability, completeness or suitability for any particular purpose and cannot accept liability and responsibility of any kind
(whether in contract, tort or otherwise) for any expenses, losses, damages and/or costs (including indirect or consequential damage) which are or may be incurred by any party as a result of the map being inaccurate, incomplete or unsuitable in any way and for any reason.
Date 18 Feb 2019
Manildra Group Pty Ltd
Shoalhaven Starches
Maximum Predicted Cumulative Ground Level
PM10 Concentrations (24-hour Average), µg/m3
Data source: Aerial Imagery: SIXMAPS, 2018. General Topo: NSW LPI DTDB 2012. Created by:afoddy
Level 15, 133 Castlereagh Street Sydney NSW 2000 T 61 2 9239 7100 F 61 2 9239 7199 E [email protected] W www.ghd.com.au
Paper Size A4
DRAFT
!( Identified sensitive receptors
PM10 24HR concentration contour (µg/m3)20
25
30
40
Shoalhaven Starches Factory
Environmental farm boundary
Packing plant (proposed)

!(
!(
!(
!(
!(
!(!(!(!(!(!(
R1
R2
R3 R4
C1C2
C3
C4
C5 C6
C7
FLATR
OCK C
REEK
MULGEN CREEK
NOWRA CREEK
SHOALHAVEN RIVER
BOMADERRY CREEK
ABER
NETH
YSCR
EEK
HORSESHOE CRE
EK
CROOKHAVEN
CREE KJUNCTION STREET
CAMBEWARRA ROAD
WALSHCRESCENT
EAS T
STRE
ET
PEAK AVENUE
JASM
INED
RI VE
BRINA
WARRS
TREE
T
FAIRW
AY DR IVE
COCO
NUT DRIVE
BENS WALK
MOSS S TREET
PAGE AVENUE
LYND
HURS
TDRI
VE
JENN
INGS
LANE
WEST
STRE
ET
JONSSONROAD
MERO
O RO
AD
WEST CAMBEWARRA ROAD
NORTH STREETSCENIC
DRIVE
PITT STREET
DOUGLAS STREET
TERARA ROADYURUNGA DRIVE
PLUNKETT STREET
MCMAHONS ROAD
MILLB ANK ROAD
PRINCESHIG HWAY
COMERONG ISLAND ROAD
ILLAROO ROADBOLONG ROAD
Figure 10
Job Number
Revision A
21-26310
G:\21\27188\GIS\Maps\Deliverables\21_27188_SMA.mxd (SMA record: 4)
Map Projection: Transverse Mercator
Horizontal Datum: GDA 1994
Grid: GDA 1994 MGA Zone 56
0 400 800200
Metres
LEGEND
o© 2019. Whilst every care has been taken to prepare this map, GHD, ESRI, SIXMAPS, NSW LPI make no representations or warranties about its accuracy, reliability, completeness or suitability for any particular purpose and cannot accept liability and responsibility of any kind
(whether in contract, tort or otherwise) for any expenses, losses, damages and/or costs (including indirect or consequential damage) which are or may be incurred by any party as a result of the map being inaccurate, incomplete or unsuitable in any way and for any reason.
Date 18 Feb 2019
Manildra Group Pty Ltd
Shoalhaven Starches
Maximum Predicted Cumulative Ground Level
PM2.5 Concentrations (24-hour Average), µg/m3
Data source: Aerial Imagery: SIXMAPS, 2018. General Topo: NSW LPI DTDB 2012. Created by:afoddy
Level 15, 133 Castlereagh Street Sydney NSW 2000 T 61 2 9239 7100 F 61 2 9239 7199 E [email protected] W www.ghd.com.au
Paper Size A4
DRAFT
!( Identified sensitive receptors
PM2.5 24HR concentration contour (µg/m3)10
20
Shoalhaven Starches Factory
Environmental farm boundary
Packing plant (proposed)

GHD | Report for Manildra Group - Air Quality Assessment, 2127188 | 42
8.3.2 Products of combustion
The primary pollutants in coal and gas fired boiler emissions are oxides of nitrogen (NOx),
formed by the high temperatures in the combustors, sulfur dioxide (SO2), formed from the sulfur
content of the fuel, VOCs, hydrogen chloride, polycyclic aromatic hydrocarbons (PAH), carbon
monoxide (CO) and hydrogen fluoride (HF) all formed by incomplete combustion of the fuel.
All pollutants have all been assessed against their relevant criteria from the Approved Methods.
Predicted levels for SO2, NO2, carbon monoxide, hydrogen fluoride and hydrogen chloride are
provided in Table 8-9 to Table 8-13. The predicted levels comply at all receivers for SO2, CO,
HF and HCL.
The predicted levels for nitrogen dioxide exceed the criteria at all commercial/industrial sensitive
receptors. However, the predicted levels assume that 100% of NO will be converted to NO2 as
per Method 1 (Section 8.1.1) of the Approved Methods. This is considered extremely
conservative as in reality, only a fraction of the NO will be converted to NO2.
Therefore, a more detailed assessment has been undertaken for all receptors using Method 2
(Section 8.2.2) of the Approved Methods. Method 2 is based on NO reacting with ozone in the
atmosphere to form NO2. Background ozone data was sourced from Kembla Grange for the
year 2004. The calculated NO2 levels using Method 2 are provided in Table 8-10.
The NO2 levels are predicted to comply with the criteria at all sensitive receptors using method 2
of the Approved Methods.
Contour plots of cumulative SO2 predictions are shown in Figure 11.

GHD | Report for Manildra Group - Air Quality Assessment, 2127188 | 43
Table 8-9 Maximum predicted ground level Sulfur Dioxide concentrations
Receptor Total impact (Incremental plus background) (g/m3)
Criteria, µg/m3 712
(10 min1)
570
(1 hour)
228
(24 hour)
60
(Annual)
Background, µg/m3 No data2 57.6 15.7 1.6
Bomaderry (R1) 255.6 195.9 51.7 5.5
North Nowra 198.3 155.9 45.5 3.9
Nowra (R3) 269.7 205.8 42.8 2.8
Terara (R4) 174.3 139.1 26.3 2.3
C1 546.2 399.0 111.4 10.6
C2 636.5 462.2 85.7 11.3
C3 578.1 421.4 81.8 10.9
C4 477.3 350.9 85.6 10.0
C5 404.8 300.3 83.1 9.0
C6 527.9 386.3 99.7 12.2
C7 456.9 336.7 102.5 11.3
Note 1: The 10 minute concentrations were calculated from the hourly values by applying a peak to mean factor of (60/10)0.2.
Note 2: The 10 minute background levels were assumed to be the same as the 1 hour background levels in the absence of monitoring data.
Table 8-10 Maximum predicted ground level Nitrogen Dioxide
concentrations
Receptor Total impact (Incremental plus background) (g/m3)
Criteria, µg/m3 246
(1 hour, Method 1)
246
(1 hour, Method 2)
62
(Annual)
Background, µg/m3 80.8 n/a 7.1
Bomaderry (R1) 197.1 115.2 10.5
North Nowra 164.4 98.6 9.1
Nowra (R3) 203.0 116 8.2
Terara (R4) 153.8 123.8 7.8
C1 373.5 184.4 15.3
C2 419.7 153.2 16.8
C3 385.4 150.9 16.2
C4 326.1 147.3 15.2
C5 282.6 143.4 13.9
C6 364.1 149.7 17.6

GHD | Report for Manildra Group - Air Quality Assessment, 2127188 | 44
Receptor Total impact (Incremental plus background) (g/m3)
Criteria, µg/m3 246
(1 hour, Method 1)
246
(1 hour, Method 2)
62
(Annual)
Background, µg/m3 80.8 n/a 7.1
C7 325.2 142.7 16.3
Table 8-11 Maximum predicted ground level Carbon Monoxide
concentrations
Receptor Total impact (Incremental plus background) (mg/m3)
Criteria, mg/m3 100 (15 min1) 30 (1 hour) 10 (8 hour)
Background, mg/m3 No data2 1 0.6
Bomaderry (R1) 1.15 1.12 0.61
North Nowra 1.11 1.08 0.61
Nowra (R3) 1.16 1.12 0.61
Terara (R4) 1.10 1.07 0.60
C1 1.39 1.29 0.62
C2 1.45 1.34 0.62
C3 1.40 1.30 0.62
C4 1.32 1.25 0.62
C5 1.27 1.20 0.61
C6 1.37 1.28 0.62
C7 1.32 1.24 0.62
Note 1: The 15 minute concentrations were calculated from the hourly values by applying a peak to mean factor of (60/15)0.2.
Note 2: The 15 minute background levels were assumed to be the same as the 1 hour background levels in the absence of monitoring data.
Table 8-12 Maximum predicted ground level Hydrogen Fluoride
concentrations
Receptor Total impact (Incremental plus background) (g/m3)
Criteria, µg/m3 1.5 (24 hour) 0.8 (7 day) 0.4 (30 day) 0.5 (90 day)
Background, µg/m3 No data No data No data No data
Bomaderry (R1) 0.3 0.1 0.1 0.05
North Nowra 0.2 0.1 0.1 0.03
Nowra (R3) 0.2 0.0 0.0 0.02
Terara (R4) 0.1 0.0 0.0 0.01
C1 0.9 0.3 0.1 0.09
C2 0.6 0.2 0.1 0.12

GHD | Report for Manildra Group - Air Quality Assessment, 2127188 | 45
Receptor Total impact (Incremental plus background) (g/m3)
Criteria, µg/m3 1.5 (24 hour) 0.8 (7 day) 0.4 (30 day) 0.5 (90 day)
Background, µg/m3 No data No data No data No data
C3 0.5 0.2 0.1 0.11
C4 0.6 0.2 0.1 0.11
C5 0.6 0.2 0.1 0.10
C6 0.7 0.3 0.2 0.14
C7 0.7 0.3 0.2 0.13
Table 8-13 Maximum predicted ground level Hydrogen Chloride
concentrations
Receptor Averaging
Period
Incremental Impact (mg/m3)
Background Concentration
(mg/m3)
Total Impact (mg/m3)
Criteria (mg/m3)
Bomaderry (R1)
1 hour 0.0012 - 0.0012 0.14
North Nowra (R2)
1 hour 0.0011 - 0.0011 0.14
Nowra (R3) 1 hour 0.0014 - 0.0014 0.14
Terara (R4) 1 hour 0.0007 - 0.0007 0.14
C1 1 hour 0.0036 0.0036 0.14
C2 1 hour 0.0030 0.0030 0.14
C3 1 hour 0.0029 0.0029 0.14
C4 1 hour 0.0025 0.0025 0.14
C5 1 hour 0.0022 0.0022 0.14
C6 1 hour 0.0030 0.0030 0.14
C7 1 hour 0.0025 0.0025 0.14

!(
!(
!(
!(
!(
!(!(!(!(!(!(
R1
R2
R3 R4
C1C2
C3
C4
C5 C6
C7
Figure 11
Job Number
Revision A
21-26310
G:\21\27188\GIS\Maps\Deliverables\21_27188_SMA.mxd (SMA record: 6)
Map Projection: Transverse Mercator
Horizontal Datum: GDA 1994
Grid: GDA 1994 MGA Zone 56
0 400 800200
Metres
LEGEND
o© 2019. Whilst every care has been taken to prepare this map, GHD, ESRI, SIXMAPS, NSW LPI make no representations or warranties about its accuracy, reliability, completeness or suitability for any particular purpose and cannot accept liability and responsibility of any kind
(whether in contract, tort or otherwise) for any expenses, losses, damages and/or costs (including indirect or consequential damage) which are or may be incurred by any party as a result of the map being inaccurate, incomplete or unsuitable in any way and for any reason.
Date 18 Feb 2019
Manildra Group Pty Ltd
Shoalhaven Starches
Maximum Predicted Cumulative Ground Level
SO2 Concentrations (1 hour Average) , µg/m3
Data source: Aerial Imagery: SIXMAPS, 2018. General Topo: NSW LPI DTDB 2012. Created by:afoddy
Level 15, 133 Castlereagh Street Sydney NSW 2000 T 61 2 9239 7100 F 61 2 9239 7199 E [email protected] W www.ghd.com.au
Paper Size A4
DRAFT
!( Identified sensitive receptors
S02 1HR concentration contour (µg/m3)200
250
300
Shoalhaven Starches Factory
Environmental farm boundary
Packing plant (proposed)

GHD | Report for Manildra Group - Air Quality Assessment, 2127188 | 47
8.3.3 PAH, VOCs and metals
The maximum predicted (99.9 percentile, 1-hour average) ground level incremental PAH, VOC
and metal concentrations, within and beyond the factory site boundary are provided in Table
8-14. The predicted levels are significantly lower than the respective EPA principal toxic air
pollutant criteria for all substances both within and beyond the site boundary.

GHD | Report for Manildra Group - Air Quality Assessment, 2127188 | 48
Table 8-14 Maximum predicted ground level PAH, VOC and metals concentrations
Receptor Incremental Impact (mg/m3)
Pollutant PAH VOC Antimony Arsenic Cadmium Mercury Beryllium Chromium Manganese Nickel Lead
Criteria 0.0004 mg/m3
(1 hour)
Individual VOCs
(1 hour)
9.00E-03 mg/m3
(1 hour)
9.00E-05 mg/m3
(1 hour)
1.80E-05 mg/m3
(1 hour)
1.80E-03 mg/m3
(1 hour)
4.00E-06 mg/m3
(1 hour)
9.00E-05 mg/m3
(1 hour)
1.80E-02 mg/m3
(1 hour)
1.80E-04 mg/m3
(1 hour)
0.5 µg/m3 (Annual)
Bomaderry (R1)
1.54E-07 7.91E-04 1.08E-06 1.39E-06 1.39E-07 2.44E-06 2.61E-07 1.22E-06 6.95E-06 4.47E-06 4.90E-04
North Nowra (R2)
1.33E-07 7.03E-04 1.05E-06 1.37E-06 1.17E-07 2.43E-06 2.64E-07 1.17E-06 6.77E-06 4.51E-06 3.02E-04
Nowra (R3) 1.68E-07 8.77E-04 1.37E-06 1.94E-06 1.47E-07 3.62E-06 3.77E-07 1.60E-06 9.34E-06 6.50E-06 1.91E-04
Terara (R4) 8.42E-08 4.81E-04 7.16E-07 9.52E-07 7.34E-08 1.69E-06 1.80E-07 8.16E-07 4.70E-06 3.07E-06 1.21E-04
C1 4.53E-07 2.40E-03 3.62E-06 4.87E-06 3.99E-07 8.81E-06 9.32E-07 4.13E-06 2.40E-05 1.60E-05 1.33E-03
C2 3.93E-07 2.18E-03 3.05E-06 4.13E-06 3.57E-07 7.64E-06 7.88E-07 3.51E-06 2.02E-05 1.37E-05 1.42E-03
C3 3.69E-07 2.00E-03 2.81E-06 3.81E-06 3.33E-07 6.93E-06 7.25E-07 3.24E-06 1.87E-05 1.25E-05 1.33E-03
C4 3.26E-07 1.75E-03 2.43E-06 3.25E-06 2.94E-07 5.97E-06 6.19E-07 2.79E-06 1.60E-05 1.07E-05 1.19E-03
C5 2.82E-07 1.49E-03 2.00E-06 2.69E-06 2.58E-07 5.14E-06 5.14E-07 2.29E-06 1.32E-05 8.87E-06 1.01E-03
C6 3.98E-07 2.11E-03 2.90E-06 3.91E-06 3.66E-07 7.11E-06 7.44E-07 3.34E-06 1.92E-05 1.28E-05 1.59E-03
C7 3.22E-07 1.71E-03 2.34E-06 3.10E-06 2.91E-07 5.69E-06 5.85E-07 2.67E-06 1.53E-05 1.01E-05 1.40E-03
Maximum level (on site)
6.02E-07 3.61E-03 6.13E-06 8.74E-06 6.46E-07 1.74E-05 1.71E-06 7.19E-06 4.25E-05 2.97E-05 Not
applicable

GHD | Report for Manildra Group - Air Quality Assessment, 2127188
9. Conclusions
GHD was engaged by Manildra to conduct an air quality and odour impact assessment for a
proposed modification to the approved SSEP.
The proposed changes include minor modifications to boiler operations and the addition of a
new starch dryer stack.
A marginal increase was observed in predicted odour impacts as a result of the modification.
The odour criteria is met at all residential sensitive receptors and it is considered highly unlikely
that the increase in odour would be detected at sensitive receptors.
Air quality impacts are predicted to comply with the criteria at all residential sensitive receptors.
Manildra have implemented reasonable and feasible mitigation measures on site to reduce the
potential air quality impacts from the new boiler.
Overall, the proposal should be acceptable from an air quality perspective.
GHD | Report for Manildra Group - Air Quality Assessment, 2127188 | 50
10. References
Department of Environment and Conservation. (2006). Technical Framework: Assessment and management of odour from stationary sources in NSW. Sydney: NSW government
EPA. (2016). Approved Methods for the Modelling and Assessment of Air Poluutants in New South Wales. Sydney: NSW Government.
GHD. (2008). Shoalhaven Starches- Report of Ethanol Upgrade Air Quality Assessment. Melbourne VIC: GHD
GHD (2019), Shoalhaven Starches Proposed modification application MP 06_0228 Shoalhaven Starches Expansion Project, Proposed new speciality processing facility, new gluten dryer and other associated works at 22, 24 and 171 Bolong Rd, Bomaderry, NSW. Sydney NSW: GHD
National Pollutant Inventory Emission estimation technique manual for Combustion in boilers Version 3.6 (December, 2011)
Stephenson Environmental Management Australia. (2015). Modifications to Existing Flour Mill. Newington NSW: Stephenson Environmental Management Australia
Stephenson Environmental Management Australia. (2015). Modifications to Packing Plant. Newington NSW: Stephenson Environmental Management Australia
Stephenson Environmental Management Australia. (2017). Emission Test Report No. 5805 Compliance stack emission survey – Quarter no. 4, 2016-2017. Newington NSW: Stephenson
Environmental Management Australia
Stephenson Environmental Management Australia. (2017). Emission Test Report No. 5852/M Compliance stack emission survey – Quarter no. 1, 2017-2018. Newington NSW: Stephenson
Environmental Management Australia
Stephenson Environmental Management Australia. (2018). Compliance stack emission survey – commissioning (Q1) Emission Point EPL ID 42 – Serving boiler no. 4. Newington NSW:
Stephenson Environmental Management Australia
Stephenson Environmental Management Australia. (2019). EPL Odour Emission Survey Annual & Quarter 4, 2018-2019. Newington NSW: Stephenson Environmental Management Australia
The Odour Unit. (2010). Ethanol Upgrade: DDG Biofilter Commissioning & Operating Manual . Eveleigh, NSW: The Odour Unit

GHD | Report for Manildra Group - Air Quality Assessment, 2127188 | 51
Appendices

GHD | Report for Manildra Group - Air Quality Assessment, 2127188 | 52
Appendix A – Meteorological analysis

GHD | Report for Manildra Group - Air Quality Assessment, 2127188 | 53
The following section is taken from the Shoalhaven Starches Report on Ethanol Upgrade: Air
Quality Assessment (GHD, 2008), and describes the meteorology of the area and how the
dataset was compiled.
A1 Meteorology
The three-dimensional meteorological data for a CALPUFF model simulation are provided by
CALMET4, its meteorological pre-processor. CALMET requires meteorological input from
surface weather station networks and upper air stations.
The following sub-sections describe the available meteorological data, how the data was
applied and the features of the dispersion meteorological data used to run CALPUFF.
A1.1 Data Available
Wind data were collected at three locations within the Shoalhaven Starches facility. Of these
three stations, only one station, the automated weather station (AWS) located near the storage
ponds at the environmental farm (hereafter referred to as Farm AWS), is compliant with the
Australian Standard for the measurement of horizontal wind for air quality applications (AS
2923:1987). The other two stations, in particular the weather station located at the factory, are
compromised by building and equipment infrastructure. Wind data have been collected at the
Farm AWS since 2003, with the most complete data set collected in 2004.
The nearest source of additional surface meteorological data was the Bureau of Meteorology
(BoM) Nowra AWS located approximately 12 km to the west at the Royal Australian Navy base
at Nowra (HMAS ALBATROSS). This data source was considered to be too far from the
subject area to be site-representative.
The nearest source of upper air meteorological data was also the HMAS ALBATROSS site,
which does irregular upper air soundings based on operational requirements. However, the
time gap between these vertical atmospheric soundings is too large to be suitable for use as
model input.
A1.2 Data Application
To take full advantage of the CALPUFF features, described in Section 7.1, and make use of the
available meteorological data described above, a combined prognostic/diagnostic
meteorological modelling approach was used to synthesise the three-dimensional
meteorological data input required by CALPUFF.
The regional-scale prognostic meteorological model, TAPM5, was used to simulate the
meteorology over the subject site with consideration to the DECC Approved Methods. TAPM is
an approved model for specialist applications and its use, as part of this assessment, is
described in the next section.
The observations from the Farm AWS and Nowra AWS were first used for optimising and
checking the performance of the prognostic model simulation.
Wind speed and wind direction data from the Farm AWS were then assimilated into the
prognostic model.
The subsequent TAPM output (with assimilated Farm AWS data) was then passed to
meteorological pre-processor model CALMET (version 5.5).
4 Scire J.S., E.M. Insley, R.J. Yamartino, and M.E. Fernau, 1995: A User's Guide for the CALMET Meteorological Model. Report
prepared for the USDA Forest Service by EARTH TECH, Concord, MA. See: http://www.src.com/calpuff/calpuff1.htm 5 Hurley, P. The Air Pollution Model (TAPM) version 3. CSIRO Atmospheric Research Paper No. 31, 2005

GHD | Report for Manildra Group - Air Quality Assessment, 2127188 | 54
A2 Prognostic Meteorological Modelling
TAPM (version 3.0.7) was developed at CSIRO Division of Atmospheric Research as a PC-
based prognostic modelling system that can predict regional scale three-dimensional
meteorology. TAPM accesses databases of synoptic weather analyses from the Bureau of
Meteorology. The model then provides the link between the synoptic large-scale flows and local
climatology, which includes characterising such factors as local land use and topography, and
their influence on atmospheric stability and mixing height.
TAPM was initially configured with a nested model grid coverage designed to capture:
Broad scale synoptic flows
Regional to local scale wind channelling
The influence of local land use
The nested grids were then configured with surface characteristics, such as terrain elevation,
surface type (land use and vegetation type), soil type and deep soil moisture content.
Specific model settings were:
Four nested grids at 1 000 m, 3 000 m, 10 000 m and 25 000 m resolution, with 55 x 55
grid points. The grid was set to ensure the locations of the Farm AWS and Nowra AWS
were within the inner nested grid
Surface vegetation and precipitation processes were included, whereas, non-hydrostatic
processes were not included
Following an initial model run, the model output from the grid point nearest to the Farm AWS
was compared with data recorded at that station. Specifically, the predicted hourly ambient
temperatures and the annual wind rose (wind speed and direction distributions) were compared
with corresponding recordings. Model output from the model grid point nearest to the Nowra
AWS was also compared with an annual wind rose derived from data recorded at that station.
Figure A1 shows the scatter plot of observed and predicted ambient temperature at the Farm
AWS. The determined optimal model configuration produced a correlation coefficient of 0.88 for
predicted temperature. The strong correlation between predicted and recorded temperature
indicates that the model is accurately calculating the surface energy balance, which, in turn,
adds confidence to the hourly varying predictions made for atmospheric stability and the height
of the mixed layer.

GHD | Report for Manildra Group - Air Quality Assessment, 2127188 | 55
Figure A1 Scatter Plot of Observed and Predicted Ambient Temperature
A2.1 Wind Distribution
Figure A2 shows the predicted (a) and observed (b) wind roses for the location of the Nowra
AWS. The directional distribution of winds predicted by TAPM shows reasonable agreement
with the recorded observations and with the wind patterns expected for this region.
Figure A3 shows the predicted (a) and observed (b) wind roses for the location of the Farm
AWS after the initial TAPM simulation. The directional distribution of winds predicted by TAPM
shows reasonable agreement with the recorded wind patterns expected for this region.
The wind speed and direction observations from the Farm AWS were assimilated into the
prognostic model simulation to improve the ability of the model to capture the effects of local
wind channelling and low wind speed conditions. The improvement to wind direction
distributions in the model output is clearly evident in Figure A3(c). The marked improvement in
the capture of low wind events is examined below.
It is understood that TAPM performs reasonably well at simulating low wind speeds when the
atmosphere is unstable but is known to perform relatively poorly during stable atmospheric
conditions6. This is a critical factor in this assessment given that odour emissions occur 24-
hours per day, resulting in predictions of maximum odour impact dominating during these
conditions.
Figure A4 shows a histogram of wind speed distribution for observations at the Farm AWS,
predictions from TAPM and predictions from TAPM after wind speed and direction data from the
Farm AWS were assimilated into TAPM. It is clear from this figure that TAPM did reasonably
well at originally predicting moderate to high wind speeds but did relatively poorly predicting low
wind speeds. However, Figure A4 also shows that the representation of low winds in the TAPM
output was significantly improved once the Farm AWS data were assimilated into the model.
6 Luhar, A., Hurley, P. and Rayner, K. Improving Land Surface Processes in TAPM. Part 2: Low Wind Stable Conditions. 14th
IUAPPA World Congress 2007
y = 1.004xR² = 0.7791
0
5
10
15
20
25
30
35
40
0 5 10 15 20 25 30 35 40
Pre
dic
ted
tem
pe
ratu
re (
oC
)
Observed temperature (oC)

GHD | Report for Manildra Group - Air Quality Assessment, 2127188 | 56
Figure A2 Nowra AWS - Annual Wind Roses (Year 2004)
TAPM output at Nowra AWS grid point Recorded at Nowra AWS
Legend
Project No.:
22/13594

GHD | Report for Manildra Group - Air Quality Assessment, 2127188 | 57
a) TAPM output at Farm AWS b) Recorded at Farm AWS
c) TAPM output at Farm AWS grid point after Farm AWS data assimilated
Legend
Project No.:
22/13594
Figure A3 Farm AWS - Annual Wind Roses (year 2004)

GHD | Report for Manildra Group - Air Quality Assessment, 2127188 | 58
Figure A4 Wind Speed Distribution – TAPM and Farm AWS
To further investigate the effect of data assimilation on model output, a sensitivity analysis was
conducted to compare the subsequent CALPUFF model predictions using meteorological input
derived with and without the assimilation of observed wind speed and wind direction data from
the Farm AWS into TAPM. Good agreement was found in the general pattern of dispersion (i.e.
similar directions of poor dispersion), however, the highest ground level odour concentrations
were predicted when the assimilated meteorological data file was used, which was expected
given the higher frequency of light winds.
A3 Diagnostic Meteorological Model - CALMET
The TAPM output (with assimilated data) was then passed to model CALMET (version 5.5)7,
which is the 3D meteorological diagnostic model pre-processor to the CALPUFF 3D puff based
dispersion model.
Hourly varying 3D meteorological data, at a 1000 m resolution, were extracted from the TAPM
inner nested grid and passed to CALMET in their entirety as initial guess fields. Surface
meteorological parameters and vertical profile data were also extracted from TAPM at a grid
point near the factory, and used as if they were observations in the diagnostic model (i.e.
pseudo-data).
CALMET was configured with a 15 km by 15 km grid at 200 m resolution and with local scale
surface characteristics, such as terrain elevation and land use (e.g. forest or sparse growth,
water or residential). The land use and terrain elevation information was derived from US
Geological Survey and AusLig data, respectively, with adjustments based upon inspection of
aerial photographs, topographical and land uses maps, and a site inspection.
CALMET was used to produce hourly site-representative winds and micrometeorological
information, which was used with the CALPUFF 3D puff-based dispersion model to assess the
impacts of the air pollutants on the surrounding land uses.
7 Scire J.S., E.M. Insley, R.J. Yamartino, and M.E. Fernau, 1995: A User's Guide for the CALMET Meteorological Model. Report
prepared for the USDA Forest Service by EARTH TECH, Concord, MA. See: http://www.src.com/calpuff/calpuff1.htm
0%
10%
20%
30%
40%
50%
60%
70%
<1m/s 1 to 2m/s 2 to 5 m/s 5 to 8 m/s >8m/s
Fre
qu
en
cy
Wind speed
AWS
TAPM
TAPM with AWS dataassimilated

GHD | Report for Manildra Group - Air Quality Assessment, 2127188 | 59
A3.1 Site-specific meteorology
Figure A5 shows a wind rose that illustrates the distribution of wind speed and direction at the
location of the Factory. On an annual basis the prevailing winds are from the west with winds
also from the west-north-west, north-west, west-south-west and north-east. The mean wind
speed is 3.2 m/s, with higher speed winds associated with westerly winds with speeds up to
11 m/s; such speeds are not reached from other directions. The highest frequency of light
winds occurs from the south-west, west and north.
Figure A6 provides a seasonal breakdown of the predicted wind distribution at the Factory, this
figure reveals a north-easterly predominance during summer (sea-breeze) and a westerly
predominance during the other seasons, in particular during winter.
Legend
Comments: Average wind speed = 3.2 m/s
Project
No.:
22/13594
Figure A5 Factory Annual Wind Rose - Year 2004

GHD | Report for Manildra Group - Air Quality Assessment, 2127188 | 60
Figure A6 Factory Seasonal Wind Roses - Year 2004
Spring (average wind speed = 3.1 m/s) Summer (average wind speed = 2.8 m/s)
Autumn (average wind speed = 2.8 m/s) Winter (average wind speed = 4.1 m/s)
Legend
Project No.:
22/13594

GHD | Report for Manildra Group - Air Quality Assessment, 2127188 | 61
A categorised measure of atmospheric stability is also output from the model. These can be
broadly defined as listed in Table A1.
Table A1 Atmospheric Stability Classes and Distribution
Stability Class
Description Frequency of Occurrence 1
A Extremely unstable atmospheric conditions, occurring near the middle of day, with very light winds, no significant cloud.
2%
B Moderately unstable atmospheric conditions occurring during mid-morning/mid-afternoon with light winds or very light winds with significant cloud.
14%
C Slightly unstable atmospheric conditions occurring during early morning/late afternoon with moderate winds or lighter winds with significant cloud.
17%
D Neutral atmospheric conditions. Occur during the day or night with stronger winds. Or during periods of total cloud cover, or during twilight (transition) period.
22%
E Slightly stable atmospheric conditions occurring during the night-time with some cloud and/or light-moderate winds.
12%
F Moderately stable atmospheric conditions occurring during the night-time with no significant cloud and light winds.
32%
1. Stability data in this table extracted from Factory meteorological data
Potential off-site odour impact would tend to be maximised when winds are light and the
atmosphere is stable, conditions that typically occur during the early evening and night-time.
Table A1 shows that these conditions occurred for approximately 44% of the time.
The occurrence of stable air flows is of significance as these generally provide the conditions for
worst case dispersion of emissions to air from ground based (or near-ground based) sources,
and hence potentially the highest impact to odour amenity. This is due to the limited mixing in
the vertical plane of these light wind airflows, and hence less dilution of the emissions from the
majority of odour sources, which are either at ground level or wake affected short stacks.
Therefore, the distribution of light wind stable flows can define the directions of “poor odour
dispersion” from the factory and environmental farm.
Vertical mixing of airflows can be brought about by two mechanisms. The first is mechanical
mixing caused by the shear stresses as air moves over rough terrain. The second is via thermal
convective mixing, which has the potential to occur significantly only during daytime. The
occurrence of unstable and strong-wind neutral air flows generally provide the conditions for the
highest ground level concentrations due to emissions to air from elevated stack sources, such
as the coal-fired boiler exhaust stacks found at the factory.
A rose that illustrates the directional distribution of the predicted atmospheric stability is shown
in Figure A7. During these stable periods, the regional scale cool air drainage flows down the
river valley from the west to dominate the transport and dispersion of emissions to air from the
factory and environmental farm. To a lesser extent, local slope drainage flows from the
elevated terrain located to the north, west-north-west and west-south-west of the site would also
generate these conditions for poor dispersion.

GHD | Report for Manildra Group - Air Quality Assessment, 2127188 | 62
All stability classes E & F Stability classes
(stable conditions only)
Legend
Stability
Class
Comments: Location of Factory
Project No.:
22/13594
Figure A7 Factory Annual Stability Rose - Year 2008

GHD | Report for Manildra Group - Air Quality Assessment, 2127188 | 63
Appendix B – Complete odour emission inventory
The following Table details all sources modelled for both the existing and proposed modifications

GHD | Report for Manildra Group - Air Quality Assessment, 2127188
Source EPA ID
ID Source type Height, m
Diameter, m
Exit velocity, m/s
Exit temperature K
OER after control, OUm3/s
Peak to mean adjusted total OER OUm3/s
Boiler No. 4 42 BOILR4 tall wake free 39 1.1 17.6 429 22077.2 var
Combined Boiler Stack for No. 5 & 6 Boilers. Coal combustion odour
35 BOILR5 tall wake free 54 2.05 15 413 68609.7 var
Additional cooling towers to the west
CTP wake affected 10 4.5 6 295 172.0 395.6
Cooling towers DDG46 wake affected 10 4.5 6 295 172.0 395.6
Light phase recovery tank DDG19 wake affected 11 0.1 3.3 362 20.0 46.0
Pellet Mill Silo (proposed) PMFS wake affected 23 0 0 0 173.0 397.9
Pellet Plant exhaust stack 46 PPES tall wake free 49.2 1.5 15.5 318 88073.3 var
Pellet silo (mill feed silo) S12 wake affected 2 0.3 0.1 304 350.0 805.0
Stillage surge tank SST wake affected 2 0.2 3.3 360 149.0 342.7
Vent condensor drain VCD wake affected 24.1 0.3 0.3 300 31.0 71.3
Ethanol Recovery Scrubber Discharge
16 ERESC wake affected 28 0.3 7.9 299.6 15405.4 35432.4
Fermenters (10-16) 44 FERM tall wake free 21 0.28 2.4 301 795.0 1828.5
Yeast propagators - tanks 4 & 5 YP45 wake affected 17 0.4 3 310.4 820.0 1886.0
Cyclone and fabric filter A4 wake affected 33 1.6 6 313 679.0 1561.7
Cyclone and fabric filter A5 wake affected 33 1.6 6 313 96.0 220.8
Cyclone and fabric filter A6 wake affected 33 1.6 6 311 449.0 1032.7
Cyclone and fabric filter A7 wake affected 33 0.8 9 297 932.0 2143.6
Drum vacuum receiver C4 wake affected 21 0.2 11 319.5 1400.0 3220.0
Dry gluten roof bin S07 wake affected 25 0.7 0.1 328 4500.0 10350.0
Enzyme Tanks B7 wake affected 6 0.5 0.3 327 2042.0 4696.6
Feed transfer to distillery E22 wake affected 15 0.3 0.1 300 83.0 190.9
Flash Vessel Jet Cooker C1 wake affected 21 0.1 0.1 350 970.0 2231.0
Flour bin aspirator S13A wake affected 2.5 0.4 0.1 306 500.0 1150.0
Flour bin aspirator S13B wake affected 2.5 0.4 0.1 306 500.0 1150.0

GHD | Report for Manildra Group - Air Quality Assessment, 2127188 | 65
Source EPA ID
ID Source type Height, m
Diameter, m
Exit velocity, m/s
Exit temperature K
OER after control, OUm3/s
Peak to mean adjusted total OER OUm3/s
Flour bin motor drive S06 wake affected 24 0.3 0.1 307 283.0 650.9
Flour mill stack propsed and approved 1
FMP2 wake affected 31.8 0.68 4.4 320 266.0 611.8
Flour mill stack propsed and approved 2
FMP1 wake affected 33.4 0.9 4.2 300 205.0 471.5
Retention - tank 2 (now located in adjacent tank)
GRT wake affected 21 0.25 0.1 293 3250.0 7475.0
High protein dust collector S08 wake affected 24.5 0.4 0.1 316 600.0 1380.0
Incondensible gases vent D6 wake affected 13 0.2 0.6 309 558.0 1283.4
Ion exchange effluent tank C18 wake affected 2.5 0.32 0.1 307 250.0 575.0
Jet cooker 1 - retention tank E13 wake affected 10 0.2 0.1 362 1067.0 2454.1
Jet cooker 2 & 4 - Retention E7 wake affected 9 0.1 2.2 373 567.0 1304.1
Molecular Sieve - Vacuum drum D2 wake affected 10 0.1 13 337 1350.0 3105.0
No. 1 Gluten Dryer baghouse 8 S02 wake affected 25.5 3.2 0.1 345.5 5166.0 11881.8
No. 1 Starch Dryer 12 S01 wake affected 26 1.3 8.4 317.6 11316.0 26026.8
No. 2 Gluten Dryer baghouse (aka. No 2 Starch Dryer)
9 S04 wake affected 27 3.2 0.1 342.2 5166.0 11881.8
No. 3 Gluten Dryer baghouse 10 S03 wake affected 21 2.5 9.7 353.8 21696.0 49900.8
No. 3 Starch Dryer 13 S18 wake affected 20 1.2 21.2 318.3 5166.0 11881.8
No. 4 Gluten Dryer baghouse 11 S05 wake affected 30 2.7 17.1 348.8 13692.7 31493.1
No. 4 Starch Dryer 14 S19 wake affected 20 1.2 20.8 315.8 5020.0 11546.0
No. 5 Ring Dryer Starch SDR5 wake affected 25 1.2 0.1 320 4817.0 11079.1
No. 5 Starch Dryer (existing) 47 SD5C wake affected 33.5 2.35 15.4 341.4 3392.9 7803.7
No. 5 Starch Dryer (new) SD5N wake affected 30 2.35 15.4 341.4 17387.1 39990.3

GHD | Report for Manildra Group - Air Quality Assessment, 2127188 | 66
Source EPA ID
ID Source type Height, m
Diameter, m
Exit velocity, m/s
Exit temperature K
OER after control, OUm3/s
Peak to mean adjusted total OER OUm3/s
No. 6 Gluten Dryer GD6 wake affected 35 1.7 22.4 346.2 12568.0 28906.4
No. 7 Gluten Dryer GD7 wake affected 29 1.7 18.9 341.2 9553.0 21971.9
Spray dryer S20 wake affected 19 1.4 0.1 335 738.0 1697.4
Starch factory rejects collection tank
E10 wake affected 8 0.1 0.1 308 183.0 420.9
Large Starch Silo 1 PPL1 wake affected 26.5 0.16 6.8 323.2 86.4 198.8
Large Starch Silo 2 PPL2 wake affected 26.5 0.16 6.8 323.2 86.4 198.8
Medium Gluten Silo 1 PPM1 wake affected 20.7 0.16 6.8 323.2 173.0 397.9
Medium Gluten Silo 2 PPM2 wake affected 20.7 0.16 6.8 323.2 173.0 397.9
Medium Gluten Silo 3 PPM3 wake affected 20.7 0.16 6.8 323.2 173.0 397.9
Small Gluten Silo PPS1 wake affected 34.3 0.2 18.6 323.2 91.6 210.6
Small Starch Silo PPS2 wake affected 34.3 0.2 18.6 323.2 35.0 80.5
Biofilter A 40 BIO1 area 1386.0 var
Biofilter B 41 BIO2 area 1111.0 var
Biofilter C BIO3 area 1089.0
Biofilter D BIO4 area 1280.0
Effluent storage dam 1 19 PO1 area 118.5 var
Effluent storage dam 2 20 PO2 area 143.1 var
Effluent storage dam 3 21 PO3 area 1231.2 var
Effluent storage dam 5 23 PO5 area 1921.8 var
Effluent storage dam 6 24 PO6 area 793.1 var
Sulphur Oxidisation Basin 25 SOBAS area 535.0 var
Membrane bio-reactor MBR wake affected 62.4
DDG load out shed - awning DDG35 volume 923.0 2122.9
DDG product storage sheds DDG34 volume 1023.0 2352.9
DDG tent storage area DDG36 volume 1929.0 4436.7

GHD | Report for Manildra Group - Air Quality Assessment, 2127188 | 67
Source EPA ID
ID Source type Height, m
Diameter, m
Exit velocity, m/s
Exit temperature K
OER after control, OUm3/s
Peak to mean adjusted total OER OUm3/s
Pellet plant fugitives (discharged direct to atmosphere)
PPF wake affected 5771.0 13273.3
Farm tank F18 volume 3834.0 8818.2
Column washing vent CWV wake affected 6.8 0.5 0.1 300 27.0 62.1
Flour Mill B FMBA wake affected 39.5 0.65 10.1 322 560.0 1288.0
Flour Mill B FMBB wake affected 39.5 0.65 6.53 294 1260.0 2898.0
Flour Mill B FMBC wake affected 39.5 0.65 10.1 322 1260.0 2898.0
Flour Mill B FMBD wake affected 39.5 1.1 8.77 300 257.0 591.1
Flour Mill B FMBE wake affected 39.5 1.1 8.77 300 642.0 1476.6
Flour Mill B FMBF wake affected 39.5 0.65 10.1 322 642.0 1476.6
Flour Mill C FMC1 wake affected 37.6 0.65 10.1 322 678.8 1561.2
Flour Mill C FMC2 wake affected 37.6 0.65 6.53 294 300.0 690.0
Flour Mill C FMC3 wake affected 37.6 0.65 10.1 322 678.8 1561.2
Gluten dryer no. 8 GD8 wake affected 29 1.9 22.4 346.2 12568.0 28906.4


GHD
Level 15 133 Castlereagh Street T: 61 2 9239 7100 F: 61 2 9239 7199 E: [email protected]
© GHD 2019
This document is and shall remain the property of GHD. The document may only be used for the purpose for which it was commissioned and in accordance with the Terms of Engagement for the commission. Unauthorised use of this document in any form whatsoever is prohibited.
2127188-79656/https://projects.ghd.com/oc/Sydney1/airqualityassessment/Delivery/Documents/2127188-REP_A-Modification17_AQ_Assessment_2019.docx
Document Status
Revision Author Reviewer Approved for Issue
Name Signature Name Signature Date
0 P Pandey E Smith
E Smith
02/12/2019

www.ghd.com


