
Mapping Dysregulated Metabolic Pathways in Cancer Using Functional Metabolomic Platforms
By
Daniel Isaac Benjamin
A dissertation submitted in partial satisfaction of the
Requirements for the degree of
Doctor of Philosophy
in
Molecular and Biochemical Nutrition
in the
Graduate Division
of the
University of California, Berkeley
Committee in charge: Professor Daniel K. Nomura, Chair
Professor Joseph L. Napoli Professor Jen Chywan Wang Professor David F. Savage
Spring 2015

1
ABSTRACT
Mapping Dysregulated Metabolic Pathways in Cancer Using Functional Metabolomic Platforms
By
Daniel Isaac Benjamin
Doctor of Philosophy in Molecular and Biochemical Nutrition
University of California, Berkeley
Professor Daniel K. Nomura, Chair
Cancer cells possess fundamentally altered metabolic pathways that provide a foundation to support tumorigenicity and malignancy. Our understanding of the biochemical underpinnings of cancer has benefited from the integrated utilization of large-scale profiling platforms (e.g., genomics, proteomics, and metabolomics), which, together, can provide a global assessment of how enzymes and their parent metabolic networks become altered in cancer to fuel tumor growth. In chapter one, we present several examples of how these integrated platforms have yielded fundamental insights into dysregulated metabolism in cancer. We will also discuss questions and challenges that must be addressed to more completely describe, and eventually control, the diverse metabolic pathways that support tumorigenesis. In chapters two and three, using genomic and functional metabolomic platforms, we elucidate the role of two novel metabolomic pathways in promoting the aggressive features of cancer. In chapter two, we show that inositol phosphate recycling can fuel cancer aggressiveness by controlling both glycolytic and lipid metabolism. In chapter three, we use functional metabolomics to discover that the ether lipid generating enzyme, AGPS, is both necessary and sufficient to promote cancer malignancy by maintaining the balance between structural and signaling lipids in the cell. Taken together these studies not only highlight the application of genomics and functional metabolomics in uncovering novel metabolomic pathways that drive cancer malignancy, but they also pave the way for the development of novel metabolism-based

2
chemotherapeutic strategies that may some day be used in the clinic to treat malignant human cancers.

i
DEDICATION
To my friends and family

ii
TABLE OF CONTENTS Chapter One: Global Profiling Strategies for Mapping Dysregulated Metabolic 1 Pathways in Cancer Introduction 2 The Regulation of Pyruvate Kinase and its Role in Glucose Metabolism in Cancer 2
Aberrant Amino Acid and TCA Cycle Metabolism Underlying Cancer 5
Dysregulated Lipid Metabolism that Supports Cellular Membrane Biosynthesis and Oncogenic Lipid Signaling Pathways 8 Challenges in the Field of (Cancer) Metabolism 10
Conclusions 12 Chapter Two: Inositol Phosphate Recycling Regulates Glycolytic and Lipid 14 Metabolism that Drives Cancer Aggressiveness
Introduction 15
INPP1 Activity is Upregulated in Aggressive Cancer Cells and Primary Human Tumors 15
Disruption of INPP1 Impairs Cancer Pathogenicity 16
INPP1 Controls the Levels of Glycolytic Intermediates and Oncogenic Signaling Lipids 16 INPP1 Exerts Control over Glycolytic Metabolism and Glucose-Derived LPA Synthesis in Cancer Cells 17
Regulation of Glycolytic Metabolism and Cancer Cell Pathogenicity by LPA 18

iii
Conclusions 19 Materials and methods 20
Chapter Three: The Ether Lipid Generating Enzyme AGPS Alters the Balance of 26 Structural and Signaling Lipids to Fuel Cancer Pathogenicity
Introduction 27
Cancer Cells Exhibit Heightened AGPS Expression and Ether Lipid Metabolism 27 AGPS is a Critical Enzyme in Cancer Pathogenicity 28 Functional Metabolomics Reveals Widespread Alterations in Cellular Lipid Levels Upon AGPS Knockdown or Overexpression 29 Isotopic Fatty Acid Tracing Reveals Alterations in Arachidonate Utilization Upon Inactivation of AGPS 30 AGPS Affects Cancer Pathogenicity through Multiple Lipid Signaling Pathways 30 Conclusions 31 Materials and Methods 32 Chapter Four: Conclusion 35

iv
LIST OF FIGURES Figure 1-1. Dysregulated Metabolic Pathways in Cancer 38 Figure 1-2. Discovering PKM2 as a Phosphopeptide Binding Protein. 40 Figure 1-3. Metabolic Flux Analysis Reveals Dysregulated Cell Metabolism 41 Figure 1-4. Functional Genomic approach to Discover PHGDH 43 Figure 1-5. Activity-Based Protein Profiling (ABPP) Coupled with Untargeted Metabolomics in Annotating Dysregulated Enzyme Activities in Aggressive Cancers 44 Figure 2-1. Phenotypic effects of knocking down INPP1 and HYI. 46 Figure 2-2. INPP1 is highly expressed in aggressive cancer cells and primary Tumors 48 Figure 2-3. INPP1 inactivation leads to impairments in cancer pathogenicity 50 Figure 2-4. Metabolomic profiling links INPP1 to glycolysis and lipid metabolism 52 Figure 2-5. Metabolomic profiling of two individual siINPP1 oligonucleotides and metabolomics of INPP1 rescue in siINPP1 cells 54 Figure 2-6. Overexpression of INPP1 in SKOV3 Cells 55 Figure 2-7. INPP1 modulates glycolytic and glucose-derived LPA metabolism 56 Figure 2-8. Establishing time-course for reaching steady-state isotopic labeling with [13C]glucose in SKOV3 cells 58 Figure 2-9. Full isotopomer analysis of [13C]glucose labeling in SKOV3 cells upon INPP1 knockdown 59 Figure 2-10. GLUT expression upon modulation of INPP1 expression 60 Figure 2-11. LPA modulates the migratory defects and glycolytic impairments conferred by INPP1 knockdown 61 Figure 2-12. AKT and MAP kinase signaling pathways in INPP1 knockdown SKOV3 cells 63
v
Figure 2-13. INPP1 knockdown affects the Hippo transducer YAP 64 Figure 3-1. AGPS is highly expressed in aggressive cancer cells, primary human tumors, and RAS-transformed cells 65 Figure 3-2. AGPS expression and ether lipid levels in cancer cells 67 Figure 3-3. AGPS ablation leads to impairments in breast cancer pathogenicity 69 Figure 3-4. Lipidomic profiling of KIAA1363 inhibition in BMDMs 70 Figure 3-5. Metabolomic profiling of AGPS knockdown breast cancer cells 72 Figure 3-6. Quantification of LPAe and LPAp levels in cancer cells 74 Figure 3-7. Metabolomic profile of melanoma cancer cells upon AGPS inactivation 75 Figure 3-8. Metabolite levels that are altered upon AGPS Overexpression 77 Figure 3-9. AGPS fuels cancer pathogenicity in breast cancer cells through altering fatty acid utilization to favor the generation of oncogenic signaling lipids 79 Figure 3-10. Phenotypic rescue of AGPS knockdown by LPAe and palmitic acid 81 Figure 3-11. Heightened pathogenic effects conferred by AGPS overexpression are reversed by a LPA receptor antagonist 82 Figure 3-12. LPCAT1 expression is elevated in primary human breast tumors. 83
vi
LIST OF ABBREVIATIONS
PKM2 protein kinase M2 SILAC stable isotope labeling of amino acids in culture
GSH reduced glutathione EGFR epidermal growth factor receptor
PHD3 prolyl hydroxylase 3 HSQC heteronuclear single quantum coherence
PHGDH phosphoglycerate dehydrogenase KEGG Kyoto encyclopedia of genes TCA tricarboxylic acid cycle NADPH nicotinamide adenine dinucleotide phosphate IDH1 isocitrate dehydrogenase 1 2-HG 2-hydroxyglutarate AML acute myeloid leukemia VHL Von Hippel-Lindau NMR nuclear magnetic resonance LC/MS liquid chromatography/mass spectrometry Hif-1 hypoxia inducible factor 1 NAA N-acetylated amino acids ER estrogen receptor LPA lysophosphatidic acid FASN fatty acid synthase MAGL monoacylglycerol lipase

vii
ABPP activity based protein profiling DMP discovery metabolite profiling FFA free fatty acid PGE2 prostaglandin E2
LPL lipoprotein lipase
FABP4 fatty acid binding protein 4 CSC cancer stem cell PAF platelet activating factor EMT epithelial-to-mesenchymal INPP1 inositol polyphosphate phosphatase 1 HYI hydroxypyruvate isomerase PI3K phosphatidylinositol-4,5-bisphosphate 3-kinase MAPK mitogen activated protein kinase HRAS Harvey rat sarcoma viral oncogene homolog siRNA small interfering RNA SRM single reaction moitoring IP inositol phosphate Glucose-6-P glucose-6 phosphate G3P glyceraldehyde-3 phosphate DHAP dihydroxyacetone phosphate Glycerol-3P glycerol-3 phosphate LPAe LPA-ether fructose-1,6-BP fructose-1,6-bisphosphate

viii
fructose-6P fructose-6 phosphate IP5 inositol-5 phosphate IP6 inositol-6 phosphate
GLUT1 glucose transporter 1
GLUT4 glucose transporter 4 HK2 Hexokinase 2 HK1 Hexokinase 1 PGI phosphoglucoseisomerase 2DG 2-deoxyglucose p-AKT phosphorylated AKT p-ERK phosphorylated ERK p-YAP phosphorylated YAP AGPS alkylglycerone phosphate synthase ER(+)/PR(+) monoacylglycerol PAe phosphatidic acid-ether PCe phosphatidylcholine-ether LPCe lysophosphatidylcholine-ether PSe phosphatidylserine-ether PGe phosphatidylglycerol-ether LPGe lysophosphatidylglycerol-ether Pep phosphatidylethanolamine-plasmalogen MAGe monoalkylglycerol ether LPEp lysophosphatidylethanolamine-plasmalogen
ix
PCp phosphatidylcholine-plasmalogen PSp phosphatidylserine-plasmalogen LPE lysophosphatidylethanolamine LPC lysophosphatidylcholine
qPCR quantitative polymerase chain reaction PLA2G4A cytosolic phospholipase A2 PTGS2 cyclooxygenase 2 EP2 Prostaglandin E2 LPCAT1 lysophosphatidylcholine acyltransferase 1
x
Acknowledgements
Adapted with permission from Cell Metabolism, Volume 16, issue 5 p565–577, 7 November 2012 Daniel I. Benjamin, Benjamin F. Cravatt, and Daniel K. Nomura, “Global Profiling Strategies for Mapping Dysregulated Metabolic Pathways in Cancer” Copyright © 2012 with permission from Elsevier Also adapted with permission from ACS Chemical Biology, Volume 9, Chapter 6, Daniel I. Benjamin, Sharon M. Louie, Melinda M. Mulvihill, Rebecca A. Kohnz, Daniel S. Li, Lauryn G. Chan, Antonio Sorrentino, Sourav Bandyopadhyay, Alyssa Cozzo, Anayo Ohiri, Andrei Goga, Shu-Wing Ng, and Daniel Nomura. “Inositol Phosphate Recycling Regulates Glycolytic and Lipid Metabolism That Drives Cancer Aggressiveness”, pg.1340-1350. Copyright © 2014 American Chemical Society. Also adapted with permission from PNAS, Volume 110, no.37, Daniel I. Benjamin, Alyssa Cozzo, Xiodan Ji, Lindsay S Roberts, Sharon M. Louie, Melinda M.Mulvihill, Kunxin Luo, and Daniel Nomura. “Ether lipid generating enzyme AGPS alters the balance of structural and signaling lipids to fuel cancer pathogenicity”, pg. 14912–14917 Copyright © 2013 National Academy of Sciences of the United States of America.

1
CHAPTER ONE
Global Profiling Strategies for Mapping Dysregulated Metabolic Pathways in Cancer

2
Introduction It has been known for the last century that cancer cells have fundamentally altered metabolic pathways that contribute to their tumorigenic and malignant features. Understanding the full extent of altered metabolism in cancer and its relevance to disease pathogenesis requires the advancement of technologies to identify altered enzymes and metabolites in cancer. This chapter will discuss how large-scale profiling methods, such as genomics, proteomics, and metabolomics have been used to elucidate metabolic pathways that drive tumorigenesis and metastasis. Not only have these large-scale endeavors been useful in providing fundamental insights into the basic biochemistry that defines cancer cells, but they have also led to the discovery of potential targets for cancer therapy. Fundamental to the proliferation of a transformed cell is the ability to rapidly and robustly synthesize essential biomolecules required for cell growth and division. The study of cancer metabolism has therefore primarily focused on pathways that, when altered, can lead to the aberrant production or consumption of essential biomolecules such as glucose, amino acids, nucleotides, and lipids (1). Beyond the synthesis of biomolecules, studies have also shown that cancer cells can rewire, transcriptionally upregulate, and mutationally activate metabolic pathways that produce oncogenic signaling molecules that in turn fuel tumor growth and malignancy (2–4). For many of these pathways, large-scale profiling platforms and innovative discovery-based approaches have played critical roles in uncovering previously unrecognized connections to cancer pathogenicity. This chapter will examine each of the primary metabolic pathways that have been elucidated so far in cancer and will discuss the large scale profiling efforts that have made these discoveries possible. At the end of this chapter, we will also discuss challenges facing the field of cancer metabolism. The Regulation of Pyruvate Kinase and its Role in Glucose Metabolism in Cancer In 1929, Otto Warburg noted that transformed cells consume glucose at an abnormally high rate (5). However, rather than leading to an increase in cellular energy via the citric acid cycle, Warburg showed that this increased glycolytic flux instead leads to the production of lactate, even under non-hypoxic conditions (5). While this “Warburg effect” appeared to be an irrefutable and universal property of most cancer cells, what had remained enigmatic for some time was the reason for and mechanism by which cancer cells adopt this switch to aerobic glycolysis. Nearly 80 years later, critical insights have been made demonstrating how cancer cells exhibit multiple additional levels of regulation on glycolysis, which collectively divert carbon from glucose towards the synthesis of molecular building blocks such as amino acids, nucleic acids, and lipids, for the purpose of generating ample protein, DNA, and cellular membranes for proliferation. Many of these discoveries have been made with the help of innovative large-scale genomic, proteomic, and metabolomic profiling platforms that have allowed scientists to delve deeper into aspects of cancer metabolism. Christofk et al. in 2008 demonstrated that a single switch of pyruvate kinase from the M1 (PKM1) to M2 (PKM2) splice isoform is sufficient to shift cellular metabolism to favor aerobic glycolysis (6). They then further showed that PKM2-expressing cells consume less oxygen and produce more lactate

3
than PKM1-expressing cells and that replacement of PKM2 with PKM1 in cancer cells quite provocatively reverses this metabolic phenotype that embodies the Warburg effect (6). Christofk et al went further to develop cells that stably express mouse PKM1 or PKM2 in the human lung cancer cell line H1299 in the background of knocking down endogenous PKM2. Quite provocatively, mice injected with the PKM1 cells showed a significant delay in tumor development as compared with those injected with PKM2-expressing cells, which developed much larger tumors. These studies showed that PKM2 expression provides a selective growth advantage for tumor cells in vivo prompting investigations into the metabolic and regulatory mechanisms behind the action of PKM2 in cancer. Subsequent proteomic studies have uncovered that PKM2, unlike PKM1, cannot constitutively maintain its active tetrameric structure due to multiple additional levels of post-translational regulation found specifically on PKM2 that leads to overall decreased pyruvate kinase activity (7–10) (Figure 1-1). When searching for phosphotyrosine (pTyr)-binding proteins from cell lysates using a SILAC (stable isotope labeling of amino acids in cell culture)-based quantitative proteomic enrichment strategy with a phosphotyrosine peptide library affinity matrix, Christofk et al found that PKM2 selectively and directly binds to phosphotyrosine peptides, resulting in the displacement of the activating cofactor fructose-1,6-bisphosphate, thereby inhibiting PKM2 activity (8). Christofk et al labeled HeLa cells with heavy isotopic 13C-lysine and 13C-arginine or normal isotopic 12C-lysine and 12C-arginine, followed by enrichment of phosphotyrosine binding proteins by flowing heavy cell lysates over a phosphotyrosine peptide library versus light cell lysates over a corresponding unphosphorylated peptide library. Upon proteomic analysis, pyruvate kinase was among proteins that exhibited a significantly higher SILAC heavy to light ratio (8) (Figure 1-2). The authors then showed that a mutant form of PKM2 that can no longer bind phosphotyrosine peptides and thereby exhibits greater PKM2 activity, leads to enhanced oxygen consumption and decreased lactate production, and that PKM2-expressing cells divert upstream glycolytic intermediates to an anabolic, rather than catabolic fate. In 2009, using a phosphoproteomic strategy of enriching tyrosine-phosphorylated peptides, Hitosugi et al found that PKM2 is also phosphorylated by signaling conferred by the oncogenic fibroblast growth factor receptor type 1, which in turn also inhibits the formation of the active tetrameric form of PKM2 by disrupting its interaction with fructose-1,6-bisphosphate. The authors then demonstrated that a mutant form of PKM2 that is incapable of becoming phosphorylated leads to lactate reduction and increased oxygen consumption—a metabolic feature also observed when PKM2 is replaced with the constitutively active PKM1 (9). A recent study has provided yet another mode of regulation upon PKM2 that leads to a diversion of glycolytic flux. Anastasiou et al., 2011 showed that Cys358 on PKM2 is an oxidative sensor that becomes oxidized to inhibit PKM2 activity (7). This inhibition of PKM2 activity then leads to the build-up of glucose-6-phosphate, which can subsequently get diverted to the pentose phosphate pathway to generate sufficient antioxidant response, via the reduction of glutathione, for the cancer cell (Figure 1-1). The authors showed that a C358S mutant of PKM2 leads to decreased glutathione (GSH) and increased oxidative stress, leading to impairments in proliferation and tumor xenograft growth (7). Lv et al recently also identified an
4
acetylated lysine on PKM2, using a proteomic strategy in which the authors immunoprecipitated acetyl-lysine peptides from tryptically-digested cytosolic proteomes of LNCaP prostate cancer cells and primary prostate tumors (10), and analyzed eluting peptides by LC-MS/MS. The authors showed that K305 acetylation on PKM2 is stimulated by glucose and inhibits PKM2 activity through subsequent autophagic degradation,leading to enhanced tumorigenicity. They further showed that mutating the lysine targeted for acetylation to an acetylation-mimic glutamine leads to enhanced proliferation and tumor growth (10). Collectively, a variety of proteomic approaches have been used to provide clear evidence that PKM2 is subject to multiple modes of post-translational regulation that function to retard the last step of glycolysis, thereby leading to an accumulation of upstream glycolytic intermediates. Moreover, cancer cells can divert these upstream glycolytic intermediates towards various anabolic processes in order to maintain their proliferative and tumorigenic capacity. While the effects of posttranslational regulation on the metabolic functionality of PKM2 are now well-understood, the mechanism whereby PKM2 drives tumurogencity and the extent to which PKM2 alters glucose metabolism in cancer cells has remained enigmatic. However, recent studies showing non-catalytic functions of this enzyme have provided valuable insights towards answering these unsettled questions. Yang et al found that epidermal growth factor receptor (EGFR) activation induces nuclear translocation of PKM2, but not PKM1, where a lysine residue 433 of PKM2 binds to c- Src-phosphorylated Y333 of β-catenin (11). The authors showed that this is a requisite step for promoter recruitment of these two proteins to initiate cyclin D1 expression, which is fundamental to cell proliferation and brain tumor development. Luo et al found that PKM2, but not PKM1, interacts directly with the HIF-1α subunit and promotes transactivation of HIF-1 target genes by enhancing HIF-1 binding and p300 recruitment to hypoxia response elements (12).These authors further showed that PKM2 interacts with prolyl hydroxylase 3 (PHD3) to enhance PKM2 binding to HIF-1α as well as its co-activator functions. In addition, they showed that PHD3 knockdown not only reduces glucose uptake and lactate production but also increases oxygen consumption. Collectively, these studies show that the non-catalytic roles of PKM2 are also critical in reprogramming the metabolism of cancer cells and driving cell proliferation and tumor growth. Based on recent studies showing that activating PKM2 may reverse the Warburg effect, valiant efforts have been made in recent years to develop activators of PKM2 that enhance the enzymatic activity of PKM2, towards potential cancer therapy. These activators were identified through quantitative high-throughput screening efforts of nearly 300,000 small-molecules of the NIH Molecular Libraries Small Molecule Repository using an ATP-generation assay coupled to luminescence (13–15). These small-molecules primarily consist of N,N’- diarylsulfonamides, thieno[3,2-b]pyrrole[3,2-d]pyridazinones, and 2-oxo-N-aryl-1,2,3,4- tetrahydroquinoline-6-sulfonamides. One of these small-molecules, DASA-10, was recently shown to enhance cancer cell death under conditions of oxidative stress (7). While activators of PKM2 activity have the potential to become promising therapeutic strategies for cancer, pharmacological or genetic therapies to downregulate PKM2 expression, thereby impairing the non-catalytic
5
protein-protein interactions of PKM2, may also provide unique avenues for cancer therapy. Aberrant Amino Acid and TCA Cycle Metabolism Underlying Cancer In addition to altered glucose metabolism, cancer cells also exhibit fundamental alterations in amino acid metabolism that contribute to tumorigenicity. Metabolic flux analysis using either NMR or mass spectrometry is a powerful approach towards mapping altered metabolic flux in cancer cells by tracing the incorporation of 13C-labeled metabolites arising from 13C-glucose or 13C-glutamine treatment of cells (Figure 1-3). The metabolism of glutamine to lactate through “glutaminolysis”, has been shown to be a particularly important anaplerotic driving-force for cancer cell proliferation (1). Anaplerosis refers to the replenishment of mitochondrial citric acid carbon pool. Glutamine can drive anaplerosis by providing the mitochondria with precursors for the synthesis of nucleotides, amino acids, and lipids. DeBerardinis et al utilized 13C- labeled nutrients (e.g. 13C-glucose or 13C-glutamine) coupled with 13C NMR spectroscopy as a method to selectively enrich metabolites in real time, allowing for the measurement of metabolic fluxes, towards understanding how biochemical pathways become rewired in cancer. Through these studies, DeBerardinis et al found that cancer cells utilize the tricarboxylic acid (TCA) cycle primarily to generate building blocks, in particular, citrate which is exported out of the mitochrondria to provide acetyl CoA for fatty acid and phospholipid biosynthesis (16) (Figure 1-1, 1-3). They also found that glutamine dependent anaplerosis, the process of glutamine replenishing TCA cycle intermediates, satisfied the large cellular demand for reducing power (NAPDH generation) and oxaloacetate renewal (via conversion of glutamine to α-ketoglutarate) that is necessary for continued (16) fatty acid synthesis and TCA flux. Another route for the production of α-ketoglutarate within the cells is via a reaction catalyzed by the TCA cycle enzyme isocitrate dehydrogenase1 (IDH1). IDH1 catalyzes the oxidative decarboxylation of isocitrate to α-ketoglutarate with concomitant reduction of NADP+ to NADPH. A genome wide analysis consisting of sequencing protein-coding genes and RNA sequencing of glioma and acute myeloid leukemia patients identified mutations in the active site of the enzyme IDH1 as a common feature of a major subset of low-grade gliomas and secondary glioblastomas and leukemic cancers (17,18). These mutations were found to occur at a single amino acid residue of IDH1, arginine 132, which is most commonly mutated to histidine. In an effort to understand the effects of such a mutation on the cellular metabolome, Dang et al stably transfected U87MG glioblastoma cells with both myc- tagged wild-type IDH1 as well as R132 mutant IDH1 and compared the metabolomes of these cells using an untargeted liquid chromatography/mass-spectrometry (LC/MS) based untargeted metabolomic profiling approach, which allows for an unbiased comparison of metabolites altered between two groups. The authors identified a novel oncometabolite 2-hydroxyglurarate (2-HG) that was dramatically increased in cells that contained this R132 mutation in IDH1(3). Surprisingly, while the wild type IDH1 produced α-ketoglutarate and NADPH, in vitro assays revealed that the R132 mutant IDH1 consumed NADPH and reduced α-ketoglutarate to 2-HG (3)(Figure 1-1). These studies provided the first evidence for a

6
mutated enzyme in cancer conferring, not only a loss of endogenous function, but also a neomorphic function to yield an unforeseen metabolite, and underscored the utility of using unbiased and untargeted metabolomic approaches to study cancer metabolism. Further metabolomic profiling by Reitman et al revealed that both mutation in IDH1 and separate treatment with 2-HG resulted in a host of downstream metabolic changes including changes in amino acids, glutathione metabolites, choline derivatives, and TCA cycle intermediates (19). Specifically, using targeted LC- MS/MS they also found that the N-acetylated amino acids NAA and NAAG (most commonly found as dipeptides in the brain) were significantly lowered in cells containing a mutated IDH1 (19). In addition to its role in eliciting direct metabolic changes, IDH1 derived 2-HG has also recently been shown to play an epigenetic role in cancer, primarily through an increase in CpG island methylation. Using a large scale genome-wide analysis of DNA methylation, Noushmehr et al profiled promoter DNA methylation alterations in 272 glioblastoma tumors and found that a distinct subset of these glioblastomas were positive for this CpG island methylator phenotype (G-CIMP)(20). Strikingly, these G-CIMP-positive samples were tightly correlated with mutations in IDH1. Figueroa et al further extended this correlation between IDH1 mutation and DNA methylation to other cancers types as they showed that IDH1/IDH2 mutant AML is associated with more extensive promoter hypermethylation compared to other AML subtypes(21). The mechanism underlying the role of 2-HG in driving DNA methylation is still unclear, however recent evidence from Xu et al has shown that 2-HG can act as a competitive inhibitor of α-ketoglutarate dependent demethylases, including histone demethylases and the TET family of 5-methylcytosine hydroxylases, thereby explaining this correlation between IDH1 derived 2-HG and CpG island hypermethylation(22). Recent studies have also shown that mutations in IDH1 are sufficient to establish the glioma hypermethylator phenotype, showing that introduction of mutant IDH1 into primary human astrocytes alters specific histone marks, induces extensive DNA hypermethylation, and reshapes the methylome in a similar manner to the changes observed in glioma CpG island methylator phenotype-positive lower-grade gliomas (23). Intriguingly, Lu et al also showed that introduction of mutant IDH into immortalized astroyctes resulted in progressive accumulation of histone methylation. They also showed that 2-HG was associated with repression of the inducible expression of lineage-specific differentiation genes in adipocytes and blocked differentiation through inhibiting H3K9 demethylase KDM4C, and that genetic knockdown of this enzyme was sufficient to block differentiation (24). Interestingly, recent studies have shown that under hypoxia or mitochondrial dysfunction, cancer cells undergo a switch in which citrate, an important lipogenic precursor, is produced not from glycolytic carbon, but primarily from glutamine via reductive carboxylation of α−ketoglutarate to isocitrate via IDH1 or IDH2 (25–28). These studies mapped this reductive carboxylation pathway using metabolic flux analysis measuring incorporation of 13C-labeled carbons arising from 13C-glucose or 13C-glutamine labeling in cells by mass spectrometry or NMR. These studies also showed that knocking down IDH2 impairs cell proliferation (28). Furthermore, Metallo et al
7
showed that cancer cells deficient in the Von Hippel-Lindau (VHL) tumor suppressor, a protein frequently lost in renal cell carcinoma, preferentially utilize reductive glutamine metabolism for lipogenesis even under normoxic conditions. In a separate study, Wise et al intriguingly showed that 2-HG, originally thought to arise only from mutated neomorphic IDH, can in fact be formed in cells possessing wild-type IDH1 and IDH2 also through reductive metabolism by IDH2 in the mitochondria(28). Collectively, mass spectrometry and NMR-based metabolomic studies have provided valuable insights into how cancer cells undergo a metabolic switch that consists of glutamine-dependent anaplerotic pathways that can convert α-ketoglutarate through either wild-type or mutated IDH1 and IDH2, to isocitrate through reductive mechanisms, which in-turn can support lipid biosynthesis to fuel cancer cell proliferation. Untargeted and unbiased metabolomic approaches have also uncovered neomorphic roles associated with mutant IDH which generates the oncometabolite 2-HG. Subsequent studies have shown this oncometabolite to be demethylase inhibitor, leading to epigentic changes that may drive cancer. Recent experimental approaches have revealed that many other amino acid metabolic pathways are also dysregulated in cancer and contribute to cancer aggressiveness. Locasale et al found that in some cancer cells a relatively large amount of glycolytic carbon is diverted into serine and glycine metabolism (29) (Figure 1-1). They showed this using two independent metabolomic approaches. They first used sensitivity-enhanced nuclear magnetic resonance (NMR)-based two- dimensional heteronuclear single quantum correlation spectroscopy (HSQC) to quantify steady-state levels of glucose-derived metabolites in HEK293T cells following 24 h of labeling with 13C-glucose. While, as expected, lactate levels were extremely high, surprisingly, the glycolytic flux towards glycine was also equally high. In the second experimental approach, using targeted LC-MS/MS-based measurements of metabolites, they found that a substantial portion of 13C-glucose was diverted from 3- phosphoglycerate to the serine and glycine biosynthetic pathways, on par with incorporation of glucose carbons into nucleotides. The first committed step in this pathway is the oxidation of the glycolytic intermediate 3-phosphoglycerate to 3- phosphohydroxypyruvate by the enzyme phosphoglycerate dehydrogenase (PHGDH). Using a functional genomics approach, Locasale identified PHGDH as a frequently amplified gene in a pooled analysis of somatic copy number alterations across 3,131 cancer samples, most notably in melanoma cells (29). Concurrent with the study from Locasele et al, Possemato et al. devised an elegant negative-selection in vivo RNAi genomics screen which also identified PHGDH as an important metabolic pathway in tumorigenesis and cell proliferation (30)(Figure 1-4). They first cross-referenced maps of metabolic pathways with the KEGG database to compile a comprehensive list of 2,752 genes encoding all known human metabolic enzymes and transporters. From this list, genes were prioritized based on their association with cancer and stem cell-like properties to a set of 133 metabolic enzyme and transporter genes. They then screened for RNA interference oligonucleotides for each of these 133 genes that become depleted during breast tumor formation in mice. Sixteen hits were identified, including PHDGH. They further showed that PHGDH is in a genomic region of recurrent copy number gain in breast cancer and

8
PHGDH protein levels are elevated in 70% of estrogen receptor (ER)-negative breast cancers. They further demonstrated that knocking down PHGDH reduces cell proliferation in breast cancer cells. Through measurement of steady-state levels and incorporation of isotopic 13C-glutamine in cells followed by targeted LC/MS analysis, the authors also found that PHGDH knockdown results in deficiencies in the levels of multiple TCA cycle intermediates and anaplerosis of glutamine to alpha-ketoglutarate (30). They found that the serine synthesis pathway is responsible for approximately 50% of the net conversion of glutamine to alpha-ketoglutarate. Collectively, these two parallel studies using innovative genomic and metabolomic tools show how PHGDH promotes cancer pathogenicity by diverting glycolytic flux to serine and glycine biosynthetic pathways. Dysregulated Lipid Metabolism that Supports Cellular Membrane Biosynthesis and Oncogenic Lipid Signaling Pathways Dysregulated lipid metabolism and heightened de novo lipogenesis are established hallmarks of cancer (31,32). Tumor cells synthesize fatty acids for the purpose of both membrane synthesis as well as for the generation of lipid signaling molecules to fuel cell proliferation and cancer malignancy(33). These lipid signaling pathways that are critically important in driving almost every aspect of cancer progression, include phosphatidyl inositol, lysophosphatidic acid (LPA), sphingosine-1-phosphate, and prostaglandin signaling pathways(34–37). In 1994, Kuhajda et al discovered fatty acid synthase (FASN) as an oncogenic protein that was found in tumor cells from breast cancer patients with markedly poorer prognosis(38). Since this time, understanding dysregulated lipid metabolism in cancer cells has gained considerable interest. Several studies have shown that genetic and pharmacological ablation of FASN leads to impairments in cancer pathogenicity, specifically cell cycle arrest and apoptosis(33). Several mechanisms for FASN inhibition-based cytotoxicity have been proposed including phospholipid depletion, alterations in lipid rafts, inhibition in DNA replication, malonyl coA buildup and associated toxicity, and inhibition of anti-apoptotic proteins such as Akt. These studies have been reviewed previously and will not be discussed further in this perspective(33). Common FASN inhibitors that have been used to study the role of FASN in cancer include cerulenin and its derivative C75, epigallocatechin-3-gallate, triclosan, and orlistat which target different regions of the FASN complex and elicit apoptotic cell death in cancer cells(31). However, none of these inhibitors are likely very selective for FASN and are not suitable for clinical development(39). Newer pharmacological inhibitors of FASN that are significantly more potent and selective have arisen from the pharmaceutical industry including GSK837149A from GlaxoSmithKline, identified from an impurity found in an active hit from a high-throughput screen utilizing an NAPDH consumption assay(39). Merck has also recently identified the broad- spectrum antibiotic platensimycin as a selective mammalian fatty acid synthase inhibitor(40). While the de-novo synthesis of lipids has clearly been shown to be essential to conferring cancer malignancy, the mobilization of esterified lipids is also necessary to
9
remodel cellular lipids into protumorigenic lipid signaling molecules(4,32). A recent study utilized a chemoproteomic platform termed activity based protein profiling (ABPP) to identify monoacylglycerol lipase (MAGL) as a highly expressed serine hydrolase in multiple human aggressive cancer cells and primary tumors(4,41) (Figure 1-5). ABPP uses active-site directed chemical probes to interrogate the functional state of large numbers of enzymes directly in native complex proteomes(42). Because activity-based probes label the active sites of their enzyme targets, they can form the basis for a competitive screen for enzyme inhibitors. Long et al used this approach to develop a highly potent and selective inhibitor of MAGL, JZL184, previous to this study(43). Pharmacological and genetic ablation of MAGL in aggressive cancer cells lines using JZL184 or RNA interference resulted in impairments in cancer cell aggressiveness and tumorigenicity, while the overexpression of MAGL in non-aggressive cancer enhanced cancer cell pathogenicity. Using a mass-spectrometry- based untargeted metabolomics approach termed discovery metabolite profiling (DMP), the authors then showed that MAGL blockade leads to elevations in the anti-tumorigenic endocannabinoid signaling lipid 2-arachidonoylglycerol and reductions in free fatty acid (FFA) levels in aggressive cancer cells which in-turn reduce the downstream levels of protumorigenic signaling lipids such as LPA and prostaglandins(4,41) (Figure 1-1, Figure 1-5). The pathogenicity deficits observed by MAGL knockdown were rescued by addition of fatty acids, LPA, or PGE2 in vitro or a high-fat diet in vivo. These results taken together demonstrate how cancer cells can co- opt a lipolytic enzyme to translate their lipogenic state into an array of pro-tumorigenic signals. Consistent with Nomura et al’s findings that an increase in dietary fat intake could potentially drive cancer cell pathogenesis, Kuemmerl et al were able to demonstrate that some cancer cells also rely on the presence of another lipolytic enzyme, lipoprotein lipase (LPL), to acquire fatty acids from circulating dietary triglycerides, thereby fueling their growth and proliferation. Using gene expression profiling methods, Kuemmerl et al revealed that select breast and prostate cancer cells express high levels of both LPL and the fatty acid transporter, CD36(44). In the cells in which there was no substantial increase in LPL gene expression, they showed, through further transcriptomic analysis, that these cells maintained extremely high expression of genes that promote endogenous fatty acid synthesis, most notably FASN. Furthermore, upon pharmacological blockade of endogenous fatty acid synthesis, exogenous delivery of LPL along with triglyceride rich lipoprotein particles served to rescue the malignant phenotype that was previously lost upon inhibition of endogenous fatty acid production (44)(Figure 1-1). Nieman et al recently discovered that primary human omental adipocytes promote homing, migration, and invasion of ovarian cancer cells, through direct transfer of lipids from adipocytes to ovarian cancer cells to promote tumor growth. Through protein array profiling, the authors found an upregulation in fatty acid binding protein 4 (FABP4) in omental metastases as compared to primary ovarian tumors, and that FABP4 deficiency substantially impaired ovarian tumor metastasis in mice(45). Taken together, these results indicate that cancer cells must increase their production of global fatty acids in one of 3 ways: endogenous production (via FASN), release of esterified fatty acids (via MAGL), or release and absorption of fatty acids from dietary sources (via LPL and FABP4).
10
In addition to fatty acid-derived glycerolipids, ether lipid metabolism has also been known to be dysregulated in cancers since the pioneering work performed in the 1960s by Snyder and Wood(46,47), but the metabolic pathways that drive this metabolic transition were not well understood. Studies utilizing ABPP platforms identified the serine hydrolase KIAA1363 as one such driver of ether lipid metabolism that is upregulated across multiple human aggressive cancer cells and primary tumors(48,49). Several potent and selective pharmacological carbamate inhibitors of KIAA1363 have been developed through competitive ABPP approaches, such as AS115 and JW480 as well as an activity-based imaging probe JW576, which are all based off of the carbamate scaffold(48,50,51). Both pharmacological and genetic blockade of KIAA1363 has been shown to impair cancer cell migration, invasion, and in vivo tumorigenicity through lowering ether lipids and oncogenic signaling lipids such as alkyl lysophosphatidic acid(48,51)(Figure 1-5). Challenges in the Field of (Cancer) Metabolism The field of cancer metabolism has thus far focused on major commonly known biochemical pathways, such as glycolysis, TCA cycle, fatty acid synthesis, and amino acid metabolism(52). While this has been critical at delineating the foundational structure of altered metabolism in cancer, looking towards the future, we need to expand our investigations and technologies to more comprehensively encompass different aspects of metabolism. This endeavor, however, is hindered by our incomplete understanding of the metabolic pathways that operate in normal human cells, let alone in cancerous ones. We also lack pharmacological tools to interrogate even very well-understood biochemical pathways, as evidenced by a dearth of specific inhibitors for enzymes in glycolysis or TCA cycle. Metabolic pathways are likely quite plastic and adaptable in cancer cells, so we view the development of selective chemical probes to perturb these networks in a rapid and temporally controlled manner as an important complementary approach to gene knockouts or knockdowns, which typically create models of prolonged target disruption. Let’s consider a hypothetical situation that underscores the technical challenges that remain for researchers interested in understanding and controlling cancer metabolism. Presume that one finds through a genome or proteome-wide search a poorly characterized enzyme that highly correlated with cancer; how does one gain understanding of the biochemical function that this enzyme performs in tumor cells and integrate its activity into the larger biochemical and signaling networks that drive pathogenesis? In this chapter, we have presented instances where advanced proteomic and metabolomic approaches have achieved this goal. However, the metabolome rivals, if not surpasses, the genome and proteome in terms of its physicochemical content and complexity. As such, current analytical technologies, even when used in combination, likely do not approach providing a complete picture of the metabolome. Here, improvements in methods for metabolite enrichment, separation, and identification, as well as continued advances in MS and NMR platforms should enable researchers to delve deeper and deeper into the highly diversified metabolomic landscape of cells and

11
tissues. If a comprehensive and global understanding of metabolic pathways in cancer is to be achieved, the insights gained from metabolomic mapping of enzyme functions in cancer must be coupled to the assembly of biochemical reactions into pathways and larger metabolic networks. Essential to this process is mapping the metabolic flux through these pathways and networks, not only in situ in cells, but also in living systems or in live tumors in human patients and modeling these fluxes to identify critical nodes for therapeutic intervention(53). There are indeed powerful strategies for measuring both in situ and in vivo metabolic flux using isotopic tracers including monitoring 13C-labeled substrates and their metabolic fate (54) or tracing D2O heavy water (55) in lipid, nucleic acid, and amino acid metabolism. While single isotopic tracers are an extremely valuable tool that can be used to probe metabolic networks, the application of multiple tracers simultaneously has provided an even more thorough understanding of metabolic flux. To this end, a recent paper by Walther et al has elegantly elucidated a method that allows researchers to determine the optimal tracer combination for a particular metabolic pathway(56). More recently, Hiller et al have developed a new methodological approach to trace stable isotopes in non-targeted metabolomics data (57). These endeavors will have to be improved and further implemented in the study of cancer metabolism with better isotopic or chemical labeling strategies coupled with improvements in imaging, magnetic resonance, mass-spectrometry-based platforms as well as modeling tools, to better dissect cancer metabolism and use these approaches to diagnose and treat cancer patients. Beyond technical challenges, there are also conceptual advances that must be made. Much of the field of cancer metabolism, for instance, has focused to date on pathways that are altered during the transformation process that initiates cancer. Less is understood about the metabolism that drives specific stages of tumor progression, malignancy, and eventually metastasis and drug-resistance. It is possible that even the same general metabolic pathway may contribute in different ways to individual stages of cancer. Take as an example lipogenesis. FASN is highly upregulated during the transformation process and contributes substantially to proliferation and survival, presumably by generating cellular membranes required for cell division, as well as possibly substrate for energy production by fatty acid oxidation. However, on its own, FASN does not appear to produce lipid changes that promote high malignancy (58). Upregulation of MAGL, on top of a high FASN background, on the other hand, may promote this conversion to an aggressive state by liberating fatty acids for the biosynthesis of pro-migratory signaling lipids (e.g., lysophospholipids, eicosanoids). Only by examining cancer cells (or tumors) at different stages of disease progression, as opposed to more classical comparisons of normal and transformed cells, can such examples of co-adapting metabolic pathways be uncovered. Recent work also suggests that malignant progression of cancer is accompanied by an increased proportion of cancer stem/precursor cells (CSC) within the tumor (59) and that activation of the epithelial-to-mesenchymal transition (EMT) is associated with CSC properties, including expression of the stem cell-associated antigenic profile (e.g.
12
CD44+/CD24-/low for breast cancer), self-renewal capabilities, resistance to conventional therapies, cancer aggressiveness, and poor clinical outcome for multiple tumor types(59–62). Several studies have linked EMT directly to CSCs and aggressive properties of cancer (61,63,64), and have shown that CSCs or cells that have undergone EMT are highly resistant to traditional cancer therapies(65–67), indicating that current therapeutic strategies preferentially target the non-CSC population. Despite the potential importance of this CSC population, the metabolic alterations that underlie EMT or CSCs remain poorly understood, although emerging data suggest that human cancer cell lines possessing EMT/stem-like features also display a unique set of metabolic enzymes (41). Disrupting these pathways with small molecule inhibitors or RNA-interference probes should inform on their specific contributions to the biochemistry and malignant properties of CSCs. In addition to identifying dysregulated metabolic pathways that underlie cancer initiation and progression, understanding the mechanism by which these pathways become dysregulated will also be essential for the diagnosis and treatment of cancer patients. Identifying the upstream “master regulator” may provide nodes that can be targeted to shut down entire metabolic programs that drive cancer. For example, a recent study by Gaglio et al showed oncogenic Kras to be essential for the metabolic reprogramming of cancer cells by enhancing glycolytic activity, decreasing TCA flux, and increasing the utilization of glucose for anabolic means (68). More recently, a study by Ying et al showed that oncogenic Kras maintains pancreatic tumors through regulation of anabolic glucose metabolism, channeling glucose intermediates into both the hexosamine biosynthesis and pentose phosphate pathways (69). PHGDH copy number appears to be highly amplified in human cancers, which accounts for its subsequent metabolic and oncogenic effects (70). However, the mechanism behind what drives other dysregulated metabolic pathways are not as well understood, and some of these pathways are likely turned on by upstream signaling or post-translational mechanisms. Beyond profiling metabolic enzymes implicated in transformation, stemness, malignancy, and metastasis, it still remains unclear in any of these instances whether the dyregulated enzymes, when pharmacologically targeted, will have a strong enough effect on disease progression to be therapeutic. Drug programs that target a metabolic enzyme would benefit from identifying genetically-defined cancer sub-types (or resistance phenotypes) that are mechanistically tied to the disrupted pathways, so that one can properly select patients for therapeutic testing. Such mechanistic links, in most cases, have yet to be established. Drugs that target cancer metabolism will also likely have to be combined with current chemotherapeutic regimens to exhibit or maximize therapeutic efficacy. The optimal combination of these drugs or whether we can reduce current chemotherapy dosing regimens when combined together with cancer metabolism-based therapy is not well understood. For malignancy-related enzymes, the problem may even more challenging since they may contribute principally to processes like metastasis, which are more difficult to monitor preclinically and clinically compared to simple tumor growth.

13
Conclusions Ever since Warburg first proposed that cancer may be a disease defined by aberrant metabolism, scientists have sought to define the specific biochemical pathways that enable previously normal cells to take on a deviant tumorigenic state. This chapter has highlighted many of the unique discovery platforms and global profiling approaches that are leading the way to identify new biochemical nodes that contribute to cancer development and malignancy. These include multiple inhibitory controls on glycolysis (e.g. PKM2) that divert flux of glycolytic carbons into anaplerotic pathways for generation of biosynthetic precursors, such as amino acids through PHGDH, or redox potential through the pentose phosphate pathway. Also included is a fundamental rewiring of cancer cells to exert heightened utilization of other carbon sources such as glutamine to supply TCA cycle anaplerosis; in certain cases, this occurs through IDH1/2-mediated reductive carboxylation to generate intermediates such as citrate that fuel de novo lipogenesis through FASN. Beyond the synthesis of cellular membrane lipids required for proliferation, studies have also found that these lipids are mobilized by distinct enzymatic pathways in cancer cells (e.g. MAGL, LPL, KIAA1363) to create building blocks for protumorigenic signaling lipids and for use as an energy source. Quite intriguingly, certain enzymes can even acquire neomorphic activities through mutation, such as mutant IDH, which generate novel oncogenic biomolecules that have wide-spread metabolic and epigenetic consequences. These findings have arisen out of the integrated utilization of genomic (deep genome sequencing and RNA sequencing), proteomic (post-translational mapping and functional proteomics), and metabolomic (steady-state, targeted/untargeted, and metabolic flux analysis) approaches. We expect that the continued efforts to probe biochemical pathways in cancer cells using such large-scale profiling methods will strengthen our understanding of dysregulated metabolism in cancer and identify potential avenues for therapeutic intervention. In the next two chapters that follow, we will apply many of these aforementioned technologies (including genomics and functional metabolomics) to uncover novel metabolic pathways that are critical drivers of cancer aggressiveness. We will use these tools to discover that both inositol phosphate recycling and ether lipid metabolism are critically important for maintaining cancer cell malignancy.

14
CHAPTER TWO
Inositol Phosphate Recycling Regulates Glycolytic and Lipid Metabolism that Drives Cancer Aggressiveness
15
Introduction Cancer cells undergo a fundamental reprogramming of key biochemical pathways that fuel cell proliferation. These alterations include an addiction to aerobic glycolysis (known as the “Warburg” effect), heightened lipogenesis, as well as an increase in glutamine dependent anaplerosis(71,72). However, the metabolic reprogramming that drives the aggressive features of cancer, such as motility, invasiveness, and tumor- initiating capacity, is not well-understood. Since most cancer deaths are related to aggressive features of cancer, understanding the metabolic pathways that contribute to these pathogenic features of cancer is critical for both diagnosis and treatment. We previously identified a gene expression signature of commonly dysregulated metabolic enzymes that were heightened across a panel of highly aggressive human cancer cells, leading us to hypothesize that there was a metabolic program that supports cancer malignancy (41).Consistent with this premise, two of these enzymes, monoacylglycerol lipase (MAGL) and KIAA1363, have been previously shown to be important in maintaining aggressive and tumorigenic features of cancer through modulating protumorigenic fatty acid or ether lipid derived signaling molecules, respectively (4,41,48,51). Here, we show that inositol polyphosphate phosphatase 1 (INPP1), another enzyme found in this gene expression signature is highly upregulated across aggressive human cancer cells and high-grade primary human tumors. The established biochemical role of INPP1 is to dephosphorylate free polyphosphorylated inositols(73). While INPP1 has been previously shown to be upregulated in human colorectal cancers, the role of this enzyme in cancer has remained obscure (74). In this study, we show that INPP1 drives cancer pathogenicity through controlling glycolytic pathways that feed into the generation of oncogenic signaling lipids. We find that inactivation of INPP1 impairs aggressive and tumorigenic features of cancer through impairing protumorigenic lipid signals derived from glycolytic metabolism. INPP1 Activity is Upregulated in Aggressive Cancer Cells and Primary Human Tumors Gene expression analysis comparing a panel of aggressive breast, prostate, ovarian, and melanoma cancer cell lines with their less aggressive counterparts (4) previously revealed a commonly dysregulated signature of metabolic enzymes. These aggressive cancer cells do not show heightened proliferative capacity (Figure 2-1 A) but exhibit high migratory, invasive, and tumor-forming capacity compared to the less aggressive cancer cells(41). Among this signature, hydroxypyruvate isomerase (HYI) and INPP1 were the only enzymes that act upon small-molecule substrates, exhibit a greater than 2-fold higher expression across aggressive cancer cells, and have also not been previously studied in cancer. INPP1 inactivation with RNA interference, but not HYI knockdown, led to migratory defects in cancer cells (Figure 2-1 B). Thus, we decided to focus our subsequent efforts on investigating the role of INPP1 in cancer. We find that INPP1 expression, protein levels, and enzyme activity are significantly elevated across aggressive melanoma, prostate, ovarian, and breast cancer cells compared to their less aggressive counterparts (Fig. 2-2 A-C). INPP1 activity or expression is also significantly elevated in high-grade primary ovarian and melanoma tumors compared to low-grade

16
ovarian tumors and normal skin tissue, respectively (Fig. 2-2D). INPP1 was not differentially expressed in primary human breast tumors (Fig. 2-2D). INPP1 protein expression is also upregulated upon overexpression of several commonly mutated or amplified human oncogenes (PI3KCA, activated MAP kinase (MEKDD1), HRAS, NeuNT, and BRAF) in MCF10A non-transformed mammary epithelial cells (Figure 2-1C) These oncogenes that have been previously associated with both transformation of cancer cells and acquisition of cancer malignancy(75–77). Taken together, our results indicate that INPP1 expression is heightened in aggressive cancer cells and primary human ovarian and melanoma tumors, and upon induction of MCF10A cells by several human oncogenes. Disruption of INPP1 Impairs Cancer Pathogenicity We next sought to ascertain the pathophysiological role of INPP1 in cancer. Since INPP1 is upregulated in high-grade human ovarian and melanoma tumors, but not in primary human breast tumors, we focused our attention on the role of INPP1 in ovarian and melanoma cancer cells. We knocked down the expression of INPP1 in both aggressive and less aggressive SKOV3 and OVCAR3 ovarian and C8161 and MUM2C melanoma cancer cells with short-hairpin (shINPP1) or small-interfering (siINPP1) RNA oligonucleotides, respectively, resulting in a 70-80% reduction in INPP1 expression, protein level, and activity (Figure 2-3; Figure 2-1D, 2-1E). INPP1 inactivation significantly impairs cancer cell migration and invasiveness in both the aggressive and less aggressive ovarian and melanoma cancer cells, without effects on cellular proliferation or serum-free cell survival (Fig. 2-3B and 2-3C; Figure 2-1E, 2-1F, 2-1G). We confirmed the specificity of the INPP1 knockdown effects by recapitulating our anti-migratory effects with two independent siRNA oligonucleotides for INPP1 as well as partially to fully rescuing the migratory defect with reinforced expression of INPP1 in siINPP1 SKOV3 cells (Figure 2-1E, 2-1H). Since INPP1 was discovered as upregulated across aggressive cancer cells that possess heightened migratory, invasive, and tumorigenic properties, but are not more proliferative, we interpret our results to indicate that INPP1 may be more important in maintaining aggressive or tumor-initiating features of cancer. Consistent with this premise, INPP1 inactivation in SKOV3 and C8161 cells slows tumor xenograft growth in immune-deficient mice (Fig. 2-3D). These data indicate that INPP1 is necessary to maintain cancer cell motility, invasiveness, and tumorigenicity in ovarian and melanoma cancer cells both in situ and in vivo. We overexpressed INPP1 in the ovarian cancer cells OVCAR3 and SKOV3 and melanoma cancer cells MUM2C, but did not observe increases in cell migration, invasiveness, proliferation, or survival, indicating that INPP1 alone may not be sufficient to confer malignant properties to cancer cells (data not shown). INPP1 Controls the Levels of Glycolytic Intermediates and Oncogenic Signaling Lipids While INPP1 is known for its role in inositol phosphate metabolism, we were perplexed by how this role could affect cancer pathogenicity. We thus performed a large- scale metabolomic profiling study to identify metabolites that may be altered upon inactivation
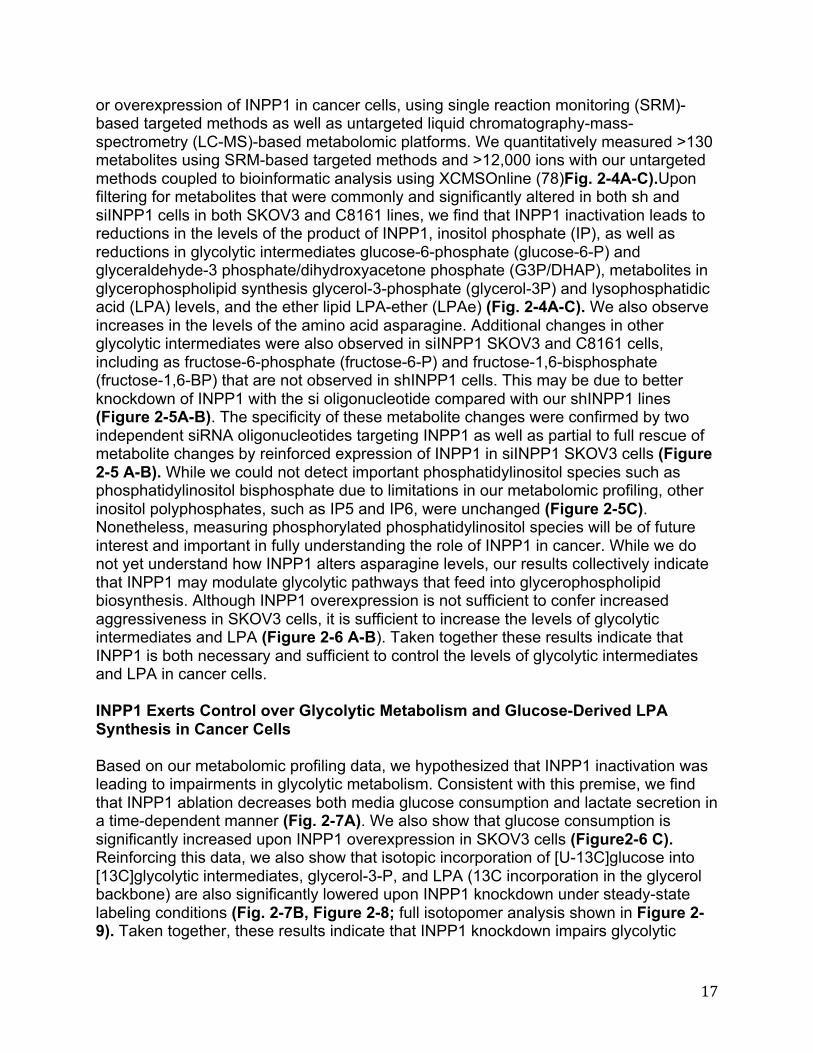
17
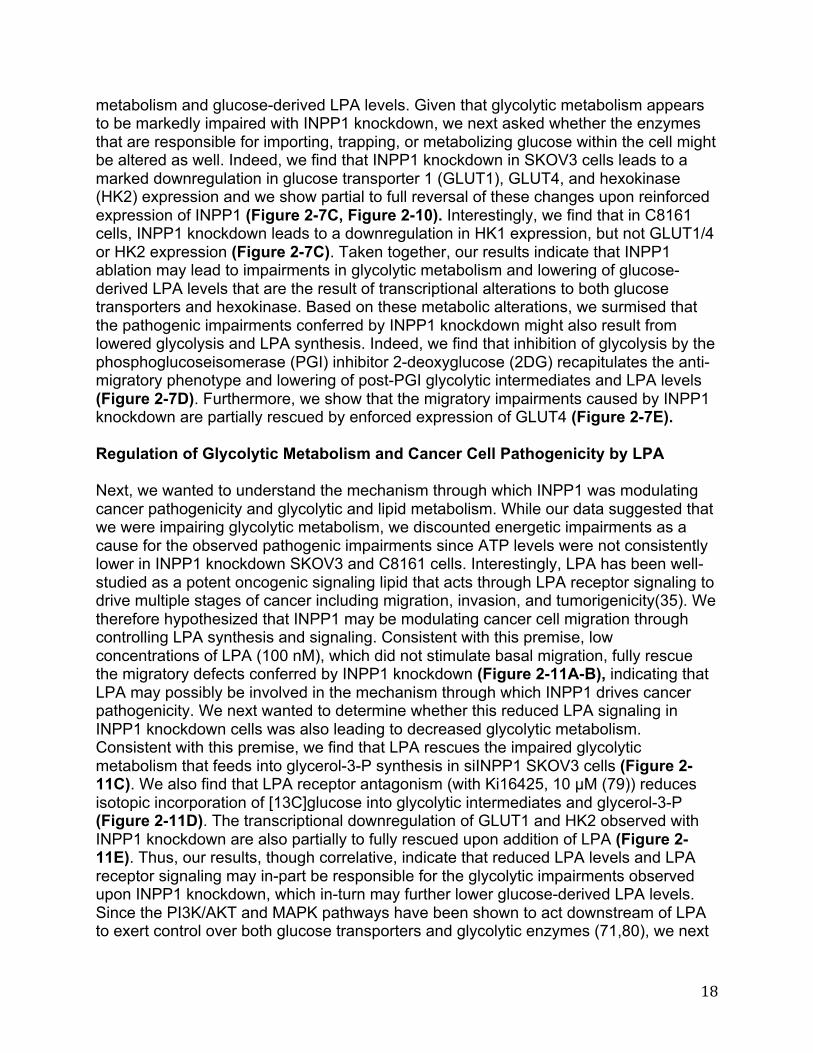
or overexpression of INPP1 in cancer cells, using single reaction monitoring (SRM)-based targeted methods as well as untargeted liquid chromatography-mass- spectrometry (LC-MS)-based metabolomic platforms. We quantitatively measured >130 metabolites using SRM-based targeted methods and >12,000 ions with our untargeted methods coupled to bioinformatic analysis using XCMSOnline (78)Fig. 2-4A-C).Upon filtering for metabolites that were commonly and significantly altered in both sh and siINPP1 cells in both SKOV3 and C8161 lines, we find that INPP1 inactivation leads to reductions in the levels of the product of INPP1, inositol phosphate (IP), as well as reductions in glycolytic intermediates glucose-6-phosphate (glucose-6-P) and glyceraldehyde-3 phosphate/dihydroxyacetone phosphate (G3P/DHAP), metabolites in glycerophospholipid synthesis glycerol-3-phosphate (glycerol-3P) and lysophosphatidic acid (LPA) levels, and the ether lipid LPA-ether (LPAe) (Fig. 2-4A-C). We also observe increases in the levels of the amino acid asparagine. Additional changes in other glycolytic intermediates were also observed in siINPP1 SKOV3 and C8161 cells, including as fructose-6-phosphate (fructose-6-P) and fructose-1,6-bisphosphate (fructose-1,6-BP) that are not observed in shINPP1 cells. This may be due to better knockdown of INPP1 with the si oligonucleotide compared with our shINPP1 lines (Figure 2-5A-B). The specificity of these metabolite changes were confirmed by two independent siRNA oligonucleotides targeting INPP1 as well as partial to full rescue of metabolite changes by reinforced expression of INPP1 in siINPP1 SKOV3 cells (Figure 2-5 A-B). While we could not detect important phosphatidylinositol species such as phosphatidylinositol bisphosphate due to limitations in our metabolomic profiling, other inositol polyphosphates, such as IP5 and IP6, were unchanged (Figure 2-5C). Nonetheless, measuring phosphorylated phosphatidylinositol species will be of future interest and important in fully understanding the role of INPP1 in cancer. While we do not yet understand how INPP1 alters asparagine levels, our results collectively indicate that INPP1 may modulate glycolytic pathways that feed into glycerophospholipid biosynthesis. Although INPP1 overexpression is not sufficient to confer increased aggressiveness in SKOV3 cells, it is sufficient to increase the levels of glycolytic intermediates and LPA (Figure 2-6 A-B). Taken together these results indicate that INPP1 is both necessary and sufficient to control the levels of glycolytic intermediates and LPA in cancer cells. INPP1 Exerts Control over Glycolytic Metabolism and Glucose-Derived LPA Synthesis in Cancer Cells Based on our metabolomic profiling data, we hypothesized that INPP1 inactivation was leading to impairments in glycolytic metabolism. Consistent with this premise, we find that INPP1 ablation decreases both media glucose consumption and lactate secretion in a time-dependent manner (Fig. 2-7A). We also show that glucose consumption is significantly increased upon INPP1 overexpression in SKOV3 cells (Figure2-6 C). Reinforcing this data, we also show that isotopic incorporation of [U-13C]glucose into [13C]glycolytic intermediates, glycerol-3-P, and LPA (13C incorporation in the glycerol backbone) are also significantly lowered upon INPP1 knockdown under steady-state labeling conditions (Fig. 2-7B, Figure 2-8; full isotopomer analysis shown in Figure 2-9). Taken together, these results indicate that INPP1 knockdown impairs glycolytic
18
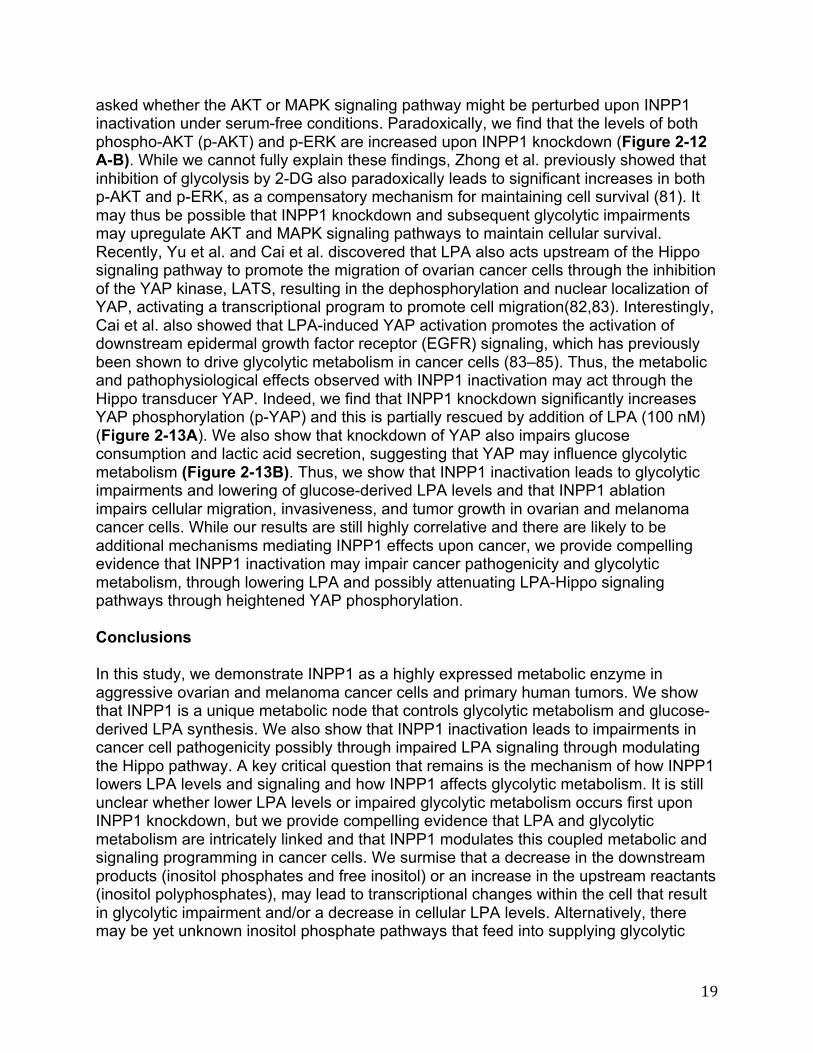
metabolism and glucose-derived LPA levels. Given that glycolytic metabolism appears to be markedly impaired with INPP1 knockdown, we next asked whether the enzymes that are responsible for importing, trapping, or metabolizing glucose within the cell might be altered as well. Indeed, we find that INPP1 knockdown in SKOV3 cells leads to a marked downregulation in glucose transporter 1 (GLUT1), GLUT4, and hexokinase (HK2) expression and we show partial to full reversal of these changes upon reinforced expression of INPP1 (Figure 2-7C, Figure 2-10). Interestingly, we find that in C8161 cells, INPP1 knockdown leads to a downregulation in HK1 expression, but not GLUT1/4 or HK2 expression (Figure 2-7C). Taken together, our results indicate that INPP1 ablation may lead to impairments in glycolytic metabolism and lowering of glucose-derived LPA levels that are the result of transcriptional alterations to both glucose transporters and hexokinase. Based on these metabolic alterations, we surmised that the pathogenic impairments conferred by INPP1 knockdown might also result from lowered glycolysis and LPA synthesis. Indeed, we find that inhibition of glycolysis by the phosphoglucoseisomerase (PGI) inhibitor 2-deoxyglucose (2DG) recapitulates the anti-migratory phenotype and lowering of post-PGI glycolytic intermediates and LPA levels (Figure 2-7D). Furthermore, we show that the migratory impairments caused by INPP1 knockdown are partially rescued by enforced expression of GLUT4 (Figure 2-7E). Regulation of Glycolytic Metabolism and Cancer Cell Pathogenicity by LPA Next, we wanted to understand the mechanism through which INPP1 was modulating cancer pathogenicity and glycolytic and lipid metabolism. While our data suggested that we were impairing glycolytic metabolism, we discounted energetic impairments as a cause for the observed pathogenic impairments since ATP levels were not consistently lower in INPP1 knockdown SKOV3 and C8161 cells. Interestingly, LPA has been well-studied as a potent oncogenic signaling lipid that acts through LPA receptor signaling to drive multiple stages of cancer including migration, invasion, and tumorigenicity(35). We therefore hypothesized that INPP1 may be modulating cancer cell migration through controlling LPA synthesis and signaling. Consistent with this premise, low concentrations of LPA (100 nM), which did not stimulate basal migration, fully rescue the migratory defects conferred by INPP1 knockdown (Figure 2-11A-B), indicating that LPA may possibly be involved in the mechanism through which INPP1 drives cancer pathogenicity. We next wanted to determine whether this reduced LPA signaling in INPP1 knockdown cells was also leading to decreased glycolytic metabolism. Consistent with this premise, we find that LPA rescues the impaired glycolytic metabolism that feeds into glycerol-3-P synthesis in siINPP1 SKOV3 cells (Figure 2-11C). We also find that LPA receptor antagonism (with Ki16425, 10 µM (79)) reduces isotopic incorporation of [13C]glucose into glycolytic intermediates and glycerol-3-P (Figure 2-11D). The transcriptional downregulation of GLUT1 and HK2 observed with INPP1 knockdown are also partially to fully rescued upon addition of LPA (Figure 2-11E). Thus, our results, though correlative, indicate that reduced LPA levels and LPA receptor signaling may in-part be responsible for the glycolytic impairments observed upon INPP1 knockdown, which in-turn may further lower glucose-derived LPA levels. Since the PI3K/AKT and MAPK pathways have been shown to act downstream of LPA to exert control over both glucose transporters and glycolytic enzymes (71,80), we next
19
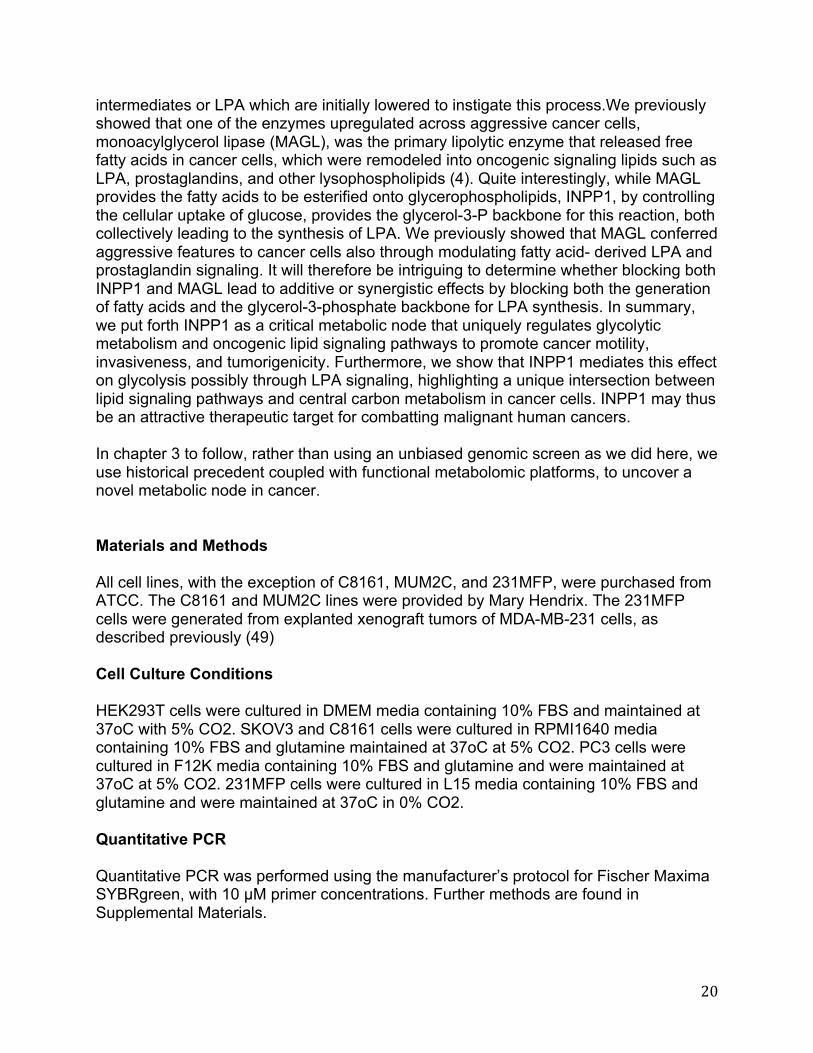
asked whether the AKT or MAPK signaling pathway might be perturbed upon INPP1 inactivation under serum-free conditions. Paradoxically, we find that the levels of both phospho-AKT (p-AKT) and p-ERK are increased upon INPP1 knockdown (Figure 2-12 A-B). While we cannot fully explain these findings, Zhong et al. previously showed that inhibition of glycolysis by 2-DG also paradoxically leads to significant increases in both p-AKT and p-ERK, as a compensatory mechanism for maintaining cell survival (81). It may thus be possible that INPP1 knockdown and subsequent glycolytic impairments may upregulate AKT and MAPK signaling pathways to maintain cellular survival. Recently, Yu et al. and Cai et al. discovered that LPA also acts upstream of the Hippo signaling pathway to promote the migration of ovarian cancer cells through the inhibition of the YAP kinase, LATS, resulting in the dephosphorylation and nuclear localization of YAP, activating a transcriptional program to promote cell migration(82,83). Interestingly, Cai et al. also showed that LPA-induced YAP activation promotes the activation of downstream epidermal growth factor receptor (EGFR) signaling, which has previously been shown to drive glycolytic metabolism in cancer cells (83–85). Thus, the metabolic and pathophysiological effects observed with INPP1 inactivation may act through the Hippo transducer YAP. Indeed, we find that INPP1 knockdown significantly increases YAP phosphorylation (p-YAP) and this is partially rescued by addition of LPA (100 nM) (Figure 2-13A). We also show that knockdown of YAP also impairs glucose consumption and lactic acid secretion, suggesting that YAP may influence glycolytic metabolism (Figure 2-13B). Thus, we show that INPP1 inactivation leads to glycolytic impairments and lowering of glucose-derived LPA levels and that INPP1 ablation impairs cellular migration, invasiveness, and tumor growth in ovarian and melanoma cancer cells. While our results are still highly correlative and there are likely to be additional mechanisms mediating INPP1 effects upon cancer, we provide compelling evidence that INPP1 inactivation may impair cancer pathogenicity and glycolytic metabolism, through lowering LPA and possibly attenuating LPA-Hippo signaling pathways through heightened YAP phosphorylation. Conclusions In this study, we demonstrate INPP1 as a highly expressed metabolic enzyme in aggressive ovarian and melanoma cancer cells and primary human tumors. We show that INPP1 is a unique metabolic node that controls glycolytic metabolism and glucose- derived LPA synthesis. We also show that INPP1 inactivation leads to impairments in cancer cell pathogenicity possibly through impaired LPA signaling through modulating the Hippo pathway. A key critical question that remains is the mechanism of how INPP1 lowers LPA levels and signaling and how INPP1 affects glycolytic metabolism. It is still unclear whether lower LPA levels or impaired glycolytic metabolism occurs first upon INPP1 knockdown, but we provide compelling evidence that LPA and glycolytic metabolism are intricately linked and that INPP1 modulates this coupled metabolic and signaling programming in cancer cells. We surmise that a decrease in the downstream products (inositol phosphates and free inositol) or an increase in the upstream reactants (inositol polyphosphates), may lead to transcriptional changes within the cell that result in glycolytic impairment and/or a decrease in cellular LPA levels. Alternatively, there may be yet unknown inositol phosphate pathways that feed into supplying glycolytic
20
intermediates or LPA which are initially lowered to instigate this process.We previously showed that one of the enzymes upregulated across aggressive cancer cells, monoacylglycerol lipase (MAGL), was the primary lipolytic enzyme that released free fatty acids in cancer cells, which were remodeled into oncogenic signaling lipids such as LPA, prostaglandins, and other lysophospholipids (4). Quite interestingly, while MAGL provides the fatty acids to be esterified onto glycerophospholipids, INPP1, by controlling the cellular uptake of glucose, provides the glycerol-3-P backbone for this reaction, both collectively leading to the synthesis of LPA. We previously showed that MAGL conferred aggressive features to cancer cells also through modulating fatty acid- derived LPA and prostaglandin signaling. It will therefore be intriguing to determine whether blocking both INPP1 and MAGL lead to additive or synergistic effects by blocking both the generation of fatty acids and the glycerol-3-phosphate backbone for LPA synthesis. In summary, we put forth INPP1 as a critical metabolic node that uniquely regulates glycolytic metabolism and oncogenic lipid signaling pathways to promote cancer motility, invasiveness, and tumorigenicity. Furthermore, we show that INPP1 mediates this effect on glycolysis possibly through LPA signaling, highlighting a unique intersection between lipid signaling pathways and central carbon metabolism in cancer cells. INPP1 may thus be an attractive therapeutic target for combatting malignant human cancers. In chapter 3 to follow, rather than using an unbiased genomic screen as we did here, we use historical precedent coupled with functional metabolomic platforms, to uncover a novel metabolic node in cancer. Materials and Methods All cell lines, with the exception of C8161, MUM2C, and 231MFP, were purchased from ATCC. The C8161 and MUM2C lines were provided by Mary Hendrix. The 231MFP cells were generated from explanted xenograft tumors of MDA-MB-231 cells, as described previously (49) Cell Culture Conditions HEK293T cells were cultured in DMEM media containing 10% FBS and maintained at 37oC with 5% CO2. SKOV3 and C8161 cells were cultured in RPMI1640 media containing 10% FBS and glutamine maintained at 37oC at 5% CO2. PC3 cells were cultured in F12K media containing 10% FBS and glutamine and were maintained at 37oC at 5% CO2. 231MFP cells were cultured in L15 media containing 10% FBS and glutamine and were maintained at 37oC in 0% CO2. Quantitative PCR Quantitative PCR was performed using the manufacturer’s protocol for Fischer Maxima SYBRgreen, with 10 µM primer concentrations. Further methods are found in Supplemental Materials.

21
INPP1 activity assay INPP1 phosphatase activity was measured by an adaptation of the assay described previously(73). Briefly, cell or tumor lysate (20 µg protein) was incubated with the INPP1 substrate inositol-1,4-bisphosphate (50 µM) for 60 min at room temperature in phosphate buffered saline with 50 µM magnesium chloride (50 µl total reaction volume). Heat denatured proteomes were used as a negative control. The reactions were quenched by the addition of 1:1 acetonitrile:methanol (200 µl), followed by centrifugation (1300 rpm, 5 min), and collection of the supernatant, for subsequent SRM-based LC/MS analysis quantitating the formation of inositol-4-phosphate product and subtracting background levels measured in heat-denatured proteome negative controls. Human Primary Ovarian Tumors Patients were diagnosed and treated for ovarian tumors at Brigham and Women’s Hospital and Dana-Farber Cancer Center (Boston,MA, USA). All patient-derived biologic specimens were collected and archived under protocols approved by the Human Subjects Committee of the Brigham and Women’s Hospital. The histopathologic diagnosis was determined by the gynecological pathologists at Brigham and Women’s Hospital. The tumors were classified and graded according to the International Federation of Gynecology and Obstetrics (FIGO) system. For this work, 8 benign and 14 high-grade malignant ovarian tumor samples were used for the INPP1 activity and metabolite measurements. The benign cases included benign cysts, ovarian fibromas, and benign serous cystadenomas, whereas the malignant cases were all high-grade papillary serous carcinomas. Fresh tumor tissues were cut with scalpels into 2–5 mm pieces, individually wrapped in aluminum foil, snap-frozen in liquid nitrogen, and kept at –80oC. INPP1 activity was measured as described above. MCF10A cell line generation and screening. Derivative isogenic MCF10A cell lines were generated though stable infection using viral infection of cell pools using either pLX304, pMSCV-Hygro, or pMSCV-puro vectors. Control MCF10A cell lines were generated by expressing empty vectors conferring puromycin, or blasticidin gene resistance as appropriate. Overexpression of genes was confirmed by Western blotting with specific antibodies. Constructing INPP1 Knockdown Cells We used both short-hairpin (sh) and small-interfering (si) RNA using two independent silencing oligonucleotides to knockdown the expression of INPP1. For construction of stable shRNA knockdown lines, lentiviral plasmids (pLKO.1) containing shRNA (purchased from Open Biosystems) against human INPP1 were transfected into HEK293 cells using Fugene (Roche). Lentivirus was collected from filtered culture media (0.45 µm filters) and delivered to the target cancer cell line with polybrene. These target cells were subsequently selected over 3 days with 1 µg/ml puromycin. For transient knockdown of INPP1 with siRNA (Dharmacon), cells were seeded in 6 cm
22
dishes (200,000 cells) for 24 h, and then transfected with siRNA per manufacturer’s instructions. The short-hairpin sequence used for constructing shINPP1 was as follows: CCGGGCTTAGAAAGAAATCCAGAAACTCGAGTTTCTGGATTTCTTTCTAAGCTTTTT G. The control shRNA was targeted against green fluorescent protein with the target sequence GCAAGCTGACCCTGAAGTTCAT. The pooled small-interfering RNAs used to generate the siINPP1 lines were as follows: CUGCAGAGACGCAUACCUA, GCAAAGUCCUCAAUGGUAA, GGUAGCAUCUGAAGCAUUA, CCAAUGAGUUUACUAAUGA. Overexpression Studies in Human Cancer Cell Lines Stable INPP1 overexpression was achieved by subcloning the INPP1 gene into the pMSCVpuro vector (Clontech), generating retrovirus using the AmphoPack-293 Cell Line, as described above with the RNA interference studies. The human INPP1 was subcloned into the pMSCVpuro (Clontech) by using XhoI and EcoRI restriction sites using the following primers 5’GTACGTACCTCGAAGATATCCTCCGG-3’ and 5’GTACGTACGAATTTATGCGTCTCTGC-3’. For transient overexpression of INPP1 in SKOV3 cells, cells were seeded in 6 cm dishes (200,000cells) for 24 h, and then transfected with human INPP1 (in the mammalian SPORT6 expression vector). At 48 h post transfection, cells were harvested for either RNA extraction or metabolomics. For simultaneous transient mouse INPP1 overexpression and siINPP1 knockdown, cells were seeded in 6 cm dishes (200,00 cells) for 24 hours and then transfected simultaneously with siINPP1 #1 as well as with a mouse INPP1 overexpression construct. Cell Migration, Cell Survival, Cell Proliferation, and Invasion Studies Migration, invasion, cell proliferation, and survival studies were performed as described previously (4). Migration assays were performed in Transwell chambers (Corning) with 8 µm pore-sized membranes coated with collagen in which 50,000 cells were seeded into the top chamber and chambers with fixed with Diff-Quik solutions 5 h after seeding cells per manufacturer’s instructions (Dade Behring). Cells that had not migrated through the chamber on the top of the chamber were removed with a cotton ball and migrated cells were counted at a magnification of 400x. An average of cells in 4 fields for one migration chamber represents n = 1. Cell survival and proliferation assays were performed using the Cell Proliferation Reagent WST-1 (Roche) as previously described (4). Cells were washed twice in PBS, harvested by trypsinization, washed in serum-free media and cells were seeded into 96-well plates (10,000 cells for proliferation, and 20,000 cells for cell survival) in a volume of 200 µl for 0 and 24 hr prior to addition of WST-1 (20 µl) for 1 h at 37oC in 5 % CO2. Absorbance was then measured at 450 nm using a spectrophotometer. Invasion assays were conducted using the BD Matrigel Invasion chambers per the manufacturer’s protocol. Tumor Xenograft Studies Human cancer xenografts were established by transplanting cancer cell lines ectopically
23
into the flank of C.B17 SCID mice (Taconic Farms) as described previously (4). Briefly, cells were washed two times with PBS, trypsinized, and harvested in serum-containing medium. Next, the harvested cells were washed two times with serum-free medium and resuspended at a concentration of 2.0 x 10⁴ cells/ml and 100 µl was injected. Growth of the tumors was measured every 3 days with calipers. Metabolomic profiling of cancer cells Metabolite measurements were conducted using modified previous procedures (4,86). Cancer cells were grown in serum-free media for 4 hr to minimize the contribution of serum-derived metabolites to the cellular profiles. Cancer cells (1 x 10⁶ cells/6 cm dish or 2 x 10⁶ cells/6cm dish for nonpolar and polar metabolomics, respectively) were washed twice with phosphate buffer saline (PBS), harvested by scraping, and isolated by centrifugation at 1400 x g at 4oC and cell pellets were flash frozen and stored at -80oC until metabolome extractions. Nonpolar lipid metabolites were extracted in 4 ml of a 2:1:1 mixture of chloroform:methanol:Tris buffer with inclusion of internal standards C12:0 dodecylglycerol (10 nmol) and pentadecanoic acid (10 nmol). Organic and aqueous layers were separated by centrifugation at 1000 x g for 5 min and the organic layer was collected. The aqueous layer was acidified (for metabolites such as LPA) by adding 0.1 % formic acid, followed by the addition of 2 ml chloroform. The mixture was vortexed, and the organic layers were combined, dried down under N2 and dissolved in 120 µl chloroform, of which 10 µl was analyzed by both single-reaction monitorin (SRM)-based LC-MS/MS or untargeted LC-MS. LC separation was achieved with a Luna reverse-phase C5 column (50 mm x 4.6 mm with 5 µm diameter particles, Phenomenex). Mobile phase A was composed of a 95:5 ratio of water:methanol, and mobile phase B consisted of 2-propanol, methanol, and water in a 60:35:5 ratio. Solvent modifiers 0.1% formic acid with 5 mM ammonium formate and 0.1% ammonium hydroxide were used to assist ion formation as well as to improve the LC resolution in both positive and negative ionization modes, respectively. The flow rate for each run started at 0.1 ml/min for 5 min, to alleviate backpressure associated with injecting chloroform. The gradient started at 0% B and increased linearly to 100% B over the course of 45 min with a flow rate of 0.4 ml/min, followed by an isocratic gradient of 100% B for 17 min at 0.5 ml/min before equilibrating for 8 min at 0% B with a flow rate of 0.5 ml/min. Frozen cell pellets for polar metabolomic analyses were extracted in 180 µl 40:40:20 acetonitrile:methanol:water with inclusion of internal standard d3-serine (10 nmol). Following 30 s of thorough vortexing and 1 minute of bath sonication, the polar metabolite fraction (supernatant) was isolated by centrifugation at 13,000 x g for 15 minutes. 20 µl of this supernatant was analyzed by SRM-based targeted or untargeted LC-MS/MS. For separation of polar metabolites, normal-phase chromatography was performed with a Luna-5 mm NH2 column (50 x 4.60 mm, Phenomenex). Mobile phases were as follows, Buffer A: acetonitrile, Buffer B: 95:5 water:acetonitrile with 0.1 % formic acid or 0.2 % ammonium hydroxide with 50 mM ammonium acetate for positive and negative ionization mode, respectively. The flow rate for each run started at 0.2 ml/min for 5 min, followed by a gradient starting at 0% B and increasing linearly to 100% B over the course of 45 min with a flow rate of 0.7 ml/min, followed by an isocratic gradient of 100% B for 17 min at 0.7 ml/min before equilibrating for 8 min at 0% B with a

24
flow rate of 0.7 ml/min. MS analysis was performed with an electrospray ionization (ESI) source on an Agilent 6430 QQQ LC-MS/MS. The capillary voltage was set to 3.0 kV, and the fragmentor voltage was set to 100 V. The drying gas temperature was 350oC, the drying gas flow rate was 10 l/min, and the nebulizer pressure was 35 psi. For both polar and nonpolar targeted metabolomic analysis, representative metabolites were quantified by SRM of the transition from precursor to product ions at associated collision energies . Untargeted LC-MS was performed by scanning a mass range of m/z 50-1200 and data was exported as mzdata files and uploaded to XCMSOnline (xcmsserver.nutr.berkeley.edu) to identify metabolites that were differentially changed. These metabolites from untargeted analysis were putatively identified through using the METLIN online database. Standards were purchased to confirm coelution and fragmentation of the standard with the metabolite of interest. This metabolite was then quantified by SRM analysis. Metabolites were quantified by integrating the area under the peak and were normalized to internal standard values, and then levels were expressed as percent of control. We have also extracted cells directly on the cell culture dish by pipetting 180 µl of -20oC 40:40:20 acetonitrile:methanol:water directly onto the cells, followed by vortexing the resulting cellular metabolome mixture and centrifugation at 10,000 x g for 10 minutes. The supernatant was then analyzed by SRM-based analysis and isotopic levels of glycolytic intermediates from [13C]glucose labeling of cells for 24 h were compared between the on-plate extraction procedure and extraction of isolated cell pellets kept at - 80oC. We find that there is no difference in the levels of isotopically incorporated glycolytic intermediates between the on-plate extraction compared with the extraction of isolated cell pellets (data not shown). Analysis of Steady-State Isotopic Incorporation into Glycolytic Metabolites Steady-state isotopic glycolytic metabolism was measured by labeling cells with [12C] or [13C]glucose and quantifying both nonisotopic and isotopic incorporation into glycolytic intermediates. Cells were treated with either 10mM [12C]glucose or [13C]glucose in glucose-free RPMI media, 48 h following transfection of cells with siControl or siINPP1 oligonucleotides. Cells were harvested 24 hours after labeling with [12C]/[13C]glucose and the polar metabolome was extracted as previously described and analyzed by SRM- based targeted LC-MS/MS for both nonisotopic and isotopic glycolytic intermediates. Western Blotting Cells were lysed by probe sonication in PBS containing both protease and phosphatase inhibitors. Proteins were resolved by electrophoresis on 4-15% Tris-Glycine pre-cast Mini- PROTEAN TGX gel (BioRad Laboratories), and transferred to PVDF membranes using the iBlot system (Invitrogen). Blots were blocked with 5% nonfat milk in a Tris- buffered saline containing Tween-20 (TBST) solution for 60 minutes at room temperature, washed in 1x TBST, and probed with primary antibody of interest diluted in 5% BSA TBST solution. Following 3 subsequent TBST washes, the blots were incubated in the dark with a IR-linked secondary at room temperature for 1 hour. Following 3 more washes, blots were visualized using an Odyssey Li-Cor scanner.

25
Oncogene overexpression in MCF10A cells. We will fully describe the generation of these lines in a subsequent manuscript. Briefly, the oncogenes described in Supplemental Figure 5 were stably expressed in MCF10A cells and infected cells were selected by puromycin. Glucose Consumption. Glucose consumption from RPMI media was measured by collecting media and performing a colorimetric glucose assay kit purchased from Abcam per the manufacturers protocol.

26
CHAPTER THREE
The Ether Lipid Generating Enzyme AGPS Alters the Balance of Structural and
Signaling Lipids to Fuel Cancer Pathogenicity
27
Introduction Cancer cells have fundamentally altered metabolism that drives their pathogenic features (71,72). One hallmark of cancer cells is a heightened de novo lipogenic signature that serves as a critical foundation for generating lipids required for cell proliferation(33,87). For nearly half a century, it has been known that cancer cells possess dramatically higher levels of ether lipids compared to normal cells(46,88–90). Ether lipids have an alkyl or alkenyl chain on one or more carbons of the glycerol backbone bonded through an ether or vinyl linkage, rather than the usual ester linkage. The physiological roles of ether lipids are not well-understood, but they have been implicated in maintaining physicochemical properties of cell membranes, such as membrane fluidity, membrane fusion events, and lipid raft microdomains(91,92). Certain ether lipids, such as lysophosphatidic acid-ether (LPAe) or platelet activating factor (PAFe), are signaling molecules that have been shown to possess bioactive and even oncogenic properties through binding specific receptors(35,48,93–95). In the late 1960s, Snyder and colleagues first reported that rodent and human tumors possess significantly higher levels of ether lipids relative to normal tissue. Over the ensuing decades, dramatic elevations in ether lipid content have been confirmed for a wide range of cancer cells and primary tumors from several tissues of origin and have been correlated with the proliferative capacity and tumorigenic potential of cancer cells(46,88–90). Nonetheless, whether elevated ether lipids are causally linked, or merely associated with, cancer pathogenicity has remained unclear. In this chapter, we show that inactivation of the critical enzyme for ether lipid synthesis, alkylglycerone phosphate synthase (AGPS), lowers ether lipids levels and impairs cancer pathogenicity, while AGPS overexpression elevates ether lipid levels and increases cancer cell motility, survival, and tumor growth. We also show that AGPS has a larger role beyond generating ether lipids to include controlling fatty acid, eicosanoid, and acylglycerophospholipid metabolism to favor generation of oncogenic signaling lipids, such as LPAe, lyosphosphatidic acid (LPA), and eicosanoids, which fuel aggressive and tumorigenic features of cancer(35,37,94). Our studies reveal a heretofore-unrecognized role of AGPS and ether lipids that shifts the balance of fatty acid use from structural membrane lipids towards generation of oncogenic signaling lipids. Cancer Cells Exhibit Heightened AGPS Expression and Ether Lipid Metabolism AGPS converts acyl-glycerone-3-phosphate into alkyl-glycerone-3-phosphate, which is a requisite step in the generation of all ether lipids. We hypothesized that cancer cells and tumors, which possess elevated levels of ether lipids, would have heightened AGPS expression. Consistent with this premise, we find that AGPS is highly expressed across aggressive breast (231MFP), melanoma (C8161), and prostate cancer (PC3) cells compared to less aggressive cancer cells (MCF7, MUM2C, and LNCaP, respectively) (Figure 3-1A, Figure 3-2A). We have reported that these aggressive cancer cells have heightened migratory, invasive, and tumorigenic properties compared to less aggressive cells(4,41,96). We also show that AGPS expression is elevated 2-4-
28
fold in Nottingham grade I (low-grade), II (intermediate-grade), and III (high-grade) primary human breast tumors (Figure 3-1B), as well as in estrogen receptor-positive/progesterone receptor-positive (ER(+)/PR(+)) and ER-negative/PR-negative (ER(-)/PR(-)) breast tumors (Figure 3-1C), compared to normal breast tissue, indicating that AGPS expression may be heightened early in breast cancer development. Consistent with this premise, we find that the expression of the commonly dysregulated transforming oncogene H-RAS (97)is heightened in low, moderate, and high-grade primary human breast tumors and correlates significantly with AGPS expression (Figure 3-1D). We also find that H-RAS expression is higher in the aggressive 231MFP breast and C8161 melanoma cancer cells compared to the less-aggressive MCF7 breast and MUM2C melanoma cancer cells (Figure 3-1E). Consistent with this association between H-RAS and AGPS, H-RAS transformation of MCF10A mammary epithelial cells (98) induces upregulation of AGPS expression (Figure 3-1E). We show that transformation of cells by H-RAS is one regulatory route through which cells may upregulate AGPS expression. We also show that the aggressive human breast 231MFP, melanoma C8161, and prostate PC3 cancer cells, as well as H-RAS-transformed MCF10A cells, possess significantly higher ether lipid levels compared with their less aggressive MCF7, MUM2C, and LNCaP counterparts, or MCF10A control cells (Figure 3-1G, Figure 3-2 B-F). Heightened lipid species include phosphatidic acid-ether (PAe), LPAe, phosphatidyl inositol-ether (PIe), phosphatidylcholine-ether (PCe), lysophosphatidylcholine-ether (LPCe), phosphatidylserine-ether (PSe), phosphatidylglycerol-ether (PGe), lysophopshatidylglycerol-ether (LPGe) lipids, and plasmalogen ether lipids, such as phosphatidylethanolamine-plasmalogen (PEp) (Figure 3-1G, Figure 3-2 B-F). We provide the specific ether (“e”) or plasmalogen (“p”) species and alkyl chain length and type (carbon number: degree of unsaturation—e.g. C16:0e is a palmityl-ether linkage with no unsaturation) in Figure 3-1G, Figure 3-2 B-F. Our results show that AGPS expression and ether lipid levels are heightened in multiple types of aggressive human cancer cells, and upon RAS transformation, and that AGPS expression is increased in primary breast tumors. AGPS is a Critical Enzyme in Cancer Pathogenicity We next sought to determine the extent to which AGPS was necessary for maintaining the pathogenic features of cancer cells. We generated two independent stable knockdown lines of AGPS with greater than 90 % knockdown in breast 231MFP and melanoma C8161 cancer cells (Figure 3-3A, Figure 3-4A). AGPS inactivation results in a significant decrease in cellular motility, invasiveness, and anchorage-independent growth in soft agar in both breast and melanoma cancer cells, and reduces cell survival in breast cancer cells (Figure 3-3 B-E, Figure 3-4 B-E). AGPS inactivation also reduces breast 231MFP and melanoma C8161 tumor xenograft growth in immune deficient mice (Figure 3-3F. Figure 3-4 F). We also stably overexpressed AGPS in the less aggressive breast (MCF7) and melanoma (MUM2C) cancer cells to determine whether AGPS was sufficient to confer pathogenic features (Figure 3-4 G). AGPS overexpression increased cell migration and serum-free cell survival in situ, and tumor xenograft growth in vivo (Figure 3-4 H-I). Our
29
results indicate that AGPS not only is important to maintain aggressive and tumorigenic features, but also is sufficient to confer these effects in less aggressive human cancer cells. Functional Metabolomics Reveals Widespread Alterations in Cellular Lipid Levels Upon AGPS Knockdown or Overexpression We next sought to understand the mechanism through which AGPS drives cancer pathogenicity. We performed both targeted and untargeted metabolomic analyses to comprehensively identify alterations in cancer cell metabolites upon AGPS knockdown in 231MFP breast and C8161 melanoma cells (Figure 3-5A-C, Figure 3-6 A-C, Figure 3-7 A-C). We used single reaction monitoring (SRM)-based targeted metabolomic analysis to quantify the levels of ~100 common lipids, and used untargeted metabolomic profiling to comparatively profile levels of an additional >3,000 ions. We used the METLIN database to generate putative identifications for many of the altered metabolites and quantified these metabolites by SRM analysis(99). We then filtered for metabolites that were changed significantly in both shRNA oligonucleotide knockdown lines (shAGPS-1, shAGPS-2). Consistent with the function of AGPS as an early critical step in ether lipid synthesis, AGPS inactivation in 231MFP and C8161 cancer cells showed global reduction in the levels of multiple structural ether lipid and plasmalogen species, including PCe, LPCe, PEe, LPEe, PSe, PGe, monoalkylglycerol ether (MAGe), PAe, PIe, lysophosphatidyl inositol-ether (LPIe), PEp, lysophosphatidyl ethanolamine-plasmalogen (LPEp), phosphatidylcholine-plasmalogen (PCp), and phosphatidyl serine-plasmalogen (PSp) (Fig. 3-5 A-C, Figure 3-6 A-C, Figure 3-7 A-C). We also find lower levels of the signaling ether lipids LPAe and LPA-plasmalogen (LPAp) that, similar to their acyl-LPA counterparts, stimulate LPA receptors (35,94)(Figure 3-5 B-C, Figure 3-6). Intriguingly, AGPS knockdown also lowers levels of saturated and unsaturated free fatty acids (FFA) in both breast and melanoma cancer cells, with a striking reduction in the levels of arachidonic acid-derived signaling eicosanoids, prostaglandin E2/D2 (PGE2/PGD2) (37) in 231MFP breast cancer cells (Figure 3-5C, Figure 3-6C). We also observe increases in the levels of several diacylated glycerophospholipids, with a particular enrichment in arachidonoyl-containing acyl-glycerophospholipids (e.g. C16:0/C20:4 PC, C16:0/C20:4 PE, C16:0/C20:4 PG), coupled with lower levels of several acyl-lysophospholipids (e.g. LPA, LPE, LPC) (Figure 3-5B, 3-5C, Figure 3-6B, 3-7C). Overall, this lipidomic signature suggests that AGPS knockdown has broader effects beyond ether lipid pathways that include fatty acid, eicosanoid, and acyl-glycerophospholipid metabolism. Interestingly, we find that AGPS overexpression in MCF7 breast cancer cells is sufficient to increase several ether lipids as well as oleic and arachidonic acid (Figure 3-8A). In AGPS overexpressing MUM2C melanoma cancer cells, we see a similar increase in the levels of ether lipids, as well as reduced levels of arachidonoyl-containing glycerophospholipids (Fig. 3-8B). PGE2/PGD2 levels were not detectable in either mock or AGPS-overexpressing cells, suggesting that additional enzymatic pathways may be required, such as cyclooxygenase enzymes(37), to generate these
30
lipids. Our results are consistent with the conjecture of Welsh et al. that lack of AGPS activity is responsible for the general deficiency of ether lipids in MCF7 cells(100). Isotopic Fatty Acid Tracing Reveals Alterations in Arachidonate Utilization Upon Inactivation of AGPS Our results showing that AGPS knockdown leads to lower arachidonic acid and eicosanoid levels and an increase in certain arachidonoyl-containing acyl-glycerophospholipids implies a shift in fatty acid use towards specific diacylated structural lipids and away from lysophospholipids and eicosanoids. Consistent with this premise, isotopic fatty acid tracing with deuterated d8-arachidonic acid in 231MFP breast cancer cells reveals heightened d8-incorporation into acylglycerophospholipids and reduced incorporation into ether lipids and eicosanoids upon AGPS knockdown (Figure 3-5D). In contrast, isotopic tracing with d4-palmitic acid did not show increased d4-incorporation into acylglycerophospholipids, despite reduced incorporation into ether lipids upon AGPS knockdown (Figure 3-5E). These results indicate preferential incorporation of arachidonic acid into acylglycerophospholipids, compared to saturated fatty acids. This shift in fatty acid utilization may be attributed to either increased lysophospholipid acyltransferase activity, reduced phospholipid hydrolysis, or lower cyclooxygenase activity. Upon testing for these possibilities by qPCR, we found that AGPS knockdown led to increased levels of LPC acyl transferase (LPCAT1), but no change in cytosolic phospholipase A2 (PLA2G4A) or cyclooxygenase 2 (PTGS2) expression (Figure 3-9A). These results indicate that AGPS knockdown directs fatty acid use to generating arachidonoyl acylglycerophospholipids through increased acylation of fatty acids onto glycerol-phosphate and lysophospholipids, depleting the arachidonic acid pool that generates eicosanoids. AGPS Affects Cancer Pathogenicity through Multiple Lipid Signaling Pathways Among the many lipidomic changes upon AGPS knockdown, we were particularly intrigued by the lower levels of LPAe and PGE2 in 231MFP breast cancer cells and LPAe and LPA in C8161 melanoma cancer cells. Both LPA-ether and its acyl-LPA counterpart act as oncogenic signaling lipids that bind LPA receptors to drive multiple aspects of cancer (13). PGE2 is also a signaling lipid that acts through EP2 receptors to fuel proliferative, malignant and tumorigenic features of cancer(37). Consistent with their function, C18:0e LPAe fully rescues and PGE2 partially rescues the migratory and invasive deficits conferred by AGPS knockdown in 231MFP breast cancer cells (Figure 3-9B-C). LPAe, but not PGE2, fully rescues the migratory and invasive impairments in shAGPS C8161 cells, consistent with the lipidomic signature showing that eicosanoids are not detected in these cells. We find that C18:0 LPA also partially or fully rescues the migratory impairments in shAGPS 231MFP and C8161 cells, respectively (Figure 3-10 C-D), likely because either acyl-LPA or LPAe can rescue reduced LPA receptor signaling caused by lower LPAe or LPA levels. We also show that palmitate (C16:0 FFA) partially rescues the pathogenic deficits of AGPS knockdown, likely through the

31
generation of acyl-LPA (Figure 3-9B-C, Figure 3-10C-D). Indeed, we show that d4-C16:0 FFA labeling of 231MFP cancer cells results in the generation of d4-C16:0 LPA (Figure 3-10 E) We note that no other ether lipids such as platelet activating factor (PAF), C16:0e/C20:4 PCe, or C16:0e LPCe rescue the oncogenic impairments, confirming the specificity of our proposed mechanism. Interestingly, C18:0e LPAe, but not PGE2, significantly rescues the upregulation of LPCAT1 expression in AGPS knockdown breast cancer cells, suggesting that the broader alterations in fatty acid, acylglycerophospholipid, and PGE2 levels may be downstream of reduced LPAe signaling (Figure 3-9D). In AGPS-overexpressing cancer cells that show higher levels LPAe but undetectable levels of PGE2, we show that the increased migration observed in AGPS-overexpressing MCF7 and MUM2C cancer cells is significantly reversed by an LPA receptor antagonist Ki16425, but not by the cyclooxygenase inhibitor ibuprofen (Figure 3-11). We profiled expression of LPCAT1 in primary human breast tumors to determine whether LPCAT1 expression was lower compared to normal breast tissue. Instead, we find that LPCAT1 expression is significantly higher in primary breast tumors compared to normal breast tissue (Figure 3-12). Our finding that reduced LPAe signaling leads to an upregulation in LPCAT1 expression may occur only upon knockdown of AGPS, or depletion of cellular ether lipids, under conditions in which cancer cells have adapted to a state of higher ether lipid levels. Overall, AGPS expression is heightened in aggressive human cancer cells and primary human breast tumors and AGPS inactivation significantly impairs aggressive features of cancer cells and attenuates tumor growth, not only through lowering the levels of oncogenic ether lipids, but also through altering arachidonic acid utilization away from protumorigenic eicosanoids and lysophospholipids (Figure 3-9). Conclusions We show here that AGPS serves as a metabolic node in cancer cells that maintains levels of structural and signaling ether lipids, and also modulates fatty acid utilization pathways to favor generation of key oncogenic lysophospholipids and eicosanoids, which promote survival, migratory, invasive, and tumorigenic features. We used advanced metabolomic platforms to gain broad overview into changes in cancer cell lipid metabolism that are controlled by AGPS, but there are many metabolic alterations that we have not yet been able to identify. These yet uncharacterized AGPS-mediated changes to the lipidome may yield further insights into the roles of AGPS in cancer. Although we have established the importance of AGPS in controlling the levels of oncogenic signaling lipids, such as LPAe, LPA, and eicosanoids, there may be other enzymes or regulatory pathways, even within the ether lipid metabolic pathway, that can be targeted to achieve similar effects. For example, we have reported that monacylglycerol lipase is upregulated across aggressive cancer cells and primary tumors where it controls release of FFAs from monoacylglycerols to fuel generation of FFA-derived oncogenic signaling lipids, such as LPA and PGE2 to drive malignant
32
features of cancer(4). Chiang et al., demonstrated that blocking of KIAA1363, a deacetylase of 2-acetyl MAGe, lowers levels of its neutral ether lipid product MAGe, which decreases the levels of its downstream metabolite LPAe, leading to impaired cellular migration and tumor growth(48). It will be of future interest to determine effects of polypharmacologically blocking several of these pathways simultaneously in cancer cells to achieve maximal anti-cancer activity. Alternatively, controlling the supply of fatty alcohols in cancer cells may also modulate levels of ether lipids similarly to controlling AGPS expression(101). In conclusion, we provide a potential mechanistic link between the historical associations between aggressive or hyperproliferative tumors and higher levels of ether lipids(89). Our studies indicate a previously unrecognized cross-talk between ether lipid, fatty acid, eicosanoid, and acylglycerophospholipid metabolism in cancer cells that leads to an optimal landscape of lipid signaling pathways that subserve cancer pathogenesis. Manipulating this landscape may yield novel strategies for thwarting the lipid signals that drive cancer pathogenicity, and may provide unique approaches to cancer therapy. Materials and Methods Cell Lines The C8161 and MUM2C lines were provided by Professor Benjamin Cravatt at The Scripps Research Institute. MCF10A and HRAS-transformed cells were obtained from Stefano Piccolo at the University of Padua(63). The 231MFP cells were generated from explanted xenograft tumors of MDA-MB-231 cells, as described previously(86). PC3 and LNCaP cells were obtained from ATCC. Cell Culture Conditions HEK293T cells were cultured in DMEM media containing 10% FBS and maintained at 37oC with 5% CO2. C8161 cells were cultured in RPMI1640 media containing 10% FBS and glutamine maintained at 37oC at 5% CO2. 231MFP cells were cultured in L15 media containing 10% FBS and glutamine and were maintained at 37oC in 0% CO2. MCF10A cells were cultured as previously described(63). qPCR qPCR was performed using the manufacturer’s protocol for Fischer Maxima SYBRgreen, with 10 mM primer concentrations. Primer sequences were derived from Primer Bank(102). Breast Tumor array qPCR Breast Cancer tumor array 1 was purchased from Origene and qPCR was performed on the array using the protocol described above. Constructing AGPS Knockdown Cells

33
We used short-hairpin (sh) RNA using two independent silencing oligonucleotides to knockdown the expression of AGPS using previously described procedures(4). For construction of stable shRNA knockdown lines, lentiviral plasmids (pLKO.1) containing shRNA (purchased from Open Biosystems) against human AGPS were transfected into HEK293 cells using Fugene (Roche). Lentivirus was collected from filtered culture media and delivered to the target cancer cell line with polybrene. These target cells were subsequently selected over 3 days with 1 mg/ml puromycin. The short-hairpin sequences used for constructing the two independent AGPS knockdowns were as follows: shRNA#1: AATTCGCTCAAACATTCCTTC and shRNA #2: AAGGATTTCTTCTCTAGCAGC. The control shRNA was targeted against green fluorescent protein with the target sequence GCAAGCTGACCCTGAAGTTCAT. We confirmed knockdown by qPCR. Overexpression Studies in Human Cancer Cell Lines Stable AGPS overexpression was achieved by subcloning the AGPS gene into the pMSCVpuro vector (Clontech), generating retrovirus using the AmphoPack-293 Cell Line, as described above with the RNA interference studies. The human AGPS was subcloned into the pMSCVpuro (Clontech) by using XHO1 and AGEI restriction sites using the following primers 5’GTACGTACCTCGAGAGGCGGCGGCTG-3’ and 5’GTACGTACGAATTCGTTTCTGTTTCC-3’. Cancer Phenotypic Studies Migration, invasion, cell proliferation, and survival studies were performed as described previously(4). Details are providing in Supporting Information. Tumor Xenograft Studies Human tumor xenografts were established by transplanting cancer cells ectopically into the flank of C.B17 SCID mice (Taconic Farms) as described previously(4). Briefly, cells were washed two times with PBS, trypsinized, and harvested in serum-containing medium. Next, the harvested cells were washed two times with serum-free medium and resuspended at a concentration of 2.0 x 10⁴ cells/ml and 100 ml was injected. Growth of the tumors was measured every 3-6 days with calipers. Metabolomic profiling of cancer cells Metabolite measurements were conducted using modified versions of previous procedures(4,103). Details are provided in Supporting Information. Analysis of Isotopic incorporation of palmitate and arachidonate into lipids

34
Isotopically labeled fatty acid incorporation into lipids was measured by labeling cells with d4 palmitic acid or d8-arachidonic acid and measuring isotopic incorporation into lipids. Cells were treated either with palmitate, d4-palmitate, arachidonate or d8-arachidonate (10mM). Cells were harvested 4 hours after labeling and the nonpolar metabolome was extracted as previously described and analyzed by SRM-based targeted LC-MS/MS for the presence of isotopically labeled lipids.

35
CHAPTER FOUR
Conclusion
36
One century ago, Otto Warburg first proposed that cancer might be a disease defined by aberrant metabolism. Since then, scientists have sought to understand the specific metabolic pathways that enable normal cells to take on a tumorigenic state. In chapter one we highlighted many of the unique profiling strategies and discovery platforms that have paved the way in identifying new biochemical pathways that contribute to cancer progression. These include multiple unique controls on the glycolytic pathway, allowing for increased carbon flux through adjacent metabolic pathways, including amino acid synthesis and nucleotide biosynthesis. These also include a fundamental rewiring of cancer cells, enabling them to utilize alternative carbon sources, such as glutamine, to fuel TCA cycle anaplerosis; in certain cases, this anaplerosis occurs through IDH1/2-mediated reductive carboxylation resulting in the generation of intermediates, such as citrate, that can serve as essential precursors for FASN mediated denovo lipogenesis. Beyond the synthesis of cellular membrane lipids required for proliferation, studies have also found that lipids within a cancer cell can be mobilized by distinct enzymatic pathways (e.g. MAGL, LPL, KIAA1363) not only to be used as an essential fuel source, but that can also function as pro-tumorigenic signaling lipids. (eg LPA) Quite interestingly, recent studies have shown that, through mutations, certain metabolic enzymes can acquire novel functions, which allow for the generation of novel oncogenic biomolecules (“oncometabolites”) that have widespread metabolic and epigenetic consequences. These findings have all arisen out of the integrated utilization of genomic (deep genome sequencing and RNA sequencing), proteomic (post-translational mapping and functional proteomics), and metabolomic (steady-state, targeted/untargeted, and metabolic flux analysis) approaches. While these unique discovery platforms and global profiling strategies have undoubtedly revealed many critical metabolic nodes in cancer, their application has been largely limited to a few number of metabolic pathways, leaving the vast majority of cancer metabolism undiscovered. Furthermore, many of the current biochemical discoveries of cancer have focused primarily on the transformative stage of cancer progression rather than the malignant progression of the disease. In chapters two and three, we used functional metabolomics to highlight two novel metabolic pathways in cancer that are critical drivers of malignancy. In chapter two we revealed the role of inositol phosphate metabolism, driven by the metabolic enzyme INPP1, in promoting cancer malignancy. Specifically we showed that INPP1 is highly expressed in aggressive ovarian and melanoma cancer cells and primary human tumors. Using functional metabolomic platforms, we discovered that INPP1 is a unique metabolic node that controls glycolytic metabolism and glucose- derived LPA synthesis. Furthermore, we showed that INPP1 inactivation results in impairments in cancer cell pathogenicity specifically by impairing LPA signaling and subsequent modulation of the Hippo signaling pathway. In chapter 3 we used functional metabolomic platforms to show that the ether lipid generating enzyme AGPS serves as a metabolic node in cancer cells that functions to maintain the levels of both structural and signaling lipids. Specifically, we used metabolomics to show that AGPS maintains this balance between structural and
37
signaling lipids by modulating fatty acid utilization pathways to favor the generation of key oncogenic lysophospholipids and eicosanoids, which promote survival, migratory, invasive, and tumorigenic features. Taken together, we have shown that global profiling strategies, including genomics, proteomics, and metabolomics, have proven vital for uncovering many of the metabolic nodes that subserve cancer pathogenesis. We have provided two unique examples that highlight how functional metabolomics can elucidate novel metabolic drivers of cancer malignancy. Specifically, we used metabolomic platforms to uncover both the role of inositol phosphate recycling (driven by the metabolic enzyme INPP1) in promoting cancer aggressiveness, as well as the role of the ether-lipid generating enzyme AGPS in maintaining the optimal lipid landscape for cancer cells to thrive. These findings have not only provided critical insight into the fundamental biochemistry that underlies aggressive cancer, but they have also paved the way for the future development of targeted treatments that may someday be used in the clinic to treat human cancer.
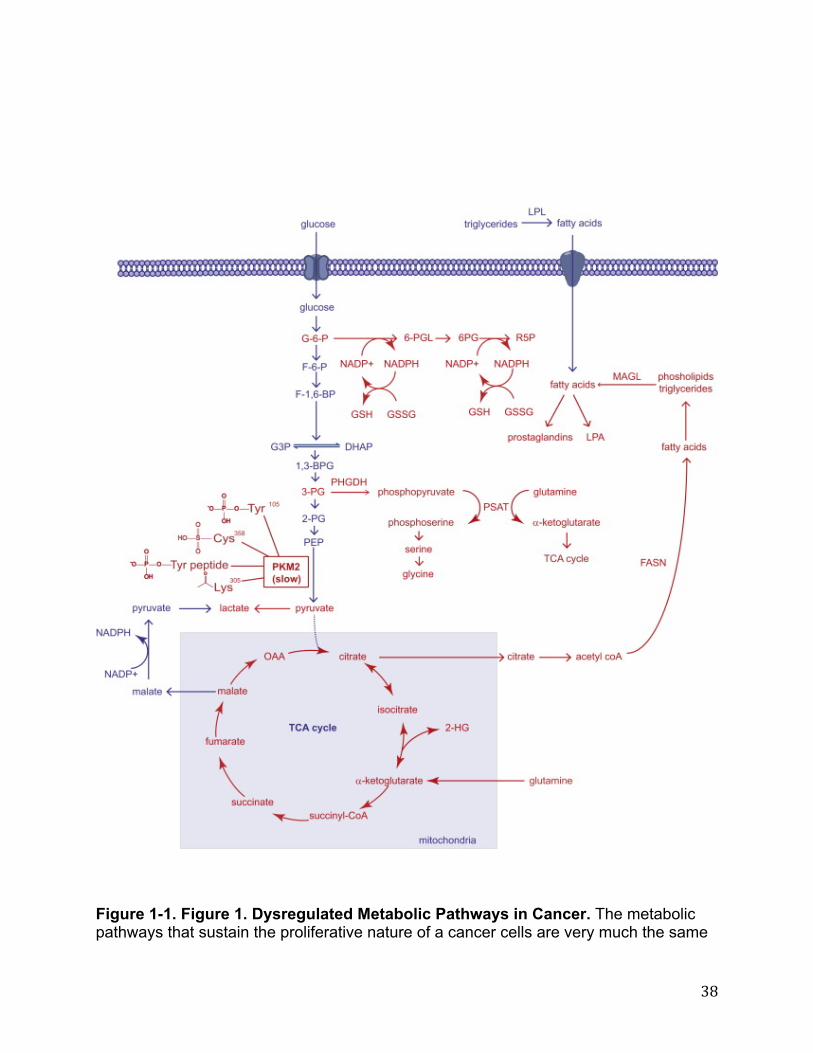
38
Figure 1-1. Figure 1. Dysregulated Metabolic Pathways in Cancer. The metabolic pathways that sustain the proliferative nature of a cancer cells are very much the same
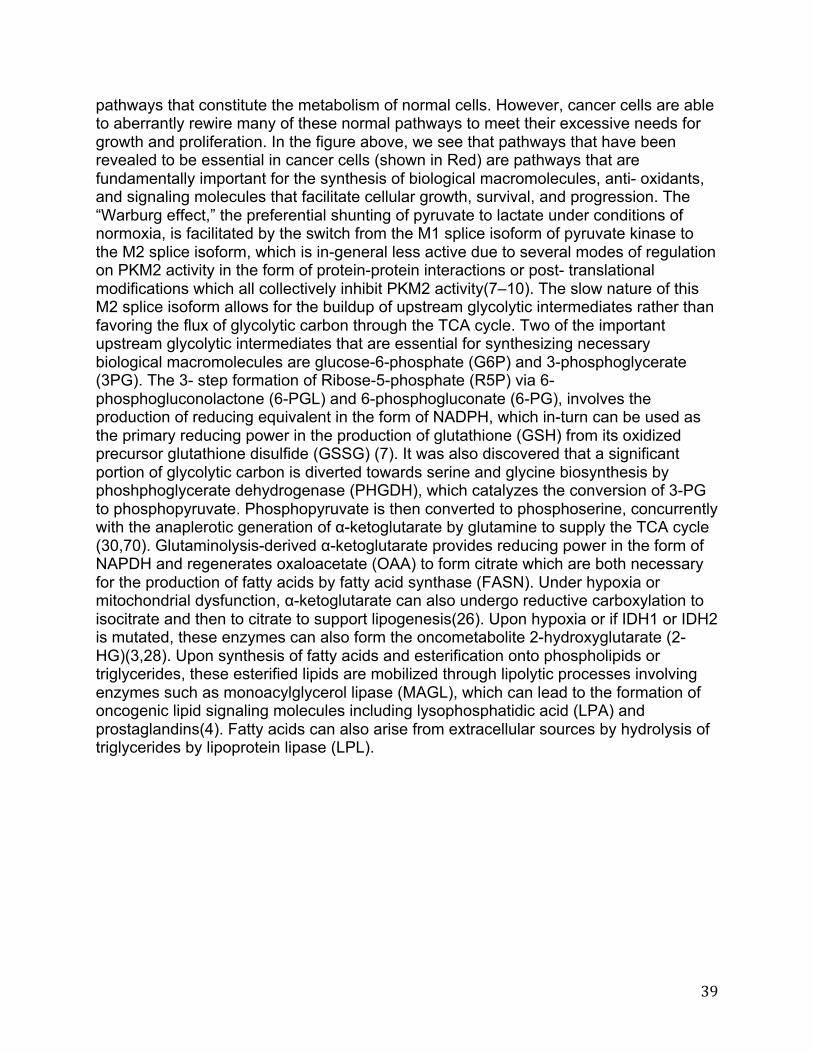
39
pathways that constitute the metabolism of normal cells. However, cancer cells are able to aberrantly rewire many of these normal pathways to meet their excessive needs for growth and proliferation. In the figure above, we see that pathways that have been revealed to be essential in cancer cells (shown in Red) are pathways that are fundamentally important for the synthesis of biological macromolecules, anti- oxidants, and signaling molecules that facilitate cellular growth, survival, and progression. The “Warburg effect,” the preferential shunting of pyruvate to lactate under conditions of normoxia, is facilitated by the switch from the M1 splice isoform of pyruvate kinase to the M2 splice isoform, which is in-general less active due to several modes of regulation on PKM2 activity in the form of protein-protein interactions or post- translational modifications which all collectively inhibit PKM2 activity(7–10). The slow nature of this M2 splice isoform allows for the buildup of upstream glycolytic intermediates rather than favoring the flux of glycolytic carbon through the TCA cycle. Two of the important upstream glycolytic intermediates that are essential for synthesizing necessary biological macromolecules are glucose-6-phosphate (G6P) and 3-phosphoglycerate (3PG). The 3- step formation of Ribose-5-phosphate (R5P) via 6-phosphogluconolactone (6-PGL) and 6-phosphogluconate (6-PG), involves the production of reducing equivalent in the form of NADPH, which in-turn can be used as the primary reducing power in the production of glutathione (GSH) from its oxidized precursor glutathione disulfide (GSSG) (7). It was also discovered that a significant portion of glycolytic carbon is diverted towards serine and glycine biosynthesis by phoshphoglycerate dehydrogenase (PHGDH), which catalyzes the conversion of 3-PG to phosphopyruvate. Phosphopyruvate is then converted to phosphoserine, concurrently with the anaplerotic generation of α-ketoglutarate by glutamine to supply the TCA cycle (30,70). Glutaminolysis-derived α-ketoglutarate provides reducing power in the form of NAPDH and regenerates oxaloacetate (OAA) to form citrate which are both necessary for the production of fatty acids by fatty acid synthase (FASN). Under hypoxia or mitochondrial dysfunction, α-ketoglutarate can also undergo reductive carboxylation to isocitrate and then to citrate to support lipogenesis(26). Upon hypoxia or if IDH1 or IDH2 is mutated, these enzymes can also form the oncometabolite 2-hydroxyglutarate (2-HG)(3,28). Upon synthesis of fatty acids and esterification onto phospholipids or triglycerides, these esterified lipids are mobilized through lipolytic processes involving enzymes such as monoacylglycerol lipase (MAGL), which can lead to the formation of oncogenic lipid signaling molecules including lysophosphatidic acid (LPA) and prostaglandins(4). Fatty acids can also arise from extracellular sources by hydrolysis of triglycerides by lipoprotein lipase (LPL).

40
Figure 1-2. Discovering PKM2 as a Phosphopeptide Binding Protein. Christofk et al labeled HeLa cells with heavy isotopic 13C- lysine and 13C-arginine or normal isotopic 12C-lysine and 12C-arginine. The heavy labeled cells lysates were collected and flowed over a phosphorylated peptide library while the light labeled lysates were flowed over an unphosphorylated peptide library. The eluents were then digested and subsequently analyzed by LC/MS/MS. By identifying proteins that exhibited a high ratio of heavy to light label, phosphoproteins could be identified. One such protein that exhibited a particularly high SILAC heavy to light ratio was Pyruvate Kinase M2 (PKM2)(8).
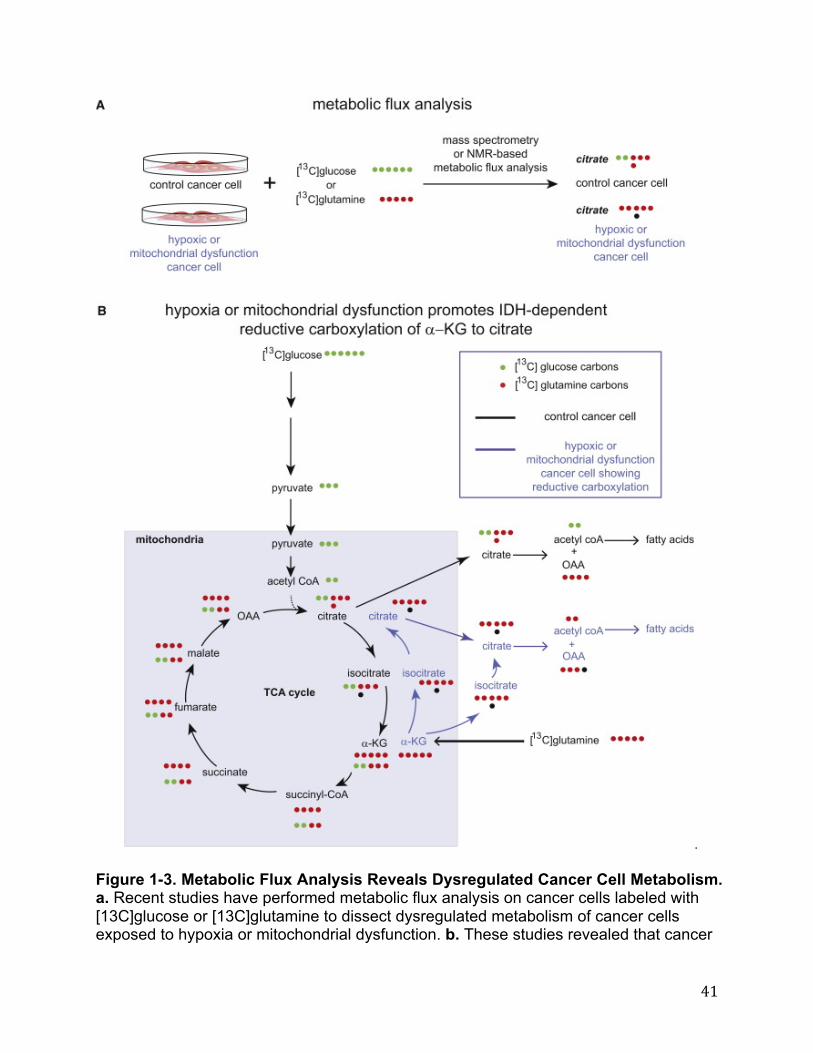
41
. Figure 1-3. Metabolic Flux Analysis Reveals Dysregulated Cancer Cell Metabolism. a. Recent studies have performed metabolic flux analysis on cancer cells labeled with [13C]glucose or [13C]glutamine to dissect dysregulated metabolism of cancer cells exposed to hypoxia or mitochondrial dysfunction. b. These studies revealed that cancer

42
cells under normoxia can form citrate through both glycolysis (bottom row of labeled carbons in TCA cycle) and glutaminolysis (top row of labeled carbons in TCA cycle). Upon hypoxia or mitochondrial dysfunction, cancer cells undergo a metabolic switch in citrate is produced through glutamine- dependent reductive carboxylation of α−ketoglutarate (α−KG) to form isocitrate via IDH1 or IDH2 and then to citrate to support de novo lipogenesis (blue arrows). Shown in the figure are [13C]-labeled carbons arising either from glucose (in green) or glutamine (in red) after one pass through the TCA cycle. Carbon atoms arising from CO2 are labeled as black dots.
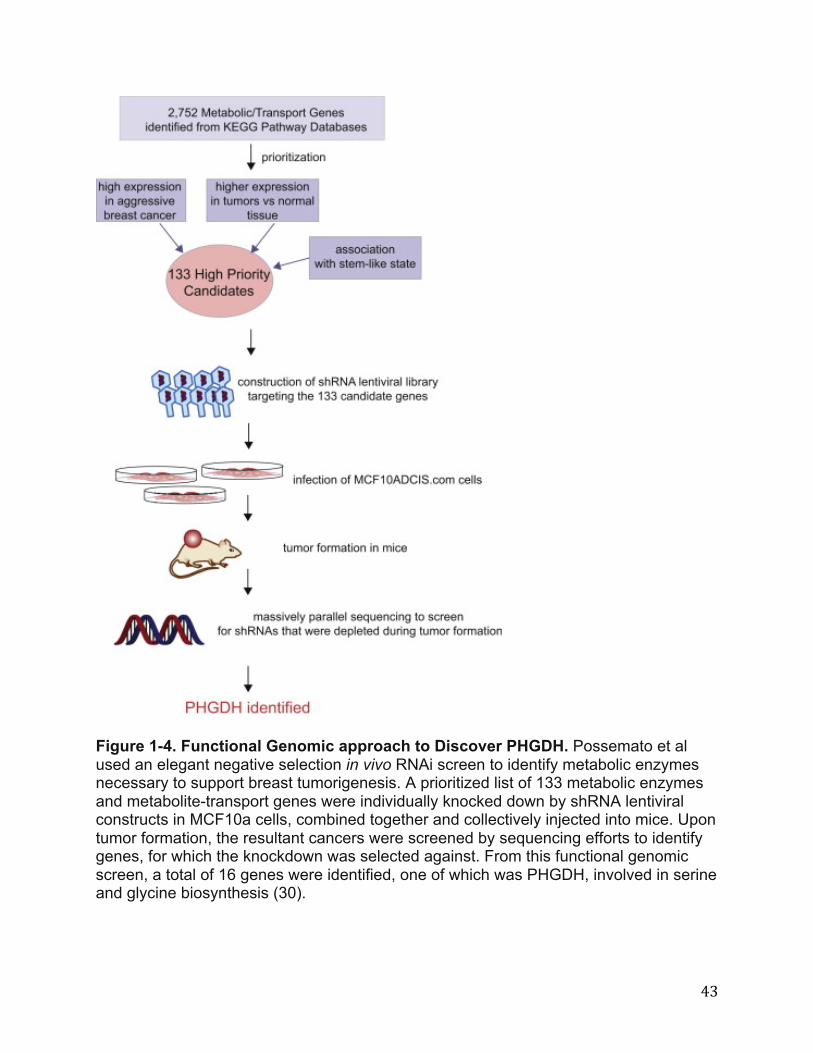
43
Figure 1-4. Functional Genomic approach to Discover PHGDH. Possemato et al used an elegant negative selection in vivo RNAi screen to identify metabolic enzymes necessary to support breast tumorigenesis. A prioritized list of 133 metabolic enzymes and metabolite-transport genes were individually knocked down by shRNA lentiviral constructs in MCF10a cells, combined together and collectively injected into mice. Upon tumor formation, the resultant cancers were screened by sequencing efforts to identify genes, for which the knockdown was selected against. From this functional genomic screen, a total of 16 genes were identified, one of which was PHGDH, involved in serine and glycine biosynthesis (30).

44
Figure 1-5. Activity-Based Protein Profiling (ABPP) Coupled with Untargeted Metabolomics in Annotating Dysregulated Enzyme Activities in Aggressive Cancers. a) ABPP uses active site-directed probes to assess the functional state oflarge numbers of enzymes directly in complex proteomes(42). Activity-based probes
45
(ABPs) consist of a reactive group, a spacer arm, and a detection handle (e.g. fluorophore such as a rhodamine (Rh) or biotin (B)). In a typical ABPP experiment, a proteome is reacted with the activity-based probe and readout either by fluorescence on a 1D-SDS-PAGE gel for rhodamine-ABPs (above), or by avidin enrichment, on-bead tryptic digest, and identification and quantification of peptides by Multidimensional Protein Identification Technology (MudPIT) for biotinylated-ABPs(42). Through ABPP analysis of the serine hydrolase proteome with the serine hydrolase ABP fluorophosphonate (FP)-Rh or FP-biotin, KIAA1363 and MAGL were identified as upregulated in multiple human aggressive cancer cells and primary tumors(4,48). b) ABPP can also be used in a competitive format to assess potency and selectivity of inhibitors in complex proteomes. Inhibitors can compete with the ABP and enzyme inhibition will be read-out by loss of fluorescence on a SDS-PAGE gel (using a rhodamine-ABP) or loss of spectral counts by mass spectrometry (using a biotintylated-ABP). Competitive ABPP was used to develop selective inhibitors of KIAA1363 and MAGL(43,48,51). c) With selective inhibitors in hand, the metabolic roles of KIAA1363 and MAGL were elucidated using untargeted LC-MS-based metabolomic approaches in which metabolomes were extracted and analyzed by LC- MS, broadly scanning for metabolites across a large mass range. To complement the large amount of data that arises from untargeted metabolomic analysis, powerful software tool XCMS was used for quantitation and identification of ions within LC/MS datasets(104) which aligns, quantifies, and statistically rank ions that are altered between two sets of metabolomic data. This methodology was used to annotate KIAA1363 and MAGL as enzymes that regulates ether lipid and fatty acid networks, respectively(4,48).

46
Figure 2-1. Phenotypic effects of knocking down INPP1 and HYI. (A) Proliferation over 48 hours between our aggressive (C8161 and SKOV3) compared to non- aggressive cancer cells (MUM2C and OVCAR3) is the same. (B) INPP1 and HYI were
Supplemental Figures
Figure S1. Phenotypic effects of knocking down INPP1 and HYI. (A) Proliferation
over 48 hours between our aggressive (C8161 and SKOV3) compared to non-
aggressive cancer cells (MUM2C and OVCAR3) is the same. (B) INPP1 and HYI were
upregulated across aggressive human cancer cells. INPP1 and HYI expression was
knocked down by siRNA in SKOV3 cells. Migration, proliferation, and cell survival was

47
upregulated across aggressive human cancer cells. INPP1 and HYI expression was knocked down by siRNA in SKOV3 cells. Migration, proliferation, and cell survival wasquantified. (C) INPP1 expression was tested by Western blotting across a panel of MCF10A cells expressing various oncogenes. INPP1 is upregulated upon induction with PI3KCA, NeuNT, MEKDD1, HRAS, and BRAF. (D) INPP1 protein expression in shControl and shINPP1 cells. (E) INPP1 gene and protein expression and cellular migration in SKOV3 cells with 4 individual siRNA oligonucleotides for INPP1. siINPP1-1 and siINPP1-4 knocked down INPP1 expression >70 %, ascertained by qPCR and Western blotting. Both siINPP1-1 and siINPP1-4 impair migration in SKOV3 cells. (F) INPP1 knockdown does not affect SKOV3 or C8161 cell proliferation or survival. (G) INPP1 knockdown impairs migration, but not proliferation or survival, in OVCAR3 and MUM2C less aggressive ovarian and melanoma cancer cells. (H) Reinforced expression of mouse INPP1 in SKOV3 cells transfected with siINPP1, confirmed by qPCR and Western blotting. Reinforced INPP1 expression rescues the migratory defect conferred by INPP1 knockdown. Data represent average ± sem; n = 3-5/group. Significance is expressed as *p<0.05 compared to siControl, #p<0.05 compared to siINPP1.compared to low- grade primary human ovarian tumors or melanoma or breast tumors compared to normal tissue. *p < 0.05. Data are presented as mean ± sem; n = 3–5/group for (A-C) and n=3- 39 for (D).
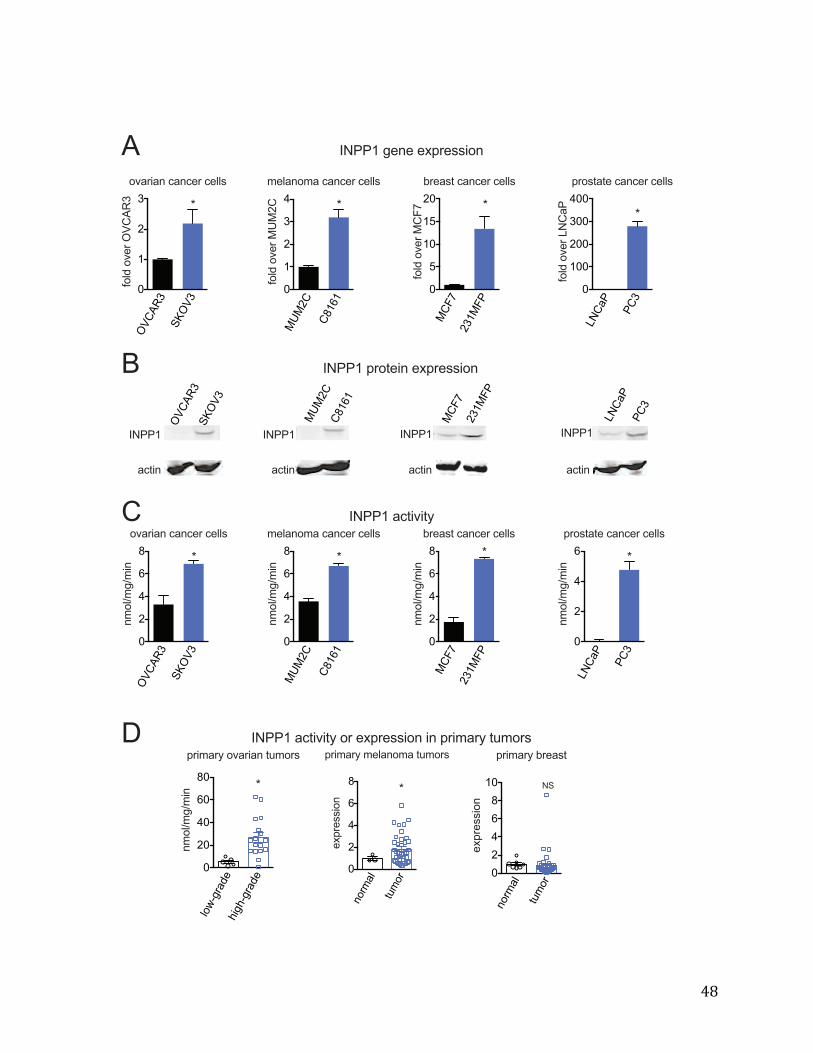
48
!"##$%&'('%')*+',,-.(/
0
345/67
89347
:
$
;
7
<.=>%.?'+%345/67
.?@+-@(%A@(A'+%A'==,
B
.?@+-@(%A@(A'+%A'==,
345/67
89347
:
;
C
D
E
(F.=GF&GF-(
B
*+-F@+H%.?@+-@(%I2F.+,
=.JK&+@>'
L-&LK&+@>'
:
;:
C:
D:
E:
(F.=GF&GF-(
B
F'=@(.F@%A@(A'+%A'==,
MNM;5
5E$D$
:
$
;
7
C
<.=>%.?'+%MNM;5 B
F'=@(.F@%A@(A'+%A'==,
MNM;5
5E$D$
:
;
C
D
E
(F.=GF&GF-(
B
(.+F@=
I2F.+
:
;
C
D
E
*+-F@+H%F'=@(.F@%I2F.+,
')*+',,-.(
B
O+'@,I%A@(A'+%A'==,
M51P
;7$M1#
:
Q
$:
$Q
;:
<.=>%.?'+%M51P
B
O+'@,I%A@(A'+%A'==,
M51P
;7$M1#
:
;
C
D
E
(F.=GF&GF-(
B
(.+F@=
I2F.+
:;CDE$:
*+-F@+H%O+'@,I
')*+',,-.(
"8
*+.,I@I'%A@(A'+%A'==,
R"5@#
#57
:
$::
;::
7::
C::
<.=>%.?'+%R"5@# B
*+.,I@I'%A@(A'+%A'==,
R"5@#
#57
:
;
C
D(F.=GF&GF-(
B
!"##$%*+.I'-(%')*+',,-.(
!"##$%@AI-?-IH
!"##$%@AI-?-IH%.+%')*+',,-.(%-(%*+-F@+H%I2F.+,
5
S
345/67
89347
MNM;5
5E$D$
M51P
;7$M1#
R"5@#
#57
!"##$
@AI-(
!"##$
@AI-(
!"##$
@AI-(
!"##$
@AI-(
49
Figure 2-2. INPP1 is highly expressed in aggressive cancer cells and primary tumors. (A-C) INPP1 gene (A) and protein (B) expression and INPP1 activity (C) across aggressive ovarian, melanoma, breast, and prostate cancer cells (SKOV3, C8161, 231MFP, and PC3) compared to their less aggressive counterparts (OVCAR3, MUM2C, MCF7, and LNCaP) as measured by quantitative PCR (qPCR) (A), Western blotting (B), and inositol-1,4-bisphosphate phosphatase activity measuring inositol phosphate product formation by LC/MS (C). (D) INPP1 enzyme activity (for ovarian tumors) and mRNA expression (for melanoma and breast tumors) in high-grade compared to low- grade primary human ovarian tumors or melanoma or breast tumors compared to normal tissue. *p < 0.05. Data are presented as mean ± sem; n = 3–5/group for (A-C) and n=3- 39 for (D).

50
!"#$%!&"
'()&*+,*&-'.
%./&"'*&0
%.12334
%./&"'*&0
%.12334
5!,(*6+7
%./&"'*&0
%.12334
%!/&"'*&0
%!12334
8
98
488
498
:+&;+<&"'*&0
6=>*6%%!&"
???
%./&"'*&0
%.12334
%!/&"'*&0
%!12334
8
98
488
498
@ABCD
:+&;+<&"'*&0
? ?
%./&"'*&0
%.12334
%!/&"'*&0
%!12334
8
98
488
498
@ABCD
:+&;+<&"'*&0
??
8 48 78 D8 E88
788
E88
F88
G88
@ABCD
H$I%
'()&*+#&0()6+J))D K
%./&"'*&0%.12334
?
%./&"'*&0
%.12334
%!/&"'*&0
%!12334
8
98
488
498$<'!#!'I
:+&;+<&"'*&0
? ?
%./&"'*&0
%.12334
%!/&"'*&0
%!12334
8
98
488
4986=>*6%%!&"
:+&;+<&"'*&0
??
%./&"'*&0
%.12334
%!/&"'*&0
%!12334
8
98
488
498
/G4F4
:+&;+<&"'*&0
? ?%./&"'*&0
%.12334
%!/&"'*&0
%!12334
8
98
488
498
/G4F4
:+&;+<&"'*&0
??
8 9 48 49 78 798
988
4888
4988
/G4F4
H$I%
'()&*+#&0()6+J))D K %./&"'*&0
%.12334
?
%./&"'*&0
%.12334
%!/&"'*&0
%!12334
8
98
488
498$<'!#!'I
:+&;+<&"'*&0
? ?
@ABCD+J&#$*!$"K
12334+6=>*6%%!&"+$"H+$<'!#!'I+!"+12334+L"&<LH&-"+0!"6%
/G4F4+J)60$"&)$K
)!,*$'!&"
%./&"'*&0
%.12334
%./&"'*&0
%.12334
M
/
NN
O
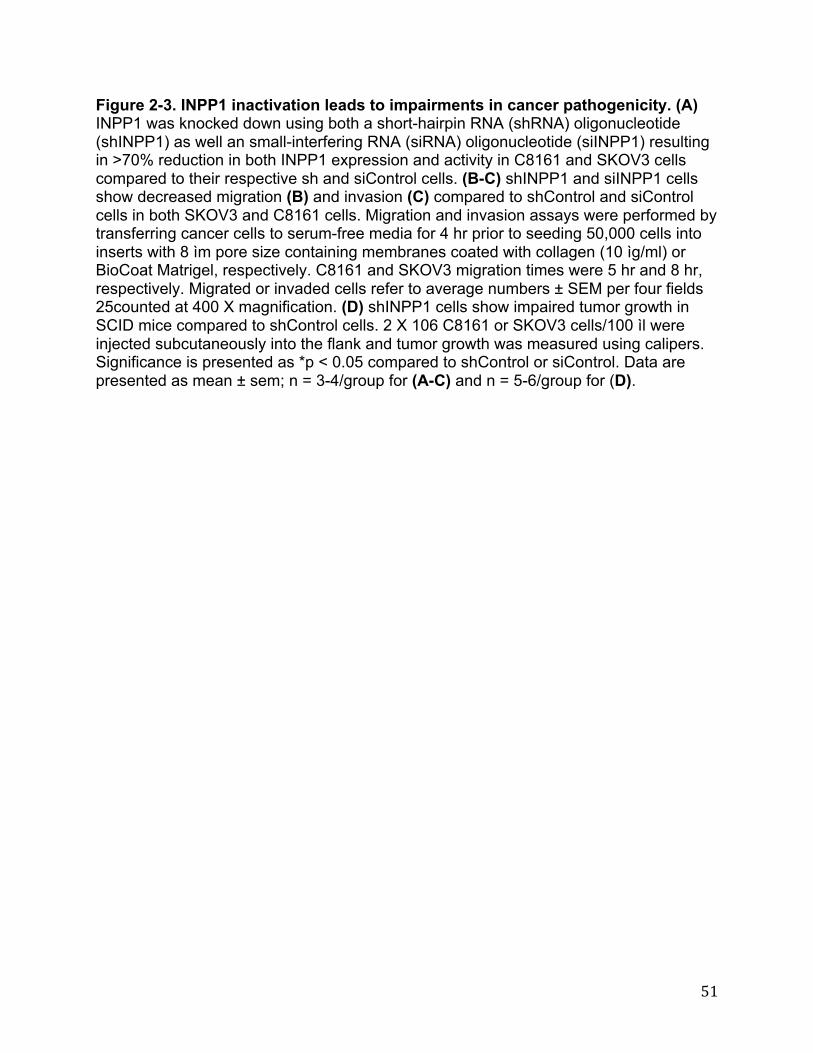
51
Figure 2-3. INPP1 inactivation leads to impairments in cancer pathogenicity. (A) INPP1 was knocked down using both a short-hairpin RNA (shRNA) oligonucleotide (shINPP1) as well an small-interfering RNA (siRNA) oligonucleotide (siINPP1) resulting in >70% reduction in both INPP1 expression and activity in C8161 and SKOV3 cells compared to their respective sh and siControl cells. (B-C) shINPP1 and siINPP1 cells show decreased migration (B) and invasion (C) compared to shControl and siControl cells in both SKOV3 and C8161 cells. Migration and invasion assays were performed by transferring cancer cells to serum-free media for 4 hr prior to seeding 50,000 cells into inserts with 8 ìm pore size containing membranes coated with collagen (10 ìg/ml) or BioCoat Matrigel, respectively. C8161 and SKOV3 migration times were 5 hr and 8 hr, respectively. Migrated or invaded cells refer to average numbers ± SEM per four fields 25counted at 400 X magnification. (D) shINPP1 cells show impaired tumor growth in SCID mice compared to shControl cells. 2 X 10⁶ C8161 or SKOV3 cells/100 ìl were injected subcutaneously into the flank and tumor growth was measured using calipers. Significance is presented as *p < 0.05 compared to shControl or siControl. Data are presented as mean ± sem; n = 3-4/group for (A-C) and n = 5-6/group for (D).

52
!"#$%&'(
)*+,)*+-)*+()*+.)*+))**)
.
(
-
,
/+012$&
3425+6718#&
9&:1;4249"6'/%43"2"8#'43'<=>>)'?846?54@8
&2&01:&524@&%&584:'6718#"8#
1A/1%1#"8&
#2$64A&+B+>
C(>DEFG>#2H6&%42+(+>
<>
I)BJ*'K>G
I)LJ*'K>GI)LJ)'K>GI)BJ*&'K>G&
<>
A7I48:%42
A7<=>>)
A"I48:%42
A"<=>>)
*
,*
)**
M'43'648:%42
NN
I)BJ*'K>G
A7I48:%42
A7<=>>)
A"I48:%42
A"<=>>)
*
,*
)**
M'43'648:%42
N N
<>
A7I48:%42
A7<=>>)
A"I48:%42
A"<=>>)
*
,*
)**
M'43'648:%42
N N
I)BJ*'K>G
A7I48:%42
A7<=>>)
A"I48:%42
A"<=>>)
*
,*
)**
M'43'648:%42
N N
#2$64A&+B+>
A7I48:%42
A7<=>>)
A"I48:%42
A"<=>>)
*
,*
)**
M'43'648:%42
N N
I)LJ*'K>G
A7I48:%42
A7<=>>)
A"I48:%42
A"<=>>)
*
,*
)**
M'43'648:%42
N N
#2$64A&+B+>
A7I48:%42
A7<=>>)
A"I48:%42
A"<=>>)
*
,*
)**
M'43'648:%42
N
N
I)LJ*'K>G
A7I48:%42
A7<=>>)
A"I48:%42
A"<=>>)
*
,*
)**
M'43'648:%42
N N
C(>DEFG>
A7I48:%42
A7<=>>)
A"I48:%42
A"<=>>)
*
,*
)**
M'43'648:%42
NN
A7I48:%42
A7<=>>)
A"I48:%42
A"<=>>)
*
,*
)**
I)LJ)'K>G
M'43'648:%42
N N
C(>DEFG>
A7I48:%42
A7<=>>)
A"I48:%42
A"<=>>)
*
,*
)**
M'43'648:%42
N N
A7I48:%42
A7<=>>)
A"I48:%42
A"<=>>)
*
,*
)**
I)LJ)'K>G
M'43'648:%42
NN
#2H6&%42+(+>A7I48:%42
A7<=>>)
A"I48:%42
A"<=>>)
*
,*
)**
M'43'648:%42
N N
A7I48:%42
A7<=>>)
A"I48:%42
A"<=>>)
*
,*
)**
I)BJ*&'K>G&
M'43'648:%42
N N
#2H6&%42+(+>
A7I48:%42
A7<=>>)
A"I48:%42
A"<=>>)
*
,*
)**
M'43'648:%42
N N
A7I48:%42
A7<=>>)
A"I48:%42
A"<=>>)
*
,*
)**
I)BJ*&'K>G&
M'43'648:%42
N N
G
OPQR(
IL)B)
S
I

53
Figure 2-4. Metabolomic profiling links INPP1 to glycolysis and lipid metabolism (A) Metabolomic analyses of cancer cell steady-state metabolomes with impaired INPP1 activity compared to control cells. The volcano plot shows all ions that were detected by targeted or untargeted metabolomic profiling of shControl and shINPP1 SKOV3 cells. Grey points show the ions and metabolites that were not significantly altered between shControl and shINPP1 cells. The red and blue points to the right of the dotted black line are metabolites that were significantly (p<0.05) and commonly elevated or lowered, respectively, across C8161 and SKOV3 sh and siINPP1 compared to their respective sh and siControl cells. C16:0, C18:0, C18:1 refer to acyl chain length:unsaturation on LPA. C16:0e LPAe refers to the ether lipid counterpart of LPA (LPA-ether). (B-C) Levels of metabolites that were altered upon INPP1 knockdown in SKOV3 (B) and C8161 (C) cells, quantified by SRM. Data are presented as means ± sem of n=4-5/group with significance expressed as *p < 0.05 for INPP1 knockdown compared to control.

54
Figure 2-5. Metabolomic profiling of two individual siINPP1 oligonucleotides and metabolomics of INPP1 rescue in siINPP1 cells. (A, B) Glycolytic intermediates, IP, and glycerol-3-P levels in SKOV3 cells treated with two independent siINPP1 oligonucleotides (A) or in siINPP1 cells with reinforced INPP1 expression. Cells were harvested 48 h post-transfections of siRNA and mouse INPP1 overexpression constructs. (C) Inositol penaphosphate (IP5) and inositol hexaphosphate (IP6) levels in shControl and shINPP1 SKOV3 cells. Significance in (A-C) is expressed as *p<0.05 comparing siINPP1 or shINPP1 to siControl or shControl and #p<0.05 comparing siINPP1 with reinforced INPP1 expression to siINPP1 alone. All Data represent average ± sem; n = 3-5/group.
Figure S2. Metabolomic profiling of two individual siINPP1 oligonucleotides and
metabolomics of INPP1 rescue in siINPP1 cells. (A, B) Glycolytic intermediates, IP,
and glycerol-3-P levels in SKOV3 cells treated with two independent siINPP1
oligonucleotides (A) or in siINPP1 cells with reinforced INPP1 expression. Cells were
harvested 48 h post-transfections of siRNA and mouse INPP1 overexpression
constructs. (C) Inositol penaphosphate (IP5) and inositol hexaphosphate (IP6) levels in
shControl and shINPP1 SKOV3 cells. Significance in (A-C) is expressed as *p<0.05
comparing siINPP1 or shINPP1 to siControl or shControl and #p<0.05 comparing
siINPP1 with reinforced INPP1 expression to siINPP1 alone. All Data represent average
± sem; n = 3-5/group.
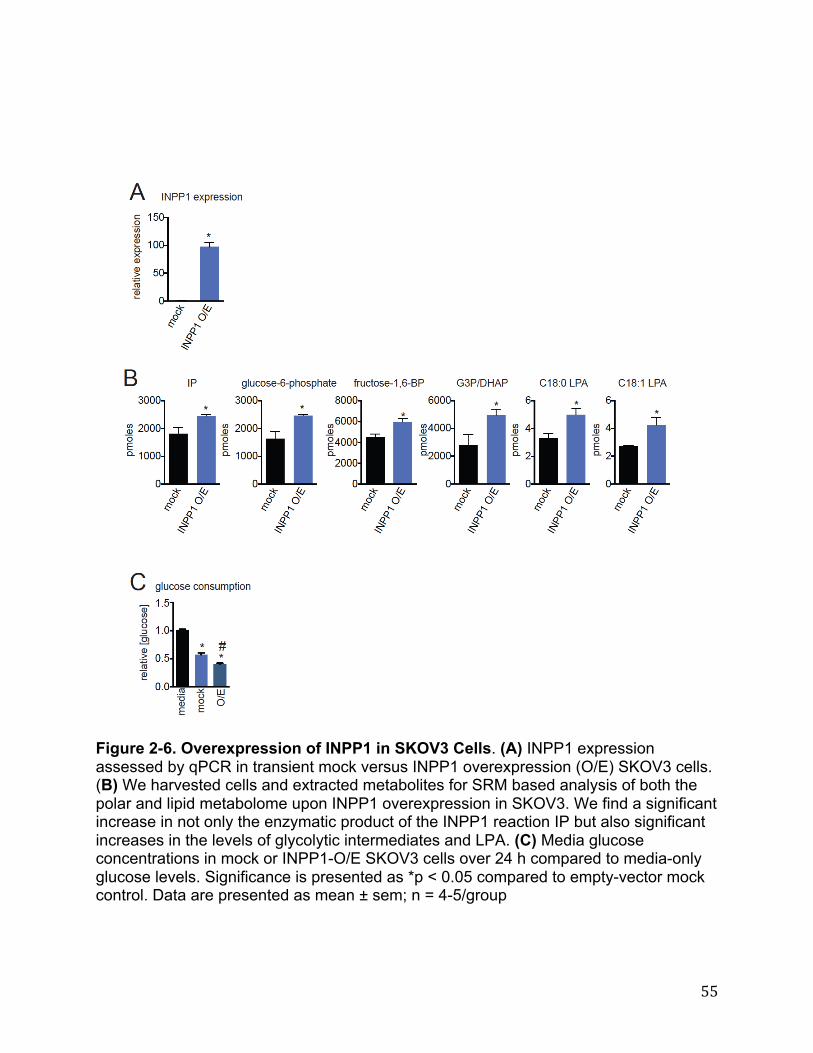
55
Figure 2-6. Overexpression of INPP1 in SKOV3 Cells. (A) INPP1 expression assessed by qPCR in transient mock versus INPP1 overexpression (O/E) SKOV3 cells. (B) We harvested cells and extracted metabolites for SRM based analysis of both the polar and lipid metabolome upon INPP1 overexpression in SKOV3. We find a significant increase in not only the enzymatic product of the INPP1 reaction IP but also significant increases in the levels of glycolytic intermediates and LPA. (C) Media glucose concentrations in mock or INPP1-O/E SKOV3 cells over 24 h compared to media-only glucose levels. Significance is presented as *p < 0.05 compared to empty-vector mock control. Data are presented as mean ± sem; n = 4-5/group
Figure S3. Overexpression of INPP1 in SKOV3 Cells. (A) INPP1 expression
assessed by qPCR in transient mock versus INPP1 overexpression (O/E) SKOV3 cells.
(B) We harvested cells and extracted metabolites for SRM based analysis of both the
polar and lipid metabolome upon INPP1 overexpression in SKOV3. We find a significant
increase in not only the enzymatic product of the INPP1 reaction IP but also significant
increases in the levels of glycolytic intermediates and LPA. (C) Media glucose
concentrations in mock or INPP1-O/E SKOV3 cells over 24 h compared to media-only
glucose levels. Significance is presented as *p < 0.05 compared to empty-vector mock
control. Data are presented as mean ± sem; n = 4-5/group
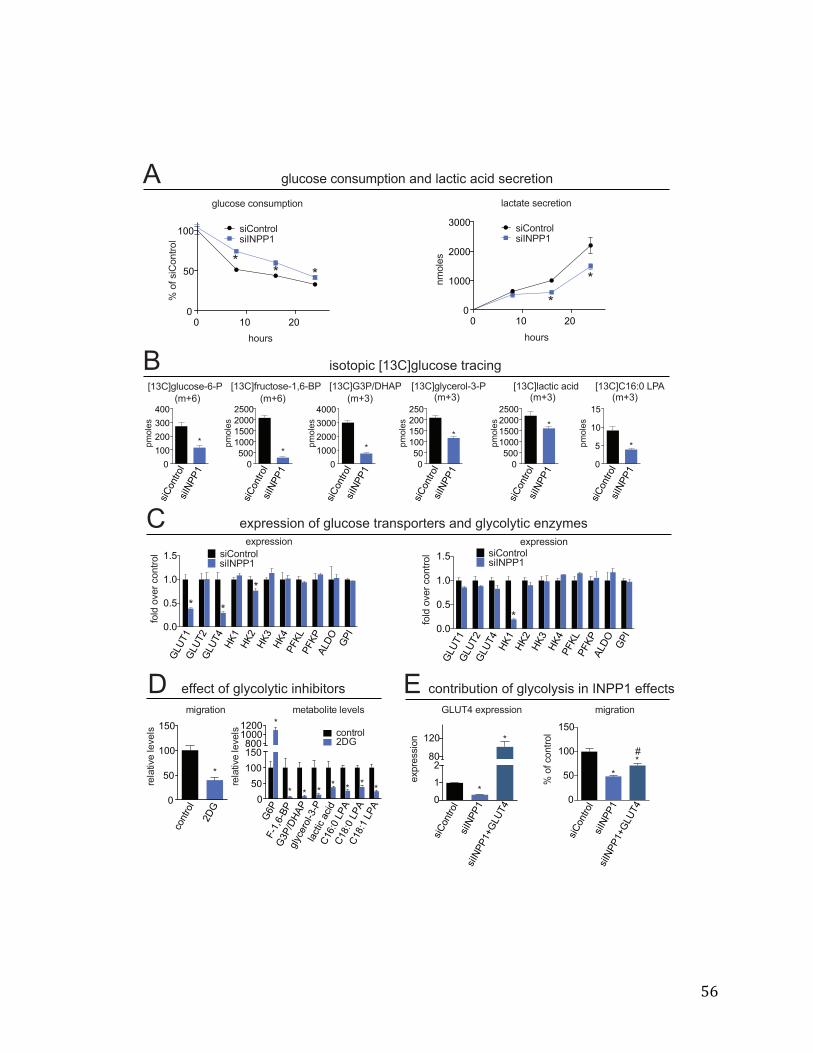
56
!"#$%&'(
) *) +)
)
,)
*))
-.$%/
0'.1'/"2.34%.5
#5$6./&'6.3/$784".3
/"2.34%.5
/"9:;;*
<< <
=*>2?#5$6./&@A@;
B7CAD
/"2.34%.5
/"9:;;*
)
*))
+))
>))
())
87.5&/
<
&E8%&//".3
FGHI*
FGHI+
FGHI(
JK*
JK+
JK>
JK(
;!KG
;!K;
LGMN
F;9
)O)
)O,
*O)
*O,
1.5P'.Q&%'6.34%.5
/"9:;;*/"2.34%.5
<<
<
=*>2?1%$64./&@*RA@S;
B7CAD
/"2.34%.5
/"9:;;*
)
,))
*)))
*,))
+)))
+,))
87.5&/
<
) *) +)
)
*)))
+)))
>)))
-.$%/
37.5&/
5T64T4&'/&6%&4".3
/"2.34%.5
/"9:;;*
<
<
=*>2?F>;UMJL;
B7C>D
/"2.34%.5
/"9:;;*
)
*)))
+)))
>)))
()))
87.5&/
<
&E8%&//".3
FGHI*
FGHI+
FGHI(
JK*
JK+
JK>
JK(
;!KG
;!K;
LGMN
F;9
)O)
)O,
*O)
*O,
1.5P'.Q&%'6.34%.5
/"9:;;*/"2.34%.5
<
=*>2?#5V6&%.5@>@;
B7C>D
/"2.34%.5
/"9:;;*
)
,)
*))
*,)
+))
+,)87.5&/
<
=*>2?5T64"6'T6"P
B7C>D
/"2.34%.5
/"9:;;*
)
,))
*)))
*,))
+)))
+,))
87.5&/
<
/"2.34%.5
/"9:;;*
)
,
*)
*,
87.5&/
=*>2?2*AW)'G;L
B7C>D
<
#5$6./&'6.3/$784".3'T3P'5T64"6'T6"P'/&6%&4".3
"/.4.8"6'=*>2?#5$6./&'4%T6"3#
&E8%&//".3'.1'#5$6./&'4%T3/8.%4&%/'T3P'#5V6.5V4"6'&3XV7&/
L
S
2
6.34%.5
+MF
)
,)
*))
*,)
%&5T4"Q&'5&Q&5/
7"#%T4".3
<
FA;
!@*RA@S;
F>;UMJL;
#5V6&%.5@>@;
5T64"6'T6"P
2*AW)'G;L
2*YW)'G;L
2*YW*'G;L
)
,)
*))
*,)Y))*)))*+))
%&5T4"Q&'5&Q&5/
7&4TZ.5"4&'5&Q&5/
6.34%.5+MF
<
< < << <
<<
/"2.34%.5
/"9:;;*
/"9:;;*CFGHI(
)
*
+Y)
*+)
&E8%&//".3
FGHI('&E8%&//".3
<
<
/"2.34%.5
/"9:;;*
/"9:;;*CFGHI(
)
,)
*))
*,)
0'.1'6.34%.5
7"#%T4".3
<
<[
&11&64'.1'#5V6.5V4"6'"3-"Z"4.%/M \ 6.34%"Z$4".3'.1'#5V6.5V/"/'"3'9:;;*'&11&64/

57
Figure 2-7. INPP1 modulates glycolytic and glucose-derived LPA metabolism (A) Media glucose and lactate levels at 0, 8, 16, and 24 h in siControl and siINPP1 cells, measured by glucose assay kit and SRM-based LC-MS/MS, respectively. (B) steady- state isotopic [13C] incorporation into glycolytic intermediates from treatment of siControl and siINPP1 SKOV3 cells with either 10 mM of nonisotopic glucose or 10mM isotopic [U-13C]glucose for 24 hours in otherwise glucose-free RPMI1640 media. Confirmation that we are measuring isotopic glycolytic intermediates at steady-state is provided in Figure 2-8. Full isotopomer distribution of metabolites is shown in Figure 2-9. (C) Relative gene expression by qPCR of glucose transporters and glycolytic enzymes in SKOV3 and C8161 cells of siControl (black) compared with siINPP1 (blue) cells. (D) Phenotypic and metabolic effects of 2-deoxyglucose (2-DG) in SKOV3 cells. Treatment of SKOV3 cells with 2-DG (in water, 5 mM, 24 h) impairs SKOV3 cell migration (right panel) and lowers post-PGI glycolytic intermediates and LPA levels (left panel). (E) GLUT4 overexpression partially rescues migratory deficits conferred by INPP1 knockdown in SKOV3 cells. qPCR of GLUT4 expression is shown on the left panel and migration data is shown on the right panel. Data are presented as means ± sem of n=3-5/group with significance expressed as *p < 0.05 compared to siControl or control cells and #p<0.05 comparing siINPP1+GLUT4 to siINPP1 groups.

58
Figure 2-8. Establishing time-course for reaching steady-state isotopic labeling with [13C]glucose in SKOV3 cells. We labeled SKOV3 cells with 10 mM [13C]glucose and harvested cells at 24 or 36 h and analyzed isotopic incorporation into glycolytic intermediates and glycerol-3-P. We find that the levels of isotopic glycolytic intermediates are comparable between 24 and 36 h, indicating that 24 h is sufficient to reach steady-state labeling conditions. Data represent average ± sem; n = 4-5/group. Data are not significant (p>0.05) between 36 and 24 h.
Figure S4. Establishing time-course for reaching steady-state isotopic labeling
with [13C]glucose in SKOV3 cells. We labeled SKOV3 cells with 10 mM [13C]glucose
and harvested cells at 24 or 36 h and analyzed isotopic incorporation into glycolytic
intermediates and glycerol-3-P. We find that the levels of isotopic glycolytic
intermediates are comparable between 24 and 36 h, indicating that 24 h is sufficient to
reach steady-state labeling conditions. Data represent average ± sem; n = 4-5/group.
Data are not significant (p>0.05) between 36 and 24 h.
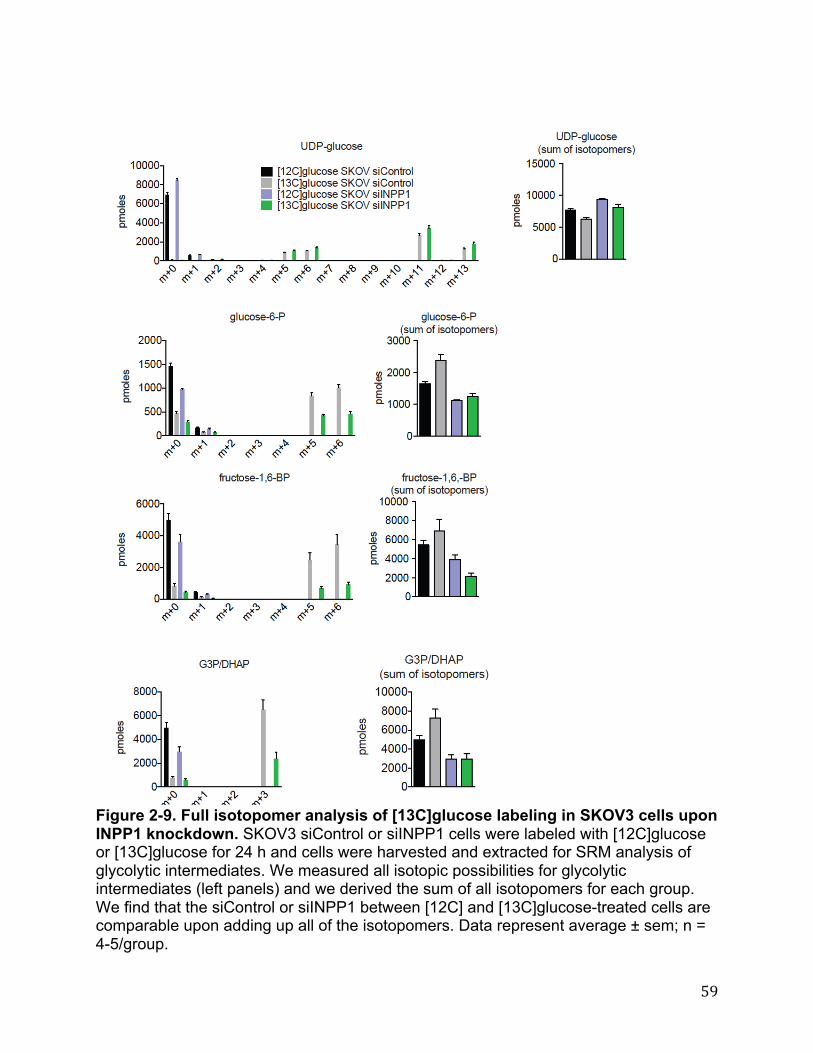
59
Figure 2-9. Full isotopomer analysis of [13C]glucose labeling in SKOV3 cells upon INPP1 knockdown. SKOV3 siControl or siINPP1 cells were labeled with [12C]glucose or [13C]glucose for 24 h and cells were harvested and extracted for SRM analysis of glycolytic intermediates. We measured all isotopic possibilities for glycolytic intermediates (left panels) and we derived the sum of all isotopomers for each group. We find that the siControl or siINPP1 between [12C] and [13C]glucose-treated cells are comparable upon adding up all of the isotopomers. Data represent average ± sem; n = 4-5/group.
Figure S5. Full isotopomer analysis of [13C]glucose labeling in SKOV3 cells upon
INPP1 knockdown. SKOV3 siControl or siINPP1 cells were labeled with [12C]glucose or
[13C]glucose for 24 h and cells were harvested and extracted for SRM analysis of
glycolytic intermediates. We measured all isotopic possibilities for glycolytic
intermediates (left panels) and we derived the sum of all isotopomers for each group.
We find that the siControl or siINPP1 between [12C] and [13C]glucose-treated cells are
comparable upon adding up all of the isotopomers. Data represent average ± sem; n =
4-5/group.
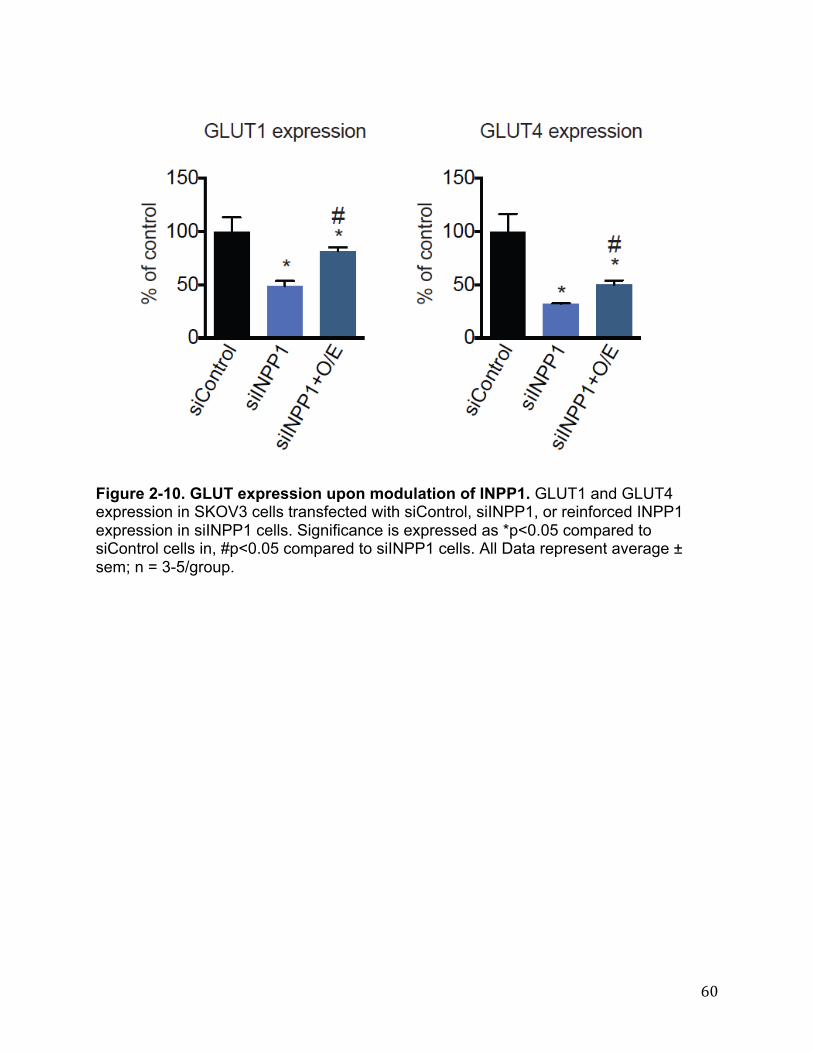
60
Figure 2-10. GLUT expression upon modulation of INPP1. GLUT1 and GLUT4 expression in SKOV3 cells transfected with siControl, siINPP1, or reinforced INPP1 expression in siINPP1 cells. Significance is expressed as *p<0.05 compared to siControl cells in, #p<0.05 compared to siINPP1 cells. All Data represent average ± sem; n = 3-5/group.
Figure S6. GLUT expression upon modulation of INPP1 expression in SKOV3
cells. GLUT1 and GLUT4 expression in SKOV3 cells transfected with siControl,
siINPP1, or reinforced INPP1 expression in siINPP1 cells. Significance is expressed as
*p<0.05 compared to siControl cells in, #p<0.05 compared to siINPP1 cells. All Data
represent average ± sem; n = 3-5/group.

61
Figure 2-11. LPA modulates the migratory defects and glycolytic impairments conferred by INPP1 knockdown (A and B) The migratory impairment in shINPP1
!"#$%&'(
)*+,-.%,/ )*+,-.%,/'0'123
)*45226 )*45226'0'123
)*+,-.%,/ )*+,-.%,/'0'123
)*45226 )*45226'0'123
&77&8.)',7'123'9-.9#,-").',-'#/:8,/:)")';:'<6=+>#/$8,)&'.%98"-#
#/$8,)&?@?2
#/$8,)&'A,$.B
7%$8.,)&?@?2
7%$8.,)&?6C@?D2
E=2FG32#/:8&%,/?=?26?98:/?#/:8&%,/?=?2
'A123B
E1HI
GJ
K"#%9.",-)*+,-.%,/
)*+,-.%,/0123
)*45226
)*452260123
L
(L
6LL
M',7'8,-.%,/
N
O
<6=+>#/$8,)&?@?2AK0@B
)"+,-.%,/
)"45226
)"452260123
LPLLQLL@LLRLL6LLL
SK,/&)
N
O
<6=+>#/$8,)&?@?2AK0@B
8,-.%,/
J"6@QP(
L
PLL
QLL
@LL
RLL
SK,/&)
N
)"+,-.%,/
)"+,-.%,/0123
)"45226
)"452260123
LTL
LT(
6TL
6T(
&US%&))",-
E1HI6'
N
O
<6=+>7%$8.,)&?6C@?D2AK0@B
)"+,-.%,/
)"45226
)"452260123
L
(LL
6LLL
6(LL
SK,/&)
N
O
<6=+>7%$8.,)&?6C@?D2AK0@B
8,-.%,/
J"6@QP(
L
(LL
6LLL
6(LL
PLLL
SK,/&)
N
)"+,-.%,/
)"+,-.%,/0123
)"45226
)"452260123
LTL
LT(
6TL
6T(
GJP
&US%&))",-
N
ON
K"#%9.",-
)*+,-.%,/
)*+,-.%,/0123
)*45226
)*452260123
L
(L
6LL
M',7'8,-.%,/
N
O
<6=+>E=2VFG32AK0=B
)"+,-.%,/
)"45226
)"452260123
L
PLL
QLL
@LL
RLL
SK,/&)
N
ON
<6=+>E=2VFG32AK0=B
8,-.%,/
J"6@QP(
L
(LL
6LLL
6(LL
PLLL
SK,/&)
N
<6=+>#/:8&%,/?=?2AK0=B
)"+,-.%,/
)"45226
)"452260123
L
(L
6LL
6(L
SK,/&)
N
O
<6=+>#/:8&%,/?=?2AK0=B
8,-.%,/
J"6@QP(
L
(L
6LL
6(L
SK,/&) N
WJXY='A,Z9%"9-B +R6@6'AK&/9-,K9B
&77&8.)',7'123',-'#/:8,/:)")';:'<6=+>#/$8,)&'.%98"-#
&77&8.)',7'123',-'#/:8,/:."8'#&-&'&US%&))",-
45226
45226'%&#$/9.&)'#/:8,/:."8'K&.9;,/")K'9-['123')"#-9/"-#'"-'89-8&%'8&//)
3 D
+
F
\ !#/$8,)&'A"-B
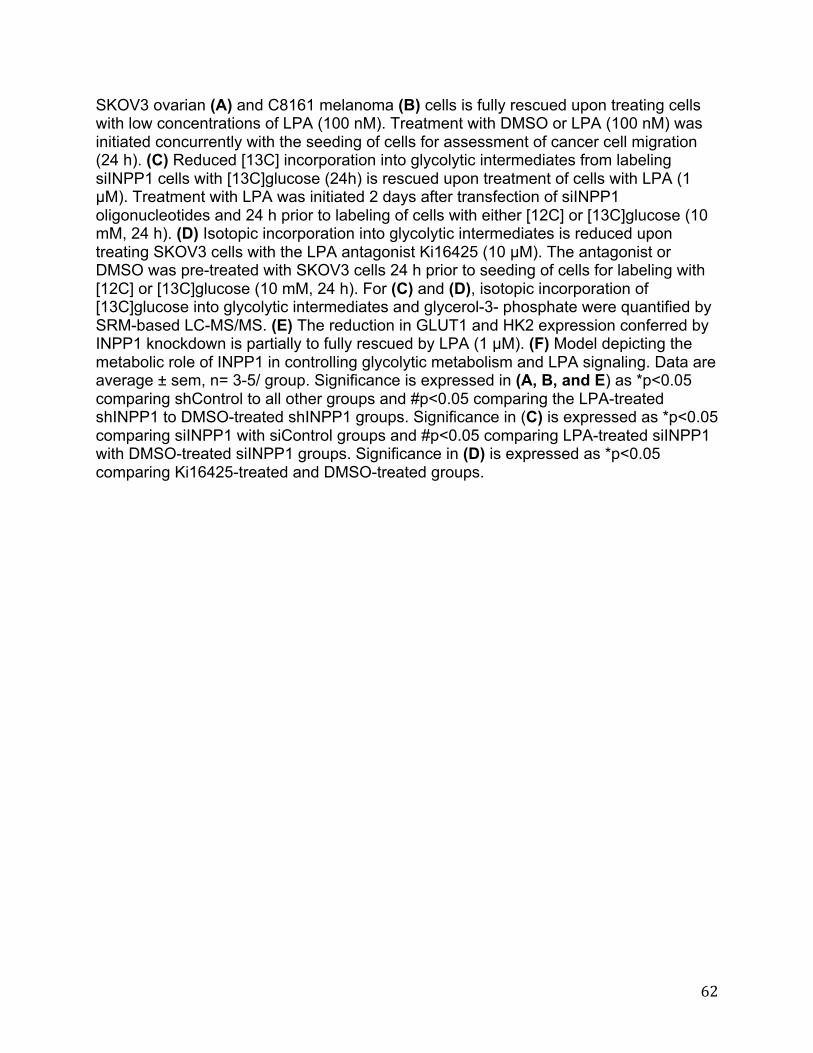
62
SKOV3 ovarian (A) and C8161 melanoma (B) cells is fully rescued upon treating cells with low concentrations of LPA (100 nM). Treatment with DMSO or LPA (100 nM) was initiated concurrently with the seeding of cells for assessment of cancer cell migration (24 h). (C) Reduced [13C] incorporation into glycolytic intermediates from labeling siINPP1 cells with [13C]glucose (24h) is rescued upon treatment of cells with LPA (1 µM). Treatment with LPA was initiated 2 days after transfection of siINPP1 oligonucleotides and 24 h prior to labeling of cells with either [12C] or [13C]glucose (10 mM, 24 h). (D) Isotopic incorporation into glycolytic intermediates is reduced upon treating SKOV3 cells with the LPA antagonist Ki16425 (10 µM). The antagonist or DMSO was pre-treated with SKOV3 cells 24 h prior to seeding of cells for labeling with [12C] or [13C]glucose (10 mM, 24 h). For (C) and (D), isotopic incorporation of [13C]glucose into glycolytic intermediates and glycerol-3- phosphate were quantified by SRM-based LC-MS/MS. (E) The reduction in GLUT1 and HK2 expression conferred by INPP1 knockdown is partially to fully rescued by LPA (1 µM). (F) Model depicting the metabolic role of INPP1 in controlling glycolytic metabolism and LPA signaling. Data are average ± sem, n= 3-5/ group. Significance is expressed in (A, B, and E) as *p<0.05 comparing shControl to all other groups and #p<0.05 comparing the LPA-treated shINPP1 to DMSO-treated shINPP1 groups. Significance in (C) is expressed as *p<0.05 comparing siINPP1 with siControl groups and #p<0.05 comparing LPA-treated siINPP1 with DMSO-treated siINPP1 groups. Significance in (D) is expressed as *p<0.05 comparing Ki16425-treated and DMSO-treated groups.

63
Figure 2-12. AKT and MAP kinase signaling pathways in INPP1 knockdown SKOV3 cells. (A,B) Protein levels of p-AKT (A) and p-ERK (B) compared with RAB11 loading control in SKOV3 cells upon INPP1 knockdown in serum-free media. Western blot data were quantified by densitometry. Data are presented as mean ± SEM of n=3-4/group. Significance is represented as *p<0.05 compared to siControl.
Figure S7. AKT and MAP kinase signaling pathways in INPP1 knockdown SKOV3
cells. (A,B) Protein levels of p-AKT (A) and p-ERK (B) compared with RAB11 loading
control in SKOV3 cells upon INPP1 knockdown in serum-free media. Western blot data
were quantified by densitometry. Data are presented as mean ± SEM of n=3-4/group.
Significance is represented as *p<0.05 compared to siControl.
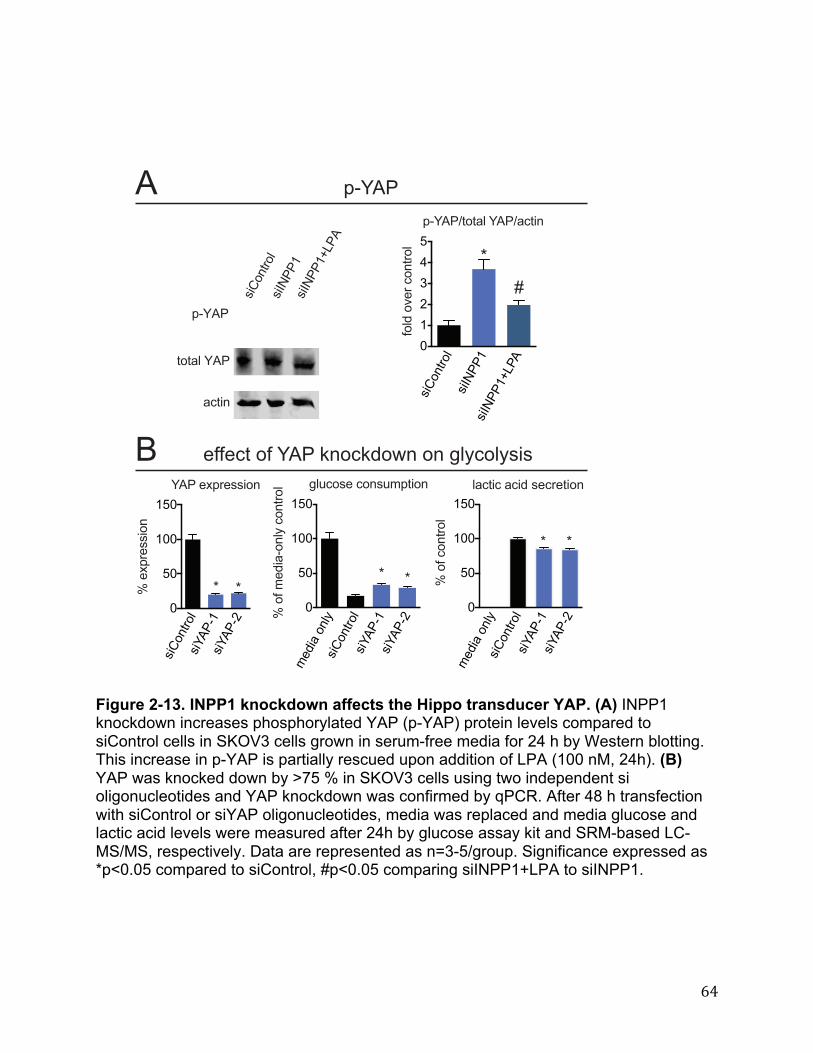
64
Figure 2-13. INPP1 knockdown affects the Hippo transducer YAP. (A) INPP1 knockdown increases phosphorylated YAP (p-YAP) protein levels compared to siControl cells in SKOV3 cells grown in serum-free media for 24 h by Western blotting. This increase in p-YAP is partially rescued upon addition of LPA (100 nM, 24h). (B) YAP was knocked down by >75 % in SKOV3 cells using two independent si oligonucleotides and YAP knockdown was confirmed by qPCR. After 48 h transfection with siControl or siYAP oligonucleotides, media was replaced and media glucose and lactic acid levels were measured after 24h by glucose assay kit and SRM-based LC-MS/MS, respectively. Data are represented as n=3-5/group. Significance expressed as *p<0.05 compared to siControl, #p<0.05 comparing siINPP1+LPA to siINPP1.
)"*+,-%+.
)"/0112
)"/01123415
6
2
7
8
9
:
;+.<'+=&%'>+,-%+.
?@A51B-+-C.'A51BC>-",
D
E)"*+,-%+.
)"/0112
)"/01123415
?@A51
-+-C.'A51
C>-",
?@A515)"*+,-%+.
)"A51@2
)"A51@7
6
:6
266
2:6
F'&G?%&))"+,
A51'&G?%&))"+,
D D
H&<"C'+,.I
)"*+,-%+.
)"A51@2
)"A51@7
6
:6
266
2:6
F'+;'H&<"C@+,.I'>+,-%+. #.$>+)&'>+,)$H?-"+,
D D
H&<"C'+,.I
)"*+,-%+.
)"A51@2
)"A51@7
6
:6
266
2:6
F'+;'>+,-%+.
.C>-">'C>"<')&>%&-"+,
D D
J &;;&>-'+;'A51'K,+>K<+L,'+,'#.I>+.I)")

65

66
Figure 3-1. AGPS is highly expressed in aggressive cancer cells, primary human tumors, and RAS-transformed cells. (A) AGPS gene expression is heightened across aggressive breast (231MFP) and melanoma (C8161) cancer cells (in red), compared to less aggressive breast (MCF7) and melanoma (MUM2C) cancer cells (in black), as measured by quantitative PCR (qPCR). (B) AGPS gene expression is significantly higher in Nottingham grade 1 (low-grade) and grade 2 (intermediate-grade), as well as grade 3 (high-grade) primary human breast tumors compared to normal breast tissue as measured by qPCR. (C) AGPS gene expression is also significantly higher in ER(+)/PR(+) and ER(-)/PR(-) human breast tumors compared to normal breast tissue. (D) HRAS expression is higher in grade 1/2 and 3 primary human breast tumors compared to normal breast tissue. HRAS expression from matching normal tissue and breast tumors is significantly correlated with AGPS expression with a Pearson correlation coefficient of r=0.59. (E) HRAS expression is higher in aggressive breast and melanoma cancer cells compared with less aggressive cells. (F) HRAS overexpression in MCF10A non-transformed mammary epithelial cells increases AGPS expression. (G) Aggressive breast and melanoma cancer cells and HRAS-transformed MCF10A cells possess significantly higher levels of multiple species of ether lipids compared to less aggressive or empty vector-infected MCF10A control cells, respectively. Data in (A-F) are presented as mean ± sem; n=4/group for (A, E, and F), n=7-26/group for (B, C, and D), n=4-5/group for (G). Significance in (A-F) is presented as *p < 0.05 compared to less-aggressive cancer cells (A, E), normal breast tissue (B, C, D), or empty vector-infected MCF10A cells (F). Significant in (G) is presented as p<0.05 for lipid designations that are bolded in red comparing 231MFP to MCF7, C8161 to MUM2C, or HRAS-10A to MCF10A groups.
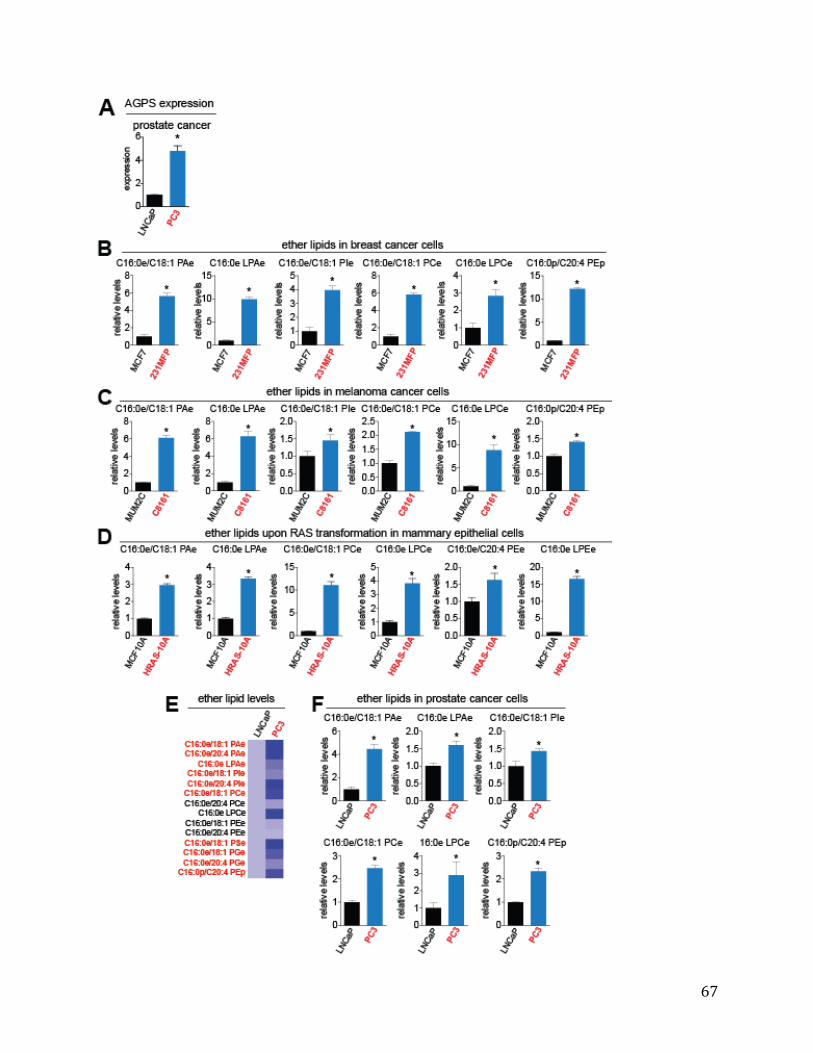
67
68
Fig. 3-2. AGPS expression and ether lipid levels in cancer cells. (A) AGPS expression is higher in the aggressive PC3 prostate cancer cells compared to the less- aggressive LNCaP cells. (B-D) Levels of multiple species of ether lipids are significantly higher in aggressive breast (B), melanoma (C), and RAS-transformed MCF10A (D) cancer cells compared to their less aggressive or control counterparts. (E) Several species of ether lipids are significantly higher in levels (bolded in red) in PC3 cells compared to LNCaP cells. (F) Several of these lipids are shown as bar graphs. Data are presented as mean ± sem; n = 3-5/group. Significance is presented as *p < 0.05 compared to less-aggressive or control MCF10A cells.
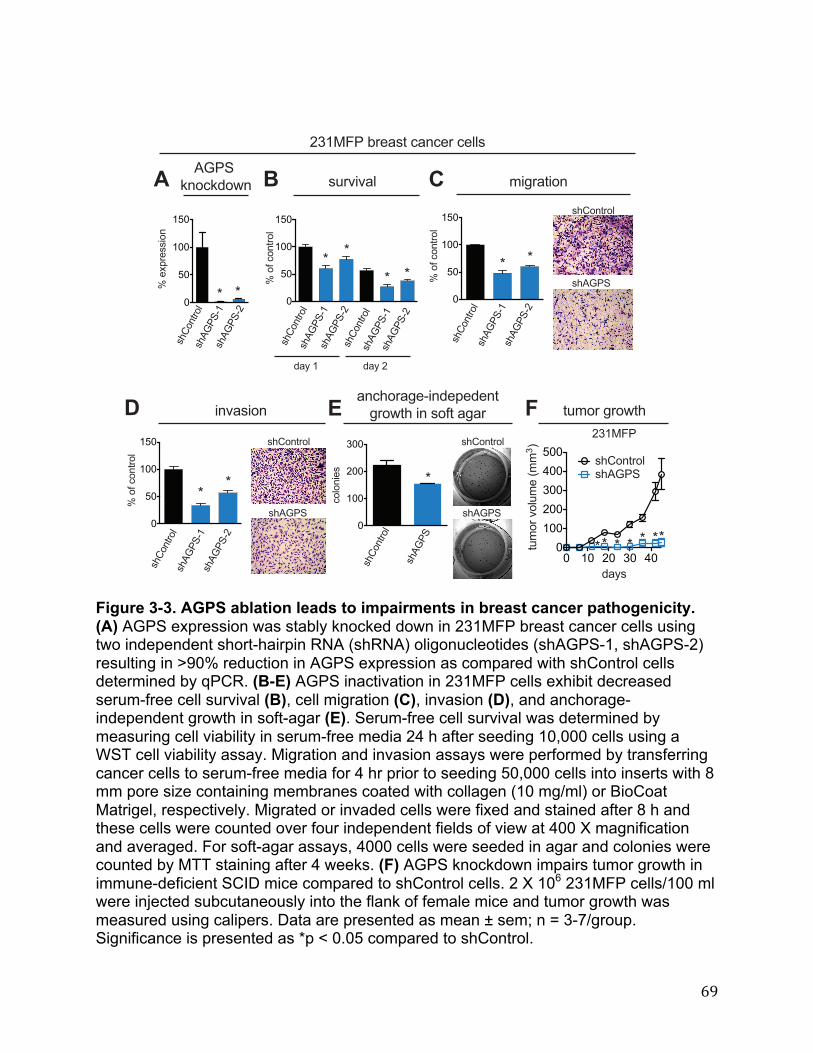
69
Figure 3-3. AGPS ablation leads to impairments in breast cancer pathogenicity. (A) AGPS expression was stably knocked down in 231MFP breast cancer cells using two independent short-hairpin RNA (shRNA) oligonucleotides (shAGPS-1, shAGPS-2) resulting in >90% reduction in AGPS expression as compared with shControl cells determined by qPCR. (B-E) AGPS inactivation in 231MFP cells exhibit decreased serum-free cell survival (B), cell migration (C), invasion (D), and anchorage-independent growth in soft-agar (E). Serum-free cell survival was determined by measuring cell viability in serum-free media 24 h after seeding 10,000 cells using a WST cell viability assay. Migration and invasion assays were performed by transferring cancer cells to serum-free media for 4 hr prior to seeding 50,000 cells into inserts with 8 mm pore size containing membranes coated with collagen (10 mg/ml) or BioCoat Matrigel, respectively. Migrated or invaded cells were fixed and stained after 8 h and these cells were counted over four independent fields of view at 400 X magnification and averaged. For soft-agar assays, 4000 cells were seeded in agar and colonies were counted by MTT staining after 4 weeks. (F) AGPS knockdown impairs tumor growth in immune-deficient SCID mice compared to shControl cells. 2 X 10⁶ 231MFP cells/100 ml were injected subcutaneously into the flank of female mice and tumor growth was measured using calipers. Data are presented as mean ± sem; n = 3-7/group. Significance is presented as *p < 0.05 compared to shControl.
!"#$%$&'
(
)(
*((
*)(
+,-.,/-01#-'
%0$&!%-0
(
)(
*((
*)(
+,-.,/-01#-'
2%3#&1%-0
(
)(
*((
*)(
+,-.,/-01#-'
!45-01#-'
!46789:*
!46789:;
!45-01#-'
!46789:*
!46789:;
!45-01#-'
!46789:*
!46789:;
!45-01#-'
!46789:*
!46789:;
< <
< <
<<
< <
!45-01#-'
!46789
!45-01#-'
!46789
=&>,* =&>,;
1"2-#,3#-?14
! " #
$
6789,@0-/@=-?0
(
)(
*((
*)(
+,ABC#A!!%-0
!45-01#-'
!46789:*
!46789:;
< <
%
;D*EF8,G#A&!1,/&0/A#,/A''!
/-'-0%A!
(
*((
;((
D((;D*EF8
( *( ;( D( H((
*((;((D((H(()((
=&>!
1"2-#,$-'"2A,I22D J
!45-01#-'!46789
<< < < < <<
&0/4-#&3A:%0=ACA=A013#-?14,%0,!-.1,&3&#&
!45-01#-'
!46789
<
!45-01#-'
!46789
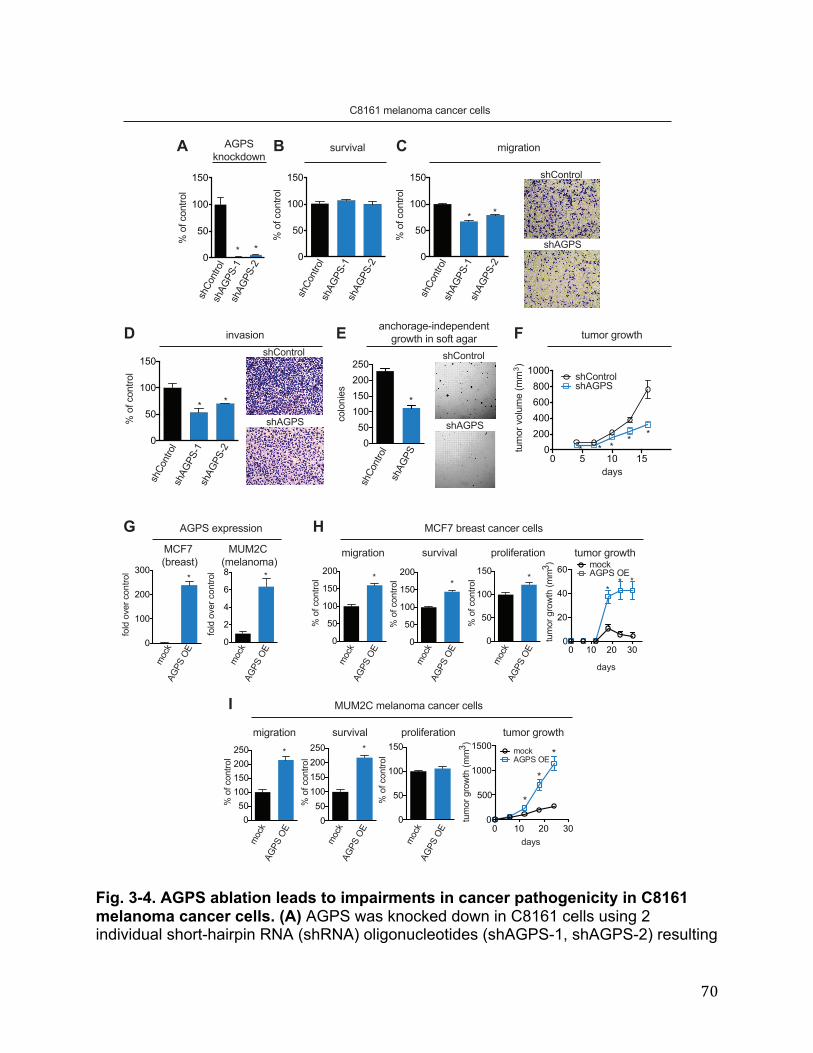
70
Fig. 3-4. AGPS ablation leads to impairments in cancer pathogenicity in C8161 melanoma cancer cells. (A) AGPS was knocked down in C8161 cells using 2 individual short-hairpin RNA (shRNA) oligonucleotides (shAGPS-1, shAGPS-2) resulting
!"#$%&'(%)'*&
+
,+
-++
-,+./'0/('&12'3
4&5674'&
+
,+
-++
-,+
./'0/('&12'3
78254563
+
,+
-++
-,+
./'0/('&12'3
189'2/:2'*1;
)6<7
189'2/5'389=/>99? @
+ , -+ -,+
A++B++C++D++-+++ 7;E'&12'3
7;!"#$
94:2614'&
+
,+
-++
-,+
./'0/('&12'3
7;E'&12'3
7;E'&12'3
7;!"#$
7;!"#$F-
7;!"#$FA
7;E'&12'3
7;!"#$F-
7;!"#$FA
7;E'&12'3
7;!"#$F-
7;!"#$FA
7;E'&12'3
7;!"#$F-
7;!"#$FA
7;E'&12'3
7;!"#$
G G
G G
G G
! " #
$ %
G G GG G
H4:82=/$AED-C-/9=36&'96/(6&(=2/(=337
('3'&4=7
+,+-++-,+A++A,+
6&(;'26:=F4&)=I=&)=&1:2'*1;/4&/7'01/6:62&
7;E'&12'3
7;!"#$
7;E'&12'3
7;!"#$
G
JEHK/>L2=671@
+
-++
A++
?++
0'3)/'5=2/('&12'3
94:2614'&
./'0/('&12'3
+
,+
-++
-,+
A++
./'0/('&12'3
+,+-++-,+A++A,+
JMJAE/>9=36&'96@
0'3)/'5=2/('&12'3
+
A
B
C
D
78254563
./'0/('&12'3
+
,+
-++
-,+
A++
./'0/('&12'3
+,+-++-,+A++A,+
I2'340=2614'&
./'0/('&12'3
+
,+
-++
-,+
./'0/('&12'3
+
,+
-++
-,+
9'(%
!"#$/NO
9'(%
!"#$/NO
9'(%
!"#$/NO
9'(%
!"#$/NO
9'(%
!"#$/NO
9'(%
!"#$/NO
9'(%
!"#$/NO
9'(%
!"#$/NO
!"#$/=PI2=774'&
94:2614'& 78254563 I2'340=2614'&
JEHK/L2=671/(6&(=2/(=337
JMJAE/9=36&'96/(6&(=2/(=337
G G GG
G
G G
189'2/:2'*1;
+ -+ A+ ?++
,++
-+++
-,++
)6<7
189'2/:2'*1;/>99? @ 9'(%
!"#$/NO
G
G
G
+ -+ A+ ?++
A+
B+
C+
189'2/:2'*1;/>99? @
)6<7
9'(%!"#$/NO
GG G
189'2/:2'*1;
' (
)

71
in >80% reduction in AGPS expression as compared with shControl cells. (B) shAGPS-1 and shAGPS-2 show no defects in serum-free cell survival compared to shControl cells in C8161 cells. (C-D) shAGPS-1 and shAGPS-2 cells show decreased migration (C) and invasion (D) compared to shControl cells in C8161 cells (6 h). Migration and invasion assays were performed by transferring cancer cells to serum-free media for 4 hr prior to seeding 50,000 cells into inserts with 8 µm pore size containing membranes coated with collagen (10 µg/ml) or BioCoat Matrigel, respectively. Migrated or invaded cells refer to average numbers ± SEM per four fields counted at 400 X magnification. (E) AGPS inactivation leads to impairments in anchorage-independent growth in soft-agar. (F) AGPS inactivation leads to impaired tumor xenograft growth in female SCID mice compared to shControl cells. 2 X 10⁶ C8161 cells/100 µl were injected subcutaneously into the flank and tumor growth was measured using calipers. (G) AGPS was stably overexpressed in MCF7 breast and MUM2C melanoma cancer cells. AGPS expression was assessed by qPCR. (H) AGPS overexpression in MCF7 cells increases migration, serum-free cell survival, and proliferation in situ, as well as in vivo tumor growth in immune-deficient SCID mice. (I) AGPS overexpression in MUM2C cells increases migration and serum-free cell survival in situ, as well as in vivo tumor growth in immune- deficient SCID mice. AGPS overexpression in MUM2C cells does not increase proliferation. Data are presented as mean ± sem; n = 3-5/group for (A-E, G-I) and 5-7 mice/group for (F, H, and I tumor xenografts). Significance is presented as *p < 0.05 compared to shControl or empty-vector-infected mock controls.

72
73
Figure 3-5. Metabolomic profiling of AGPS knockdown breast cancer cells. (A-C) Metabolomic analyses of AGPS knockdown 231MFP cells compared to shControl cells. (A) AGPS knockdown shows significant (p<0.05) alterations in the levels of many metabolites. Each point on the volcano plot corresponds to a distinct ion detected in shAGPS-1 and shControl 231MFP cells. Metabolites that are decreasing or increasing in levels upon AGPS knockdown are represented as blue and red dots, respectively. The x-axis denotes p-value of each ion between shAGPS and shControl groups, in which metabolites levels that are significantly altered (p < .05) are displayed to the right of the dotted line. The y-axis indicates the relative fold-change in the levels of the metabolite between shControl and shAGPS groups. (B) The heat map shows all identified metabolites that are significantly altered in levels (p<0.05) upon AGPS knockdown in 231MFP cells. These metabolites were quantified by SRM-based targeted metabolomics. Darker blue shading on the heat map corresponds to higher relative levels of metabolite, while white or lighter blue shading indicates lower levels. (C) Representative lipids from (B) are shown as bar graphs. AGPS knockdown not only lowers the levels of ether lipids, but also fatty acids, eicosanoids, and neutral lipids, and raises the levels of several diacylated glycerophospholipids. (D) Targeted metabolomic analysis of isotopic d8-C20:4 FFA (arachidonic acid) incorporation into certain complex cellular lipids. (E) Targeted metabolomic analysis of isotopic d4-C16:0 FFA (palmitic acid) incorporation into certain complex cellular lipids. Data in (A-E) are presented as mean ± sem; n = 4-5/group. Significance is expressed in (C) as *p < 0.05 compared to shControl groups. Significance in (D and E) is presented as *p < 0.05 between d4-C16:0 FFA or d8-C20:4 FFA groups compared to nonisotopic fatty acid treatment groups, and #p<.05 between d4-C16:0 or d8-C20:4 FFA-treated shAGPS versus matching shControl groups. Further quantitative details for LPAe and LPAp lipids are shown in Fig. S3. The metabolomic profile of AGPS inactivation in C8161 melanoma cells is provided in Fig. S4 and the metabolomic profile of AGPS overexpression in MCF7 and MUM2C cells are provided in Fig. S5.
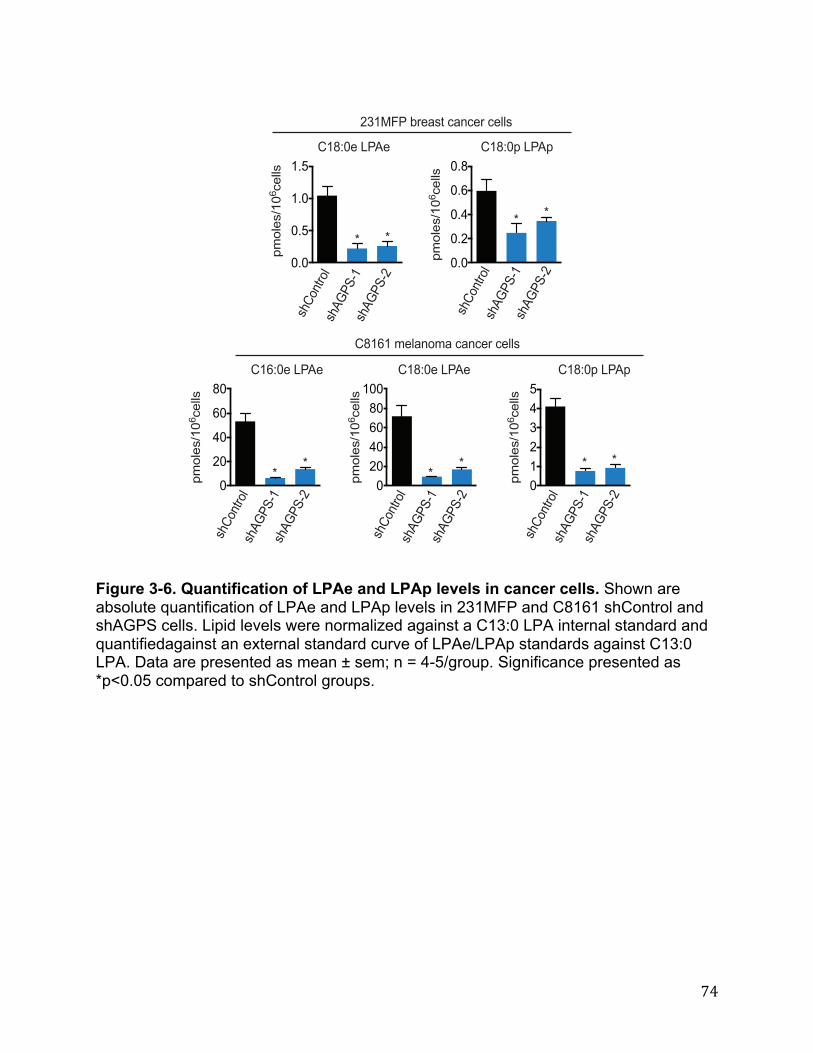
74
Figure 3-6. Quantification of LPAe and LPAp levels in cancer cells. Shown are absolute quantification of LPAe and LPAp levels in 231MFP and C8161 shControl and shAGPS cells. Lipid levels were normalized against a C13:0 LPA internal standard and quantifiedagainst an external standard curve of LPAe/LPAp standards against C13:0 LPA. Data are presented as mean ± sem; n = 4-5/group. Significance presented as *p<0.05 compared to shControl groups.
!"#$%&'()*&
%+%
%+,
"+%
"+,
-./0&12"%34&001
!"3$%&'()*&
-./0&12"%34&001
%
5%
6%
3%
#%
!"#$%-'()*-
-./0&12"%34&001
%+%
%+5
%+6
%+3
%+#
!"#$%&'()*&-./0&12"%34&001
%5%6%3%#%"%%
!"#$%-'()*-
-./0&12"%34&001
%"576,
57"89)':;&<1='4<>4&;'4&001
!#"3"'.&0<>/.<'4<>4&;'4&001
1?!/>=;/0
1?*@)AB"
1?*@)AB5
1?!/>=;/0
1?*@)AB"
1?*@)AB5
1?!/>=;/0
1?*@)AB"
1?*@)AB5
1?!/>=;/0
1?*@)AB"
1?*@)AB5
1?!/>=;/0
1?*@)AB"
1?*@)AB5
C CC C
CC
CC C C
9DEF;&'A7

75
76
Figure 3-7 Metabolomic profile of melanoma cancer cells upon AGPS inactivation. (A-C) Targeted and untargeted metabolomic analysis of AGPS knockdown in C8161 cells. (A) Volcano plot shows all metabolites identified by targeted and untargeted metabolomics. Blue or red dots indicate metabolites that are reduced or increased in levels upon AGPS knockdown, respectively. Metabolites that are significantly changing in levels (p < 0.05) between shAGPS and shControl C8161 cells are displayed to the right of the dotted line. (B) Heat map that shows metabolites that were significantly changing in levels in both shAGPS-1 and shAGPS-2 cells that were identified and quantified from (A). Darker blue shading on the heat-map indicates higher relative level of metabolite, and white or lighter blue color indicates lower levels of metabolite. (C) Representative lipids from each class are shown as bar graphs. Data are presented as mean ± sem; n = 4-5/group. Significance in (C) is presented as *p < 0.05 compared to shControl groups.

77
Figure 3-8. Metabolite levels that are altered upon AGPS Overexpression. (A and B) AGPS overexpression leads to an increase in the levels of several species of ether lipids and plasmalogens, as well as an increase in certain FFA levels in breast MCF7 (A) and melanoma MUM2C (B) cancer cells. In melanoma cancer cells, we also
!"#$%&'()
'*+,-.&/*+0-+'12&
.3.
.3)
+3.
+3)
43.
%&567"8&'5&8&59
*+0-.&/*+0-+'12&
%&567"8&'5&8&59
.3.
.3)
+3.
+3)
43.
*+,-.&':12&
%&567"8&'5&8&59
.
+
4
;
*+0-.&':1*&
%&567"8&'5&8&59
.
+
4
;
<
*+,-.&/*4.-<'1=&
%&567"8&'5&8&59
.3.
.3)
+3.
+3)
43.
43)
*+,-.>/*4.-<'1=>
%&567"8&'5&8&59
.
+
4
;
*+0-.>/*4.-<'1=>
%&567"8&'5&8&59
.3.
.3)
+3.
+3)
43.
*+0-.>/*4.-<'1*>
%&567"8&'5&8&59
.3.
.3)
+3.
+3)
43.
*+0-+'!!2
%&567"8&'5&8&59
.3.
.3)
+3.
+3)
43.
*4.-<'!!2
%&567"8&'5&8&59
.3.
.3)
+3.
+3)
43.
?@AB
2C1('D=
?@AB
2C1('D=
?@AB
2C1('D=
?@AB
2C1('D=
?@AB
2C1('D=
?@AB
2C1('D=
?@AB
2C1('D=
?@AB
2C1('D=
?@AB
2C1('D=
?@AB
2C1('D=
E E E E E
EE E
E E
657&%67"@F9'"F'5">"G'5&8&59'$>@F'2C1('@8&%&H>%&99"@F'IJ*!KL
*+,-.&/*+0-+'12&
%&567"8&'5&8&59
.3.
.3)
+3.
+3)
43.
*+,-.&':12&
%&567"8&'5&8&59
.3.
.3)
+3.
+3)
43.
43)
*+0-.&':12&
%&567"8&'5&8&59
.
+
4
;
*+,-.&/*+0-+'1*&
%&567"8&'5&8&59
.3.
.3)
+3.
+3)
43.
*+0-.&':1*&
%&567"8&'5&8&59
.3.
.3)
+3.
+3)
43.
43)
*+,-.&':1=&
%&567"8&'5&8&59
.3.
.3)
+3.
+3)
43.
*+,-.&/*4.-<'1(&
%&567"8&'5&8&59
.3.
.3)
+3.
+3)
43.
43)
*+0-./*4.-<'1=
%&567"8&'5&8&59
.3.
.3)
+3.
+3)
*+,-./*4.-<'1*
%&567"8&'5&8&59
.3.
.3)
+3.
+3)
*+0-+'!!2
%&567"8&'5&8&59
.3.
.3)
+3.
+3)
?@AB
2C1('D=
?@AB
2C1('D=
?@AB
2C1('D=
?@AB
2C1('D=
?@AB
2C1('D=
?@AB
2C1('D=
?@AB
2C1('D=
?@AB
2C1('D=
?@AB
2C1('D=
?@AB
2C1('D=
E E E E E
E
E
E E
E
657&%67"@F9'"F'5">"G'5&8&59'$>@F'2C1('@8&%&H>%&99"@F'IJMJ4*L
!
"

78
observe a significant reduction in the levels of certain arachidonoyl-containing glycerophospholipids (B). Data are presented as mean ± sem; n = 4-5/group. Significance is presented as *p < 0.05 compared to empty-vector-infected mock groups.

79
Figure 3-9. AGPS fuels cancer pathogenicity in breast cancer cells through altering fatty acid utilization to favor the generation of oncogenic signaling lipids. (A) AGPS knockdown results in altered levels of not only ether lipids, but also reduced levels of fatty acids and eicosanoids, and increased levels of acylglycerophospholipids. This may be due to heightened acyltransferase or reduced phospholipase or
80
cyclooxygenase activity. AGPS ablation results in a significant increase in the expression of lysophosphatidyl choline acyltransferase 1 (LPCAT1) without significantly altering the expression of cytosolic phospholipase A2 (PLA2G4) or cyclooxygenase 2 (PTGS2), as determined by quantitative PCR. (B and C) The migratory (B) and invasive (C) impairments in shAGPS 231MFP cells are significantly rescued upon treatment of cells with low concentrations (100 nM) of C18:0e LPA, PGE2, and C16:0 FFA, but not other ether lipids such as C16:0e LPCe, C16:0e/C20:4 PCe, and C16:0e PAFe. Treatment with the aforementioned lipids was initiated concurrently with the seeding of cells for assessment of cancer cell migration (8 hrs) and invasion (24 hrs). (D) Treatment with C18:0e LPAe (100 nM), but not PGE2 (100 nM), significantly rescued the heightened expression of LPCAT1 conferred by AGPS knockdown, as assessed by qPCR. (E) Model depicting the metabolic role of AGPS in exerting control over ether lipid metabolism, fatty acid metabolism, as well as glycerophospholipid metabolism. We show that AGPS knockdown in 231MFP breast cancer cells leads to reduced levels of ether lipids, including the oncogenic LPAe signaling lipid (boxed in red), as well as an alteration in arachidonic acid utilization towards membrane phospholipids through LPAe-mediated LPCAT1 upregulation, at the expense of generating oncogenic prostaglandins (boxed in red). R1 denote acyl or alkyl chains and X refers to lipid head-group such as phosphocholine, phosphoethanolamine, or phosphate. Data are presented as mean ± sem; n = 3/group. Lipid rescue of migratory and invasive impairments upon AGPS knockdown in C8161 melanoma cells as well as C18:0 LPA rescue experiments are provided in Figure 3-10. Significance is represented as *p < 0.05 compared to shControl and #p<0.05 compared to DMSO-treated shAGPS groups.
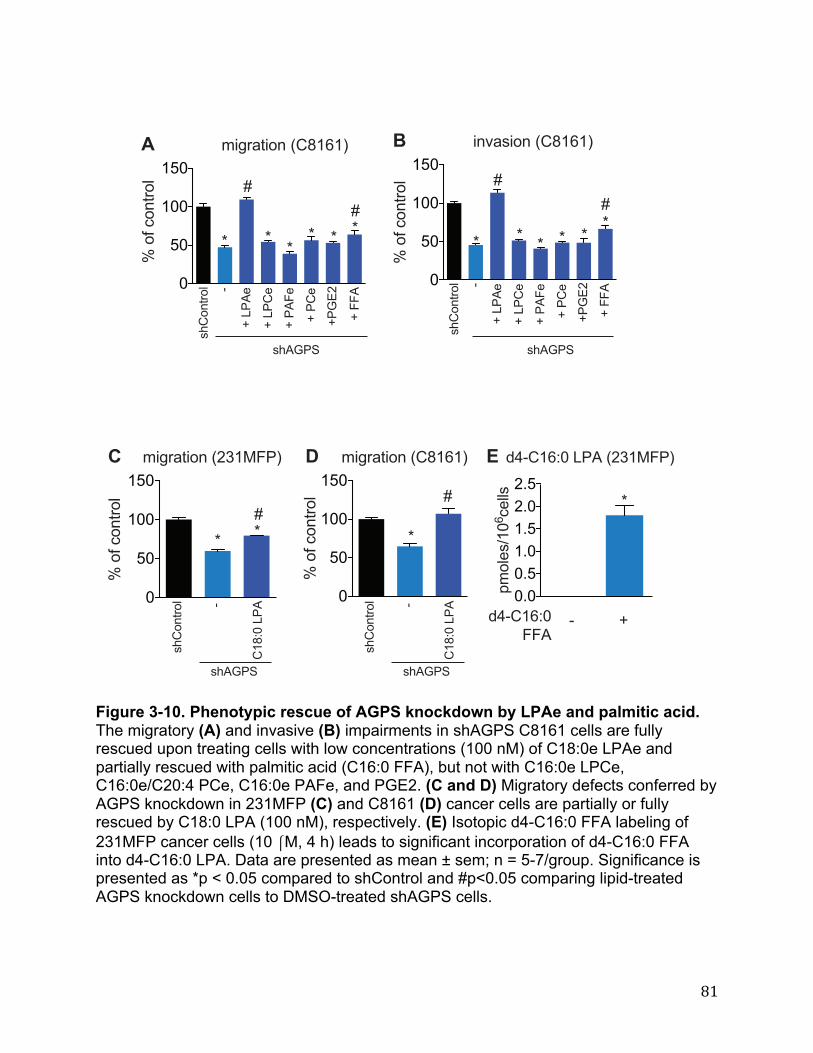
81
Figure 3-10. Phenotypic rescue of AGPS knockdown by LPAe and palmitic acid. The migratory (A) and invasive (B) impairments in shAGPS C8161 cells are fully rescued upon treating cells with low concentrations (100 nM) of C18:0e LPAe and partially rescued with palmitic acid (C16:0 FFA), but not with C16:0e LPCe, C16:0e/C20:4 PCe, C16:0e PAFe, and PGE2. (C and D) Migratory defects conferred by AGPS knockdown in 231MFP (C) and C8161 (D) cancer cells are partially or fully rescued by C18:0 LPA (100 nM), respectively. (E) Isotopic d4-C16:0 FFA labeling of 231MFP cancer cells (10 ⎧M, 4 h) leads to significant incorporation of d4-C16:0 FFA into d4-C16:0 LPA. Data are presented as mean ± sem; n = 5-7/group. Significance is presented as *p < 0.05 compared to shControl and #p<0.05 comparing lipid-treated AGPS knockdown cells to DMSO-treated shAGPS cells.
!"#$%&"'()*+,-.-/
0
10
-00
-102)'3)4'(&$'5
"(6%7"'()*+,-.-/
2)'3)4'(&$'5
0
10
-00
-10
78+'(&$'5 9
78:;<=
>)?<:@
>)?<+@
>)<+@
><;AB
>)CC:
>)<:C@
D DDD D D
D D D D DD
EE
EE
! "
C"#F$@)=.
!"#$%&"'()*BG-HC</
0
10
-00
-10
2)'3)4'(&$'5
#
78:;<=
78+'(&$'5 9
+-,I0)?<:
D DE
78+'(&$'5 9
78:;<=
JK9+-.I0)?<:)*BG-HC</
0L00L1-L0-L1BL0BL1
M!'[email protected]@557
JK9+-.I0CC:
9 >
D
$!"#$%&"'()*+,-.-/
2)'3)4'(&$'5
0
10
-00
-10%
78:;<=
78+'(&$'5 9
+-,I0)?<:
D
E>)?<:@
>)?<+@
>)<+@
><;AB
>)CC:
>)<:C@
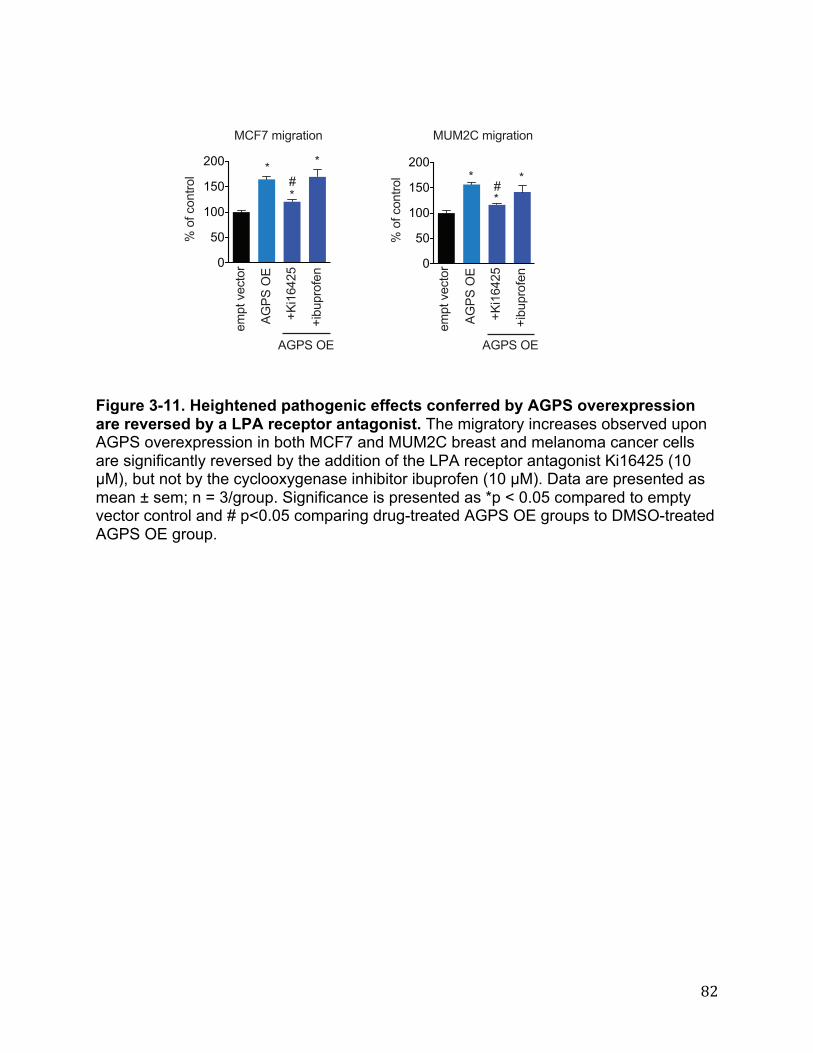
82
Figure 3-11. Heightened pathogenic effects conferred by AGPS overexpression are reversed by a LPA receptor antagonist. The migratory increases observed upon AGPS overexpression in both MCF7 and MUM2C breast and melanoma cancer cells are significantly reversed by the addition of the LPA receptor antagonist Ki16425 (10 µM), but not by the cyclooxygenase inhibitor ibuprofen (10 µM). Data are presented as mean ± sem; n = 3/group. Significance is presented as *p < 0.05 compared to empty vector control and # p<0.05 comparing drug-treated AGPS OE groups to DMSO-treated AGPS OE group.
!"#$%&'()*+',-
.
/.
0..
0/.
1..
2%,3%4,-+),5
!6!1"%&'()*+',-
.
/.
0..
0/.
1..
2%,3%4,-+),57 7
7 77 78 8
9&:+%;94+,)
<=>?%@A
BC'0DE1/
B'FG:),39-
<=>?%@A
BC'0DE1/
B'FG:),39-
#'(G)9%?$
<=>?%@A
9&:+%;94+,)
<=>?%@A

83
Figure 3-12. LPCAT1 expression is elevated in primary human breast tumors. LPCAT1 expression by qPCR is significantly higher in primary human breasttumors, compared to normal breast tissue. Data are presented as mean ± sem; n = 7- 20/group. Significance is presented as *p < 0.05 compared to normal breast tissue.
!"#$%&'()*'++,-.
/
0
&/
&0
1/.-*23456,++7'
8*'3+65672-*
9
84
REFERENCES 1. DeBerardinis RJ, Lum JJ, Hatzivassiliou G, Thompson CB. The Biology of Cancer:
Metabolic Reprogramming Fuels Cell Growth and Proliferation. Cell Metab. 2008 Jan;7(1):11–20.
2. Cairns RA, Harris IS, Mak TW. Regulation of cancer cell metabolism. Nat Rev Cancer. 2011 Feb;11(2):85–95.
3. Dang L, White DW, Gross S, Bennett BD, Bittinger MA, Driggers EM, et al. Cancer-associated IDH1 mutations produce 2-hydroxyglutarate. Nature. 2009 Dec 10;462(7274):739–44.
4. Nomura DK, Long JZ, Niessen S, Hoover HS, Ng S-W, Cravatt BF. Monoacylglycerol Lipase Regulates a Fatty Acid Network that Promotes Cancer Pathogenesis. Cell. 2010 Jan;140(1):49–61.
5. Warburg O. On the origin of cancer cells. Science. 1956 Feb 24;123(3191):309–14.
6. Christofk HR, Vander Heiden MG, Harris MH, Ramanathan A, Gerszten RE, Wei R, et al. The M2 splice isoform of pyruvate kinase is important for cancer metabolism and tumour growth. Nature. 2008 Mar 13;452(7184):230–3.
7. Anastasiou D, Poulogiannis G, Asara JM, Boxer MB, Jiang J -k., Shen M, et al. Inhibition of Pyruvate Kinase M2 by Reactive Oxygen Species Contributes to Cellular Antioxidant Responses. Science. 2011 Dec 2;334(6060):1278–83.
8. Christofk HR, Vander Heiden MG, Wu N, Asara JM, Cantley LC. Pyruvate kinase M2 is a phosphotyrosine-binding protein. Nature. 2008 Mar 13;452(7184):181–6.
9. Hitosugi T, Kang S, Vander Heiden MG, Chung T-W, Elf S, Lythgoe K, et al. Tyrosine phosphorylation inhibits PKM2 to promote the Warburg effect and tumor growth. Sci Signal. 2009;2(97):ra73.
10. Lv L, Li D, Zhao D, Lin R, Chu Y, Zhang H, et al. Acetylation targets the M2 isoform of pyruvate kinase for degradation through chaperone-mediated autophagy and promotes tumor growth. Mol Cell. 2011 Jun 24;42(6):719–30.
11. Yang W, Xia Y, Ji H, Zheng Y, Liang J, Huang W, et al. Nuclear PKM2 regulates β-catenin transactivation upon EGFR activation. Nature. 2011 Dec 1;480(7375):118–22.
12. Luo W, Hu H, Chang R, Zhong J, Knabel M, O’Meally R, et al. Pyruvate kinase M2 is a PHD3-stimulated coactivator for hypoxia-inducible factor 1. Cell. 2011 May 27;145(5):732–44.
13. Boxer MB, Jiang J, Vander Heiden MG, Shen M, Skoumbourdis AP, Southall N, et al. Evaluation of substituted N,N’-diarylsulfonamides as activators of the tumor

85
cell specific M2 isoform of pyruvate kinase. J Med Chem. 2010 Feb 11;53(3):1048–55.
14. Jiang J, Boxer MB, Vander Heiden MG, Shen M, Skoumbourdis AP, Southall N, et al. Evaluation of thieno[3,2-b]pyrrole[3,2-d]pyridazinones as activators of the tumor cell specific M2 isoform of pyruvate kinase. Bioorg Med Chem Lett. 2010 Jun 1;20(11):3387–93.
15. Walsh MJ, Brimacombe KR, Veith H, Bougie JM, Daniel T, Leister W, et al. 2-Oxo-N-aryl-1,2,3,4-tetrahydroquinoline-6-sulfonamides as activators of the tumor cell specific M2 isoform of pyruvate kinase. Bioorg Med Chem Lett. 2011 Nov 1;21(21):6322–7.
16. DeBerardinis RJ, Mancuso A, Daikhin E, Nissim I, Yudkoff M, Wehrli S, et al. Beyond aerobic glycolysis: transformed cells can engage in glutamine metabolism that exceeds the requirement for protein and nucleotide synthesis. Proc Natl Acad Sci U S A. 2007 Dec 4;104(49):19345–50.
17. Mardis ER, Ding L, Dooling DJ, Larson DE, McLellan MD, Chen K, et al. Recurring mutations found by sequencing an acute myeloid leukemia genome. N Engl J Med. 2009 Sep 10;361(11):1058–66.
18. Parsons DW, Jones S, Zhang X, Lin JC-H, Leary RJ, Angenendt P, et al. An integrated genomic analysis of human glioblastoma multiforme. Science. 2008 Sep 26;321(5897):1807–12.
19. Reitman ZJ, Jin G, Karoly ED, Spasojevic I, Yang J, Kinzler KW, et al. Profiling the effects of isocitrate dehydrogenase 1 and 2 mutations on the cellular metabolome. Proc Natl Acad Sci U S A. 2011 Feb 22;108(8):3270–5.
20. Noushmehr H, Weisenberger DJ, Diefes K, Phillips HS, Pujara K, Berman BP, et al. Identification of a CpG island methylator phenotype that defines a distinct subgroup of glioma. Cancer Cell. 2010 May 18;17(5):510–22.
21. Figueroa ME, Abdel-Wahab O, Lu C, Ward PS, Patel J, Shih A, et al. Leukemic IDH1 and IDH2 mutations result in a hypermethylation phenotype, disrupt TET2 function, and impair hematopoietic differentiation. Cancer Cell. 2010 Dec 14;18(6):553–67.
22. Xu W, Yang H, Liu Y, Yang Y, Wang P, Kim S-H, et al. Oncometabolite 2-hydroxyglutarate is a competitive inhibitor of α-ketoglutarate-dependent dioxygenases. Cancer Cell. 2011 Jan 18;19(1):17–30.
23. Turcan S, Rohle D, Goenka A, Walsh LA, Fang F, Yilmaz E, et al. IDH1 mutation is sufficient to establish the glioma hypermethylator phenotype. Nature. 2012 Mar 22;483(7390):479–83.
86
24. Lu C, Ward PS, Kapoor GS, Rohle D, Turcan S, Abdel-Wahab O, et al. IDH mutation impairs histone demethylation and results in a block to cell differentiation. Nature. 2012 Mar 22;483(7390):474–8.
25. Metallo CM, Gameiro PA, Bell EL, Mattaini KR, Yang J, Hiller K, et al. Reductive glutamine metabolism by IDH1 mediates lipogenesis under hypoxia. Nature. 2012 Jan 19;481(7381):380–4.
26. Mullen AR, Wheaton WW, Jin ES, Chen P-H, Sullivan LB, Cheng T, et al. Reductive carboxylation supports growth in tumour cells with defective mitochondria. Nature. 2012 Jan 19;481(7381):385–8.
27. Scott DA, Richardson AD, Filipp FV, Knutzen CA, Chiang GG, Ronai ZA, et al. Comparative metabolic flux profiling of melanoma cell lines: beyond the Warburg effect. J Biol Chem. 2011 Dec 9;286(49):42626–34.
28. Wise DR, Ward PS, Shay JES, Cross JR, Gruber JJ, Sachdeva UM, et al. Hypoxia promotes isocitrate dehydrogenase-dependent carboxylation of α-ketoglutarate to citrate to support cell growth and viability. Proc Natl Acad Sci U S A. 2011 Dec 6;108(49):19611–6.
29. Locasale JW, Grassian AR, Melman T, Lyssiotis CA, Mattaini KR, Bass AJ, et al. Phosphoglycerate dehydrogenase diverts glycolytic flux and contributes to oncogenesis. Nat Genet. 2011 Sep;43(9):869–74.
30. Possemato R, Marks KM, Shaul YD, Pacold ME, Kim D, Birsoy K, et al. Functional genomics reveal that the serine synthesis pathway is essential in breast cancer. Nature. 2011 Aug 18;476(7360):346–50.
31. Menendez JA, Lupu R. Fatty acid synthase and the lipogenic phenotype in cancer pathogenesis. Nat Rev Cancer. 2007 Oct;7(10):763–77.
32. Wymann MP, Schneiter R. Lipid signalling in disease. Nat Rev Mol Cell Biol. 2008 Feb;9(2):162–76.
33. Menendez JA, Lupu R. Fatty acid synthase and the lipogenic phenotype in cancer pathogenesis. Nat Rev Cancer. 2007 Oct;7(10):763–77.
34. Engelman JA, Luo J, Cantley LC. The evolution of phosphatidylinositol 3-kinases as regulators of growth and metabolism. Nat Rev Genet. 2006 Aug;7(8):606–19.
35. Mills GB, Moolenaar WH. The emerging role of lysophosphatidic acid in cancer. Nat Rev Cancer. 2003 Aug;3(8):582–91.
36. Pyne NJ, Pyne S. Sphingosine 1-phosphate and cancer. Nat Rev Cancer. 2010 Jul;10(7):489–503.

87
37. Wang D, Dubois RN. Eicosanoids and cancer. Nat Rev Cancer. 2010 Mar;10(3):181–93.
38. Kuhajda FP, Jenner K, Wood FD, Hennigar RA, Jacobs LB, Dick JD, et al. Fatty acid synthesis: a potential selective target for antineoplastic therapy. Proc Natl Acad Sci U S A. 1994 Jul 5;91(14):6379–83.
39. Vázquez MJ, Leavens W, Liu R, Rodríguez B, Read M, Richards S, et al. Discovery of GSK837149A, an inhibitor of human fatty acid synthase targeting the beta-ketoacyl reductase reaction. FEBS J. 2008 Apr;275(7):1556–67.
40. Wu M, Singh SB, Wang J, Chung CC, Salituro G, Karanam BV, et al. Antidiabetic and antisteatotic effects of the selective fatty acid synthase (FAS) inhibitor platensimycin in mouse models of diabetes. Proc Natl Acad Sci U S A. 2011 Mar 29;108(13):5378–83.
41. Nomura DK, Lombardi DP, Chang JW, Niessen S, Ward AM, Long JZ, et al. Monoacylglycerol lipase exerts dual control over endocannabinoid and fatty acid pathways to support prostate cancer. Chem Biol. 2011 Jul 29;18(7):846–56.
42. Nomura DK, Dix MM, Cravatt BF. Activity-based protein profiling for biochemical pathway discovery in cancer. Nat Rev Cancer. 2010 Sep;10(9):630–8.
43. Long JZ, Li W, Booker L, Burston JJ, Kinsey SG, Schlosburg JE, et al. Selective blockade of 2-arachidonoylglycerol hydrolysis produces cannabinoid behavioral effects. Nat Chem Biol. 2009 Jan;5(1):37–44.
44. Kuemmerle NB, Rysman E, Lombardo PS, Flanagan AJ, Lipe BC, Wells WA, et al. Lipoprotein lipase links dietary fat to solid tumor cell proliferation. Mol Cancer Ther. 2011 Mar;10(3):427–36.
45. Nieman KM, Kenny HA, Penicka CV, Ladanyi A, Buell-Gutbrod R, Zillhardt MR, et al. Adipocytes promote ovarian cancer metastasis and provide energy for rapid tumor growth. Nat Med. 2011;17(11):1498–503.
46. Snyder F, Wood R. Alkyl and alk-1-enyl ethers of glycerol in lipids from normal and neoplastic human tissues. Cancer Res. 1969 Jan;29(1):251–7.
47. Wood R, Snyder F. Characterization and identification of glyceryl ether diesters present in tumor cells. J Lipid Res. 1967 Sep;8(5):494–500.
48. Chiang KP, Niessen S, Saghatelian A, Cravatt BF. An enzyme that regulates ether lipid signaling pathways in cancer annotated by multidimensional profiling. Chem Biol. 2006 Oct;13(10):1041–50.
49. Jessani N, Niessen S, Wei BQ, Nicolau M, Humphrey M, Ji Y, et al. A streamlined platform for high-content functional proteomics of primary human specimens. Nat Methods. 2005 Sep;2(9):691–7.

88
50. Chang JW, Moellering RE, Cravatt BF. An activity-based imaging probe for the integral membrane hydrolase KIAA1363. Angew Chem Int Ed Engl. 2012 Jan 23;51(4):966–70.
51. Chang JW, Nomura DK, Cravatt BF. A potent and selective inhibitor of KIAA1363/AADACL1 that impairs prostate cancer pathogenesis. Chem Biol. 2011 Apr 22;18(4):476–84.
52. Lunt SY, Vander Heiden MG. Aerobic glycolysis: meeting the metabolic requirements of cell proliferation. Annu Rev Cell Dev Biol. 2011;27:441–64.
53. Wahrheit J, Nicolae A, Heinzle E. Eukaryotic metabolism: measuring compartment fluxes. Biotechnol J. 2011 Sep;6(9):1071–85.
54. Zamboni N. 13C metabolic flux analysis in complex systems. Curr Opin Biotechnol. 2011 Feb;22(1):103–8.
55. Hellerstein MK, Murphy E. Stable isotope-mass spectrometric measurements of molecular fluxes in vivo: emerging applications in drug development. Curr Opin Mol Ther. 2004 Jun;6(3):249–64.
56. Walther JL, Metallo CM, Zhang J, Stephanopoulos G. Optimization of 13C isotopic tracers for metabolic flux analysis in mammalian cells. Metab Eng. 2012 Mar;14(2):162–71.
57. Hiller K, Metallo C, Stephanopoulos G. Elucidation of cellular metabolism via metabolomics and stable-isotope assisted metabolomics. Curr Pharm Biotechnol. 2011 Jul;12(7):1075–86.
58. Migita T, Ruiz S, Fornari A, Fiorentino M, Priolo C, Zadra G, et al. Fatty acid synthase: a metabolic enzyme and candidate oncogene in prostate cancer. J Natl Cancer Inst. 2009 Apr 1;101(7):519–32.
59. Pece S, Tosoni D, Confalonieri S, Mazzarol G, Vecchi M, Ronzoni S, et al. Biological and molecular heterogeneity of breast cancers correlates with their cancer stem cell content. Cell. 2010 Jan 8;140(1):62–73.
60. Chaffer CL, Weinberg RA. A perspective on cancer cell metastasis. Science. 2011 Mar 25;331(6024):1559–64.
61. Gupta PB, Onder TT, Jiang G, Tao K, Kuperwasser C, Weinberg RA, et al. Identification of selective inhibitors of cancer stem cells by high-throughput screening. Cell. 2009 Aug 21;138(4):645–59.
62. Sabbah M, Emami S, Redeuilh G, Julien S, Prévost G, Zimber A, et al. Molecular signature and therapeutic perspective of the epithelial-to-mesenchymal transitions in epithelial cancers. Drug Resist Updat Rev Comment Antimicrob Anticancer Chemother. 2008 Oct;11(4-5):123–51.

89
63. Cordenonsi M, Zanconato F, Azzolin L, Forcato M, Rosato A, Frasson C, et al. The Hippo transducer TAZ confers cancer stem cell-related traits on breast cancer cells. Cell. 2011 Nov 11;147(4):759–72.
64. Mani SA, Guo W, Liao M-J, Eaton EN, Ayyanan A, Zhou AY, et al. The epithelial-mesenchymal transition generates cells with properties of stem cells. Cell. 2008 May 16;133(4):704–15.
65. Barr S, Thomson S, Buck E, Russo S, Petti F, Sujka-Kwok I, et al. Bypassing cellular EGF receptor dependence through epithelial-to-mesenchymal-like transitions. Clin Exp Metastasis. 2008;25(6):685–93.
66. Buck E, Eyzaguirre A, Rosenfeld-Franklin M, Thomson S, Mulvihill M, Barr S, et al. Feedback mechanisms promote cooperativity for small molecule inhibitors of epidermal and insulin-like growth factor receptors. Cancer Res. 2008 Oct 15;68(20):8322–32.
67. Zielske SP, Spalding AC, Lawrence TS. Loss of tumor-initiating cell activity in cyclophosphamide-treated breast xenografts. Transl Oncol. 2010;3(3):149–52.
68. Gaglio D, Metallo CM, Gameiro PA, Hiller K, Danna LS, Balestrieri C, et al. Oncogenic K-Ras decouples glucose and glutamine metabolism to support cancer cell growth. Mol Syst Biol. 2011;7:523.
69. Ying H, Kimmelman AC, Lyssiotis CA, Hua S, Chu GC, Fletcher-Sananikone E, et al. Oncogenic Kras maintains pancreatic tumors through regulation of anabolic glucose metabolism. Cell. 2012 Apr 27;149(3):656–70.
70. Locasale JW, Grassian AR, Melman T, Lyssiotis CA, Mattaini KR, Bass AJ, et al. Phosphoglycerate dehydrogenase diverts glycolytic flux and contributes to oncogenesis. Nat Genet. 2011 Sep;43(9):869–74.
71. Vander Heiden MG, Cantley LC, Thompson CB. Understanding the Warburg effect: the metabolic requirements of cell proliferation. Science. 2009 May 22;324(5930):1029–33.
72. Benjamin DI, Cravatt BF, Nomura DK. Global profiling strategies for mapping dysregulated metabolic pathways in cancer. Cell Metab. 2012 Nov 7;16(5):565–77.
73. Inhorn RC, Majerus PW. Inositol polyphosphate 1-phosphatase from calf brain. Purification and inhibition by Li+, Ca2+, and Mn2+. J Biol Chem. 1987 Nov 25;262(33):15946–52.
74. Li SR, Gyselman VG, Lalude O, Dorudi S, Bustin SA. Transcription of the inositol polyphosphate 1-phosphatase gene (INPP1) is upregulated in human colorectal cancer. Mol Carcinog. 2000 Apr;27(4):322–9.

90
75. Sethi N, Kang Y. Unravelling the complexity of metastasis - molecular understanding and targeted therapies. Nat Rev Cancer. 2011 Oct;11(10):735–48.
76. Nguyen DX, Bos PD, Massagué J. Metastasis: from dissemination to organ-specific colonization. Nat Rev Cancer. 2009 Apr;9(4):274–84.
77. Sebolt-Leopold JS, Herrera R. Targeting the mitogen-activated protein kinase cascade to treat cancer. Nat Rev Cancer. 2004 Dec;4(12):937–47.
78. Tautenhahn R, Patti GJ, Rinehart D, Siuzdak G. XCMS Online: a web-based platform to process untargeted metabolomic data. Anal Chem. 2012 Jun 5;84(11):5035–9.
79. Ohta H, Sato K, Murata N, Damirin A, Malchinkhuu E, Kon J, et al. Ki16425, a subtype-selective antagonist for EDG-family lysophosphatidic acid receptors. Mol Pharmacol. 2003 Oct;64(4):994–1005.
80. Elstrom RL, Bauer DE, Buzzai M, Karnauskas R, Harris MH, Plas DR, et al. Akt stimulates aerobic glycolysis in cancer cells. Cancer Res. 2004 Jun 1;64(11):3892–9.
81. Zhong D, Xiong L, Liu T, Liu X, Liu X, Chen J, et al. The glycolytic inhibitor 2-deoxyglucose activates multiple prosurvival pathways through IGF1R. J Biol Chem. 2009 Aug 28;284(35):23225–33.
82. Yu F-X, Zhao B, Panupinthu N, Jewell JL, Lian I, Wang LH, et al. Regulation of the Hippo-YAP pathway by G-protein-coupled receptor signaling. Cell. 2012 Aug 17;150(4):780–91.
83. Cai H, Xu Y. The role of LPA and YAP signaling in long-term migration of human ovarian cancer cells. Cell Commun Signal CCS. 2013;11(1):31.
84. Yang W, Xia Y, Cao Y, Zheng Y, Bu W, Zhang L, et al. EGFR-induced and PKCε monoubiquitylation-dependent NF-κB activation upregulates PKM2 expression and promotes tumorigenesis. Mol Cell. 2012 Dec 14;48(5):771–84.
85. Babic I, Anderson ES, Tanaka K, Guo D, Masui K, Li B, et al. EGFR mutation-induced alternative splicing of Max contributes to growth of glycolytic tumors in brain cancer. Cell Metab. 2013 Jun 4;17(6):1000–8.
86. Jessani N, Humphrey M, McDonald WH, Niessen S, Masuda K, Gangadharan B, et al. Carcinoma and stromal enzyme activity profiles associated with breast tumor growth in vivo. Proc Natl Acad Sci U S A. 2004 Sep 21;101(38):13756–61.
87. Louie SM, Roberts LS, Nomura DK. Mechanisms linking obesity and cancer. Biochim Biophys Acta. 2013 Oct;1831(10):1499–508.
88. Roos DS, Choppin PW. Tumorigenicity of cell lines with altered lipid composition. Proc Natl Acad Sci U S A. 1984 Dec;81(23):7622–6.
91
89. Howard BV, Morris HP, Bailey JM. Ether-lipids, -glycerol phosphate dehydrogenase, and growth rate in tumors and cultured cells. Cancer Res. 1972 Jul;32(7):1533–8.
90. Albert DH, Anderson CE. Ether-linked glycerolipids in human brain tumors. Lipids. 1977 Feb;12(2):188–92.
91. Wallner S, Schmitz G. Plasmalogens the neglected regulatory and scavenging lipid species. Chem Phys Lipids. 2011 Sep;164(6):573–89.
92. Brites P, Waterham HR, Wanders RJA. Functions and biosynthesis of plasmalogens in health and disease. Biochim Biophys Acta. 2004 Mar 22;1636(2-3):219–31.
93. Tsukahara T, Haniu H, Matsuda Y. Effect of alkyl glycerophosphate on the activation of peroxisome proliferator-activated receptor gamma and glucose uptake in C2C12 cells. Biochem Biophys Res Commun. 2013 Apr 12;433(3):281–5.
94. Xu Y, Tanaka M, Arai H, Aoki J, Prestwich GD. Alkyl lysophosphatidic acid and fluoromethylene phosphonate analogs as metabolically-stabilized agonists for LPA receptors. Bioorg Med Chem Lett. 2004 Nov 1;14(21):5323–8.
95. Melnikova V, Bar-Eli M. Inflammation and melanoma growth and metastasis: the role of platelet-activating factor (PAF) and its receptor. Cancer Metastasis Rev. 2007 Dec;26(3-4):359–71.
96. Jessani N, Liu Y, Humphrey M, Cravatt BF. Enzyme activity profiles of the secreted and membrane proteome that depict cancer cell invasiveness. Proc Natl Acad Sci U S A. 2002 Aug 6;99(16):10335–40.
97. Pylayeva-Gupta Y, Grabocka E, Bar-Sagi D. RAS oncogenes: weaving a tumorigenic web. Nat Rev Cancer. 2011 Nov;11(11):761–74.
98. Dawson PJ, Wolman SR, Tait L, Heppner GH, Miller FR. MCF10AT: a model for the evolution of cancer from proliferative breast disease. Am J Pathol. 1996 Jan;148(1):313–9.
99. Tautenhahn R, Cho K, Uritboonthai W, Zhu Z, Patti GJ, Siuzdak G. An accelerated workflow for untargeted metabolomics using the METLIN database. Nat Biotechnol. 2012 Sep;30(9):826–8.
100. Welsh CJ, Robinson M, Warne TR, Pierce JH, Yeh GC, Phang JM. Accumulation of fatty alcohol in MCF-7 breast cancer cells. Arch Biochem Biophys. 1994 Nov 15;315(1):41–7.
101. Honsho M, Asaoku S, Fujiki Y. Posttranslational regulation of fatty acyl-CoA reductase 1, Far1, controls ether glycerophospholipid synthesis. J Biol Chem. 2010 Mar 19;285(12):8537–42.
92
102. Spandidos A, Wang X, Wang H, Seed B. PrimerBank: a resource of human and mouse PCR primer pairs for gene expression detection and quantification. Nucleic Acids Res. 2010 Jan;38(Database issue):D792–9.
103. Kopp F, Komatsu T, Nomura DK, Trauger SA, Thomas JR, Siuzdak G, et al. The glycerophospho metabolome and its influence on amino acid homeostasis revealed by brain metabolomics of GDE1(-/-) mice. Chem Biol. 2010 Aug 27;17(8):831–40.
104. Smith CA, Want EJ, O’Maille G, Abagyan R, Siuzdak G. XCMS: Processing Mass Spectrometry Data for Metabolite Profiling Using Nonlinear Peak Alignment, Matching, and Identification. Anal Chem. 2006 Feb;78(3):779–87.


