
Markets for African Tilapia Products and Impacts on
Local SuppliesKevin Fitzsimmons, Ph.D.
Professor, University of Arizona
PI – Aquaculture CRSP
Vice President, American Tilapia Association
President, World Aquaculture Society
Washington D.C.
April 28, 2004

Introduction
Quick review of tilapiaExplosion in tilapia tradeThe US and International MarketsValue added productsOpportunities to expand markets
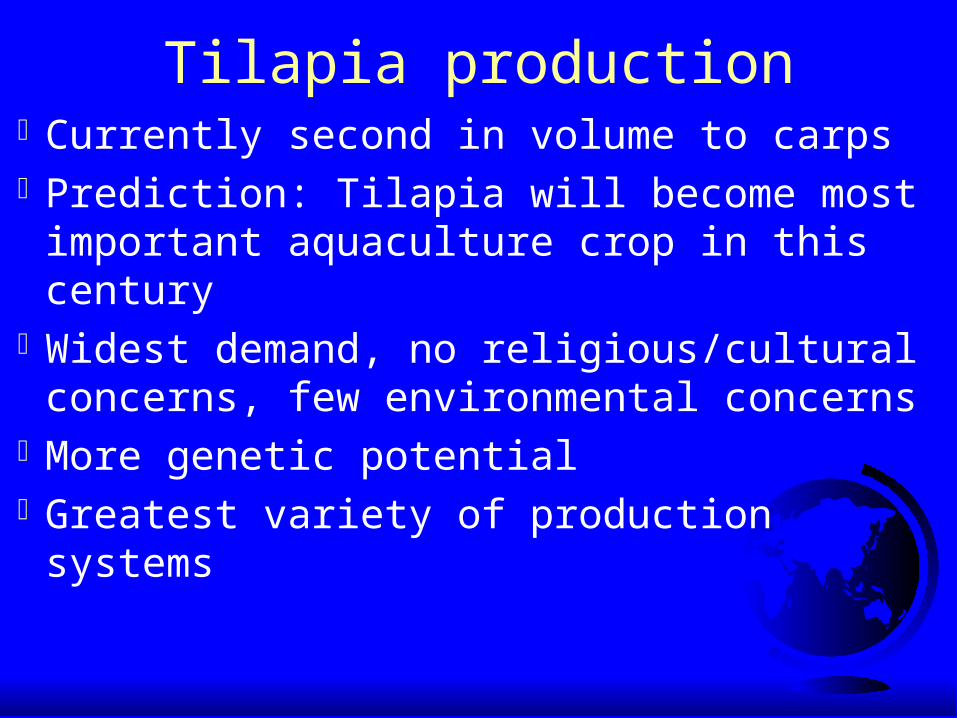
Tilapia productionCurrently second in volume to carpsPrediction: Tilapia will become most
important aquaculture crop in this centuryWidest demand, no religious/cultural
concerns, few environmental concernsMore genetic potentialGreatest variety of production systems

World Tilapia Production of 1,501,232 mt in 2003
China46%
Taiwan Prov.6%
Philippines7%
Thailand7%
Mexico7%
Others3%
Vietnam2%
Indonesia3%
Costa Rica1%
Colombia3%United States
1%Brasil
5%
Egypt4%
Cuba3%
Ecuador2%

Farmed around the world.Tilapia production in 100+ countries.China is world’s largest producer.Philippines, Thailand, Indonesia, Latin
America, Egypt significant producersGermany, Belgium, Spain, Canada,
Korea, Japan, most states in USTotal production >1,500,000 mt in 2003

Global Tilapia Sales (farmgate)
For year 2000US $ 1,706,538,200
(FAO Fisheries Circular No. 886)
2003 sales >$ 2,500,000,000

Tilapia - the aquatic chicken
Grows in all kinds of farmsEats all kinds of foodLarge eggs and easy to rear youngLots of ways to prepare the fish

Ponds and cages

Intensive tank cultureTanks in Arizona
Tanks in Eritrea

Raceway SystemsIntensive raceways
Extensive raceways

Intensive farms in buildings in cool climates

Intensive farms with recirculation in greenhouses

Integrated with crop irrigation

How did tilapia get so popular, so fast?

Tilapia - the Perfect “Aquaculture” Storm
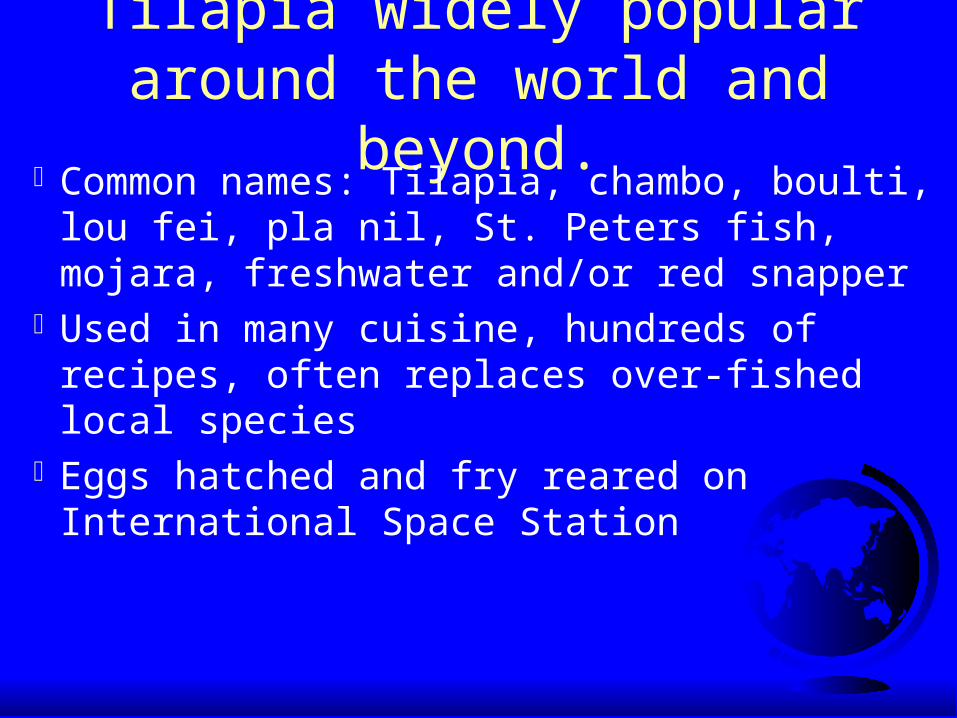
Tilapia widely popular around the world and beyond.
Common names: Tilapia, chambo, boulti, lou fei, pla nil, St. Peters fish, mojara, freshwater and/or red snapper
Used in many cuisine, hundreds of recipes, often replaces over-fished local species
Eggs hatched and fry reared on International Space Station

Established market demandAccepted in many national dishesPopular in many forms (live,
whole, fillets, fresh and frozen, smoked, sashimi, fried skins)

Environmentally correct
Primarily vegetarianMost farm systems cause little pollutionTilapia were long ago established as
exotic species, common food fishGrown mostly in developing countriesFew diseases, essentially no chemicals
used

Research & Development ISTA 6
(Manila, Philippines, Sept 12 -16, 2004) International Symposia on Tilapia in Aquaculture

Genetic Improvements in Tilapia
(From: Mair, G., 2002)

The YY male technology
(GMT®)

Major Tilapia Producers (for year 2002)
China - 706,000 metric tons / yearPhilippines - 122,277 mt / yearMexico - 110,000 mt / yearThailand - 100,000 mt / yearTaiwan Province - 90,000 mt / yearBrasil - 75,000 mt / year Indonesia - 50,000 mt / year

Major African Tilapia Producers (for year 2002)
Egypt - 55,000 metric tons / yearZimbabwe - 5,000 mt / yearKenya - 2,000 mt / yearZambia - 1,000 mt / yearSouth Africa - 1,000 mt / year

Commercial tilapia farms in Africa
Army Farmnear Abassa,Egypt
Dominion GroupRice/Tilapia farm near Kisumu, Kenya
Lake Harvest onLake Kariba, Zimbabwe
Farmers Co-op on Lake KaribaZambia

Tilapia research centers in Africa
Abassa, Egypt
Sagana and Eldoret, Kenya
Stellenbosch,South Africa
Zomba, Malawi
Massawa, Eritrea
Boake, Cote D’ Ivoire

Cages in Egypt10 m2 cages near Alexandria

SeaWater Farms, Massawa, Eritrea

Lake Harvest,
Zimbabwe

Lake Harvest,
Zimbabwe

Lake Harvest,
Zimbabwe

EU Tilapia Supply and Demand
Supply of fillets primarily from China, Southeast Asia, South and Central America.
Demand for live fish in immigrant Asian and African communities
With rapid increases in supply, demand must increase at least as fast to support price.

Consumer evolution
Ethnic buyers (Asian - African)Up-scale restaurantsCasual diningHyper and super marketsLocal groceries

US Tilapia consumption - 2003(187,000 mt of live weight
= 412,260,000 lbs)
020,00040,00060,00080,000
100,000120,000140,000160,000180,000200,000
Met
ric
tons
1986
1988
1990
1992
1994
1996
1998
2000
2002

Top Ten Seafoods (U.S.)per capita (lbs)
2000 2001 2002Tuna 3.5 Shrimp 3.4 Shrimp 3.7Shrimp 3.2 Tuna 2.9 Tuna 3.1Pollock 1.6 Salmon 2.0 Salmon 2.0Salmon 1.5 Pollock 1.2 Pollock 1.1Catfish 1.1 Catfish 1.1 Catfish 1.1Cod 0.8 Cod 0.6 Cod 0.66Clams 0.5 Clams 0.5 Crabs 0.57Crabs 0.4 Crabs 0.4 Clams 0.54Flatfish 0.4 Flatfish 0.4 Tilapia 0.40Scallops 0.3 Tilapia 0.35 Flatfish 0.32Tilapia 0.28

US. Tilapia imports 1993-2002Sources of imported tilapia to US
0
20000
40000
60000
80000
100000
120000
1993 1994 1995 1996 1997 1998 1999 2000 2001 2002
(LW
E in
met
ric to
ns)
others
Thailand
Indonesia
Colombia
China
Mexico
Jamaica
Ecuador
Costa Rica
Taiw an

Value of Tilapia product forms imported to the U.S. 2002
Fillet Fresh
Fillet Frozen
Whole Frozen
$0
$20,000,000
$40,000,000
$60,000,000
$80,000,000
$100,000,000
$120,000,000
$140,000,000
$160,000,000
$180,000,000
$200,000,000
1993 1994 1995 1996 1997 1998 1999 2000 2001 2002
$ U
S Whole Frozen
Fillet Frozen
Fillet Fresh
Figure 2. Value of Tilapia product forms imported to the U.S.
Fillet Fresh
Fillet Frozen
Whole Frozen
$0
$50,000,000
$100,000,000
$150,000,000
$200,000,000
$250,000,000
$300,000,000
1993 1994 1995 1996 1997 1998 1999 2000 2001 2002 2003
$ U
S Whole Frozen
Fillet Frozen
Fillet Fresh
$ 174,215,165 (2002) $241,205,610 (2003)

Tilapia product forms imported to the U.S.
Fillet Fresh
Fillet Frozen
Whole Frozen
0
10000
20000
30000
40000
50000
60000
70000
80000
90000
100000
1993 1994 1995 1996 1997 1998 1999 2000 2001 2002 2003
Me
tric
to
ns
Whole Frozen
Fillet Frozen
Fillet Fresh
17,952 mt fresh fillets, 23,249 mt frozen fillets, 49,045 mt whole frozen (2003)

Imports in 2003 were $241,205,610US production of $30,000,000 at farm2003 sales were over $271,000,000
1994 - 2003 US tilapia sales (imports and domestic) exceeded one billion $$$
US Consumption of tilapia

Major fresh fillet buyers (US)Major restaurant chains (Darden: Red Lobster, Bahama Breeze,
Olive Garden, Landry’s: Joe’s CrabShack, Wille G’s, Rainforest Cafe), Ruby Tuesday, Applebees).
Major grocery chains (Safeway, Kroger, Winn-Dixie, Wegmans, Publix, Basha’s)
Food service (supply small restaurant & grocery chains) - SYSCO, Fleming Co., Shamrock
Brokers - most based in Miami, Tampa, Houston, Los Angeles, San Francisco, New York, Seattle

Fresh tilapia fillet products
Size (under 3 oz, < 85 g) 3-5 oz, 85 - 140 g 4-6 oz, 110 - 170 g 5-7 oz, 140 - 195 g over 7 oz, > 195 g
Skin on, shallow skin or deep skin Individual wrap, 2 or 5 kg package, master pack
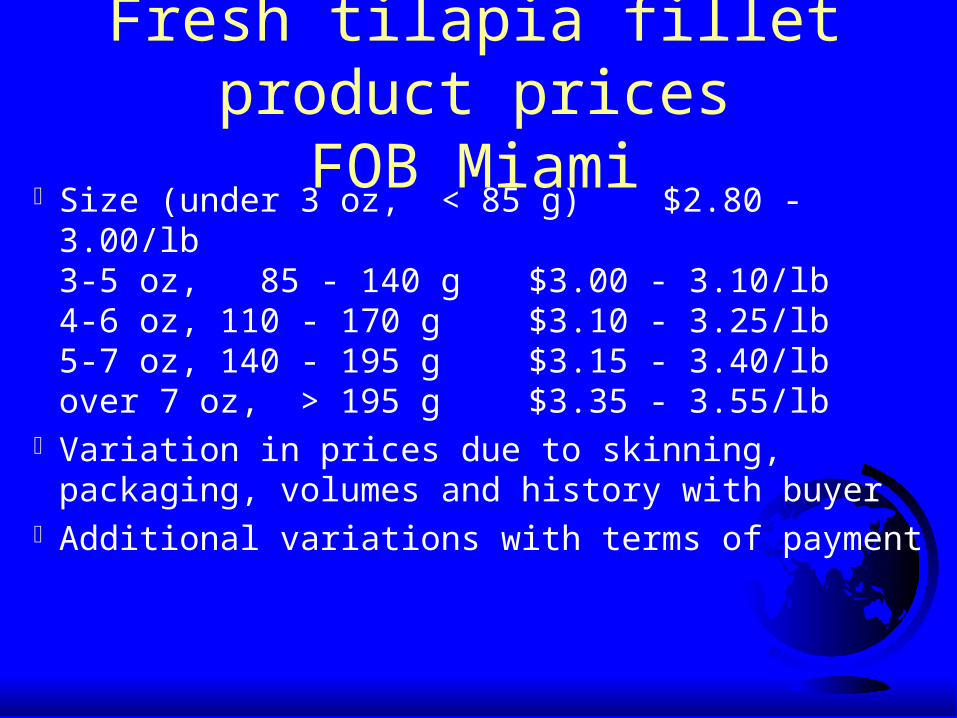
Fresh tilapia fillet product pricesFOB Miami
Size (under 3 oz, < 85 g) $2.80 - 3.00/lb 3-5 oz, 85 - 140 g $3.00 - 3.10/lb4-6 oz, 110 - 170 g $3.10 - 3.25/lb5-7 oz, 140 - 195 g $3.15 - 3.40/lbover 7 oz, > 195 g $3.35 - 3.55/lb
Variation in prices due to skinning, packaging, volumes and history with buyer
Additional variations with terms of payment

Expanding European marketsQuality control and assuranceAdvertisingNew recipesSubstitute for sea bream, sea bass,
flounder, snapperNew value added product forms

Quality control and assuranceNational standardsISO and HACCP (Hazard Analysis at
Critical Control Points)
Industry standardsBuyer standardsOther (NGO’s)

Advertising

Direct retail sales

New recipes

New recipes

By-productsLeather goods from skin will become a
significant contributor to profitabilityPharmaceuticals from skinsFormed fish productsFertilizerFish meal

Major Tilapia Producers in International Trade
China - whole frozen, IQF filletsEcuador - fresh filletsTaiwan - whole, IQF, sashimiSouth & Central America - fresh filletsZimbabwe - Fresh filletsIndonesia - IQF filletsThailand - IQF fillets

Current EU Market Trends
Increase in demand for all forms of tilapia
Demand increase will be greatest for fresh fillets
Prices have been constant for several years and will remain stable, will not increase with inflation

African MarketsLocal production and consumptionMajority stays in producing householdEgypt has market development, but little processing capacityRest of Africa needs more processing

Impacts of “Industrial” Production of Tilapia
Spin-off some products into local markets
Availability of prepared feedsAvailability of domesticated stocksPossibility of more production
cooperatives

Changes and Predictions
Production will be 75% Oreochromis niloticus, 20% Red strains, O. aureus and O. mossambicus mostly for hybridization

Changes and Predictions
Production will be 50% intensive ponds, 30% cages, 10% intensive recirculating and tank systems, 10 % other

Predictions for Value-added products
Processing and "value-adding" will intensify in producing countries

Sashimi

IQF Fillets

Breaded tilapia products

Fried tilapia skins

Smoked products

Changes and PredictionsMore “organic” forms
Reduction in MT for sex reversal

Changes and PredictionsWorld tilapia production (1,265,780
mt in 2000, FAO) reached 1,500,000 mt in 2003 and 2,000,000 mt by 2010
2003 sales over $2 billion 2010 sales over $4 billion

Aquaculture Collaborative
Research Support Program
Thank you!Questions?
The Aquaculture CRSP is funded in part by United States Agency for International
Development (USAID) Grant No. LAG-G-00-96-90015-00 and by participating institutions.

Tilapia production in the Americas

Strain evaluations For saline waters - Hybrid red strains are
preferred For cage and pond culture Chitralada strain of O.
niloticus originally from Thailand and further developed in Brasil.
The GIFT strain of O. niloticus, originally developed in Philippines is most common in Philippines and China
YY Super males - Genetically Male Tilapia

Estimated cost of production China - $0.70/kg Africa - $0.75/kg Philippines, Indonesia, Brasil - $0.80/kg Thailand, Peru - $0.85/kg Ecuador, Honduras, Costa Rica - $0.90/kg Mexico - $1.00/kg Taiwan Province - $1.05/kg US - $2.00/kg Canada - $2.10/kg


