Markus Amann, Janusz Cofala, Zbigniew Klimont, Wilfried Winiwarter, Wolfgang Schöpp, Frantisek Gyarfas, Imrich Bertok
Draft Baseline Scenariosfor
CAFE
Task Force for Integrated Assessment ModellingAmiens, May 10-12, 2004
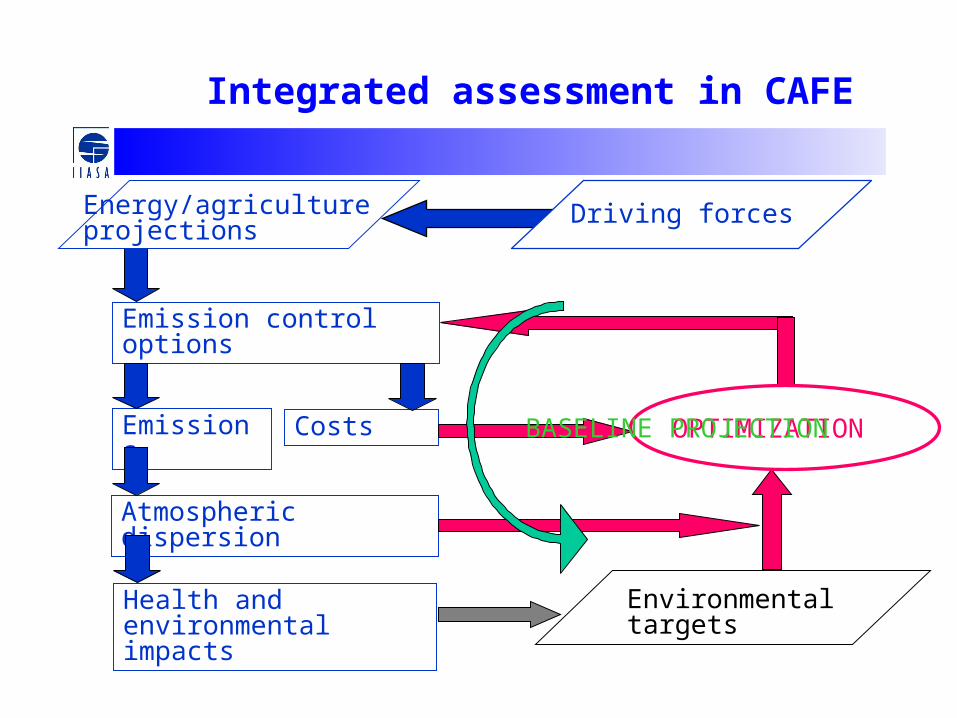
Integrated assessment in CAFE
Energy/agriculture projections
Emissions
Emission control options
Atmospheric dispersion
Health and environmental impacts
Costs
Environmental targets
OPTIMIZATION
Driving forces
BASELINE PROJECTION

Preparation of input data

Bilateral consultationsMain issues
Energy projections:
• Discrepancies of year 2000 energy statistics
• Comments on PRIMES projections– Obvious discrepancies– Differences in expectations
Emission calculations:
• Review of year 2000 emission inventory
• Penetration rates of control measures
• Emission control potential
for
• SO2, NOx, VOC, NH3, PM10/2.5

Bilateral consultations (1)
Country or organization
Consultation meeting date
No of experts
Comments received Comments PRIMES
Energy scenario
Agr. scen
Denmark - - 16 Jan 04 - Y Y
Latvia - - 08 Oct 03 - - Y
EUROPIA 2-3 Oct 03 2 05 Dec 03 – 23 Mar 04 -
EURELECTRIC 30-31 Oct 03 4 - -
Hungary 14 Nov 03 1 - - - -
Germany 20-21 Nov 03 4 19 Dec 03 - 23 Mar 04 Y - -
Czech Republic 25 Nov 03 3 19 Dec - 27 Feb, 07Apr 04 Y - Y
ACEA 12 Dec 03 10 - -
Italy 15-16 Dec 03 2 19 Jan, 15 Feb - 02 Apr 04 Y Y -
France 8-9 Jan 04 5 31 Mar 04 - 2-15 Apr 04 Y Y -
Sweden 22-23 Jan 04 3 29 Jan, 09 Mar - 04 Apr 04 Y Y Y
UK 26-28 Jan 04 8 19 Feb, 03 Mar - 15 Mar, 06 Apr 04
Y - Y
Spain 4-5 Feb 04 5 30 Mar 04 - 13 Apr 04 Y - -
Red numbers indicate delivery after deadline

Bilateral consultations (2)
Country or organization
Consultation meeting date
No of experts
Comments received Comments PRIMES
Energy scenario
Agr. . scen
Portugal 12-13 Feb 04 5 27 Feb, 03,05 Mar - 08 Apr 04 Y Y Y
Belgium 16-17 Feb 04 7 08 Mar - 2-13 Apr, 06 Apr 04 Y Y -
Austria 23 Feb 04 11 24 Feb - 18,19 Mar, 19 Apr 04 - - Y
Ireland 4-5/19 Mar 04 2 12,19 Mar 04 Y - Y
ESVOC 8 Mar 04 3 - - -
Finland 8-9 Mar 04 3 19,25 Mar 04 - 19 Apr 04 Y (Y) -
Lithuania 10 Mar 04 2 24 Mar 04 Y - -
Estonia 12 Mar 04 2 17 Mar 04 - - -
Slovakia 15 Mar 04 3 22 Mar 04 Y - -
Poland 17-18 Mar 04 2 17,18 Mar 04 - 07 Apr 04 - - -
Slovenia 22 Mar 04 2 24,29 Mar 04 - 01, 08 Apr 04 - Y Y
Netherlands 25-26 Mar 04 4 16 Mar 04 - 02,08,18 Apr 04 Y - Y
19 + 4 94 21 14 7 10
Red numbers indicate delivery after deadline

CAFE energy baseline projections
• Two draft baseline projections – available– include PRIMES numbers plus additional assumptions from national
submissions (e.g., share of LDTs in freight transport, fuel use by off-road vehicles and maritime activities, corrections for fuel used outside EMEP area)
• National projections - will be implemented by June– Currently available for eight countries, some of them need to be
completed or re-formatted
• Revised PRIMES projection (with climate) by June
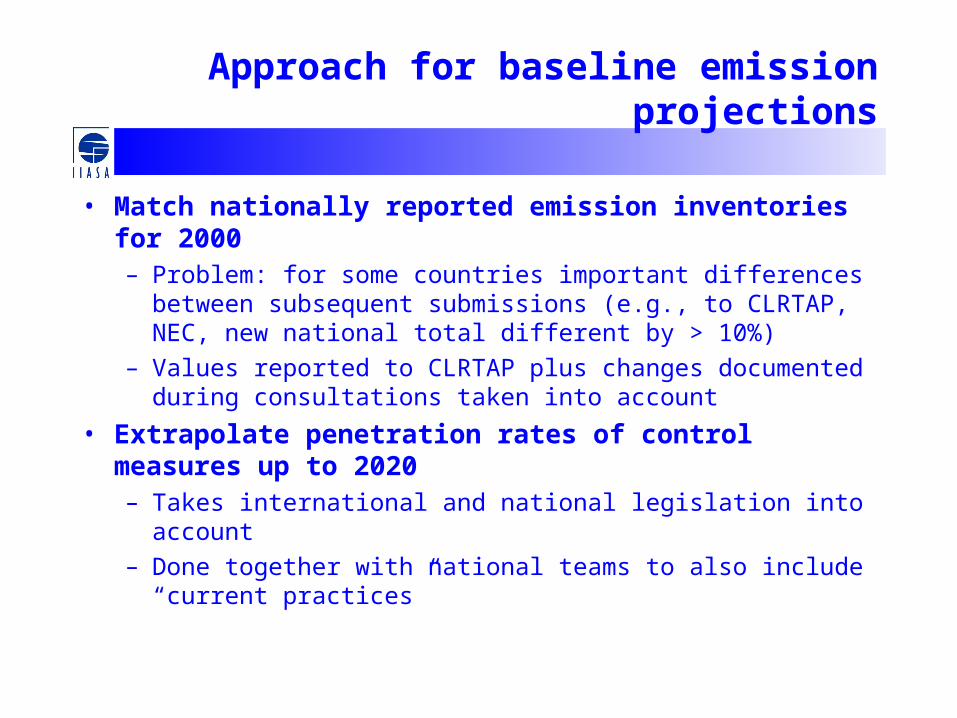
Approach for baseline emission projections
• Match nationally reported emission inventories for 2000– Problem: for some countries important differences between
subsequent submissions (e.g., to CLRTAP, NEC, new national total different by > 10%)
– Values reported to CLRTAP plus changes documented during consultations taken into account
• Extrapolate penetration rates of control measures up to 2020– Takes international and national legislation into account– Done together with national teams to also include “current
practices”

Transport emissions - approach (1)
• Exhaust emissions – fuel use from PRIMES
• Non-exhaust emissions – veh-km (derived from fuel use)
• Turnover of fleet taken from national estimates
• National emission factors applied where available (Auto/Oil estimates modified during consultations)
• Efficiencies of EURO-stages based on Auto/Oil info plus other sources (TREMOD, Austrian model, RICARDO - for EURO 5/6)

Transport emissions - approach (2)
• Impact of cycle-beating for trucks on NOx considered (ARTEMIS Project, report by TU Graz, 2003),generates inconsistencies with some national 2000 emission inventories
• Other findings of ARTEMIS not included
• Data for off-road sources from EGTEI
• Consistency with TREMOVE not yet established
• Further calibration and updates is needed when new data become available
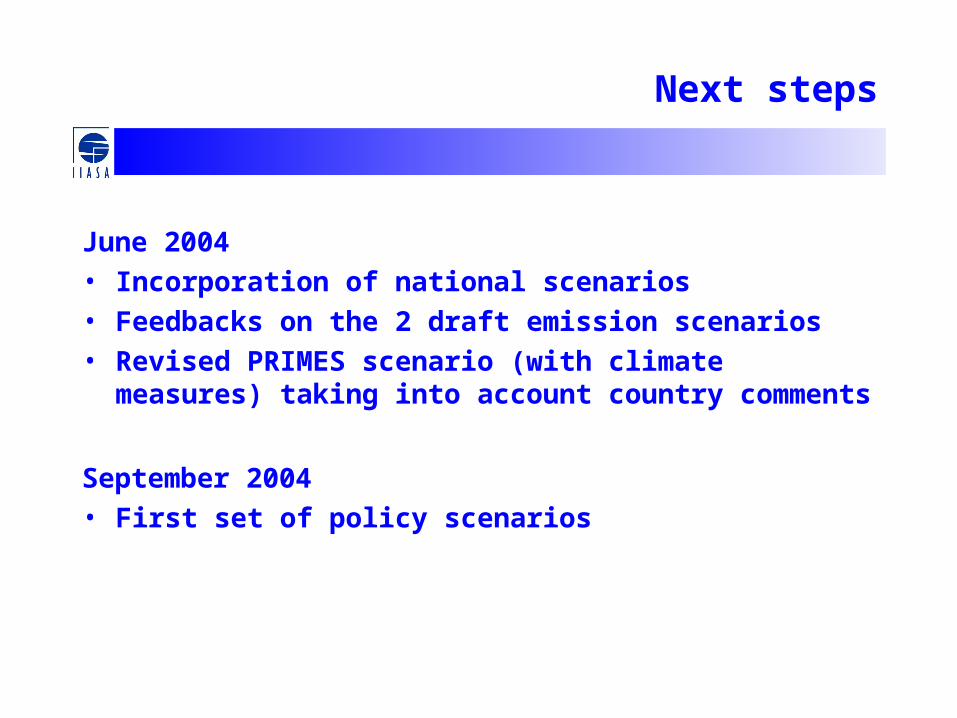
Next steps
June 2004
• Incorporation of national scenarios
• Feedbacks on the 2 draft emission scenarios
• Revised PRIMES scenario (with climate measures) taking into account country comments
September 2004
• First set of policy scenarios

Draft baseline emission projections

Energy projections

Energy use per fuel EU-15 [PJ]
0
20000
40000
60000
80000
2000 2005 2010 2015 2020
No further climate measures With climate measures
0
20000
40000
60000
80000
2000 2005 2010 2015 2020
Solid fuels Liquid fuels Natural gas Renewable Nuclear Difference to "no further climate measures"

Energy use per fuelNew Member States [PJ]
0
2000
4000
6000
8000
10000
2000 2005 2010 2015 2020
No further climate measures With climate measures
0
2000
4000
6000
8000
10000
2000 2005 2010 2015 2020
Solid fuels Liquid fuels Natural gas Renewable Nuclear Difference to "no further climate measures"

Agricultural projections

Animal numbers (pre-CAP reform), relative to 2000
Cattle Pigs Chicken Other animals
EU-15 New Member States
0%
20%
40%
60%
80%
100%
120%
140%
2000 2005 2010 2015 2020
0%
20%
40%
60%
80%
100%
120%
140%
2000 2005 2010 2015 2020
SO2 emissions

Comparison of 2000 SO2 inventoriesRAINS vs. national estimates
0%
25%
50%
75%
100%
125%
150%
175%
200%
Austri
a
Belgium
Cypru
s
Czech
Rep
ublic
Denm
ark
Estonia
Finlan
d
Franc
e
Germ
any
Greec
e
Hunga
ry
Irelan
dIta
ly
Latvi
a
Lithu
ania
Luxe
mbo
urg
Malt
a
Nethe
rland
s
Poland
Portu
gal
Slovak
ia
Sloven
ia
Spain
Sweden UK
RAINS National inventory

SO2 emissions
• Measures:– Large Combustion Plant Directive– S Content of Liquid Fuels Directive – Directives on quality of petrol and diesel fuels– IPPC legislation on process sources– National legislation and national practices (if stricter)
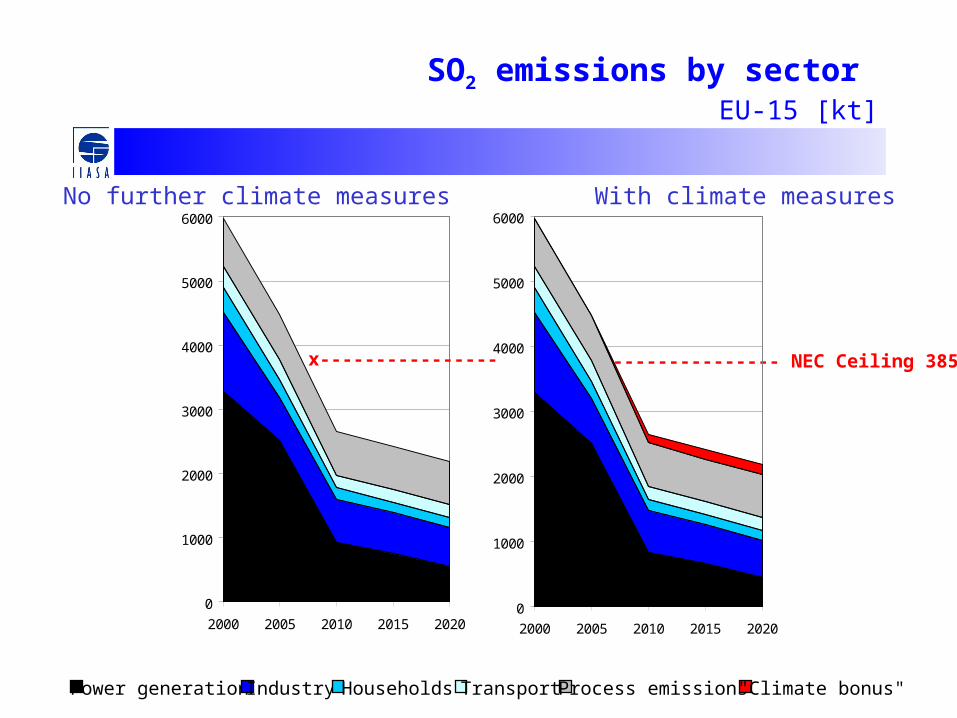
SO2 emissions by sector EU-15 [kt]
0
1000
2000
3000
4000
5000
6000
2000 2005 2010 2015 2020
x---------------- NEC Ceiling 3850 ktx----------------
0
1000
2000
3000
4000
5000
6000
2000 2005 2010 2015 2020
Power generation Industry Households Transport Process emissions "Climate bonus"
No further climate measures With climate measures

SO2 emissions by sector New Member States [kt]
0
500
1000
1500
2000
2500
3000
2000 2005 2010 2015 2020
0
500
1000
1500
2000
2500
3000
2000 2005 2010 2015 2020
Power generation Industry Households Transport Process emissions "Climate bonus"
x---------------- NEC Ceiling 2693 kt
x----------------
No further climate measures With climate measures

Projected SO2 emissions in 2010compared to NEC emission ceilings, EU-15
0%
20%
40%
60%
80%
100%
120%
140%
Austri
a
Belgium
Denm
ark
Finlan
d
Franc
e
Germ
any
Greec
e
Irelan
dIta
ly
Luxe
mbo
urg
Nethe
rland
s
Portu
gal
Spain
Sweden UK
EU-15
No further climate measures With climate measures NEC Ceiling

Projected SO2 emissions in 2010compared to NEC emission ceilings, NMS
0%
20%
40%
60%
80%
100%
120%
140%
Cypru
s
Czech
Rep
ublic
Estonia
Hunga
ry
Latvi
a
Lithu
ania
Malt
a
Poland
Slovak
ia
Sloven
ia
Total
NMS
No further climate With climate measures NEC

NOx emissions

Comparison of 2000 NOx inventoriesRAINS vs. national estimates
0%
25%
50%
75%
100%
125%
150%
175%
200%
Austri
a
Belgium
Cypru
s
Czech
Rep
ublic
Denm
ark
Estonia
Finlan
d
Franc
e
Germ
any
Greec
e
Hunga
ry
Irelan
dIta
ly
Latvi
a
Lithu
ania
Luxe
mbo
urg
Malt
a
Nethe
rland
s
Poland
Portu
gal
Slovak
ia
Sloven
ia
Spain
Sweden UK
RAINS National inventory
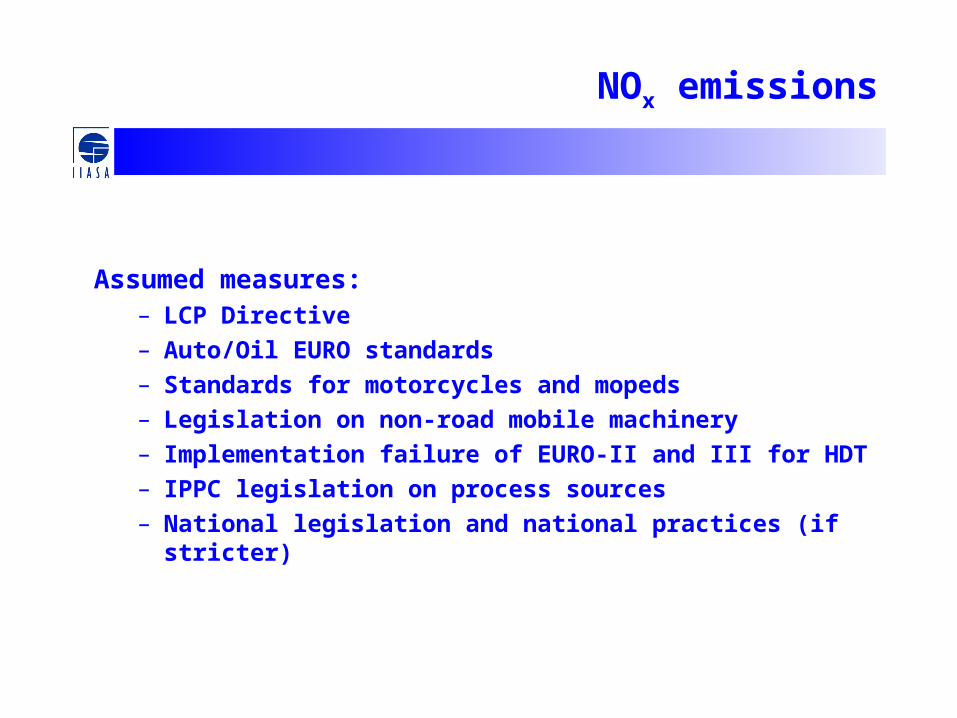
NOx emissions
Assumed measures:– LCP Directive– Auto/Oil EURO standards– Standards for motorcycles and mopeds– Legislation on non-road mobile machinery – Implementation failure of EURO-II and III for HDT– IPPC legislation on process sources– National legislation and national practices (if stricter)

NOx emissions by sectorEU-15 [kt]
0
2000
4000
6000
8000
10000
2000 2005 2010 2015 2020
x---------------
Power generation Industry Households Transport Process emissions "Climate bonus"
0
2000
4000
6000
8000
10000
2000 2005 2010 2015 2020
x---------------- NEC Ceiling 6519 kt
No further climate measures With climate measures
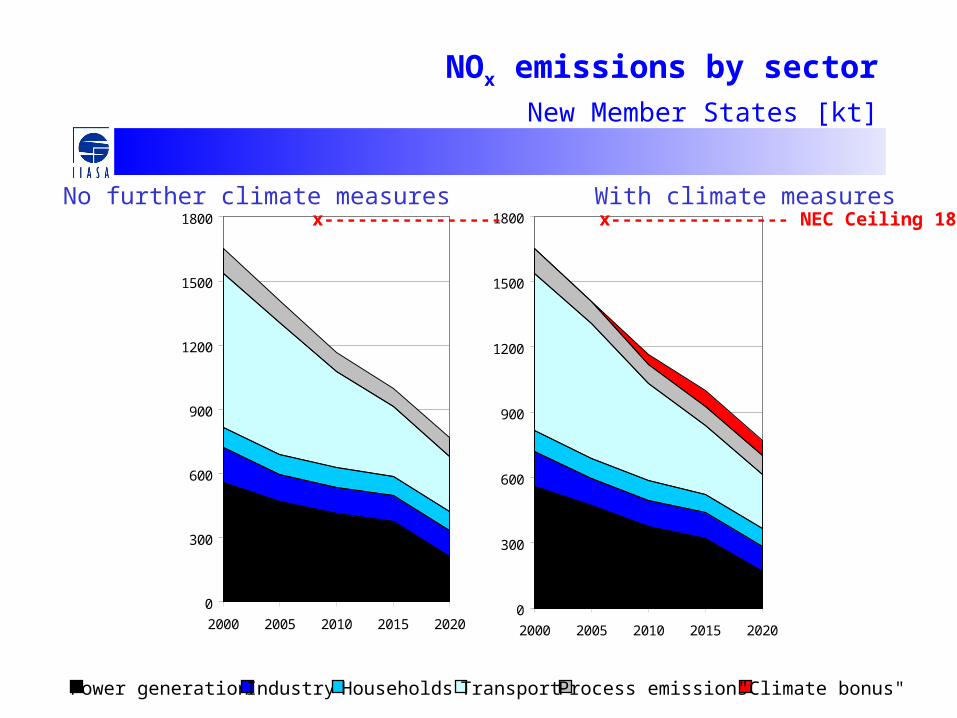
NOx emissions by sector New Member States [kt]
0
300
600
900
1200
1500
1800
2000 2005 2010 2015 20200
300
600
900
1200
1500
1800
2000 2005 2010 2015 2020
Power generation Industry Households Transport Process emissions "Climate bonus"
x---------------- NEC Ceiling 1800 ktx----------------No further climate measures With climate measures

Projected NOx emissions in 2010compared to NEC emission ceilings, EU-15
0%
20%
40%
60%
80%
100%
120%
140%
160%
180%
200%
Austri
a
Belgium
Denm
ark
Finlan
d
Franc
e
Germ
any
Greec
e
Irelan
dIta
ly
Luxe
mbo
urg
Nethe
rland
s
Portu
gal
Spain
Sweden UK
EU-15
No further climate measures With climate measures NEC Ceiling

Projected NOx emissions in 2010compared to NEC emission ceilings, NMS
0%
20%
40%
60%
80%
100%
120%
Cypru
s
Czech
Rep
ublic
Estonia
Hunga
ry
Latvi
a
Lithu
ania
Malt
a
Poland
Slovak
ia
Sloven
ia
Total
NMS
No further climate With climate measures NEC

Emissions from shipping [% of land-based EU-25 emissions]
0%
20%
40%
60%
80%
100%
120%
2000 2010 2020
NOx SO2

VOC emissions

Comparison of 2000 VOC inventoriesRAINS vs. national estimates
0%
25%
50%
75%
100%
125%
150%
175%
200%
Austri
a
Belgium
Cypru
s
Czech
Rep
ublic
Denm
ark
Estonia
Finlan
d
Franc
e
Germ
any
Greec
e
Hunga
ry
Irelan
dIta
ly
Latvi
a
Lithu
ania
Luxe
mbo
urg
Malt
a
Nethe
rland
s
Poland
Portu
gal
Slovak
ia
Sloven
ia
Spain
Sweden UK
RAINS National inventory

VOC emissions
• Assumed measures:– Stage I Directive– Directive 91/441 (carbon canisters)– Auto/Oil EURO standards– Fuel Directive (RVP of fuels)– Solvents Directive– Product Directive (paints)– National legislation, e.g., Stage II
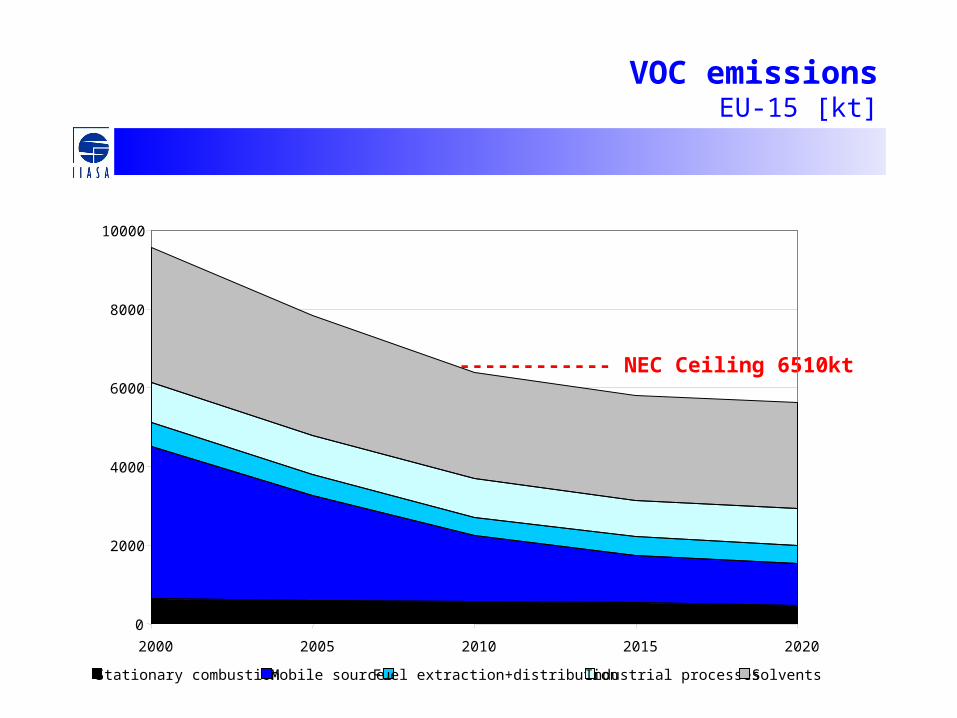
VOC emissionsEU-15 [kt]
x--------------- NEC Ceiling 6510kt
0
2000
4000
6000
8000
10000
2000 2005 2010 2015 2020
Stationary combustion Mobile sources Fuel extraction+distribution Industrial processes Solvents

VOC emissions New Member States [kt]
0
300
600
900
1200
1500
2000 2005 2010 2015 2020
Stationary combustion Mobile sources Fuel extraction+distribution Industrial processes Solvents
x--------------- NEC Ceiling 1640 kt

Projected VOC emissions in 2010compared to NEC emission ceilings, EU-15
0%
20%
40%
60%
80%
100%
120%
140%
160%
180%
Austri
a
Belgium
Denm
ark
Finlan
d
Franc
e
Germ
any
Greec
e
Irelan
dIta
ly
Luxe
mbo
urg
Nethe
rland
s
Portu
gal
Spain
Sweden UK
EU-15
No further climate measures With climate measures NEC Ceiling

Projected VOC emissions in 2010compared to NEC emission ceilings, NMS
0%
20%
40%
60%
80%
100%
120%
Cypru
s
Czech
Rep
ublic
Estonia
Hunga
ry
Latvi
a
Lithu
ania
Malt
a
Poland
Slovak
ia
Sloven
ia
Total
NMS
No further climate With climate measures NEC

NH3 emissions
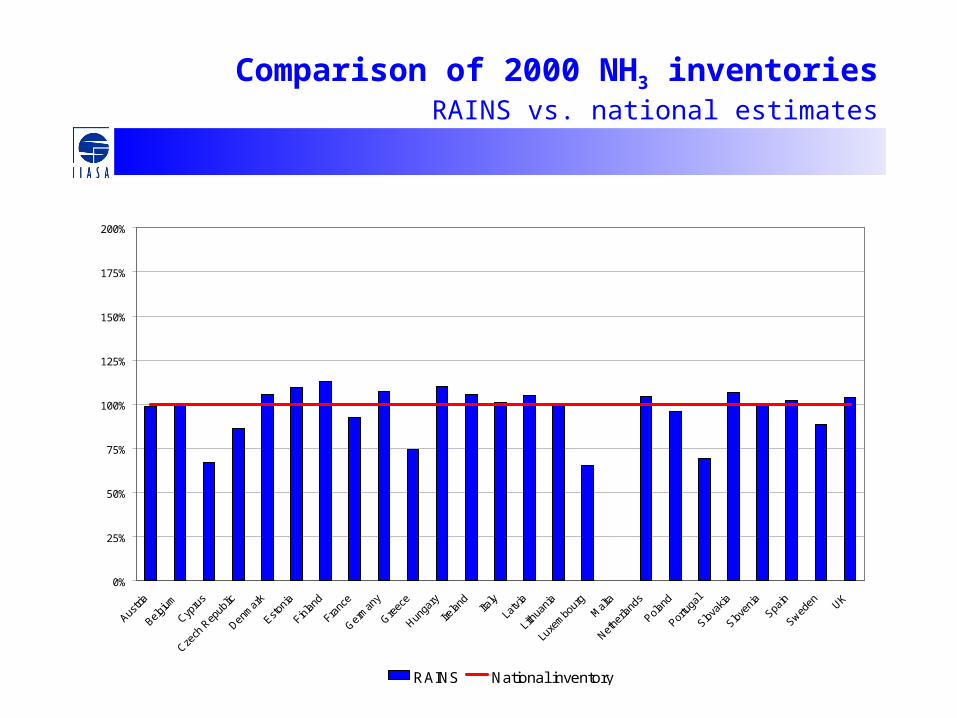
Comparison of 2000 NH3 inventoriesRAINS vs. national estimates
0%
25%
50%
75%
100%
125%
150%
175%
200%
Austri
a
Belgium
Cypru
s
Czech
Rep
ublic
Denm
ark
Estonia
Finlan
d
Franc
e
Germ
any
Greec
e
Hunga
ry
Irelan
dIta
ly
Latvi
a
Lithu
ania
Luxe
mbo
urg
Malt
a
Nethe
rland
s
Poland
Portu
gal
Slovak
ia
Sloven
ia
Spain
Sweden UK
RAINS National inventory

NH3 emissions
Assumed measures:– No EU-wide legislation– National legislations – Current practice

NH3 emissions EU-15 [kt]
0
500
1000
1500
2000
2500
3000
3500
2000 2005 2010 2015 2020
Cattle Other animals Industry Fuel combustion
x--------------- NEC Ceiling 3310 kt

NH3 emissions New Member States [kt]
0
100
200
300
400
500
600
700
2000 2005 2010 2015 2020
Cattle Other animals Industry Fuel combustion
x--------------- NEC Ceiling 866 kt

Projected NH3 emissions in 2010compared to NEC emission ceilings, EU-15
0%
20%
40%
60%
80%
100%
120%
140%
Austri
a
Belgium
Denm
ark
Finlan
d
Franc
e
Germ
any
Greec
e
Irelan
dIta
ly
Luxe
mbo
urg
Nethe
rland
s
Portu
gal
Spain
Sweden UK
EU-15
Pre-CAP reform scenario NEC Ceiling

Projected NH3 emissions in 2010compared to NEC emission ceilings, NMS
0%
20%
40%
60%
80%
100%
120%
Cypru
s
Czech
Rep
ublic
Estonia
Hunga
ry
Latvi
a
Lithu
ania
Malt
a
Poland
Slovak
ia
Sloven
ia
Total
NMS
Pre-CAP reform NEC

PM2.5 emissions
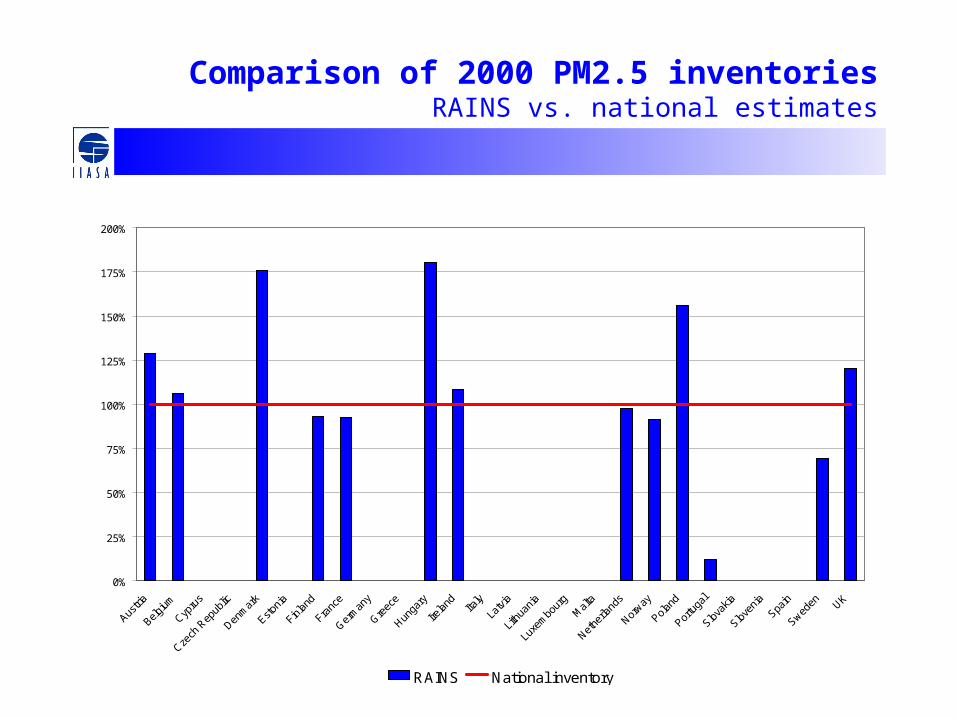
Comparison of 2000 PM2.5 inventoriesRAINS vs. national estimates
0%
25%
50%
75%
100%
125%
150%
175%
200%
Austri
a
Belgium
Cypru
s
Czech
Rep
ublic
Denm
ark
Estonia
Finlan
d
Franc
e
Germ
any
Greec
e
Hunga
ry
Irelan
dIta
ly
Latvi
a
Lithu
ania
Luxe
mbo
urg
Malt
a
Nethe
rland
s
Norway
Poland
Portu
gal
Slovak
ia
Sloven
ia
Spain
Sweden UK
RAINS National inventory

PM10 emissions
• Assumed measures:– LCP Directive– Auto/Oil EURO standards– Standards for motorcycles and mopeds– Legislation on non-road mobile machinery – IPPC legislation on process sources– National legislation and national practices (if stricter)
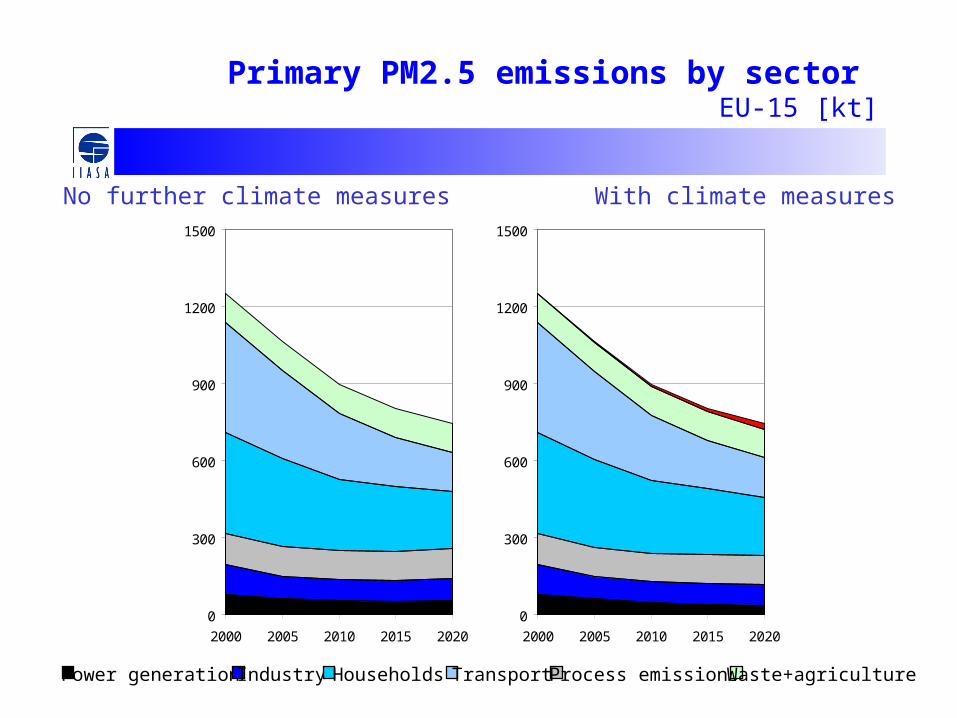
Primary PM2.5 emissions by sector EU-15 [kt]
Power generation Industry Households Transport Process emissions Waste+agriculture
No further climate measures With climate measures
0
300
600
900
1200
1500
2000 2005 2010 2015 2020
0
300
600
900
1200
1500
2000 2005 2010 2015 2020

Primary PM2.5 emissions by sector New Member States [kt]
Power generation Industry Households Transport Process emissions Waste+agriculture
No further climate measures With climate measures
0
100
200
300
400
2000 2005 2010 2015 2020
0
100
200
300
400
2000 2005 2010 2015 2020
Draft conclusions
• General downwards trend in emissions caused by– Legislation on transport emissions
– Further penetration of natural gas
– Large Combustion Plant Directive
• Larger improvements in New Member States
• Caveats:– National energy projections might differ from PRIMES
– Further validation of emission estimates necessary
– More information on effects of transport emission legislation required


Air quality impacts
Provisional estimates!

PM2.5
Contribution from anthropogenic emissions excluding secondary organic aerosols
No natural sources (soil, sea salt, biogenic, etc.) included!
Rural concentrationsAnnual mean
Average 1999 & 2003 meteorology

Anthropogenic contribution to PM2.5
2000 2010 2020
Rural concentrations, annual mean [µg/m3]from known anthropogenic sources excluding sec. org. aerosolsEmissions for 2020, no further climate measures, Average meteorology for 1999 and 2003, EMEP Eulerian model

Loss in life expectancy

Loss in life expectancy due to PM2.5Inter-annual meteorological variability
2003 Mean 1999
Loss in average life expectancy (days)Due to identified anthropogenic PM2.5Emissions of 2000

Loss in life expectancy
Loss in average life expectancy due to identified anthropogenic PM2.5 (days)Mean meteorology
2000 2010 2020

PM10
Contribution from anthropogenic emissions excluding secondary organic aerosols
No natural sources (soil, sea salt, etc.) included!
Rural concentrations
Annual mean
Average 1999 & 2003 meteorology

Anthropogenic contribution to PM10 2000
Rural concentrationsannual mean
[µg/m3]from known anthropogenic sources
excluding sec. org. aerosols
Emissions for 2000
Average meteorologyfor 1999 and 2003
EMEP Eulerian model

Anthropogenic contribution to PM10
2000 2010 2020
Rural concentrations, annual mean [µg/m3]from known anthropogenic sources excluding sec. org. aerosolsEmissions for the “no further climate measures” scenario Average meteorology for 1999 and 2003

Ozone AOT40
Six months (April-September)
Average 1999 & 2003 meteorology
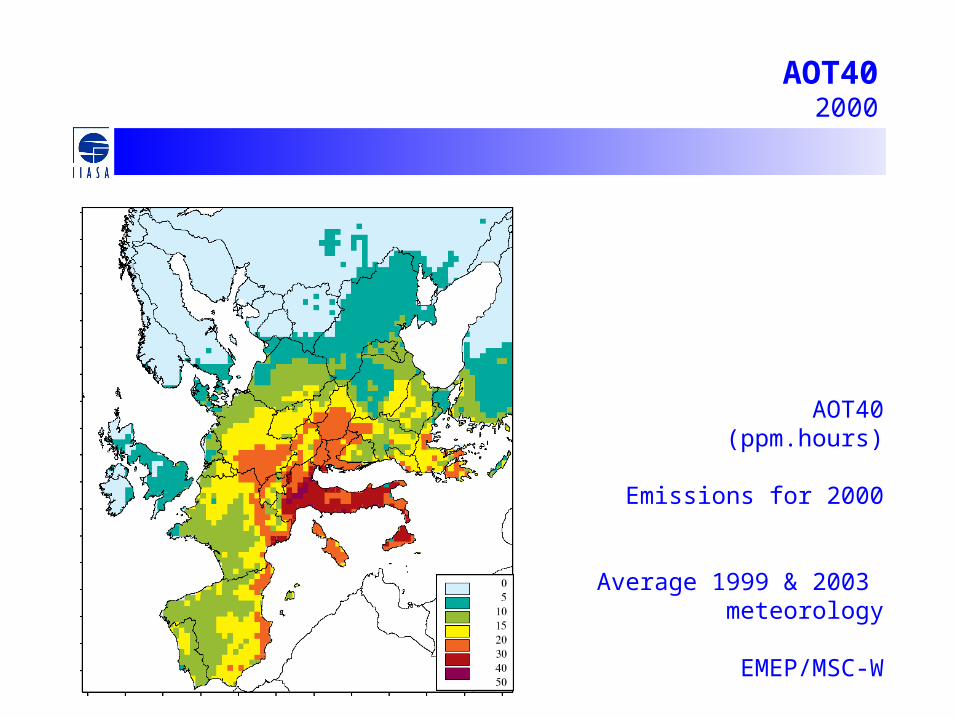
AOT402000
AOT40(ppm.hours)
Emissions for 2000
Average 1999 & 2003 meteorology
EMEP/MSC-W
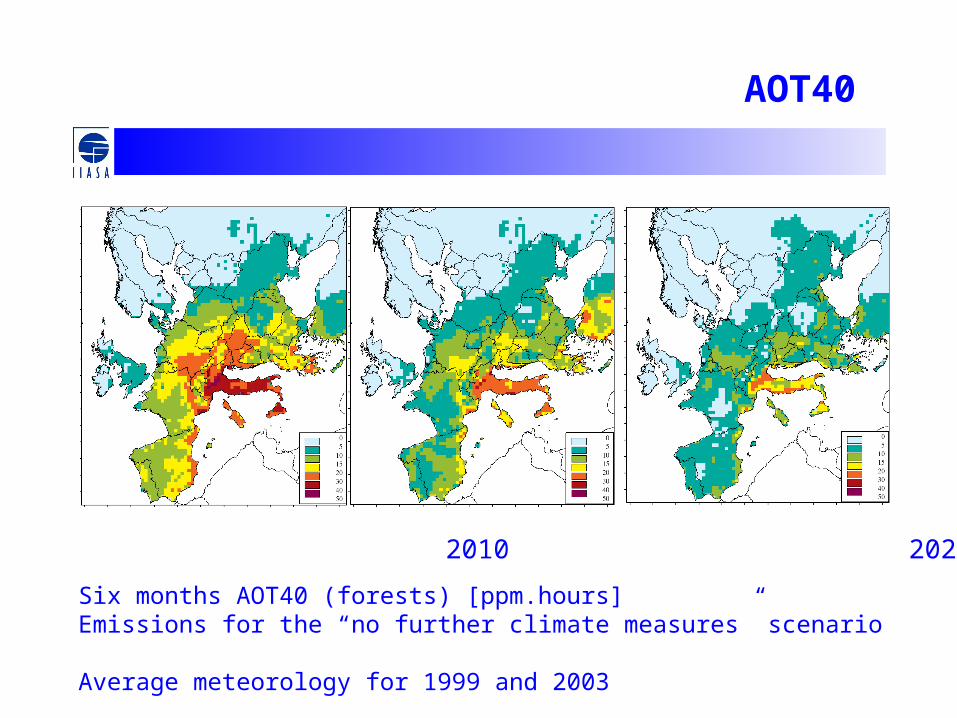
AOT40
2000 2010 2020
Six months AOT40 (forests) [ppm.hours]Emissions for the “no further climate measures” scenario Average meteorology for 1999 and 2003

Ozone AOT60
Six months (April-September)
Average 1999 & 2003 meteorology

AOT60 (ppm.hours)
2000 2010 2020
Mean meteorology, April-September
Acidification of forest soils
Percentage of forest area
with acid deposition above critical loads
Using ecosystem-specific deposition!
Based on preliminary critical loads data!
Average 1999 & 2003 meteorology
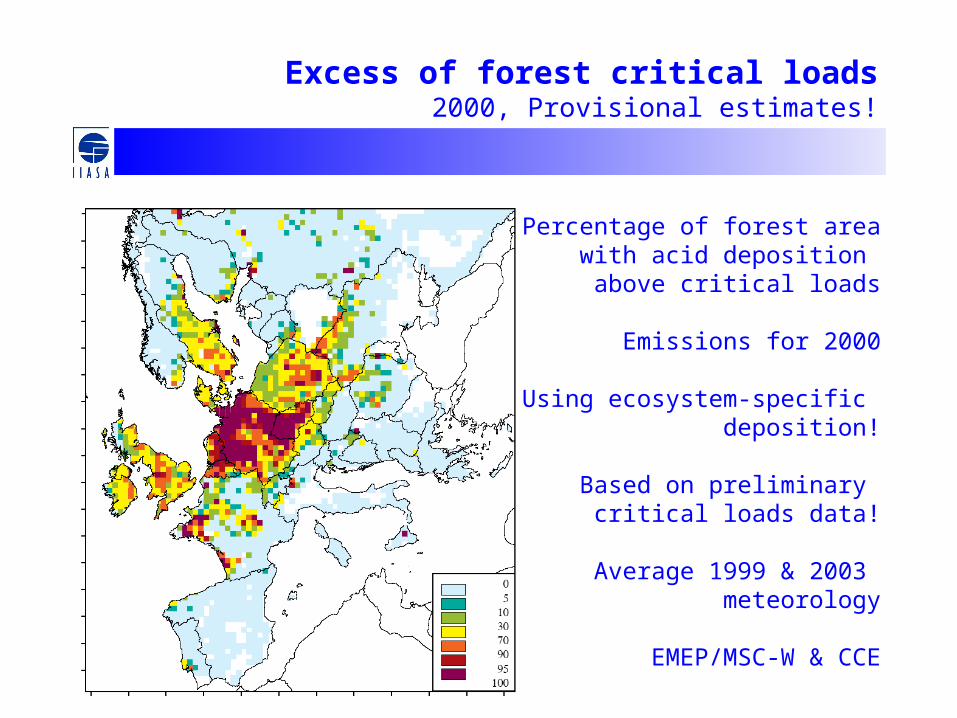
Excess of forest critical loads2000, Provisional estimates!
Percentage of forest area with acid deposition
above critical loads
Emissions for 2000
Using ecosystem-specific deposition!
Based on preliminary critical loads data!
Average 1999 & 2003 meteorology
EMEP/MSC-W & CCE

Excess of forest critical loads
Percentage of forest areawith acid deposition above critical loads, using ecosystem-specific deposition, mean meteorology
2000 2010 2020


