
TSX: IMG NYSE: IAG TSX: IMG NYSE: IAG
Gordon Stothart Executive Vice President & Chief Operating Officer
Maximizing Returns for Investors
April 18, 2012
Cautionary Statement
This presentation contains forward-looking statements. All statements, other than of historical fact, that address activities, events or
developments that the Company believes, expects or anticipates will or may occur in the future (including, without limitation,
statements regarding expected, estimated or planned gold and niobium production, cash costs, margin expansion, capital
expenditures and exploration expenditures and statements regarding the estimation of mineral resources, exploration results,
potential mineralization, potential mineral resources and mineral reserves) are forward-looking statements. Forward-looking
statements are generally identifiable by use of the words “may”, “will”, “should”, “continue”, “expect”, “anticipate”, “estimate”,
“believe”, “intend”, “plan” or “project” or the negative of these words or other variations on these words or comparable terminology.
Forward-looking statements are subject to a number of risks and uncertainties, many of which are beyond the Company’s ability to
control or predict, that may cause the actual results of the Company to differ materially from those discussed in the forward-looking
statements. Factors that could cause actual results or events to differ materially from current expectations include, among other
things, without limitation, failure to meet expected, estimated or planned gold and niobium production, cash costs, margin
expansion, capital expenditures and exploration expenditures and failure to establish estimated mineral resources, the possibility
that future exploration results will not be consistent with the Company's expectations, changes in world gold markets and other risks
disclosed in IAMGOLD’s most recent Form 40-F/Annual Information Form on file with the United States Securities and Exchange
Commission and Canadian provincial securities regulatory authorities. Any forward-looking statement speaks only as of the date on
which it is made and, except as may be required by applicable securities laws, the Company disclaims any intent or obligation to
update any forward-looking statement.
The United States Securities and Exchange Commission (the "SEC") permits mining companies, in their filings with the SEC, to
disclose only those mineral deposits that a company can economically and legally extract or produce. We use certain terms in this
presentation, such as "mineral resources" , that the SEC guidelines strictly prohibit us from including in our filings with the SEC.
U.S. investors are urged to consider closely the disclosure in the IAMGOLD Annual Report on Form 40-F. A copy of the most recent
Form 40-F is available to shareholders, free of charge, upon written request addressed to the Investor Relations Department.
Total Resources includes all categories of resources unless indicated otherwise.
All currency numbers are in US$ unless otherwise stated.
2

Westwood
MOUSKA
Quimsacocha
ROSEBEL
YATELA SADIOLA
Boto Siribaya
Kalana NIOBEC
IAMGOLD’s Platform – High Quality, Long-Life Assets
3 Natural extensions with significant expansion potential
MINE
Development Project
Advanced Exploration
Exploration Office
ESSAKANE
Brazil
Suriname
Senegal
Burkina Faso
Colombia
Val d’Or
Mali
Peru
4
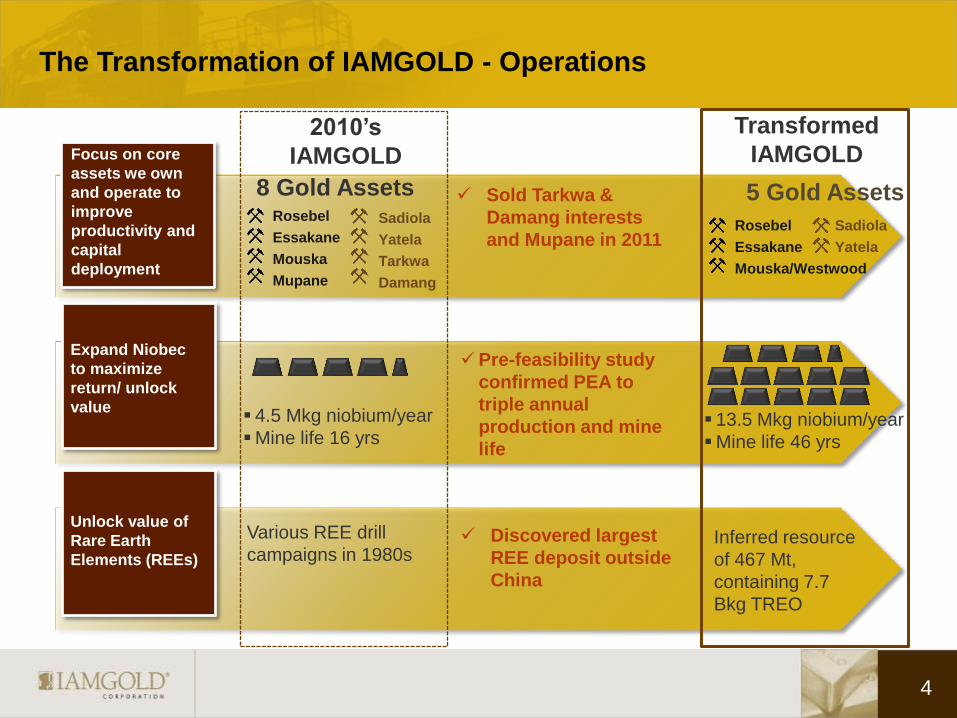
The Transformation of IAMGOLD - Operations
2010’s
IAMGOLD
Transformed
IAMGOLD Focus on core
assets we own
and operate to
improve
productivity and
capital
deployment
8 Gold Assets Rosebel
Essakane
Mouska
Mupane
Sadiola
Yatela
Tarkwa
Damang
Expand Niobec
to maximize
return/ unlock
value
Unlock value of
Rare Earth
Elements (REEs)
Sold Tarkwa &
Damang interests
and Mupane in 2011
5 Gold Assets
Rosebel
Essakane
Mouska/Westwood
Sadiola
Yatela
4.5 Mkg niobium/year
Mine life 16 yrs 13.5 Mkg niobium/year
Mine life 46 yrs
Pre-feasibility study
confirmed PEA to
triple annual
production and mine
life
Various REE drill
campaigns in 1980s Discovered largest
REE deposit outside
China
Inferred resource
of 467 Mt,
containing 7.7
Bkg TREO

5
The Transformation of IAMGOLD - Financials
2010’s
IAMGOLD
Transformed
IAMGOLD Strengthen
balance sheet to
maximize
financial
flexibility
Improve liquidity
to enhance
financial
flexibility
Improve return to
shareholders
Cash balances
enhanced through
sale of non-strategic
assets
Increased dividend
312%
$271M: Cash & Cash
Equivalents
$141M: Gold Bullion at
market
$1,052M: Cash & Cash
Equivalents
$211M: Gold Bullion at
market
$350M: Credit Facility
$76M: Marketable
Securities
$500M: Credit Facility
$250M: Niobec Credit
$118M: Marketable
Securities
Exploited solid
balance sheet and
cash flow to
increase overall
liquidity
$0.08 per share dividend $0.25 per share dividend
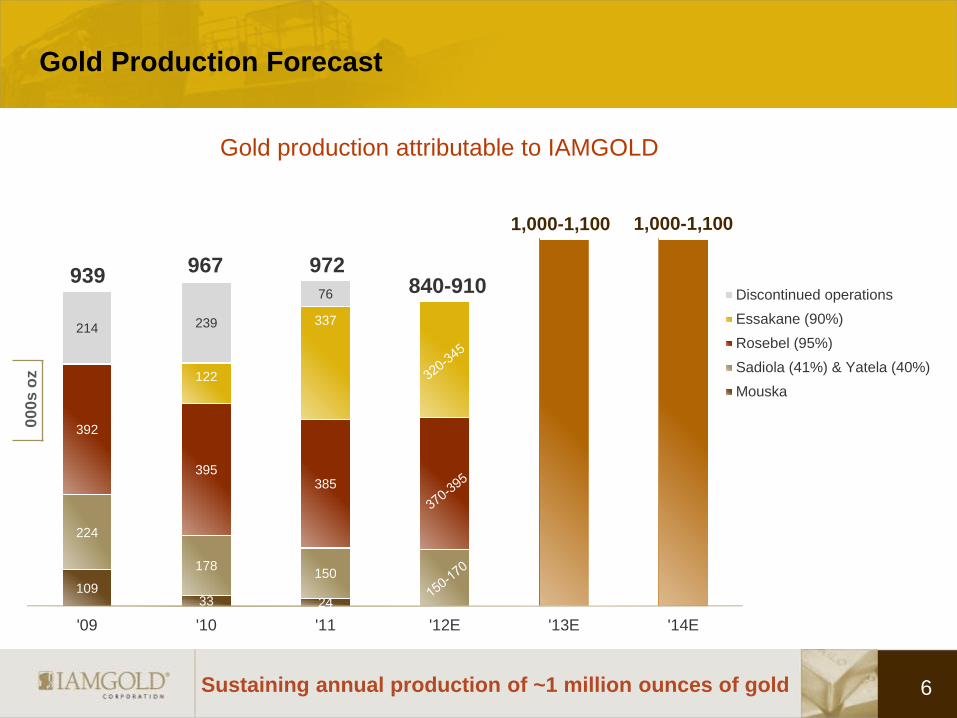
109 33 24
224
178 150
392
395 385
122
337 214 239
76
'09 '10 '11 '12E '13E '14E
Discontinued operations
Essakane (90%)
Rosebel (95%)
Sadiola (41%) & Yatela (40%)
Mouska
Gold Production Forecast
6
00
0s
oz
Sustaining annual production of ~1 million ounces of gold
939 967 972
840-910
1,000-1,100
Gold production attributable to IAMGOLD
1,000-1,100

$ M
illi
on
s
10 10
70
160
70
220 50
30
160
140
250
330
220
60
2012 2013 2014
Essakane
Rosebel
Westwood
Sadiola
Other
Planned Capital Expenditures for Gold Operations
7 Significant investment in brownfield growth
2012 Capital Expenditure
790
580
410
$millions Capitalized Stripping
2012 2013 2014 Total 3
years
Essakane 50 40 40 130
Rosebel - 20 50 70
Sadiola 15 50 50 115
Total 65 110 140 315 Capital expenditure include sustaining capital,
maintenance capital and capitalized stripping.
Essakane › Additional water storage pond and river diversion
› Additional power generation for hard ore
Rosebel › Crushing & grinding circuit expansion, resource
development
› $24M sustaining capital
› Includes $34 million of carry-over from 2011
Sadiola › Assumes positive production decision for Sadiola
Sulphides project
› $10M sustaining capital
Westwood › Deepening shaft, developing drift levels for future mining
and building up ore stockpile in 2012, and mill
refurbishment
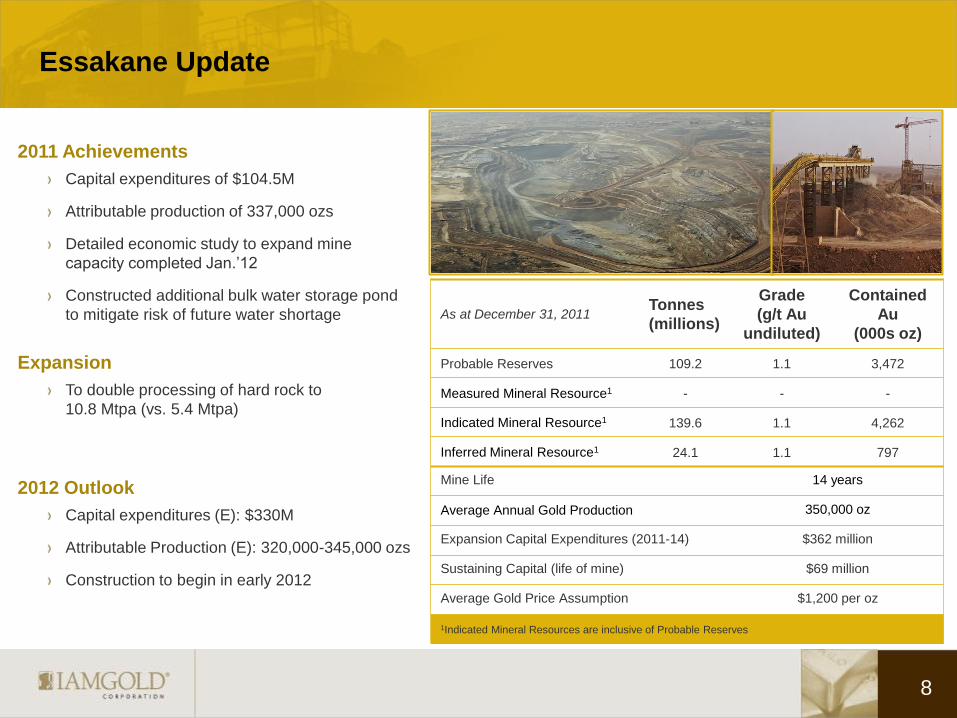
Essakane Update
8
As at December 31, 2011 Tonnes
(millions)
Grade
(g/t Au
undiluted)
Contained
Au
(000s oz)
Probable Reserves 109.2 1.1 3,472
Measured Mineral Resource1 - - -
Indicated Mineral Resource1 139.6 1.1 4,262
Inferred Mineral Resource1 24.1 1.1 797
Mine Life 14 years
Average Annual Gold Production 350,000 oz
Expansion Capital Expenditures (2011-14) $362 million
Sustaining Capital (life of mine) $69 million
Average Gold Price Assumption $1,200 per oz
1Indicated Mineral Resources are inclusive of Probable Reserves
2011 Achievements
Capital expenditures of $104.5M
Attributable production of 337,000 ozs
Detailed economic study to expand mine
capacity completed Jan.’12
Constructed additional bulk water storage pond
to mitigate risk of future water shortage
Expansion
To double processing of hard rock to
10.8 Mtpa (vs. 5.4 Mtpa)
2012 Outlook
Capital expenditures (E): $330M
Attributable Production (E): 320,000-345,000 ozs
Construction to begin in early 2012

Essakane Exploration
9
210,000+ m of RC and DD drilling
planned in 2012 Focus of the drilling program will be split
between:
a resource definition program at
Falagountou
An in-fill program at Essakane north
Rosebel Update
10
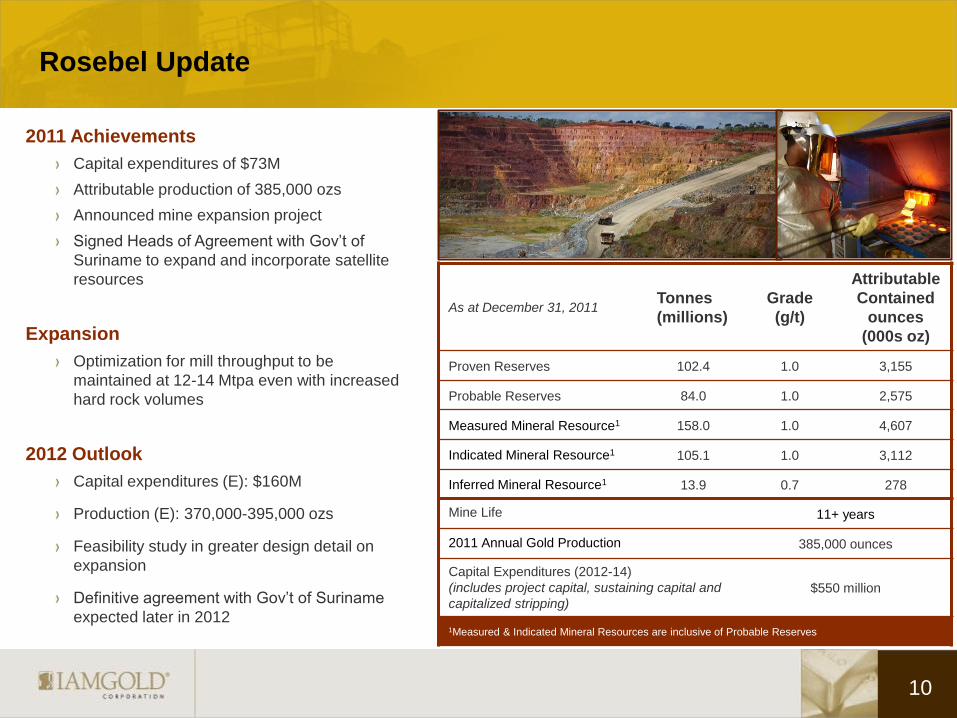
2011 Achievements
Capital expenditures of $73M
Attributable production of 385,000 ozs
Announced mine expansion project
Signed Heads of Agreement with Gov’t of
Suriname to expand and incorporate satellite
resources
Expansion
Optimization for mill throughput to be
maintained at 12-14 Mtpa even with increased
hard rock volumes
2012 Outlook
Capital expenditures (E): $160M
Production (E): 370,000-395,000 ozs
Feasibility study in greater design detail on
expansion
Definitive agreement with Gov’t of Suriname
expected later in 2012
As at December 31, 2011 Tonnes
(millions)
Grade
(g/t)
Attributable
Contained
ounces
(000s oz)
Proven Reserves 102.4 1.0 3,155
Probable Reserves 84.0 1.0 2,575
Measured Mineral Resource1 158.0 1.0 4,607
Indicated Mineral Resource1 105.1 1.0 3,112
Inferred Mineral Resource1 13.9 0.7 278
Mine Life 11+ years
2011 Annual Gold Production 385,000 ounces
Capital Expenditures (2012-14)
(includes project capital, sustaining capital and
capitalized stripping)
$550 million
1Measured & Indicated Mineral Resources are inclusive of Probable Reserves

Future Expansion Potential at Rosebel is Significant
11
ROSEBEL Suriname
Announced Heads of Agreement
with Government of Suriname on
Dec. 21’11 to support significant
expansion at Rosebel
Agreement in principle with Surinamese Government
Rosebel resources
Areas being considered
for next expansion:
Charmagne
West Charmagne
Headley’s Reef
Sadiola/Yatela Update
12
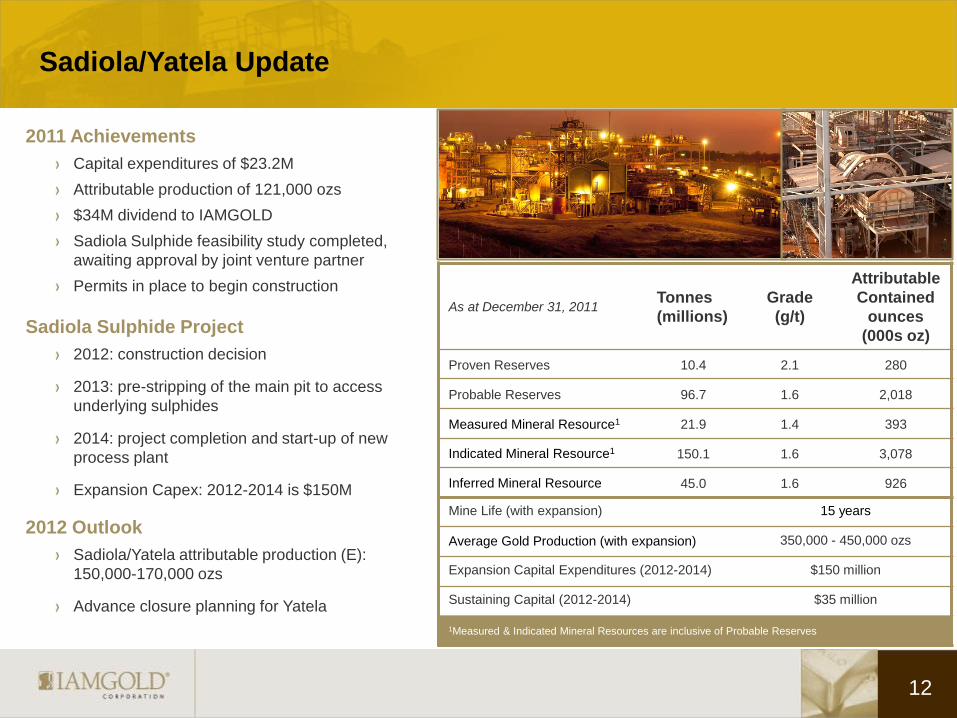
2011 Achievements
Capital expenditures of $23.2M
Attributable production of 121,000 ozs
$34M dividend to IAMGOLD
Sadiola Sulphide feasibility study completed,
awaiting approval by joint venture partner
Permits in place to begin construction
Sadiola Sulphide Project
2012: construction decision
2013: pre-stripping of the main pit to access
underlying sulphides
2014: project completion and start-up of new
process plant
Expansion Capex: 2012-2014 is $150M
2012 Outlook
Sadiola/Yatela attributable production (E):
150,000-170,000 ozs
Advance closure planning for Yatela
As at December 31, 2011 Tonnes
(millions)
Grade
(g/t)
Attributable
Contained
ounces
(000s oz)
Proven Reserves 10.4 2.1 280
Probable Reserves 96.7 1.6 2,018
Measured Mineral Resource1 21.9 1.4 393
Indicated Mineral Resource1 150.1 1.6 3,078
Inferred Mineral Resource 45.0 1.6 926
Mine Life (with expansion) 15 years
Average Gold Production (with expansion) 350,000 - 450,000 ozs
Expansion Capital Expenditures (2012-2014) $150 million
Sustaining Capital (2012-2014) $35 million
1Measured & Indicated Mineral Resources are inclusive of Probable Reserves

Westwood Update
13
2011 Achievements
Project and exploration expenditures of $134M
Completion of: fire detection system, new pump
house, waste silo
Commencement of ground support in the 6 m
diameter ventilation shaft
Shaft sinking reached 1,455 m
Underground development totaled 9,315 m of
lateral and vertical
2011 Exploration
75,000 m+ diamond drilling at cost of $9.6M
Additional confidence in inferred resources and
remaining exploration potential
2012 Outlook
Project cost (E): $198.3M (after tax credits)
Infrastructure preparation and construction
Shaft sinking to depth of 1,954 m
Mining method changed from planned long-hole
open stoping to primarily cut and fill mining to
lower production and technical risk
On-track for early 2013 start-up
Classification Tonnes
(millions)
Grade
(g/t Au
undiluted)
Contained
Au
(000s oz)
Indicated Mineral Resource1
(Warrenmac) 0.2 8.6 60
Indicated Mineral Resource1 (Zone 2 Westwood)
0.6 13.8 248
Inferred Mineral Resource 9.4 11.3 3,407
Total Recovered Gold 3,480,070 oz
Mine Life 19 years
Average Annual Gold Production 190,000 oz
Average Cash Cost $533 per oz
Total Pre-production Capital2 $518 million
Sustaining Capital (life of mine) $529 million
Operating Cash flow (after-tax) $1,717 million
Estimated IRR (after-tax) 9-11%
Canadian/US Exchange Rate (2012 - 1.00) 1.05
Average Gold Price Assumption $1,249 per oz
(1) Mineral resources as of May 2011 are calculated at an undiluted 6 g/t Au cutoff grade at a minimum
two metre width; panel grades of individual lenses are capped at 15 g/t
(2) Includes remaining capital of $198 million (after tax credits) for 2012.
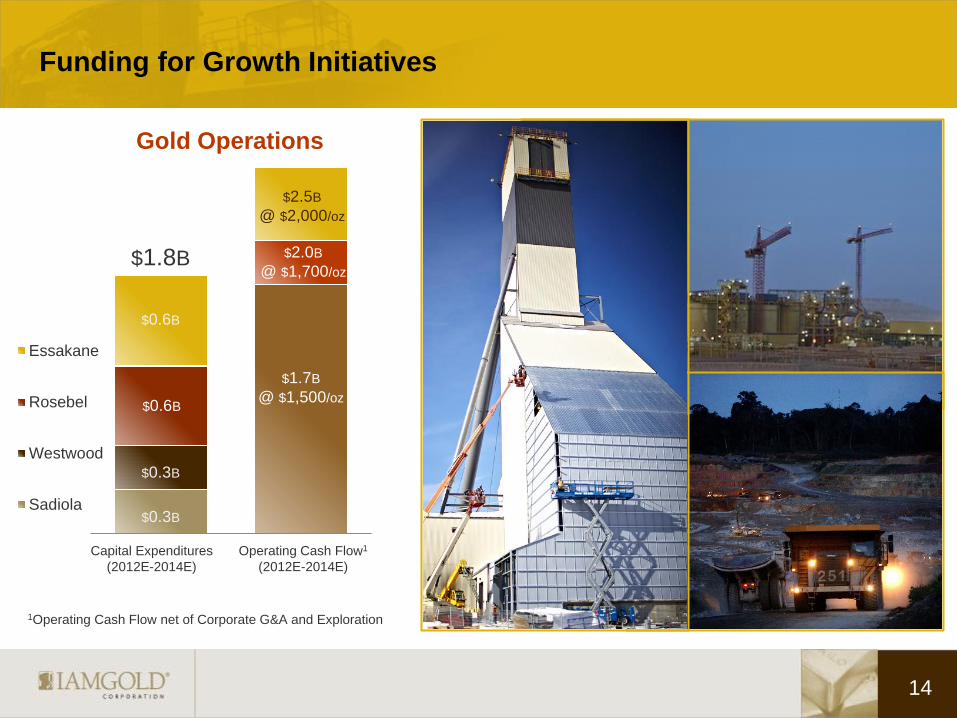
Essakane
Rosebel
Westwood
Sadiola
Funding for Growth Initiatives
Gold Operations
1Operating Cash Flow net of Corporate G&A and Exploration
$42M Capital Expenditures
(2012E-2014E)
Operating Cash Flow1
(2012E-2014E)
$2.5B
@ $2,000/oz
$2.0B
@ $1,700/oz
$1.7B
@ $1,500/oz
$0.3B
$0.3B
$0.6B
$0.6B
$1.8B
14
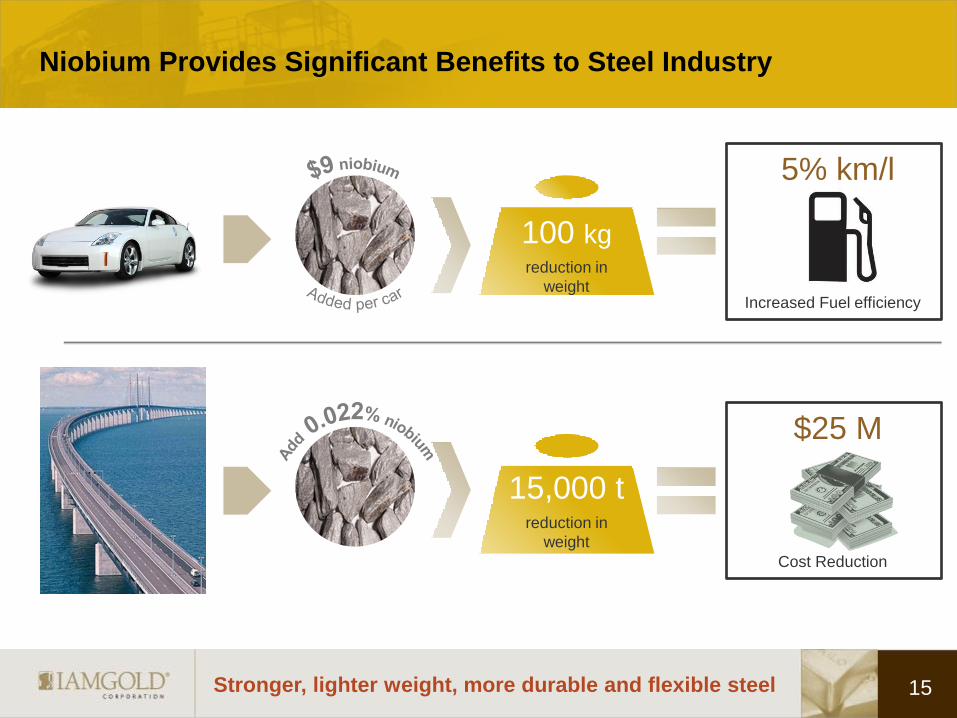
Niobium Provides Significant Benefits to Steel Industry
15 Stronger, lighter weight, more durable and flexible steel
Increased Fuel efficiency
5% km/l
Cost Reduction
$25 M
100 kg reduction in
weight
15,000 t reduction in
weight

Niobec Update
16
2011 Achievements
Capital expenditures of $61.3M
Positive results from pre-feasibility study on
expansion project
Established a financing framework to fund
expansion ($250M line of credit established
February 2012)
Block cave expansion
Triple niobium production, Improve margins
Feasibility study expected to be completed
mid 2013
Capex
2013: $90M
2014: $220M
2015: $291M
2016: $375M
$976M
2012 Outlook
Proceeding with Feasibility Study based on
Block Caving
Key Metrics of the Niobec Expansion Pre-Feasibility Study under the Block Cave Scenario
Classification Tonnes
(millions)
Grade
(%Nb2O5)
Contained Nb2O5
(million kgs)
Probable Reserves 419.2 0.42% 1,746
Measured Mineral Resource1 235.3 0.44% 1,028
Indicated Mineral Resource1 250.2 0.39% 986
Inferred Mineral Resource 155.4 0.35% 547
NAV (After-tax) $1.6-$1.8 billion
Total Recovered Niobium 576 million kg Nb
Mine Life (does not include all resources) 46 years
Average Annual Niobium Production
(post expansion) 13.5 million kg Nb
Mining Cost $17 per kg Nb
Operating Margin $28 per kg Nb
Pre-production Capital Expenditures $976 million
Growth and Sustaining Capital over 46 years $965 million
Operating Cash flow (pre-tax) $15.2 billion
Estimated IRR (after-tax) 17-19%
Canadian/US Exchange Rate (2012 – 1.00) 1.05
Niobium Price Assumption $45 per kg Nb
1) Measured and indicated resources are 98% inclusive of probable reserves. Under the block caving
scenario around 2% of the measured and indicated resources included in the probable reserves are
slightly below the cutoff of 0.20% Nb2O5 per tonne (before recovery) used for resource reporting. This
material represents only 5.8 million tonnes averaging 0.18% Nb2O5 for 10 million kilograms of Nb2O5
contained.
Net Asset Value (after tax) $1.6 - $1.8 Billion

Funding for Niobec Expansion
$976M
Capital Expenditures
(2013E-2016E) Funding
Sources
Cash Flow (2013E-2016E)
Credit Facility
Strategic Sale
Niobium Operation
IPO
17 Expansion Fully Self Funded

Rare earth element (REE) zone
18
Rare Earth Inferred Resource: 467 Million Tonnes
Niobec mine
Shaft
Scoping study will define significance to REE market
Grade 1.65% Total Rare Earth
Oxides (TREO)
7.7 Bkg TREO
98% Light REEs, including › Cerium (47.9%)
› Lanthanum (24.5%)
› Neodymium (18.4%)
2% Heavy REEs
Potential development would
be self-funded

Speed to Market Advantage
19
Source on Power: Technical Report on Expansion Options at the
Niobec Mine, June 17, 2011, compiled by Roscoe Postle
Associates Inc.
Adjacent to Niobec
Mining friendly jurisdiction
Excellent community relations
Very competitive hydro power
rates (~$0.045 per kWh)
Existing road and rail
infrastructure
Close proximity to deep water
ports with ocean access
Close proximity to excellent infrastructure
N
Port
NIOBEC
Rare Earth Element Zone
10km
QUEBEC
Rail Line
St-Honoré
Saguenay
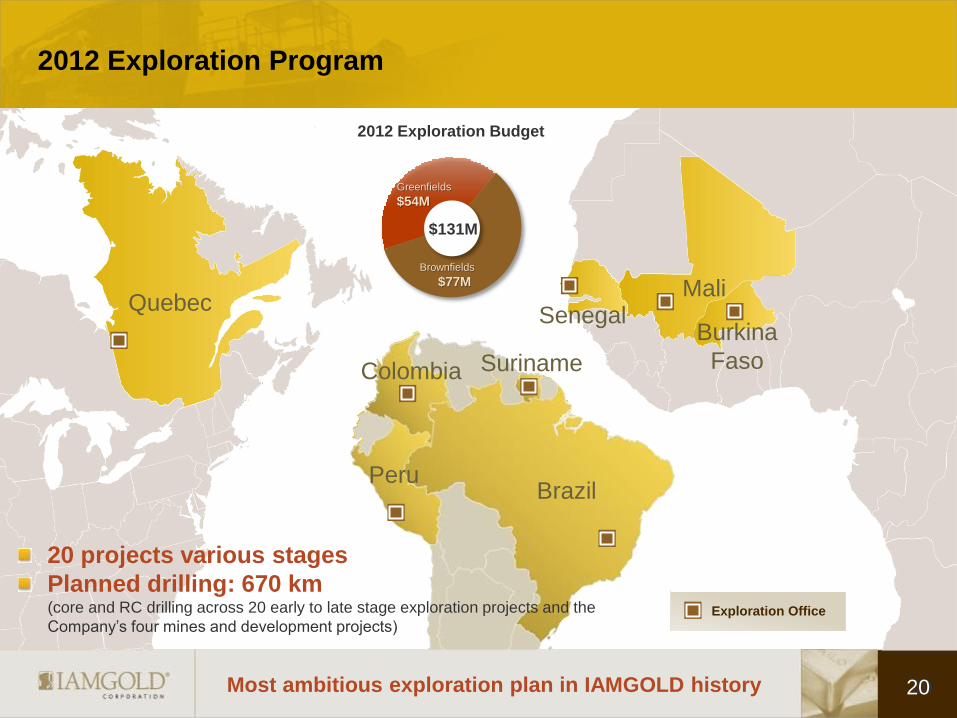
2012 Exploration Program
2012 Exploration Budget
Brownfields
$77M
Greenfields
$54M
Quebec Mali
Burkina
Faso
Senegal
$131M
Exploration Office
Brazil
Colombia
Peru
Suriname
20
20 projects various stages
Planned drilling: 670 km (core and RC drilling across 20 early to late stage exploration projects and the
Company’s four mines and development projects)
Most ambitious exploration plan in IAMGOLD history
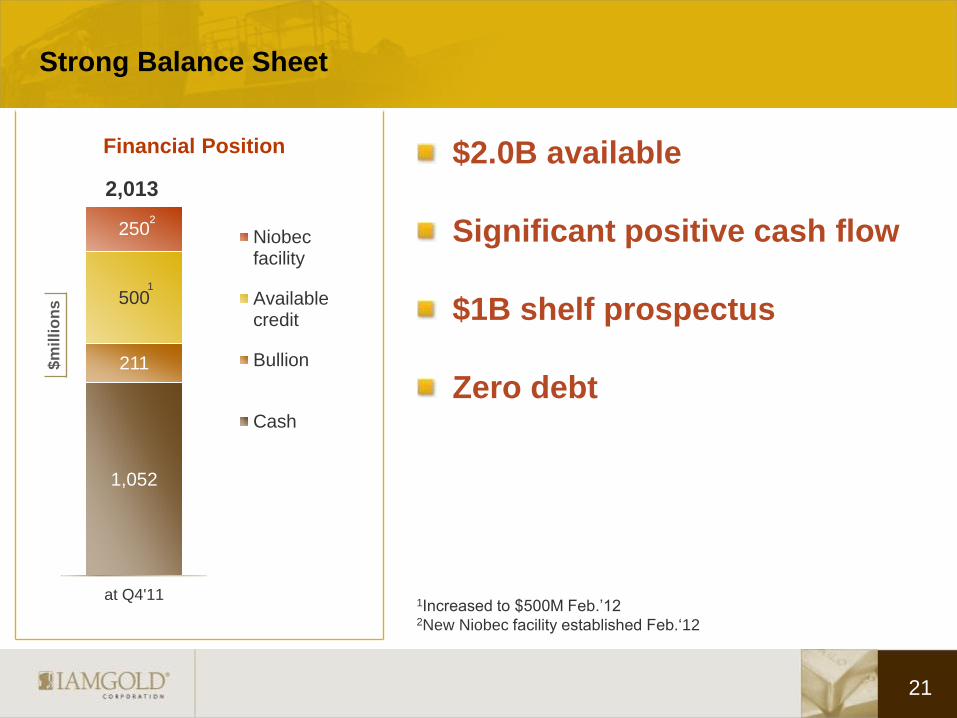
Strong Balance Sheet
21
$m
illi
on
s
1Increased to $500M Feb.’12 2New Niobec facility established Feb.‘12
1,052
211
500
250
at Q4'11
Niobecfacility
Availablecredit
Bullion
Cash
Financial Position
1
2
2,013
2
$2.0B available
Significant positive cash flow
$1B shelf prospectus
Zero debt
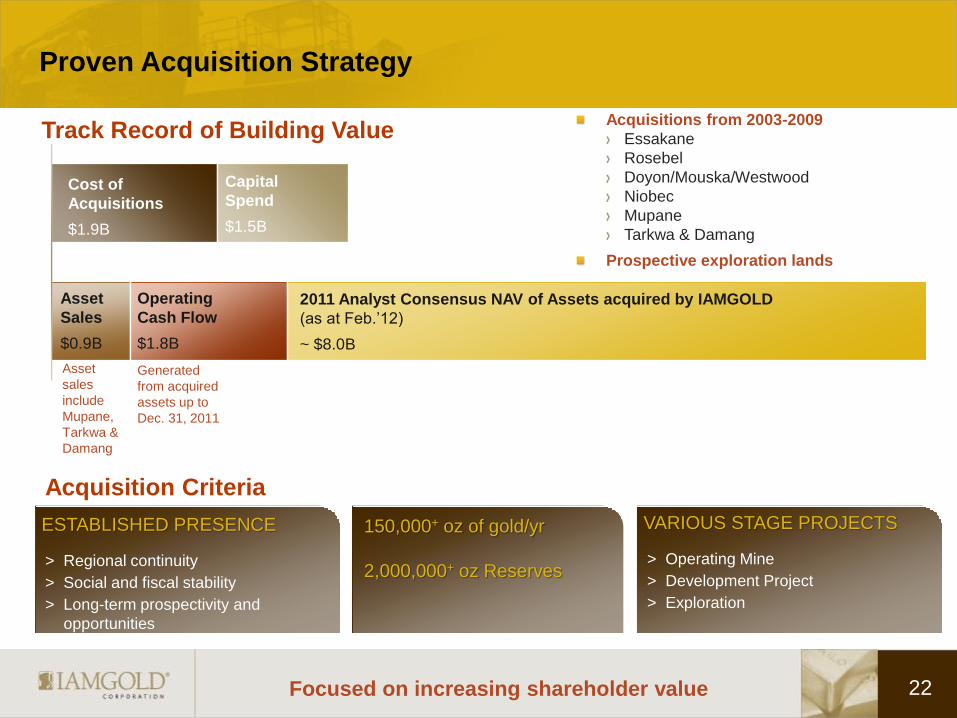
Proven Acquisition Strategy
Acquisitions from 2003-2009
Essakane
Rosebel
Doyon/Mouska/Westwood
Niobec
Mupane
Tarkwa & Damang
Prospective exploration lands
22 Focused on increasing shareholder value
Cost of
Acquisitions
$1.9B
Capital
Spend
$1.5B
2011 Analyst Consensus NAV of Assets acquired by IAMGOLD
(as at Feb.’12)
~ $8.0B
Operating
Cash Flow
$1.8B
Asset
Sales
$0.9B
Asset
sales
include
Mupane,
Tarkwa &
Damang
Generated
from acquired
assets up to
Dec. 31, 2011
Track Record of Building Value
ESTABLISHED PRESENCE
> Regional continuity
> Social and fiscal stability
> Long-term prospectivity and
opportunities
150,000+ oz of gold/yr
2,000,000+ oz Reserves
VARIOUS STAGE PROJECTS
> Operating Mine
> Development Project
> Exploration
Acquisition Criteria

Dividends have increased 317% since December 2010
23 Growing dividends while investing in growth
$0.06 $0.08
$0.20
$0.25
$-
$0.05
$0.10
$0.15
$0.20
$0.25
$0.30
Previous Jan 14 2011 Jul 20 2011 Jan 5 2012
Dividends paid per Share
First Date Payable
$ U
S

Conduct Governed by Zero Harm Framework
24 Highest standards of corporate social responsibility
Highest
standards in
Health and
Safety
Partnering with
Host
communities
Minimizing
Environmental
Footprint
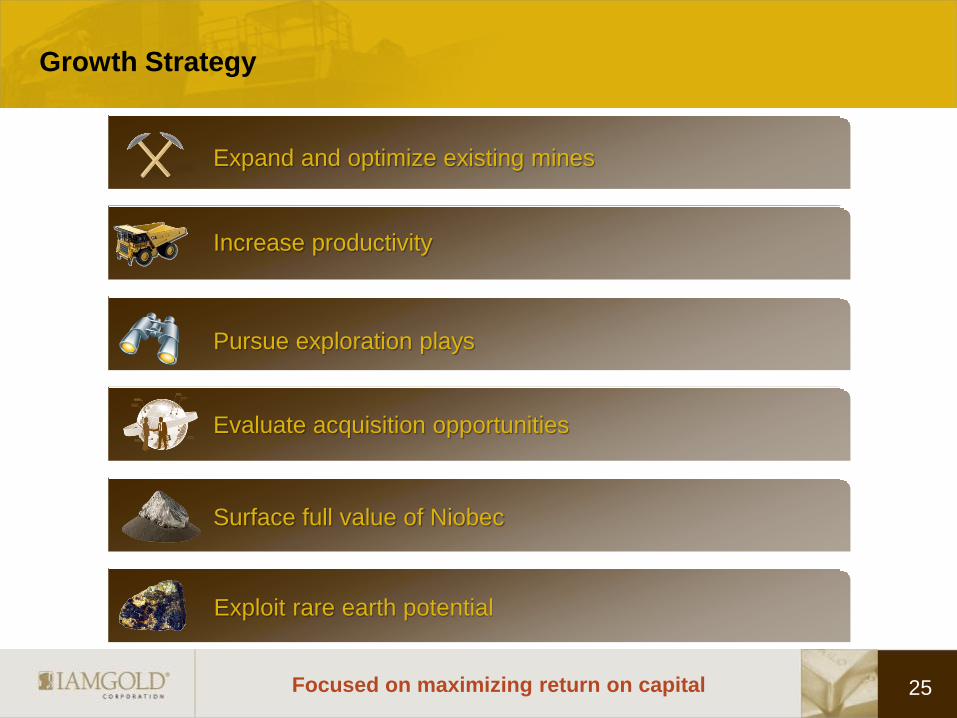
Growth Strategy
25
Increase productivity
Expand and optimize existing mines
Evaluate acquisition opportunities
Pursue exploration plays
Surface full value of Niobec
Exploit rare earth potential
Focused on maximizing return on capital
TSX: IMG NYSE: IAG TSX: IMG NYSE: IAG
Appendix

27
Rare Earths are Integral to a Wide Range of Fast Growing Markets
Magnets
25%
Fluid
Cracking Catalysts
15%
Battery Alloy
14%
Polishing Powder
14%
Metallurgy, excl. batteries 9%
Auto
Catalysts 7%
Glass Additives
6%
Phosphorous 6% Other
4%
REO Usage by Industry
(2010E)
Demand for REEs Growing at 9-15% a year

28
2012 Greenfield Exploration: West Africa
Siribaya JV (50% IAMGOLD) 60,000 m diamond and RC drill program
Finalize first phase exploration of two
regional mineralized corridors (Siribaya and
Bambadinka trends)
Kalana JV 60,000 m diamond and RC drilling planned
Complete initial resource estimate by Q3 2012
Assess resource potential of satellite targets
Essakane
Kalana JV
Burkina Faso Boto
Siribaya JV
MINE
Advanced Exploration
Exploration Office
SADIOLA YATELA
Senegal
Essakane Continued evaluation of near-mine
satellite prospects
Oxide targets prioritized
92,000 m diamond and RC drill program
35,000 m air-core drill program
Mali
Boto 7,000 m diamond drill program to confirm grade
continuity and extend known mineralization zones

Kalana Project, Mali: 2012 Exploration Program
29
Kalana
GUINEA
MALI
Kalana Mining Permit (387 km2) + Kalako West (21 km²)
Avnel - IMG Option Agreement (Aug 2009)
$11.2 M exploration budget
20,000 m DD and 40,000 m RC drilling planned
Complete initial resource estimate by Q3 2012
Assess resource potential of Djirila and Ténintoumanina
satellite targets
Fougadian Exploration Permits (147.5 km2)
Avnel - IMG Option Agreement (Dec 2010)
$6.6 M exploration budget
10,000 m DD and 30,000 m RC drilling planned to
evaluate Maramale and Korianko targets
Kalako
West
Fougadian
Fougadian
South
Kalana Mine
Kalanako
Djirila
Maramale
Solomanina
Ténintoumanina
Korianko
Gridded Au results from termite mound sampling surveys

Total : 20,145 termite mounds sampled
Neoproterozoic rocks
Au ppb
Siribaya Project, Mali: 2012 Exploration Program
30
Land Package 848 km2
Siribaya Maiden Resource > Indicated: 308 Koz @ 2.39 g/t Au
> Inferred: 70 Koz @ 2.29 g/t Au
Zone 1A
Zone 1B
Merrex - IAMGOLD Option
Agreement
IAMGOLD has earned 50%
interest by spending
C$10.5M over 3 years
2012 Exploration
$5.9 M budget (matched by
Merrex)
10,000 m DD and 50,000 m
RC drilling planned
Complete scoping of Siribaya
and Bambadinka trends on
wide-spaced drill fences
Infill encouraging 2011 drill
results to confirm continuity
of mineralization (Siribaya
trend)
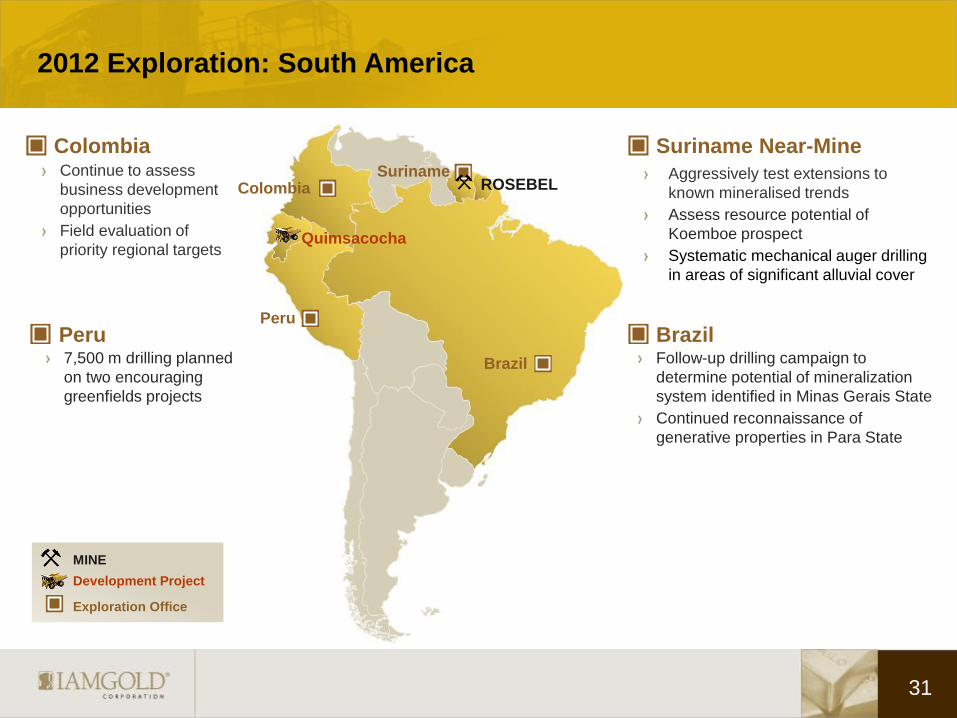
2012 Exploration: South America
MINE
Development Project
Exploration Office
Suriname ROSEBEL
Brazil
Peru
Colombia
Quimsacocha
Colombia
Peru 7,500 m drilling planned
on two encouraging
greenfields projects
Brazil Follow-up drilling campaign to
determine potential of mineralization
system identified in Minas Gerais State
Continued reconnaissance of
generative properties in Para State
Aggressively test extensions to
known mineralised trends
Assess resource potential of
Koemboe prospect
Systematic mechanical auger drilling
in areas of significant alluvial cover
31
Continue to assess
business development
opportunities
Field evaluation of
priority regional targets
Suriname Near-Mine
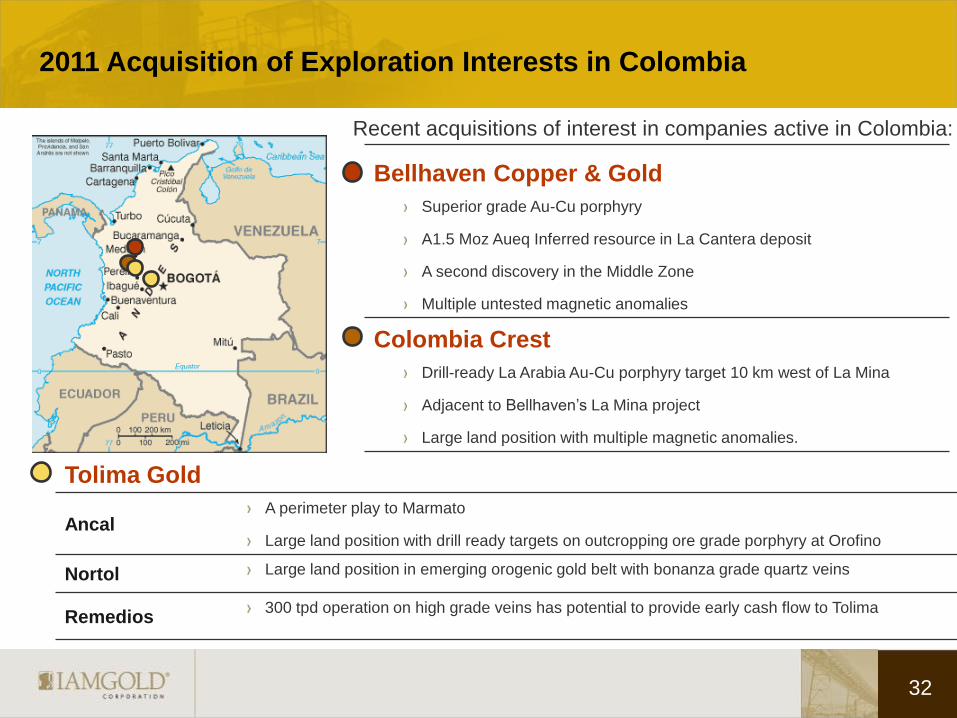
Tolima Gold
Ancal A perimeter play to Marmato
Large land position with drill ready targets on outcropping ore grade porphyry at Orofino
Nortol Large land position in emerging orogenic gold belt with bonanza grade quartz veins
Remedios 300 tpd operation on high grade veins has potential to provide early cash flow to Tolima
2011 Acquisition of Exploration Interests in Colombia
32
Bellhaven Copper & Gold
Superior grade Au-Cu porphyry
A1.5 Moz Aueq Inferred resource in La Cantera deposit
A second discovery in the Middle Zone
Multiple untested magnetic anomalies
Colombia Crest
Drill-ready La Arabia Au-Cu porphyry target 10 km west of La Mina
Adjacent to Bellhaven’s La Mina project
Large land position with multiple magnetic anomalies.
Recent acquisitions of interest in companies active in Colombia:
33
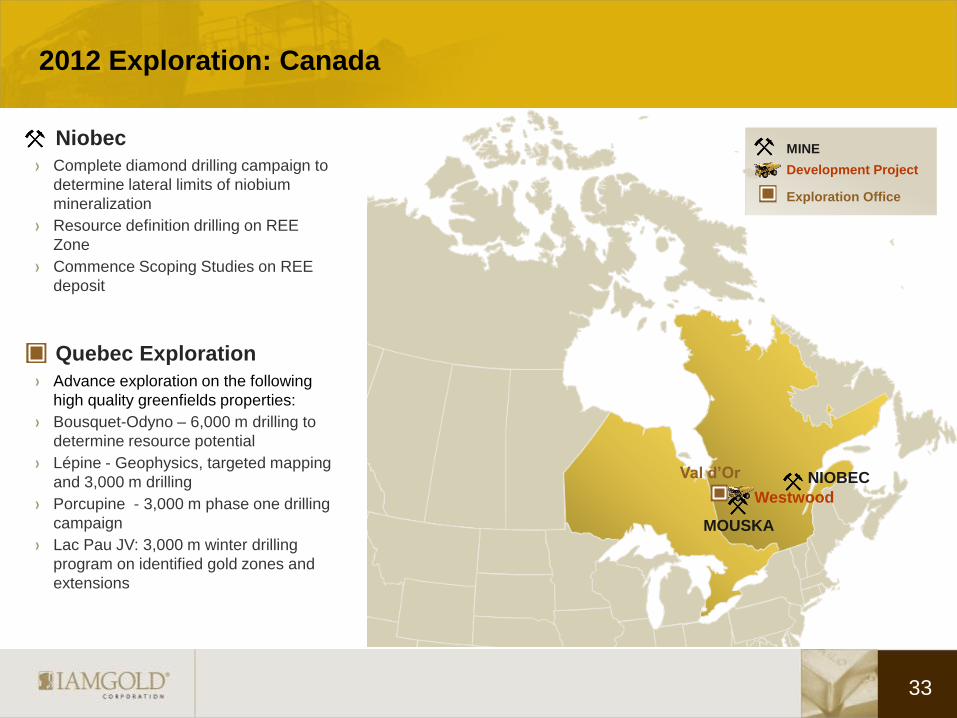
2012 Exploration: Canada
MINE
Development Project
Exploration Office
Westwood
MOUSKA
Val d’Or NIOBEC
Niobec
Complete diamond drilling campaign to
determine lateral limits of niobium
mineralization
Resource definition drilling on REE
Zone
Commence Scoping Studies on REE
deposit
Quebec Exploration
Advance exploration on the following
high quality greenfields properties:
Bousquet-Odyno – 6,000 m drilling to
determine resource potential
Lépine - Geophysics, targeted mapping
and 3,000 m drilling
Porcupine - 3,000 m phase one drilling
campaign
Lac Pau JV: 3,000 m winter drilling
program on identified gold zones and
extensions
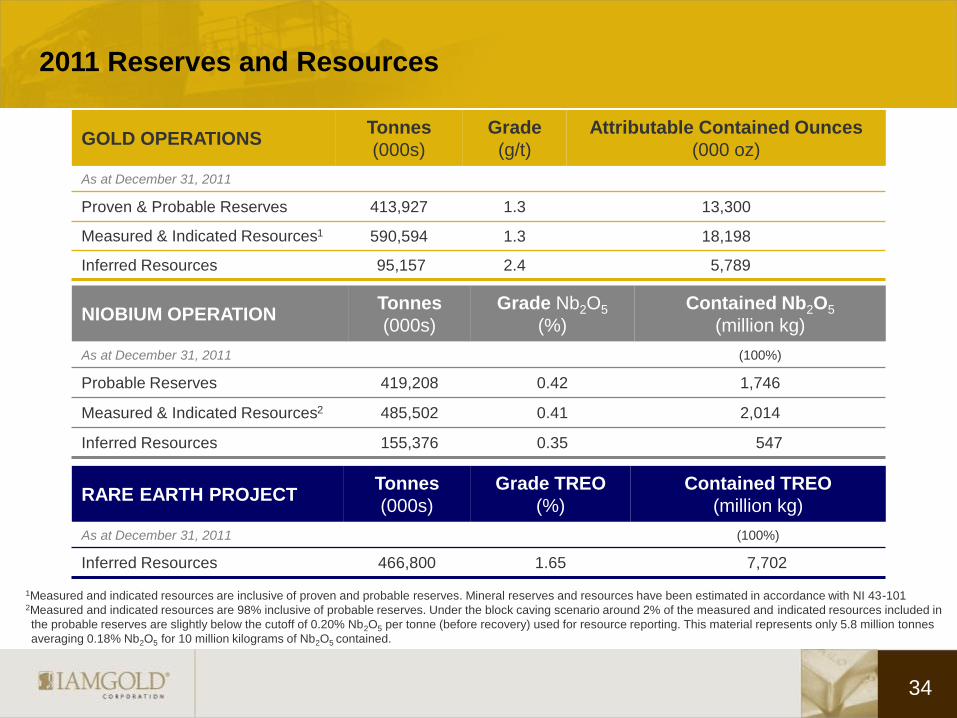
2011 Reserves and Resources
34
GOLD OPERATIONS Tonnes
(000s)
Grade
(g/t)
Attributable Contained Ounces
(000 oz)
As at December 31, 2011
Proven & Probable Reserves 413,927 1.3 13,300
Measured & Indicated Resources1 590,594 1.3 18,198
Inferred Resources 95,157 2.4 5,789
NIOBIUM OPERATION Tonnes
(000s)
Grade Nb2O5
(%)
Contained Nb2O5
(million kg)
As at December 31, 2011 (100%)
Probable Reserves 419,208 0.42 1,746
Measured & Indicated Resources2 485,502 0.41 2,014
Inferred Resources 155,376 0.35 547
RARE EARTH PROJECT Tonnes
(000s)
Grade TREO
(%)
Contained TREO
(million kg)
As at December 31, 2011 (100%)
Inferred Resources 466,800 1.65 7,702
1Measured and indicated resources are inclusive of proven and probable reserves. Mineral reserves and resources have been estimated in accordance with NI 43-101 2Measured and indicated resources are 98% inclusive of probable reserves. Under the block caving scenario around 2% of the measured and indicated resources included in
the probable reserves are slightly below the cutoff of 0.20% Nb2O5 per tonne (before recovery) used for resource reporting. This material represents only 5.8 million tonnes
averaging 0.18% Nb2O5 for 10 million kilograms of Nb2O5 contained.

Notes regarding reserves and resources
35
Cautionary Note to Investors Concerning Estimates of Measured and Indicated Resources
This presentation uses the terms "measured resources" and "indicated resources". We advise investors that while those
terms are recognized and required by Canadian regulations, the SEC does not recognize them. Investors are cautioned
not to assume that any part or all of mineral deposits in these categories will ever be converted into reserves.
Cautionary Note to Investors Concerning Estimates of Inferred Resources
This presentation also uses the term "inferred resources". We advise investors that while this term is recognized and
required by Canadian regulations, the SEC does not recognize it. "Inferred resources" have a great amount of uncertainty
as to their existence, and great uncertainty as to their economic and legal feasibility. It cannot be assumed that all or any
part of an inferred mineral resource will ever be upgraded to a higher category. Under Canadian rules, estimates of
inferred mineral resources may not form the basis of feasibility or pre-feasibility studies, except in rare cases. Investors
are cautioned not to assume that part or all of an inferred resource exists, or is economically or legally mineable.
Scientific and Technical Disclosure
IAMGOLD is reporting mineral resource and reserve estimates in accordance with the CIM guidelines for the estimation,
classification and reporting of resources and reserves.
Investors are cautioned not to assume that part or all of an inferred resource exists, or is economically or legally mineable.
A feasibility study is a comprehensive technical and economic study of the selected development option for a mineral
project that includes appropriately detailed assessments of realistically assumed mining, processing, metallurgical,
economic, marketing, legal, environmental, social and governmental considerations together with any other relevant
operational factors and detailed financial analysis, that are necessary to demonstrate at the time of reporting that
extraction is reasonably justified (economically mineable). The results of the study may reasonably serve as the basis for
a final decision by a proponent or financial institution to proceed with, or finance, the development of the project. The
confidence level of the study will be higher than that of a Pre-Feasibility Study.
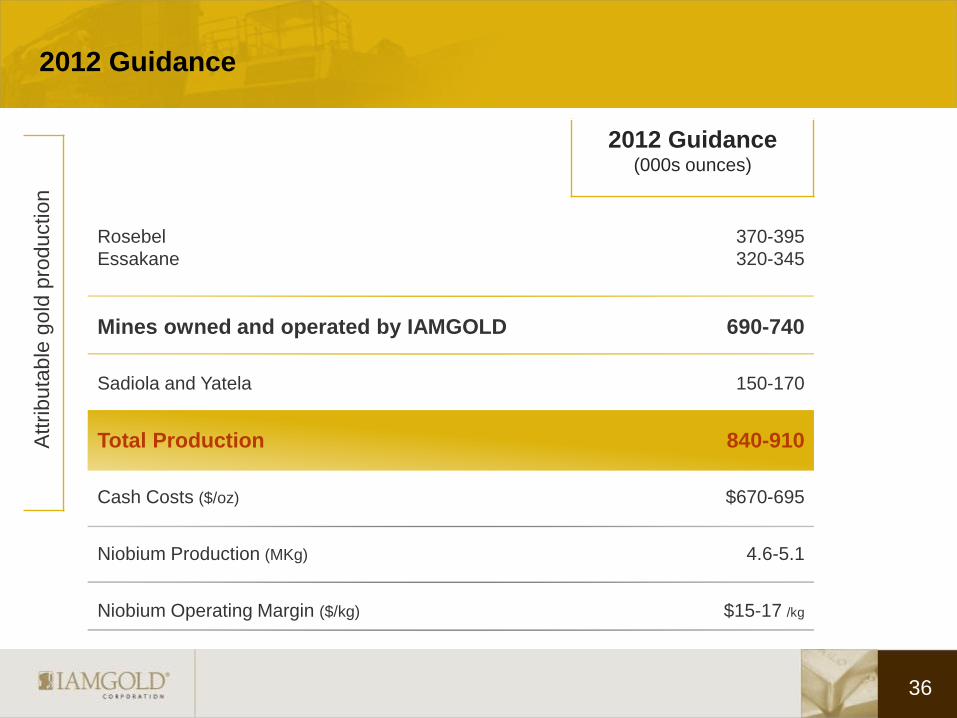
2012 Guidance (000s ounces)
Rosebel
Essakane
370-395
320-345
Mines owned and operated by IAMGOLD 690-740
Sadiola and Yatela 150-170
Total Production 840-910
Cash Costs ($/oz) $670-695
Niobium Production (MKg) 4.6-5.1
Niobium Operating Margin ($/kg) $15-17 /kg
2012 Guidance
36
Attri
buta
ble
gold
pro
duction

Management Team
37
Michael Donnelly Senior Vice President, Exploration
Benjamin Little Senior Vice President, Corporate Affairs
Paul Olmsted Senior Vice President, Corporate Development
Jeffery Snow Senior Vice President & Legal Counsel
Lisa Zangari Senior Vice President, Human Resources
Denis Miville-Deschênes Senior Vice President, Project Development
Steve Letwin President & Chief Executive Officer
Gordon Stothart Executive Vice President &
Chief Operating Officer
Carol Banducci Executive Vice President &
Chief Financial Officer
Bob Carreau Senior Vice President, Health, Safety & Sustainability

TSX: IMG NYSE: IAG TSX: IMG NYSE: IAG
INVESTOR RELATIONS Bob Tait, VP Investor Relations T: 416 360 4743 C: 647 403 5520
Laura Young, Director, Investor Relations T: 416 933 4952 C: 416 670 3815
401 Bay Street, Suite 3200 Toronto, ON M5H 2Y4 Canada 1-888-464-9999 www.iamgold.com
Maximizing Returns for Investors
April 18, 2012


