Download - May 3, 2021 S tock TALES - ICICI Direct
Stock Tales are concise, holistic stock reports across wider spectrum of sectors. Updates will not be periodical but based on significant events or change in price.
Stock_____
TALES
May 3, 2021

ICIC
I S
ecurit
ies –
Retail E
quit
y R
esearch
Stock T
ale
s
May 3, 2021
CMP: | 445 Target: | 600 (35%) Target Period: 15 months
Mold-Tek Packaging Ltd (MOLPAC)
BUY
Packet of good - customer base, growth, financials
Mold-Tek Packaging (MTPL) is one of the leading players in the rigid
packaging category with a market share of ~25%. The company is into
manufacturing decorative packaging containers for paint, lubricant, FMCG &
foods (F&F) industries. MTPL’s focus on upgrading its product portfolio by
adopting newer technologies makes it different from other packaging
players. It was the first company to introduce in-mould label (IML) decorative
products (new label printing technology) in India, which not only helped
MTPL improve its profitability but also stay ahead of its peers in a highly
competitive market. In future, it plans to introduce various new products
such as dispensing pumps and QR coded products. The company is also
looking to increase the share of high margin business i.e. F&F segment by
launching packaging products for ready to eat foods & personal care
products. F&F segment will be key to drive future revenue growth and
EBITDA margin. On the balance sheet front, MTPL’s debt reduction
programme and funding of future expansion through internal accruals will
drive return ratios higher (RoE: 23%, RoCE: 28% in FY23E).
Continuous focus on launching innovative solutions
MTPL was the first to introduce the plastic containers concept for paint
companies and succeeded in replacing tin packaging. Later, it also launched
“pull up spout”, an innovative packaging solution for lubricant companies.
The company’s capability of launching innovative solutions by adopting new
technologies has kept it ahead of the competition. Future launch includes
QR-Coded IML packaging solutions, which is the first of its kind in India. This
is expected to result in strong replacement demand from paints/lubricant
industries, going ahead. These packaging solutions are useful in tracking
products, avoiding duplication and launching trade scheme for brands.
F&F segment key growth driver for MTPL
F&F segment revenue is likely to grow at a robust 25% backed by new
launches and customer additions in the edible oil, sweet boxes, ready to eat
& personal care packaging category. The segment commands EBITDA
margin in the range of 30-35%, much higher than company level margin of
~18%. We believe the revenue contribution will increase from 23% in FY20
to 29% by FY23E. Rising contribution of F&F segment would help drive
consolidated revenue and EBITDA margin for MTPL in FY20-23E.
Valuation & Outlook
We believe MTPL’s capability to adopt new technologies and launch
innovative products will keep the company ahead of competition. Despite
being in the B2B business, gross margin of MTPL has increased in the last
five years depicting its pricing power. Increased contribution from high
margin segments would aid revenue and EBITDA margin expansion. We
build in ~15%, ~28% revenue, PAT CAGR, respectively, in FY20-23E. We
believe continuous growth momentum will help drive high return ratios for
MTPL in FY20-23E. We assign a BUY rating to the stock with a target price
of | 600/share, valuing the company at 21x FY23E earnings.
Key Financial Summary
| Crore FY19 FY20E FY21E FY22E FY23E (CAGR 20-23E)
Net sales 405.7 438.2 458.5 569.0 674.0 15.4
EBITDA 70.3 76.8 91.9 110.3 138.6 21.8
EBITDA Margin(%) 17.3 17.5 20.0 19.4 20.6
Net Profit 31.9 37.5 45.7 57.7 77.6 27.5
EPS (|) 11.5 13.5 16.5 20.8 28.0
P/E(x) 38.6 32.9 27.0 21.4 15.9
RoE (%) 16.7 19.0 19.9 20.9 23.1
RoCE (%) 18.0 18.6 20.7 23.6 27.8
Source: ICICI Direct Research, Company
Stock Data
Particular Amount
Market Cap (| Crore) 1,233.8
Total Debt (FY20) (| Crore) 106.6
Cash & Inv (FY20) (| Crore) 1.1
EV (| Crore) 1,339.3
52 week H/L 460/ 159
Equity capital (| Crore) 13.9
Face value (|) 5.0
Price Performance `f
0
5000
10000
15000
20000
0
100
200
300
400
500
Oct-18
Mar-19
Aug-19
Jan-20
Jun-20
Nov-20
Apr-21
MOLPAC NIFTY
Key Highlights
Strong growth in F&F segment, which
commands higher margin will be key
growth driver in FY20-23
Lean balance sheet, strong return
ratios and quality management
Risk to our call
Delay/less volume offtake amid
pandemic by key clients
Slow/lower pick-up in demand of
new products would restrict EBITDA
margin expansion
Research Analyst
Sanjay Manyal
Hitesh Taunk
ICICI Securities | Retail Research 2
ICICI Direct Research
Stock Tales | Mold-Tek Packaging Ltd
Company Background
Business profile
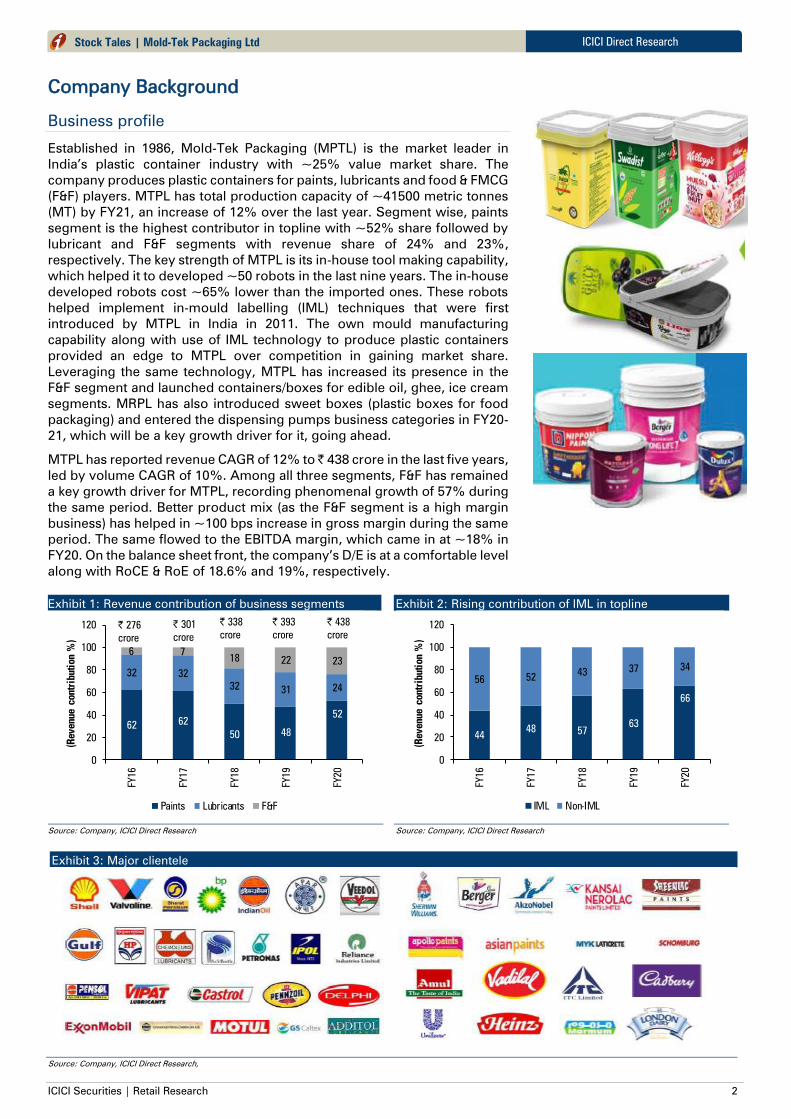
Established in 1986, Mold-Tek Packaging (MPTL) is the market leader in
India’s plastic container industry with ~25% value market share. The
company produces plastic containers for paints, lubricants and food & FMCG
(F&F) players. MTPL has total production capacity of ~41500 metric tonnes
(MT) by FY21, an increase of 12% over the last year. Segment wise, paints
segment is the highest contributor in topline with ~52% share followed by
lubricant and F&F segments with revenue share of 24% and 23%,
respectively. The key strength of MTPL is its in-house tool making capability,
which helped it to developed ~50 robots in the last nine years. The in-house
developed robots cost ~65% lower than the imported ones. These robots
helped implement in-mould labelling (IML) techniques that were first
introduced by MTPL in India in 2011. The own mould manufacturing
capability along with use of IML technology to produce plastic containers
provided an edge to MTPL over competition in gaining market share.
Leveraging the same technology, MTPL has increased its presence in the
F&F segment and launched containers/boxes for edible oil, ghee, ice cream
segments. MRPL has also introduced sweet boxes (plastic boxes for food
packaging) and entered the dispensing pumps business categories in FY20-
21, which will be a key growth driver for it, going ahead.
MTPL has reported revenue CAGR of 12% to | 438 crore in the last five years,
led by volume CAGR of 10%. Among all three segments, F&F has remained
a key growth driver for MTPL, recording phenomenal growth of 57% during
the same period. Better product mix (as the F&F segment is a high margin
business) has helped in ~100 bps increase in gross margin during the same
period. The same flowed to the EBITDA margin, which came in at ~18% in
FY20. On the balance sheet front, the company’s D/E is at a comfortable level
along with RoCE & RoE of 18.6% and 19%, respectively.
Exhibit 1: Revenue contribution of business segments
6262
50 48
52
32 32
3231 24
6 718 22 23
0
20
40
60
80
100
120
FY16
FY17
FY18
FY19
FY20
(R
evenue contribution %
)
Paints Lubricants F&F
| 276
crore
| 301
crore
| 338
crore
| 393
crore
| 438
crore
Source: Company, ICICI Direct Research
Exhibit 2: Rising contribution of IML in topline
4448 57
63
66
56 5243
37 34
0
20
40
60
80
100
120
FY16
FY17
FY18
FY19
FY20
(R
evenue contribution %
)
IML Non-IML
Source: Company, ICICI Direct Research
Exhibit 3: Major clientele
Source: Company, ICICI Direct Research,

ICICI Securities | Retail Research 3
ICICI Direct Research
Stock Tales | Mold-Tek Packaging Ltd
Investment Rationale
Continued focus on innovation
MTPL’s key strength is in its capability to launch innovative products by
adopting latest technologies. In the early nineties, the company introduced
plastic pail packaging concept for the paint industry, which has succeeded
in gradually replacing the tin packaging for paints. Subsequently, MTPL
introduced plastic containers for lubricant packaging with innovative “pull
up spout” and single & double lock pails. Later, in 2011, the company
introduced in-mould labelling (IML) technology for the first time in India,
which is a much better solution than the heat transfer label and screen
printing. IML provides various benefits of packaging including higher brand
recall (as labels do not get separated), provide better aesthetics and the
process eliminates human intervention and saves space required for
production. The company has 50 robots, which were developed in house.
The F&F segment is 100% IML based packaging. The launch in the F&F
segment includes, hinge pack, sweet pack, square packs, adhesive packs.
These products were launched in FY20 and are slowly gaining momentum.
MTPL further plans to launch QR coded IML packaging solutions. QR coded
packaging solutions will help companies track their products and also
safeguard against duplication. The brands can also initiate various trade
schemes through QR-coded packaging solutions. According to the
company, this will be a game changer for MTPL in the long term.
The IML products command higher margin than the non IML products. The
EBITDA margin difference between IML and non IML is about 800-1000 bps.
Hence, rising contribution of IML in the topline helps drive gross margins of
the company.
Exhibit 4: Increasing gross margin along with rising sales of IML based products
80
116
147
203
262
290
10
15
20
25
30
35
40
45
50
0
50
100
150
200
250
300
350
FY15
FY16
FY17
FY18
FY19
FY20
(%
)
| crore
IML Revenue Overall Gross Margin
Source: Company, ICICI Direct Research
Strong backward integration capabilities of MTPL
MTPL is one of the leading players in the rigid packaging industry to have
in-house tool facilities. The centralised in house tool room facility of MTPL
(in Hyderabad) helps the company to design, develop, manufacture and
maintain the moulds and Robots. While other players depend on imports for
mould, MTPL’s strong backward integration of designing/developing own
mould helps in reducing lead time in launching new products. Hence, the
company stays ahead of competition. MTPL has developed ~50 robots in
house, at half the cost of imported ones.
ICICI Securities | Retail Research 4
ICICI Direct Research
Stock Tales | Mold-Tek Packaging Ltd
Exhibit 5: In-house development of moulds, robots - Strong competitive edge of MTPL
Source: company, ICICI Direct Research
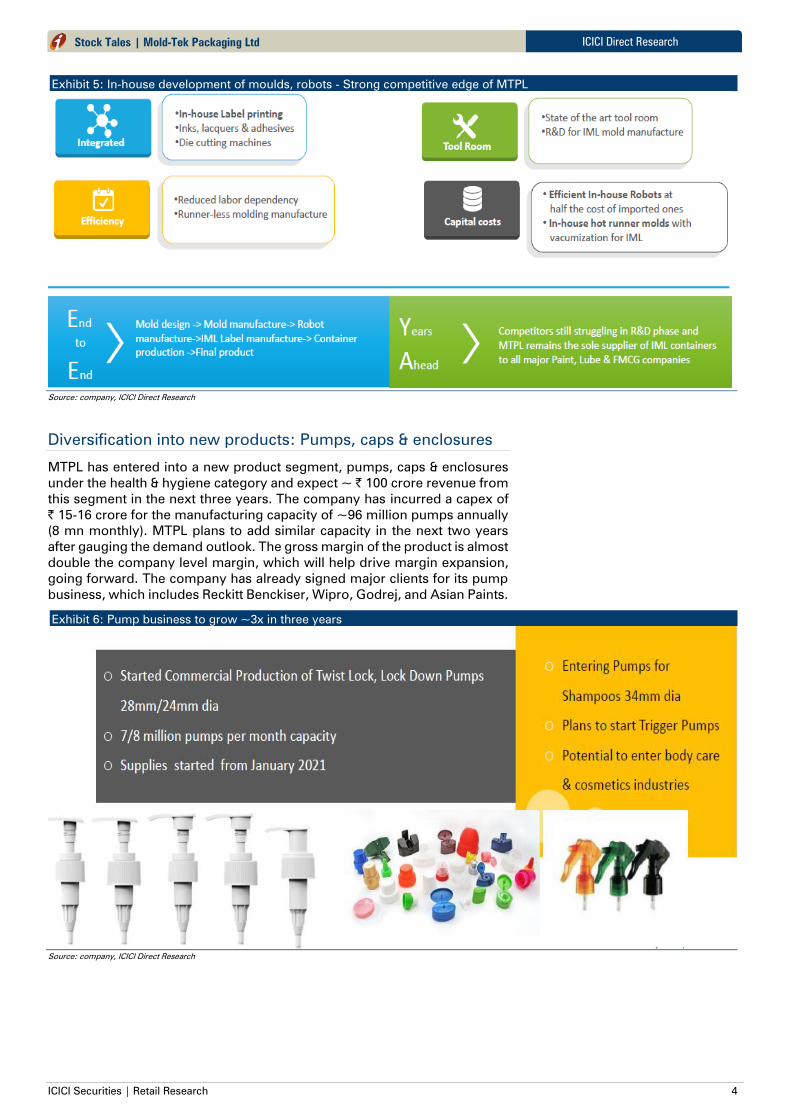
Diversification into new products: Pumps, caps & enclosures
MTPL has entered into a new product segment, pumps, caps & enclosures
under the health & hygiene category and expect ~ | 100 crore revenue from
this segment in the next three years. The company has incurred a capex of
| 15-16 crore for the manufacturing capacity of ~96 million pumps annually
(8 mn monthly). MTPL plans to add similar capacity in the next two years
after gauging the demand outlook. The gross margin of the product is almost
double the company level margin, which will help drive margin expansion,
going forward. The company has already signed major clients for its pump
business, which includes Reckitt Benckiser, Wipro, Godrej, and Asian Paints.
Exhibit 6: Pump business to grow ~3x in three years
Source: company, ICICI Direct Research
ICICI Securities | Retail Research 5
ICICI Direct Research
Stock Tales | Mold-Tek Packaging Ltd
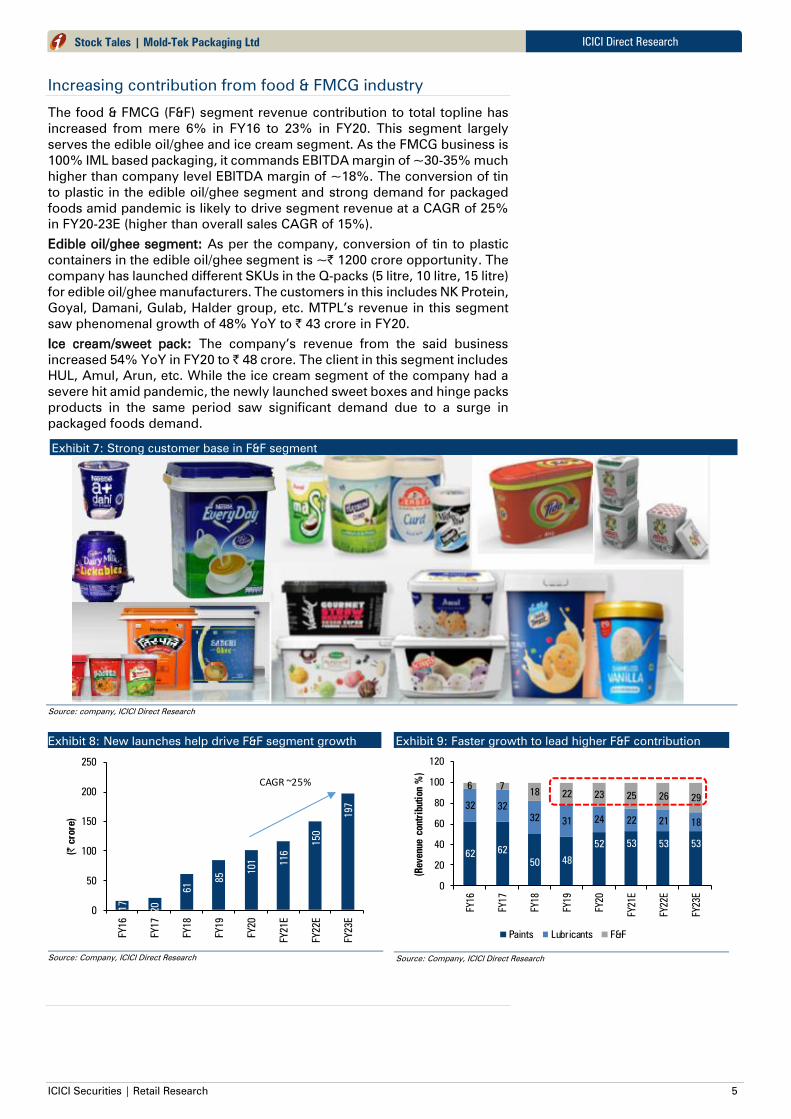
Increasing contribution from food & FMCG industry
The food & FMCG (F&F) segment revenue contribution to total topline has
increased from mere 6% in FY16 to 23% in FY20. This segment largely
serves the edible oil/ghee and ice cream segment. As the FMCG business is
100% IML based packaging, it commands EBITDA margin of ~30-35% much
higher than company level EBITDA margin of ~18%. The conversion of tin
to plastic in the edible oil/ghee segment and strong demand for packaged
foods amid pandemic is likely to drive segment revenue at a CAGR of 25%
in FY20-23E (higher than overall sales CAGR of 15%).
Edible oil/ghee segment: As per the company, conversion of tin to plastic
containers in the edible oil/ghee segment is ~| 1200 crore opportunity. The
company has launched different SKUs in the Q-packs (5 litre, 10 litre, 15 litre)
for edible oil/ghee manufacturers. The customers in this includes NK Protein,
Goyal, Damani, Gulab, Halder group, etc. MTPL’s revenue in this segment
saw phenomenal growth of 48% YoY to | 43 crore in FY20.
Ice cream/sweet pack: The company’s revenue from the said business
increased 54% YoY in FY20 to | 48 crore. The client in this segment includes
HUL, Amul, Arun, etc. While the ice cream segment of the company had a
severe hit amid pandemic, the newly launched sweet boxes and hinge packs
products in the same period saw significant demand due to a surge in
packaged foods demand.
Exhibit 7: Strong customer base in F&F segment
Source: company, ICICI Direct Research
Exhibit 8: New launches help drive F&F segment growth
17
20
61
85
101 116
150
197
0
50
100
150
200
250
FY16
FY17
FY18
FY19
FY20
FY21E
FY22E
FY23E
(| crore)
CAGR ~25%
Source: Company, ICICI Direct Research
Exhibit 9: Faster growth to lead higher F&F contribution
6262
50 48
52 53 53 53
32 32
3231 24 22 21 18
6 718 22 23 25 26 29
0
20
40
60
80
100
120
FY16
FY17
FY18
FY19
FY20
FY21E
FY22E
FY23E
(Revenue contr
ibuti
on %
)
Paints Lubricants F&F
Source: Company, ICICI Direct Research

ICICI Securities | Retail Research 6
ICICI Direct Research
Stock Tales | Mold-Tek Packaging Ltd
Paint segment performance to remain healthy backed by strong
clientele
With ~52% topline contribution, the paint segment has remained the largest
topline contributor for MTPL since its existence. The company recorded
strong segment revenue growth of 22% YoY in FY20 to | 229 crore led by
volume growth of 24% YoY.
In the paint segment, the company has all major paint players such as Asian
Paints, Berger Paints, Kansai Nerolac and Akzo Noble as its client. Asian
Paints is a major contributor with 35% share to its overall topline (~66% of
MTPL’s paint segment revenue). The company has done greenfield
expansion of ~6000 MT to serve demand from Asian Paints (~3000 MT each
in Vizag and Mysore). Looking at strong demand from existing clients, MTPL
is likely to increase the total capacity of these plants to ~14000 MT in the
next three to five years. MTPL is also looking to set up a new plant in Kanpur
to serve the requirements of Berger Paints. We build in paint segment
revenue growth at a CAGR of 16% in FY20-23E led by capacity addition and
increased wallet share from existing customers.
Exhibit 10: Strong volume growth in paint segment…
10893
13521
15110
18575
21281
0
5000
10000
15000
20000
25000
FY19
FY20
FY21E
FY22E
FY23E
(M
Ts)
CAGR 15.5%
Source: Company, ICICI Direct Research
Exhibit 11: …to drive revenue at CAGR of 16%
187
229
242
299
354
0
50
100
150
200
250
300
350
400
FY19
FY20
FY21E
FY22E
FY23E
(| crore)
CAGR 16%
Source: Company, ICICI Direct Research
Exhibit 12: Strong customer base in paints segment
Source: company, ICICI Direct Research

ICICI Securities | Retail Research 7
ICICI Direct Research
Stock Tales | Mold-Tek Packaging Ltd
Lubricant segment to grow steadily
The company’s lubricant segment reported slower growth at 5% in the last
five years mainly due to a slowdown in the automotive industry. While MTPL
has strong clients such as Castrol, Shell, etc, the revenue contribution from
this segment has declined from 32% in FY16 to 24% in FY20. Going forward,
we believe the lubricant segment would grow at its historical growth rate of
5% supported by the launch of new QR coded IML packaging solution,
which would help in replacement demand from FY22 onwards.
Exhibit 13: Lubricant segment likely to grow slightly better than historical rate
88
95
107
121
107
101
121123
0
20
40
60
80
100
120
140
FY16
FY17
FY18
FY19
FY20
FY21E
FY22E
FY23E
| crore
CAGR ~5%
Source: Company, ICICI Direct Research
Exhibit 14: Strong customer base in lubricant segment
Source: company, ICICI Direct Research

ICICI Securities | Retail Research 8
ICICI Direct Research
Stock Tales | Mold-Tek Packaging Ltd
Financials
Revenue CAGR of 15% in FY20-23 led by F&F segment
MTPL is likely to see consolidated revenue CAGR of 15% to | 674 crore in
FY20-23E led by strong growth in the F&F and paint segment. The F&F and
paint segments are likely to grow at a CAGR of 25% and 16%, respectively
in FY20-23E. We believe customer addition, strong revenue traction from
pump business and wallet share gains by launching new products would
help drive revenue for MTPL.
Exhibit 15: Strong revenue growth in FY20-23E
276301
347
406438
458
569
674
0
100
200
300
400
500
600
700
800
FY16
FY17
FY18
FY19
FY20
FY21E
FY22E
FY23E
(| crore)
CAGR ~15%
Source: Company, ICICI Direct Research
Higher revenue contribution of F&F segment to help drive
profitability, going forward
EBITDA margin expansion of ~700 bps in the last eight years was largely
driven by rising contribution of IML based revenue and rising contribution
from the F&F business. We believe the F&F segment revenue will continue
to grow at a CAGR of 25% (much higher than company level growth of 15%),
helping drive overall EBITDA margins, going forward. The EBITDA margin
of F&F ranges at 30-35% compared to the company level margin of ~18%.
Hence, rising contribution of F&F segment in overall topline would help drive
overall EBITDA margin higher by ~300 bps from 17.5% in FY20 to 20.6% in
FY23E. This, coupled with a reduction in gross debt from | 107 crore to | 47
crore (through increase free cashflows), would help saving in interest outgo.
We believe PAT may see a strong CAGR of 27% in FY20-23E.
Exhibit 16: EBITDA to grow strongly in FY20-23
4650
6270
77
92
110
139
0.0
5.0
10.0
15.0
20.0
25.0
0
20
40
60
80
100
120
140
160
FY16
FY17
FY18
FY19
FY20
FY21E
FY22E
FY23E
(%
)
(| crore)
EBITDA EBITDA Margin
Source: Company, ICICI Direct Research
Exhibit 17: Robust PAT CAGR of 27% in FY20-23E
24
24 2
8 32
37
46
58
78
0
10
20
30
40
50
60
70
80
90
FY16
FY17
FY18
FY19
FY20
FY21E
FY22E
FY23E
(| crore)
CAGR ~27%
Source: Company, ICICI Direct Research
ICICI Securities | Retail Research 9
ICICI Direct Research
Stock Tales | Mold-Tek Packaging Ltd
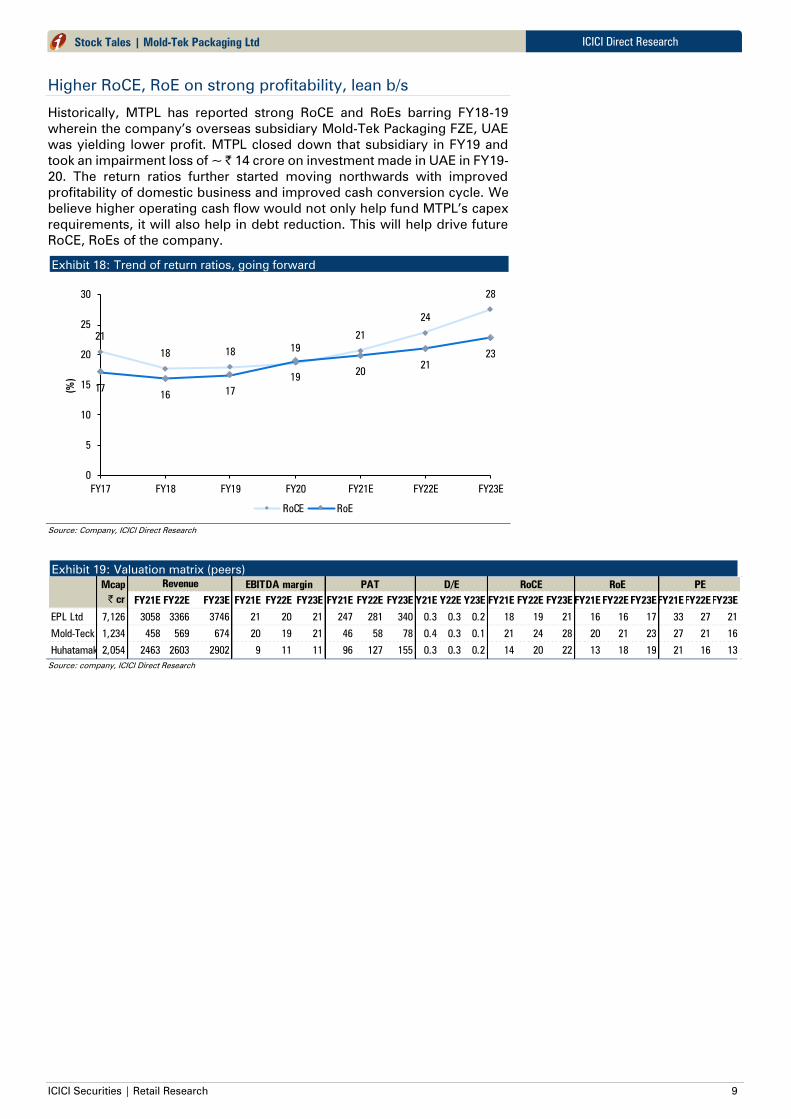
Higher RoCE, RoE on strong profitability, lean b/s
Historically, MTPL has reported strong RoCE and RoEs barring FY18-19
wherein the company’s overseas subsidiary Mold-Tek Packaging FZE, UAE
was yielding lower profit. MTPL closed down that subsidiary in FY19 and
took an impairment loss of ~ | 14 crore on investment made in UAE in FY19-
20. The return ratios further started moving northwards with improved
profitability of domestic business and improved cash conversion cycle. We
believe higher operating cash flow would not only help fund MTPL’s capex
requirements, it will also help in debt reduction. This will help drive future
RoCE, RoEs of the company.
Exhibit 18: Trend of return ratios, going forward
21
18 1819
21
24
28
1716
17
1920
21
23
0
5
10
15
20
25
30
FY17 FY18 FY19 FY20 FY21E FY22E FY23E
(%
)
RoCE RoE
Source: Company, ICICI Direct Research
Exhibit 19: Valuation matrix (peers)
FY21E FY22E FY23E FY21E FY22E FY23E FY21E FY22E FY23EFY21EFY22EFY23E FY21E FY22E FY23E FY21E FY22E FY23EFY21EFY22EFY23E
EPL Ltd 7,126 3058 3366 3746 21 20 21 247 281 340 0.3 0.3 0.2 18 19 21 16 16 17 33 27 21
Mold-Teck 1,234 458 569 674 20 19 21 46 58 78 0.4 0.3 0.1 21 24 28 20 21 23 27 21 16
Huhatamaki 2,054 2463 2603 2902 9 11 11 96 127 155 0.3 0.3 0.2 14 20 22 13 18 19 21 16 13
RoCE RoE PEMcap
| cr
Revenue EBITDA margin PAT D/E
Source: company, ICICI Direct Research

ICICI Securities | Retail Research 10
ICICI Direct Research
Stock Tales | Mold-Tek Packaging Ltd
Risks & Concerns
Higher dependence on key customers
At present, the company is highly dependent on a single customer (Asian
Paints alone contributes ~35% to total revenue). Also, MTPL does not have
any long term contact with any of its key customers. Hence, loss of key
customers or a significant reduction in demand from such customers could
have an adverse effect on MTPL’s financials.
Inability to pass on increased price of key raw materials
The key raw material used for manufacturing products are PPCP, HDPE,
LLDPE. Raw material consumption as percentage of total revenue was 57%
in FY20. The average price of key raw material such has HDPE has almost
doubled in the last one year to | 100/kg. Any sharp increase in prices and
delay in passing on the same would lead to a significant loss in the
company’s gross margin, thereby impacting the overall profitability.
Regulatory concerns over use of polymer based products
In recent years, the government has initiated various actions to restrict single
use of plastics given the rising environmental concern. While the company’s
product are manufactured through same polymer based products, at
present it is not a part of any regulator concerns. However, any future action
by the government to shift/change plastic components may lead to business
risk for the company.
ICICI Securities | Retail Research 11
ICICI Direct Research
Stock Tales | Mold-Tek Packaging Ltd
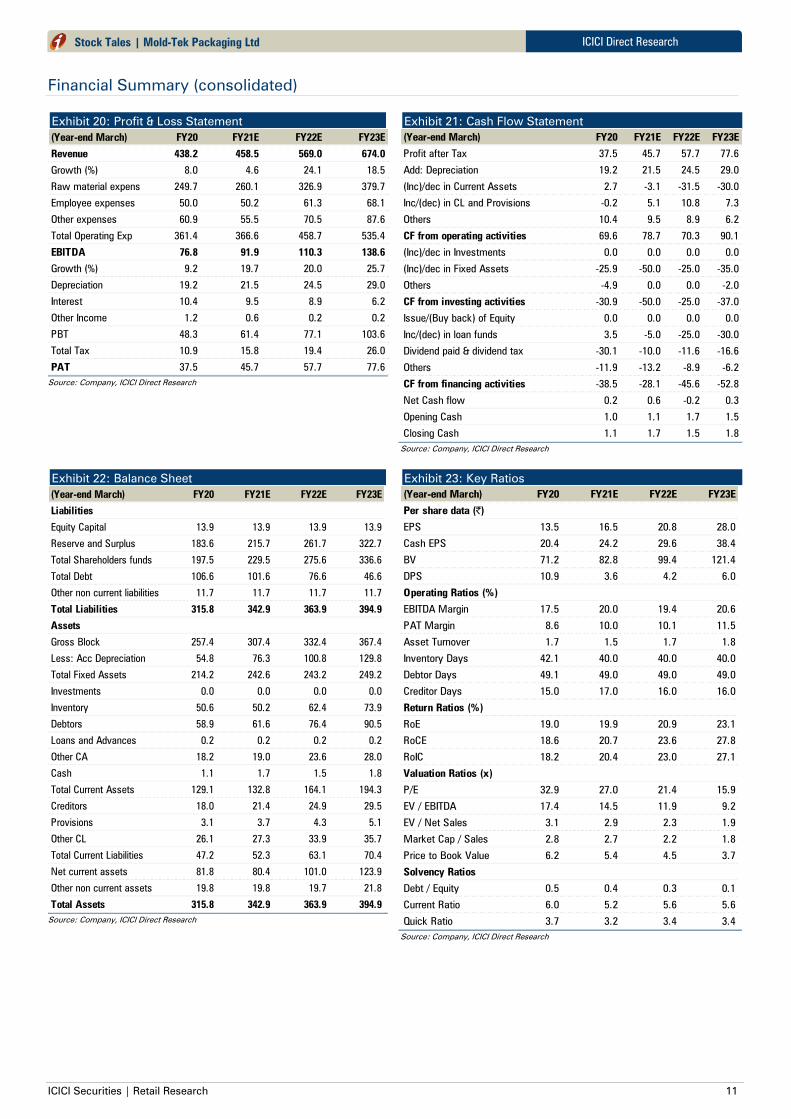
Financial Summary (consolidated)
Exhibit 20: Profit & Loss Statement
(Year-end March) FY20 FY21E FY22E FY23E
Revenue 438.2 458.5 569.0 674.0
Growth (%) 8.0 4.6 24.1 18.5
Raw material expense 249.7 260.1 326.9 379.7
Employee expenses 50.0 50.2 61.3 68.1
Other expenses 60.9 55.5 70.5 87.6
Total Operating Exp 361.4 366.6 458.7 535.4
EBITDA 76.8 91.9 110.3 138.6
Growth (%) 9.2 19.7 20.0 25.7
Depreciation 19.2 21.5 24.5 29.0
Interest 10.4 9.5 8.9 6.2
Other Income 1.2 0.6 0.2 0.2
PBT 48.3 61.4 77.1 103.6
Total Tax 10.9 15.8 19.4 26.0
PAT 37.5 45.7 57.7 77.6
Source: Company, ICICI Direct Research
Exhibit 21: Cash Flow Statement
(Year-end March) FY20 FY21E FY22E FY23E
Profit after Tax 37.5 45.7 57.7 77.6
Add: Depreciation 19.2 21.5 24.5 29.0
(Inc)/dec in Current Assets 2.7 -3.1 -31.5 -30.0
Inc/(dec) in CL and Provisions -0.2 5.1 10.8 7.3
Others 10.4 9.5 8.9 6.2
CF from operating activities 69.6 78.7 70.3 90.1
(Inc)/dec in Investments 0.0 0.0 0.0 0.0
(Inc)/dec in Fixed Assets -25.9 -50.0 -25.0 -35.0
Others -4.9 0.0 0.0 -2.0
CF from investing activities -30.9 -50.0 -25.0 -37.0
Issue/(Buy back) of Equity 0.0 0.0 0.0 0.0
Inc/(dec) in loan funds 3.5 -5.0 -25.0 -30.0
Dividend paid & dividend tax -30.1 -10.0 -11.6 -16.6
Others -11.9 -13.2 -8.9 -6.2
CF from financing activities -38.5 -28.1 -45.6 -52.8
Net Cash flow 0.2 0.6 -0.2 0.3
Opening Cash 1.0 1.1 1.7 1.5
Closing Cash 1.1 1.7 1.5 1.8
Source: Company, ICICI Direct Research
Exhibit 22: Balance Sheet
(Year-end March) FY20 FY21E FY22E FY23E
Liabilities
Equity Capital 13.9 13.9 13.9 13.9
Reserve and Surplus 183.6 215.7 261.7 322.7
Total Shareholders funds 197.5 229.5 275.6 336.6
Total Debt 106.6 101.6 76.6 46.6
Other non current liabilities 11.7 11.7 11.7 11.7
Total Liabilities 315.8 342.9 363.9 394.9
Assets
Gross Block 257.4 307.4 332.4 367.4
Less: Acc Depreciation 54.8 76.3 100.8 129.8
Total Fixed Assets 214.2 242.6 243.2 249.2
Investments 0.0 0.0 0.0 0.0
Inventory 50.6 50.2 62.4 73.9
Debtors 58.9 61.6 76.4 90.5
Loans and Advances 0.2 0.2 0.2 0.2
Other CA 18.2 19.0 23.6 28.0
Cash 1.1 1.7 1.5 1.8
Total Current Assets 129.1 132.8 164.1 194.3
Creditors 18.0 21.4 24.9 29.5
Provisions 3.1 3.7 4.3 5.1
Other CL 26.1 27.3 33.9 35.7
Total Current Liabilities 47.2 52.3 63.1 70.4
Net current assets 81.8 80.4 101.0 123.9
Other non current assets 19.8 19.8 19.7 21.8
Total Assets 315.8 342.9 363.9 394.9
Source: Company, ICICI Direct Research
Exhibit 23: Key Ratios
(Year-end March) FY20 FY21E FY22E FY23E
Per share data (|)
EPS 13.5 16.5 20.8 28.0
Cash EPS 20.4 24.2 29.6 38.4
BV 71.2 82.8 99.4 121.4
DPS 10.9 3.6 4.2 6.0
Operating Ratios (%)
EBITDA Margin 17.5 20.0 19.4 20.6
PAT Margin 8.6 10.0 10.1 11.5
Asset Turnover 1.7 1.5 1.7 1.8
Inventory Days 42.1 40.0 40.0 40.0
Debtor Days 49.1 49.0 49.0 49.0
Creditor Days 15.0 17.0 16.0 16.0
Return Ratios (%)
RoE 19.0 19.9 20.9 23.1
RoCE 18.6 20.7 23.6 27.8
RoIC 18.2 20.4 23.0 27.1
Valuation Ratios (x)
P/E 32.9 27.0 21.4 15.9
EV / EBITDA 17.4 14.5 11.9 9.2
EV / Net Sales 3.1 2.9 2.3 1.9
Market Cap / Sales 2.8 2.7 2.2 1.8
Price to Book Value 6.2 5.4 4.5 3.7
Solvency Ratios
Debt / Equity 0.5 0.4 0.3 0.1
Current Ratio 6.0 5.2 5.6 5.6
Quick Ratio 3.7 3.2 3.4 3.4
Source: Company, ICICI Direct Research

ICICI Securities | Retail Research 12
ICICI Direct Research
Stock Tales | Mold-Tek Packaging Ltd
RATING RATIONALE
ICICI Direct endeavors to provide objective opinions and recommendations. ICICI Direct assigns ratings to its
stocks according to their notional target price vs. current market price and then categorizes them as Buy, Hold,
Reduce and Sell. The performance horizon is two years unless specified and the notional target price is defined
as the analysts' valuation for a stock
Buy: >15%
Hold: -5% to 15%;
Reduce: -15% to -5%;
Sell: <-15%
Pankaj Pandey Head – Research [email protected]
ICICI Direct Research Desk,
ICICI Securities Limited,
1st Floor, Akruti Trade Centre,
Road No 7, MIDC,
Andheri (East)
Mumbai – 400 093

ICICI Securities | Retail Research 13
ICICI Direct Research
Stock Tales | Mold-Tek Packaging Ltd
ANALYST CERTIFICATION
I/We, Sanjay Manyal;, MBA (Finance), Hitesh Taunk MBA(Finance), Research Analysts, authors and the names subscribed to this report, hereby certify that all of the views expressed in this research report accurately reflect our
views about the subject issuer(s) or securities. We also certify that no part of our compensation was, is, or will be directly or indirectly related to the specific recommendation(s) or view(s) in this report. It is also confirmed that above
mentioned Analysts of this report have not received any compensation from the companies mentioned in the report in the preceding twelve months and do not serve as an officer, director or employee of the companies mentioned in
the report.
Terms & conditions and other disclosures:
ICICI Securities Limited (ICICI Securities) is a full-service, integrated investment banking and is, inter alia, engaged in the business of stock brokering and distribution of financial products.
ICICI Securities is Sebi registered stock broker, merchant banker, investment adviser, portfolio manager and Research Analyst. ICICI Securities is registered with Insurance Regulatory Development Authority of India Limited (IRDAI)
as a composite corporate agent and with PFRDA as a Point of Presence. ICICI Securities Limited Research Analyst SEBI Registration Number – INH000000990. ICICI Securities Limited SEBI Registration is INZ000183631 for stock
broker. ICICI Securities is a subsidiary of ICICI Bank which is India’s largest private sector bank and has its various subsidiaries engaged in businesses of housing finance, asset management, life insurance, general insurance, venture
capital fund management, etc. (“associates”), the details in respect of which are available on www.icicibank.com.
ICICI Securities is one of the leading merchant bankers/ underwriters of securities and participate in virtually all securities trading markets in India. We and our associates might have investment banking and other business relationship
with a significant percentage of companies covered by our Investment Research Department. ICICI Securities and its analysts, persons reporting to analysts and their relatives are generally prohibited from maintaining a financial
interest in the securities or derivatives of any companies that the analysts cover.
Recommendation in reports based on technical and derivative analysis centre on studying charts of a stock's price movement, outstanding positions, trading volume etc as opposed to focusing on a company's fundamentals and, as
such, may not match with the recommendation in fundamental reports. Investors may visit icicidirect.com to view the Fundamental and Technical Research Reports.
Our proprietary trading and investment businesses may make investment decisions that are inconsistent with the recommendations expressed herein.
ICICI Securities Limited has two independent equity research groups: Institutional Research and Retail Research. This report has been prepared by the Retail Research. The views and opinions expressed in this document may or may
not match or may be contrary with the views, estimates, rating, and target price of the Institutional Research.
The information and opinions in this report have been prepared by ICICI Securities and are subject to change without any notice. The report and information contained herein is strictly confidential and meant solely for the selected
recipient and may not be altered in any way, transmitted to, copied or distributed, in part or in whole, to any other person or to the media or reproduced in any form, without prior written consent of ICICI Securities. While we would
endeavour to update the information herein on a reasonable basis, ICICI Securities is under no obligation to update or keep the information current. Also, there may be regulatory, compliance or other reasons that may prevent ICICI
Securities from doing so. Non-rated securities indicate that rating on a particular security has been suspended temporarily and such suspension is in compliance with applicable regulations and/or ICICI Securities policies, in
circumstances where ICICI Securities might be acting in an advisory capacity to this company, or in certain other circumstances.
This report is based on information obtained from public sources and sources believed to be reliable, but no independent verification has been made nor is its accuracy or completeness guaranteed. This report and information herein
is solely for informational purpose and shall not be used or considered as an offer document or solicitation of offer to buy or sell or subscribe for securities or other financial instruments. Though disseminated to all the customers
simultaneously, not all customers may receive this report at the same time. ICICI Securities will not treat recipients as customers by virtue of their receiving this report. Nothing in this report constitutes investment, legal, accounting
and tax advice or a representation that any investment or strategy is suitable or appropriate to your specific circumstances. The securities discussed and opinions expressed in this report may not be suitable for all investors, who
must make their own investment decisions, based on their own investment objectives, financial positions and needs of specific recipient. This may not be taken in substitution for the exercise of independent judgment by any recipient.
The recipient should independently evaluate the investment risks. The value and return on investment may vary because of changes in interest rates, foreign exchange rates or any other reason. ICICI Securities accepts no liabilities
whatsoever for any loss or damage of any kind arising out of the use of this report. Past performance is not necessarily a guide to future performance. Investors are advised to see Risk Disclosure Document to understand the risks
associated before investing in the securities markets. Actual results may differ materially from those set forth in projections. Forward-looking statements are not predictions and may be subject to change without notice.
ICICI Securities or its associates might have managed or co-managed public offering of securities for the subject company or might have been mandated by the subject company for any other assignment in the past twelve months.
ICICI Securities or its associates might have received any compensation from the companies mentioned in the report during the period preceding twelve months from the date of this report for services in respect of managing or co-
managing public offerings, corporate finance, investment banking or merchant banking, brokerage services or other advisory service in a merger or specific transaction.
ICICI Securities encourages independence in research report preparation and strives to minimize conflict in preparation of research report. ICICI Securities or its associates or its analysts did not receive any compensation or other
benefits from the companies mentioned in the report or third party in connection with preparation of the research report. Accordingly, neither ICICI Securities nor Research Analysts and their relatives have any material conflict of
interest at the time of publication of this report.
Compensation of our Research Analysts is not based on any specific merchant banking, investment banking or brokerage service transactions.
ICICI Securities or its subsidiaries collectively or Research Analysts or their relatives do not own 1% or more of the equity securities of the Company mentioned in the report as of the last day of the month preceding the publication of
the research report.
Since associates of ICICI Securities and ICICI Securities as a entity are engaged in various financial service businesses, they might have financial interests or beneficial ownership in various companies including the subject
company/companies mentioned in this report.
ICICI Securities may have issued other reports that are inconsistent with and reach different conclusion from the information presented in this report.
Neither the Research Analysts nor ICICI Securities have been engaged in market making activity for the companies mentioned in the report.
We submit that no material disciplinary action has been taken on ICICI Securities by any Regulatory Authority impacting Equity Research Analysis activities.
This report is not directed or intended for distribution to, or use by, any person or entity who is a citizen or resident of or located in any locality, state, country or other jurisdiction, where such distribution, publication, availability or
use would be contrary to law, regulation or which would subject ICICI Securities and affiliates to any registration or licensing requirement within such jurisdiction. The securities described herein may or may not be eligible for sale in
all jurisdictions or to certain category of investors. Persons in whose possession this document may come are required to inform themselves of and to observe such restriction


