
ECFIN 2013 BCS Workshop Brussels, November 14-15
Measuring the Level of Capacity
Utilisation in Non-Manufacturing
Sectors
Viviane Seda Bittencourt
Business and Consumer Surveys
Getulio Vargas Foundation
ECFIN 2013 BCS Workshop
Outline
• Introduction
• Preliminary studies
• Benchmarking
• Survey: Do firms understand the Level of Capacity
Utilisation (LCU) concept?
• Questionnaire
• First results
• Conclusions
• Next steps

Introduction
• The Getulio Vargas Foundation (FGV) has provided a survey-based LCU indicator for
the Manufacturing Industry since 1966;
• FGV’s Manufacturing LCU is widely used as a measure of the output gap in Brazil;
• In the last decade, the relevance of this indicator has decreased due to (among other
reasons) the increase in the share of Services in GDP;
• Recently, FGV started to produce monthly tendency surveys for the Services Sector
(2008), Trade (2010) and Construction (2010) following the European model;
• In 2012, FGV started working on a measure of LCU for the non-manufacturing sectors
with the support of Brazilian Central Bank.
ECFIN 2013 BCS Workshop

Preliminary studies
Benchmarking
Services - the European model is the reference
Trade - we hardly found any references
Construction - there are many different approaches
(KOF, WIFO, South African BER, etc.)
Survey: “Do firms understand the LCU concept?”
ECFIN 2013 BCS Workshop

Survey: Do firms understand the LCU concept ?
The survey was conducted during the first semester of 2013
obtaining two types of information:
Do firms monitor their LCU?
What variables are taken into account along this process?
Around 4,200 firms were consulted:
2,350 from the Services Sector;
1,150 from the Trade Sector;
700 from the Construction Sector.
ECFIN 2013 BCS Workshop
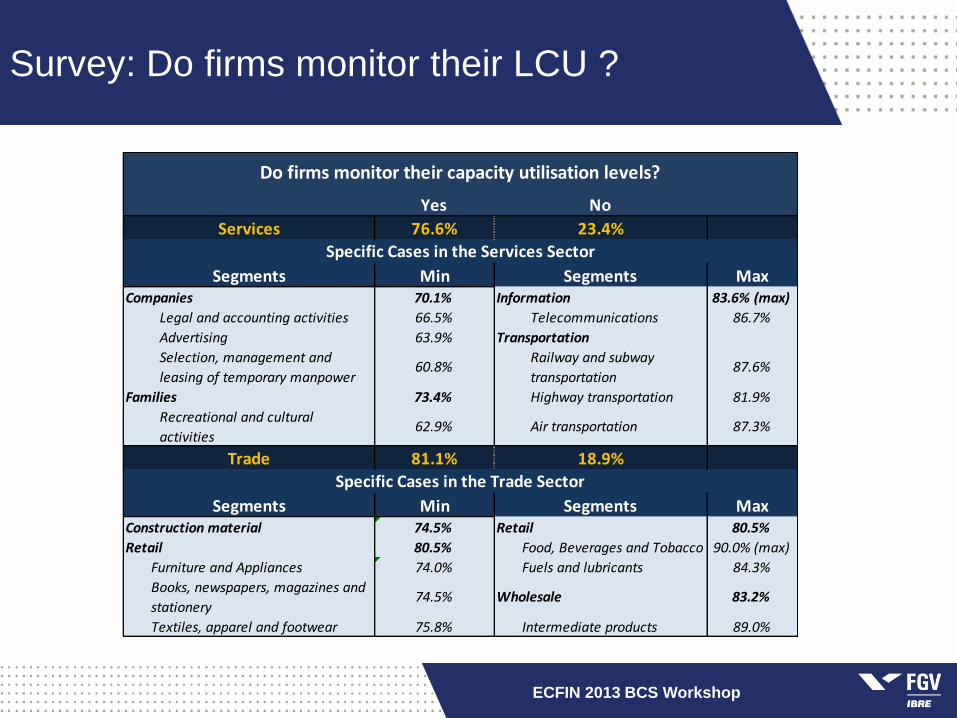
Survey: Do firms monitor their LCU ?
ECFIN 2013 BCS Workshop
Yes No
Services 76.6% 23.4%
Segments Min Segments MaxCompanies 70.1% Information 83.6% (max)
Legal and accounting activities 66.5% Telecommunications 86.7%
Advertising 63.9% Transportation
Selection, management and
leasing of temporary manpower60.8%
Railway and subway
transportation87.6%
Families 73.4% Highway transportation 81.9%
Recreational and cultural
activities62.9% Air transportation 87.3%
Trade 81.1% 18.9%
Segments Min Segments MaxConstruction material 74.5% Retail 80.5%
Retail 80.5% Food, Beverages and Tobacco 90.0% (max)
Furniture and Appliances 74.0% Fuels and lubricants 84.3%
Books, newspapers, magazines and
stationery74.5% Wholesale 83.2%
Textiles, apparel and footwear 75.8% Intermediate products 89.0%
Specific Cases in the Services Sector
Specific Cases in the Trade Sector
Do firms monitor their capacity utilisation levels?

Survey: How the concept of LCU in non-manufacturing firms is defined
ECFIN 2013 BCS Workshop
Labour is the major factor taken into account in all three sectors;
46% of the firms considered their Own labour as the main labour factor (80%
in the construction sector);
Capital is the second most important factor;
Own machinery & equipment was mentioned by 25% of the companies.
(Services sector 33%);
Financial factors were mentioned by 18.0% of the companies (25% in Services
Sector);
Only 4.0% of the firms measure LCU based on other factors.

Formulation of the questions
ECFIN 2013 BCS Workshop
Taking into account…
…the benchmark research;
…the survey on LCU knowledge;
…conversations with experts…
FGV decided to use the European formulation for the Services and the Trade
LCU indicators on a monthly basis.
An additional question was added in all sectors:
“How do you evaluate the supply capacity of your firm at the moment?”
(More than sufficient/ Normal / Insufficient)
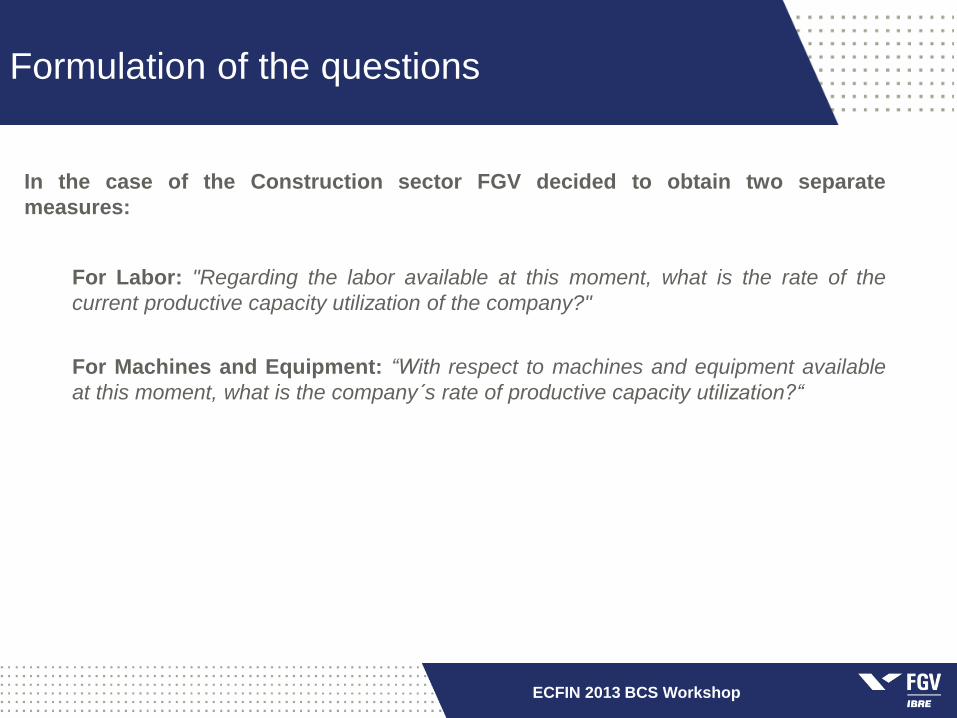
Formulation of the questions
ECFIN 2013 BCS Workshop
In the case of the Construction sector FGV decided to obtain two separate
measures:
For Labor: "Regarding the labor available at this moment, what is the rate of the
current productive capacity utilization of the company?"
For Machines and Equipment: “With respect to machines and equipment available
at this moment, what is the company´s rate of productive capacity utilization?“
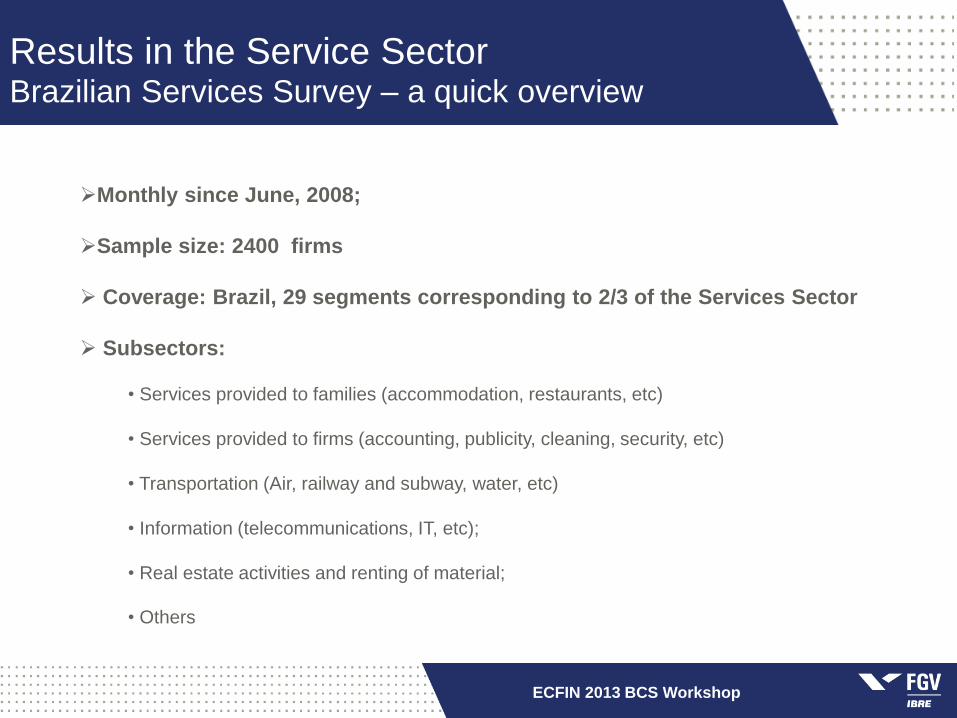
Results in the Service Sector Brazilian Services Survey – a quick overview
ECFIN 2013 BCS Workshop
Monthly since June, 2008;
Sample size: 2400 firms
Coverage: Brazil, 29 segments corresponding to 2/3 of the Services Sector
Subsectors:
• Services provided to families (accommodation, restaurants, etc)
• Services provided to firms (accounting, publicity, cleaning, security, etc)
• Transportation (Air, railway and subway, water, etc)
• Information (telecommunications, IT, etc);
• Real estate activities and renting of material;
• Others
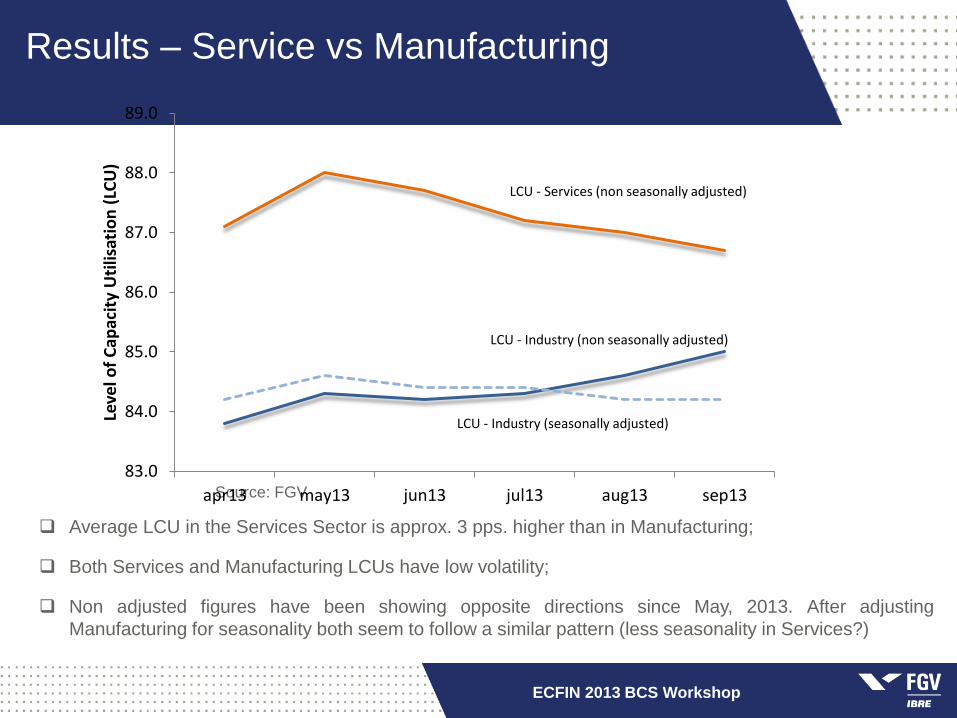
Results – Service vs Manufacturing
Average LCU in the Services Sector is approx. 3 pps. higher than in Manufacturing;
Both Services and Manufacturing LCUs have low volatility;
Non adjusted figures have been showing opposite directions since May, 2013. After adjusting
Manufacturing for seasonality both seem to follow a similar pattern (less seasonality in Services?)
ECFIN 2013 BCS Workshop
Source: FGV
83.0
84.0
85.0
86.0
87.0
88.0
89.0
apr13 may13 jun13 jul13 aug13 sep13
Leve
l of
Cap
acit
y U
tilis
atio
n (
LCU
)
LCU - Services (non seasonally adjusted)
LCU - Industry (non seasonally adjusted)
LCU - Industry (seasonally adjusted)
Results – Services Sector
ECFIN 2013 BCS Workshop
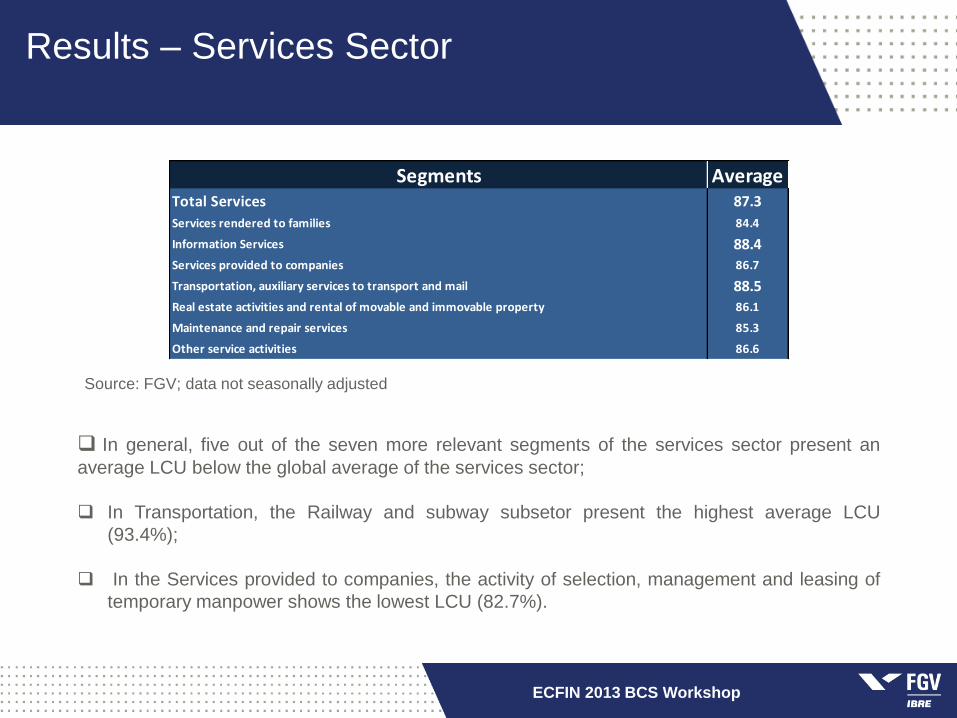
Source: FGV; data not seasonally adjusted
In general, five out of the seven more relevant segments of the services sector present an
average LCU below the global average of the services sector;
In Transportation, the Railway and subway subsetor present the highest average LCU
(93.4%);
In the Services provided to companies, the activity of selection, management and leasing of
temporary manpower shows the lowest LCU (82.7%).
Segments AverageTotal Services 87.3
Services rendered to families 84.4
Information Services 88.4
Services provided to companies 86.7
Transportation, auxiliary services to transport and mail 88.5
Real estate activities and rental of movable and immovable property 86.1
Maintenance and repair services 85.3
Other service activities 86.6

Results – Services Sector Consistency evaluation – correlation in changes in related variables (Average of third quarter minus second quarter)
ECFIN 2013 BCS Workshop
Source: FGV; data not seasonally adjusted
-04
-03
-03
-02
-02
-01
-01
00
01
01
02
02
-25 -20 -15 -10 -05 00 05 10 15
LCU
(q
uar
tely
dif
fere
nce
)
Balance (insuficient - more than sufficient) of productive capacity (quartely difference)
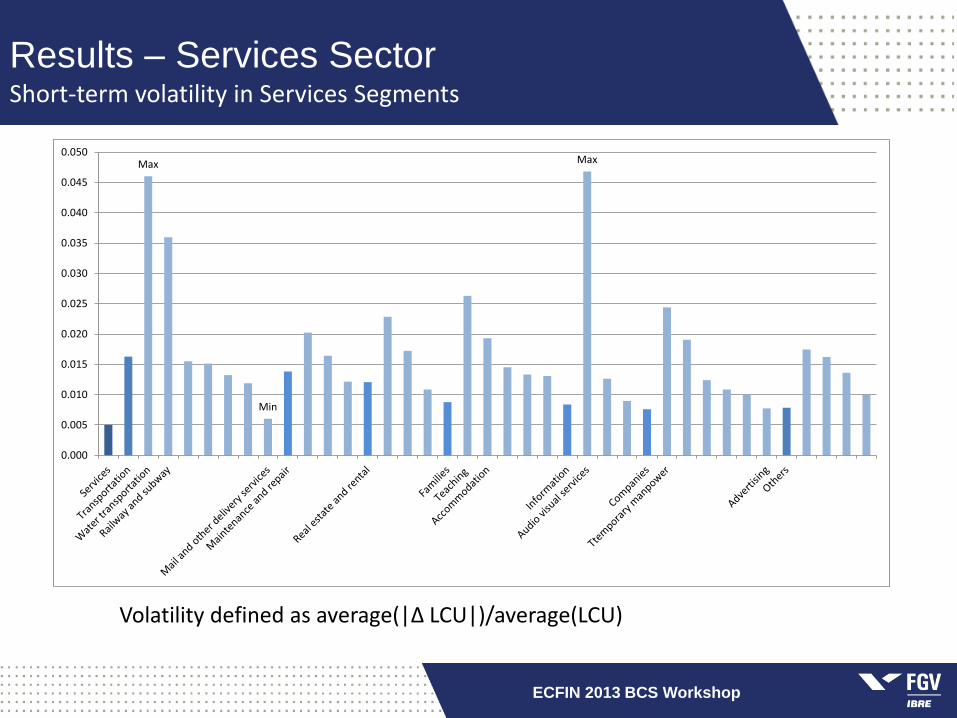
Results – Services Sector Short-term volatility in Services Segments
ECFIN 2013 BCS Workshop
Volatility defined as average(|Δ LCU|)/average(LCU)
Max
Min
Max
0.000
0.005
0.010
0.015
0.020
0.025
0.030
0.035
0.040
0.045
0.050
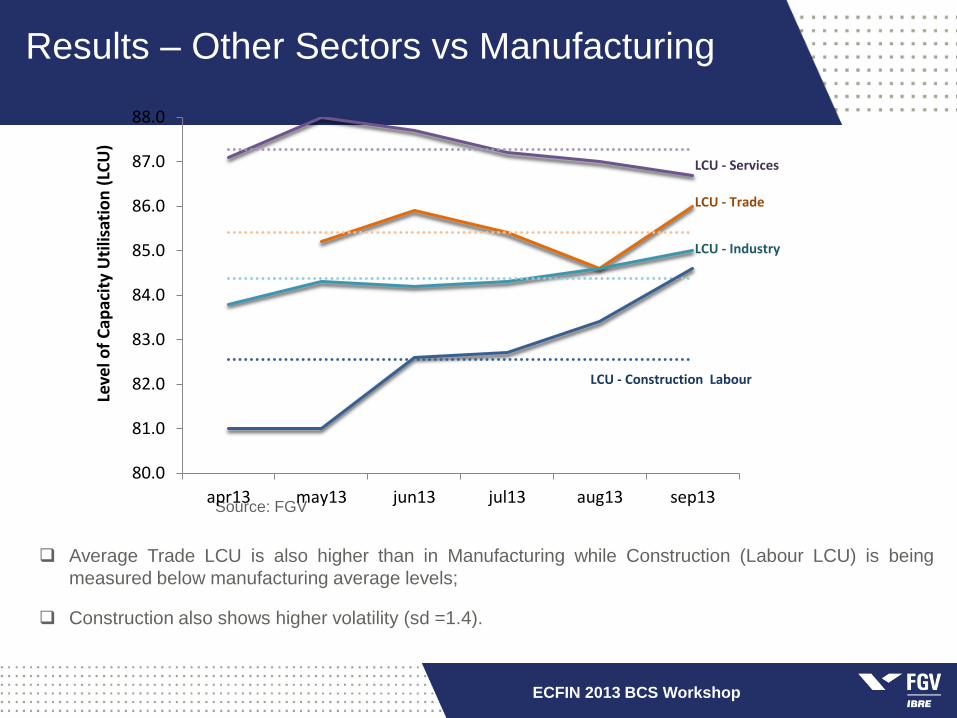
Results – Other Sectors vs Manufacturing
Average Trade LCU is also higher than in Manufacturing while Construction (Labour LCU) is being
measured below manufacturing average levels;
Construction also shows higher volatility (sd =1.4).
ECFIN 2013 BCS Workshop
Source: FGV
80.0
81.0
82.0
83.0
84.0
85.0
86.0
87.0
88.0
apr13 may13 jun13 jul13 aug13 sep13
Leve
l of
Cap
acit
y U
tilis
atio
n (
LCU
)
LCU - Trade
LCU - Construction Labour
LCU - Services
LCU - Industry
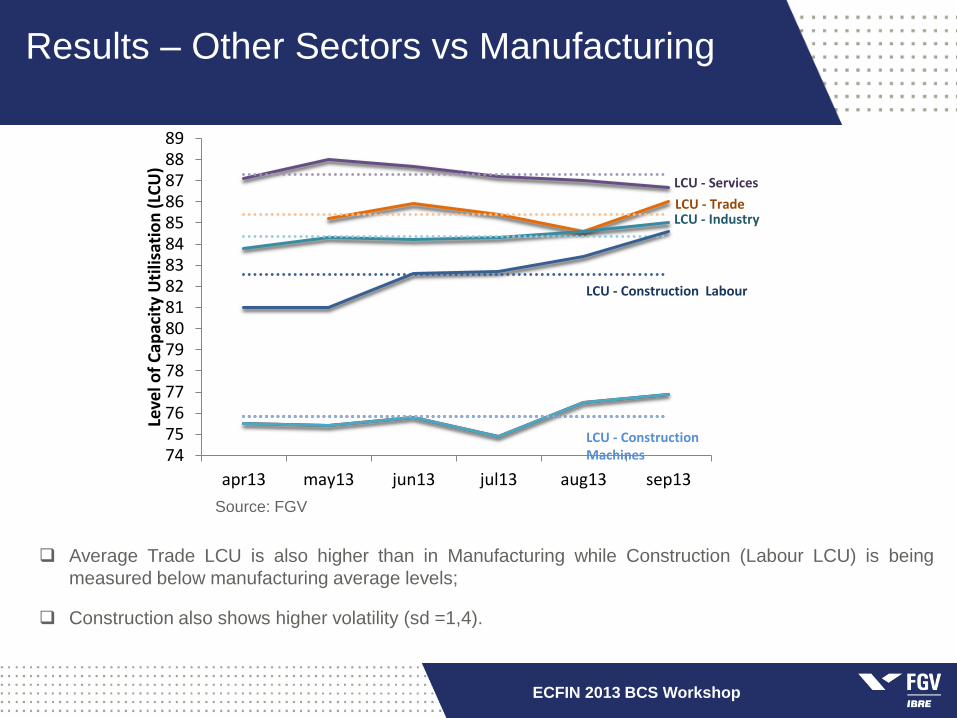
Results – Other Sectors vs Manufacturing
Average Trade LCU is also higher than in Manufacturing while Construction (Labour LCU) is being
measured below manufacturing average levels;
Construction also shows higher volatility (sd =1,4).
ECFIN 2013 BCS Workshop
Source: FGV
74757677787980818283848586878889
apr13 may13 jun13 jul13 aug13 sep13
Leve
l of
Cap
acit
y U
tilis
atio
n (
LCU
)
LCU - Trade
LCU - Construction Labour
LCU - Services
LCU - Industry
LCU - Construction Machines
Conclusions
FGV introduced questions on LCU in its non-manufacturing monthly surveys with
good acceptance by the companies;
The results show a reasonable cyclical behavior and are related to other
variables within the surveys;
The descriptive statistics (average, volatility) appear to be aligned and
comparable with the Manufacturing LCU;
Results of Manufacturing and Services appear to confirm the cyclical behavior of
these sectors as measured by other survey and quantitative indicators;
ECFIN 2013 BCS Workshop
Next Steps
Survey on answering practices with special focus on the
interpretation of the increase in the volume of activity (in
percent or percentage points?);
As more data is collected a more detailed analyses of the
aggregate and sectorial results is possible;
Comparison with international results;
Introducing an aggregate LCU question for Construction.
ECFIN 2013 BCS Workshop

Thank You! ([email protected])


