Mechanistic-Empirical Pavement Design Guide: A User’s
Perspective
Brian D. Prowell, Ph.D., P.E.

ADVANCED MATERIALSSERVICES, LLC
Empirical Approach
• Based on results of experiments or experience
• Scientific basis not established
• AASHTO 86/93 an empirical design method
• Refer to AASHO Road Test

ADVANCED MATERIALSSERVICES, LLC
Typical Loop Layout--AASHO Road TestLoop 5 Single Axles 22.4 kips, Tandems 40 kips
Loop 6 Single Axles 30.0 kips, Tandems 48 kips
ADVANCED MATERIALSSERVICES, LLC
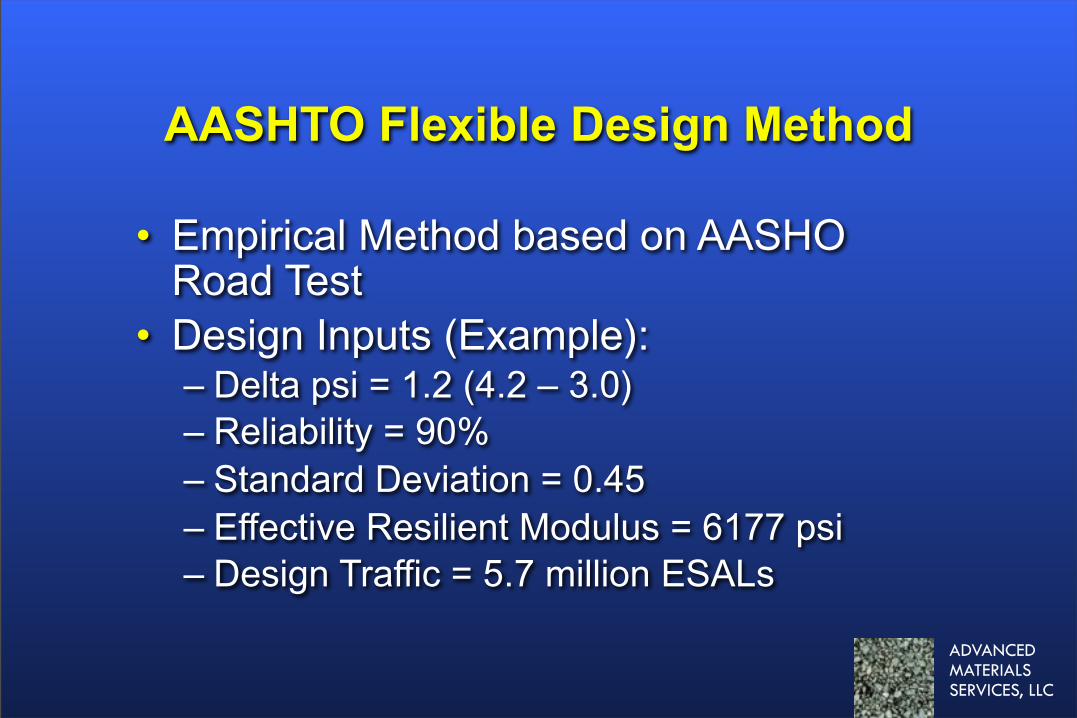
AASHTO Flexible Design Method
• Empirical Method based on AASHO Road Test
• Design Inputs (Example):– Delta psi = 1.2 (4.2 – 3.0)– Reliability = 90%– Standard Deviation = 0.45– Effective Resilient Modulus = 6177 psi– Design Traffic = 5.7 million ESALs

ADVANCED MATERIALSSERVICES, LLC
Empirical ApproachAASHTO Flexible Pavement
Performance Equation
Solve for SN using nomograph or bisection method

ADVANCED MATERIALSSERVICES, LLC
Empirical ApproachAASHTO Flexible Pavement
Performance Equation
log10 W18 = (ZR) (S0) + (9.36)(log (SN + 1)) - 0.20 +{log10[ΔPSI/(4.2-1.5)]/[0.40 + 1.094/(SN + 1)5.19 } + (2.32) (log10MR) - 8.07
Solve for SN using nomograph or bisection method
ADVANCED MATERIALSSERVICES, LLC
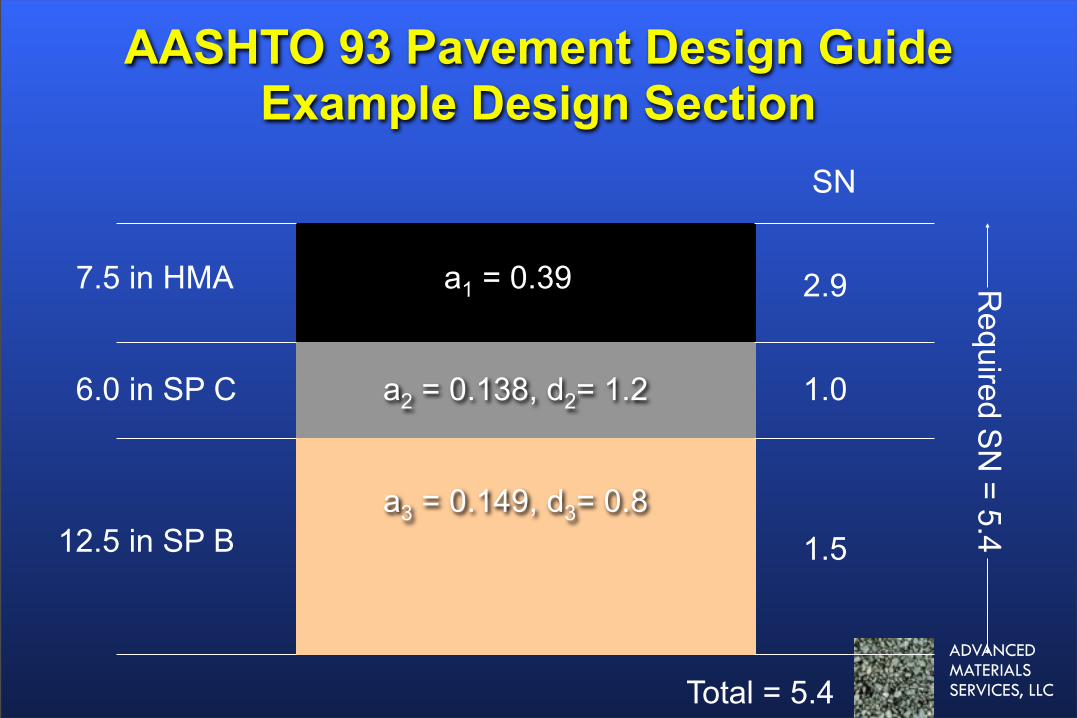
AASHTO 93 Pavement Design GuideExample Design Section
7.5 in HMA
12.5 in SP B
6.0 in SP C
SN
2.9
1.0
1.5
Required S
N =
5.4
Total = 5.4
a3 = 0.149, d3= 0.8
a2 = 0.138, d2= 1.2
a1 = 0.39

ADVANCED MATERIALSSERVICES, LLC
Mechanistic-Empirical
• Mechanistic: Determine stresses, strains, or deflections at critical locations in a pavement structure.
• Empirical: Relates stresses, strains, or deflections to pavement performance. Often referred to as Transfer Functions.
ADVANCED MATERIALSSERVICES, LLC
Important Advantages• Relate material properties to design
• More accurate portrayal of traffic effects and changes in axle loading
• Effects of construction variability and traffic variability can be accounted for
• Pavement layers can be engineered for expected distresses
ADVANCED MATERIALSSERVICES, LLC
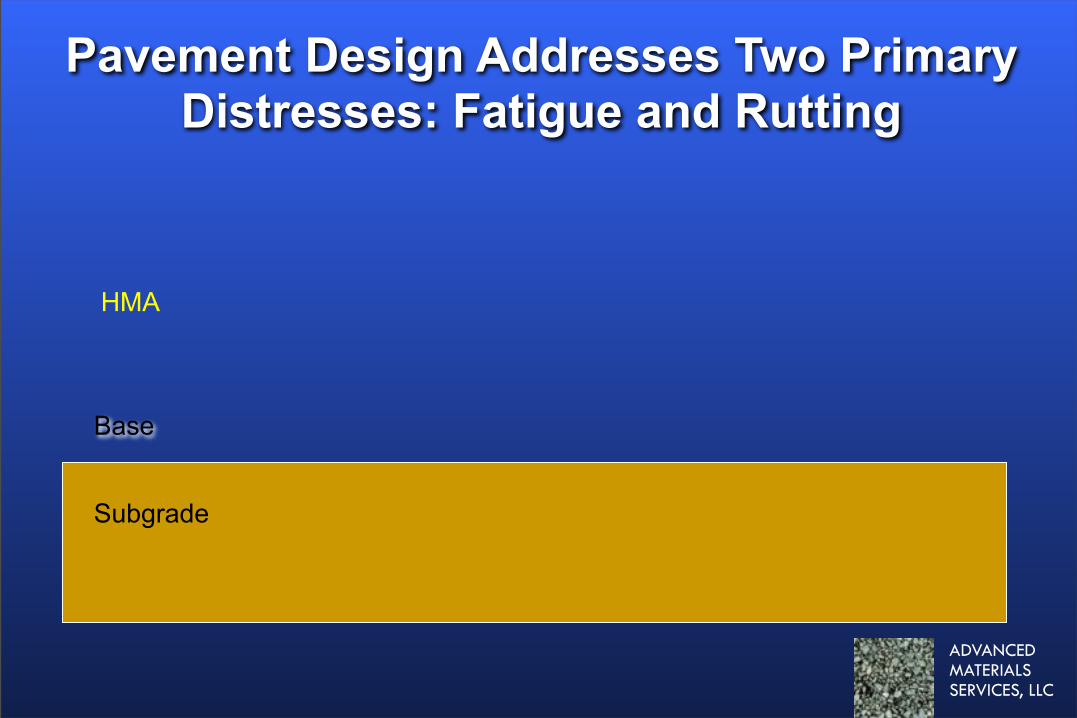
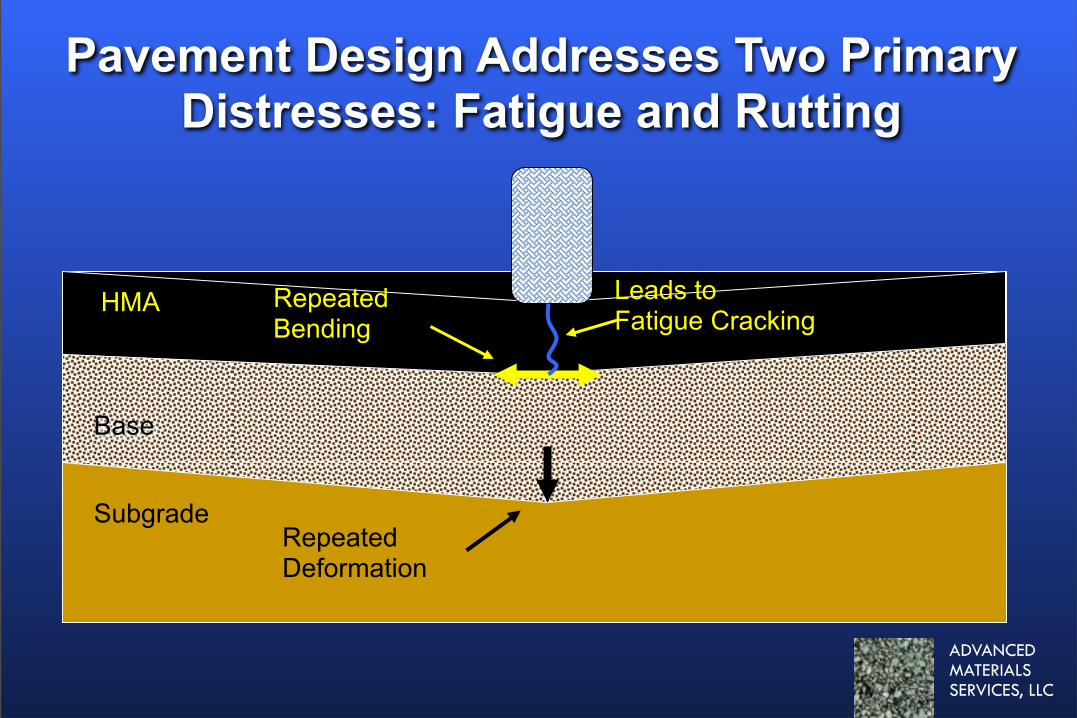
Pavement Design Addresses Two Primary Distresses: Fatigue and Rutting
HMA
Base
Subgrade
ADVANCED MATERIALSSERVICES, LLC
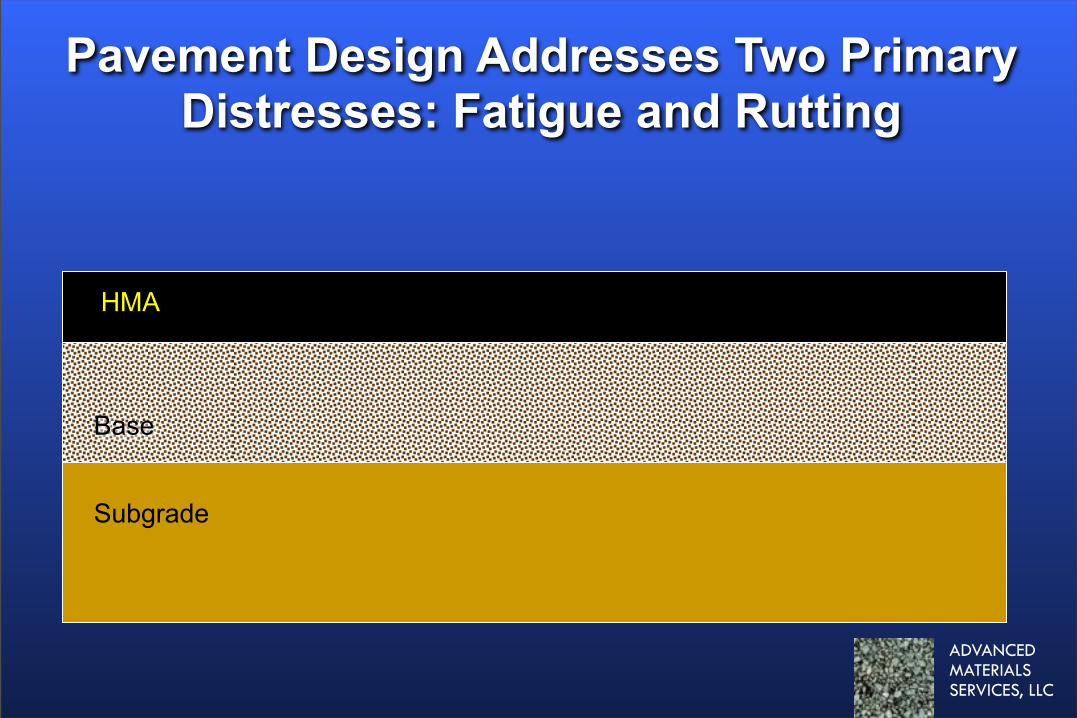
Pavement Design Addresses Two Primary Distresses: Fatigue and Rutting
HMA
Base
Subgrade
ADVANCED MATERIALSSERVICES, LLC
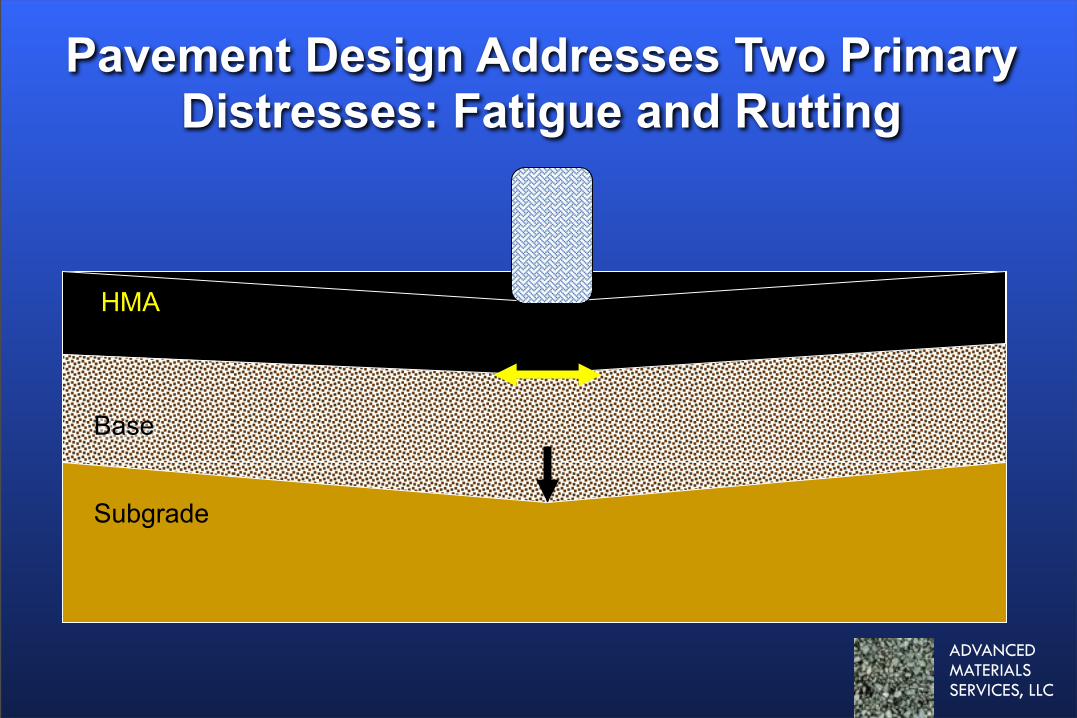
Pavement Design Addresses Two Primary Distresses: Fatigue and Rutting
HMA
Base
Subgrade
ADVANCED MATERIALSSERVICES, LLC
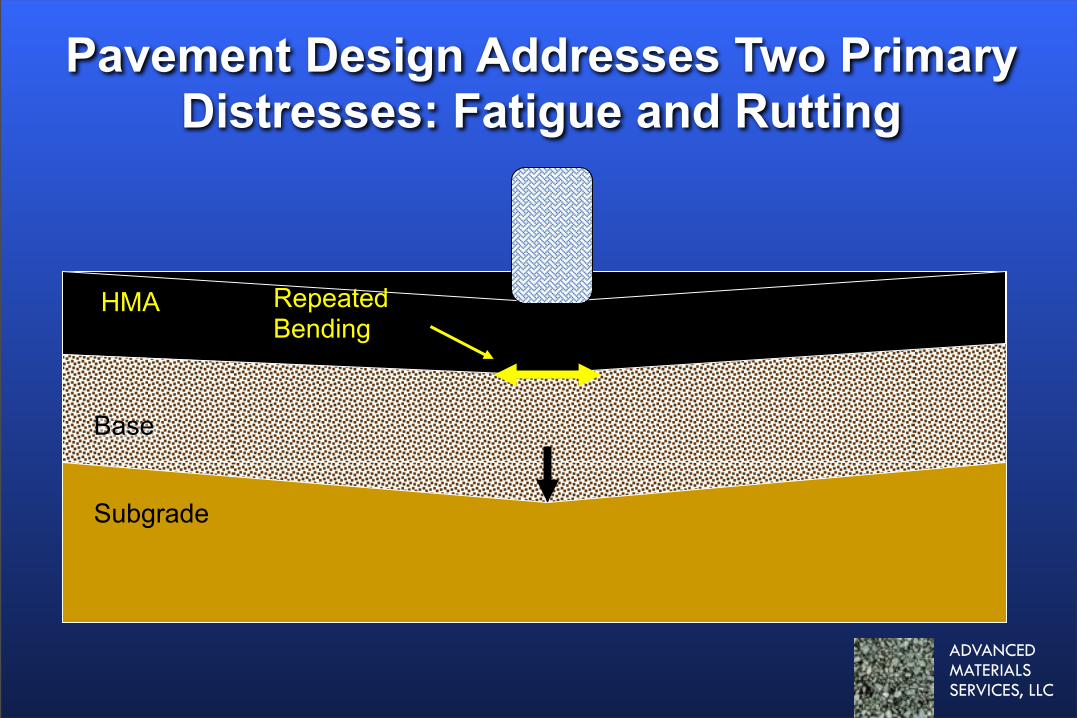
Pavement Design Addresses Two Primary Distresses: Fatigue and Rutting
RepeatedBending
HMA
Base
Subgrade

ADVANCED MATERIALSSERVICES, LLC
Pavement Design Addresses Two Primary Distresses: Fatigue and Rutting
RepeatedBending
Leads toFatigue Cracking
HMA
Base
Subgrade
ADVANCED MATERIALSSERVICES, LLC
Pavement Design Addresses Two Primary Distresses: Fatigue and Rutting
RepeatedBending
Leads toFatigue Cracking
RepeatedDeformation
HMA
Base
Subgrade

ADVANCED MATERIALSSERVICES, LLC
Pavement Design Addresses Two Primary Distresses: Fatigue and Rutting
RepeatedBending
Leads toFatigue Cracking
RepeatedDeformation
Leads toRutting
HMA
Base
Subgrade
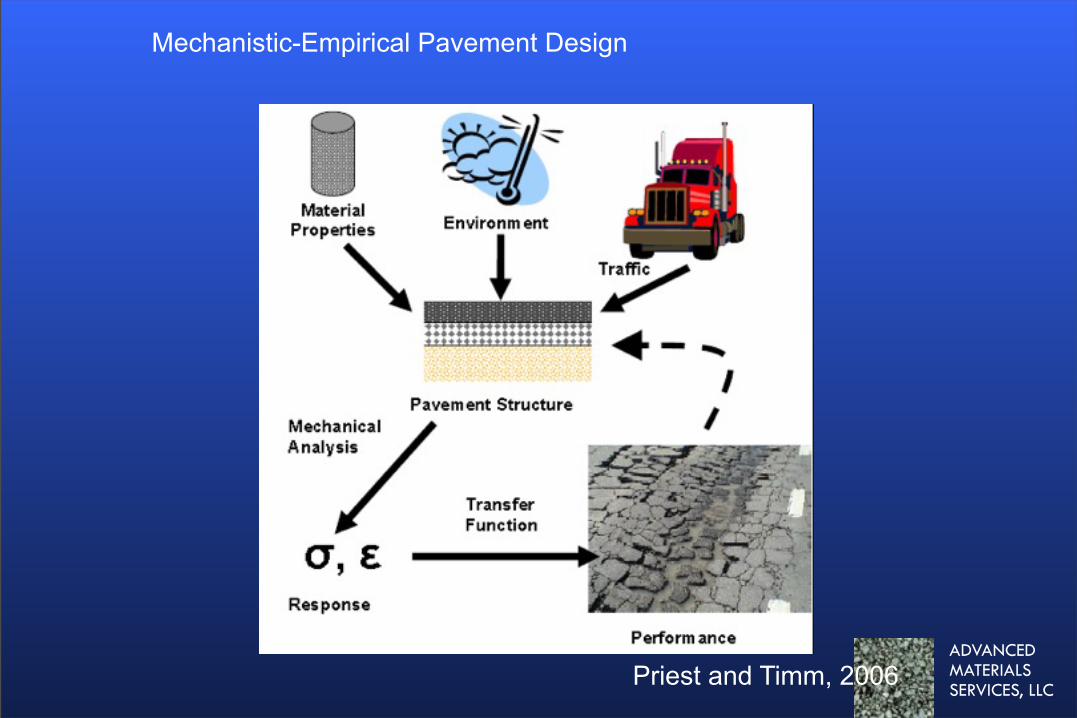
ADVANCED MATERIALSSERVICES, LLCPriest and Timm, 2006
Mechanistic-Empirical Pavement Design

ADVANCED MATERIALSSERVICES, LLC
M-E design process requires
•Material properties of each layer (Ei, µi)
•Thickness of each layer (hi) and load (P, a)
ADVANCED MATERIALSSERVICES, LLC

ADVANCED MATERIALSSERVICES, LLC
Hierarchical Input Levels
• Level 1– Advanced materials testing (E*, MR)
• Level 2– Available test procedures (like CBR) with
correlation equations
• Level 3– Default values

ADVANCED MATERIALSSERVICES, LLC
Traffic

• Traffic Volume – AADTT
• Directional and lane distributions
• Growth factor• Speed
• Vehicle Classification and axle-distribution– Level I – site specific load
spectra– Level III – default
distributions by road class
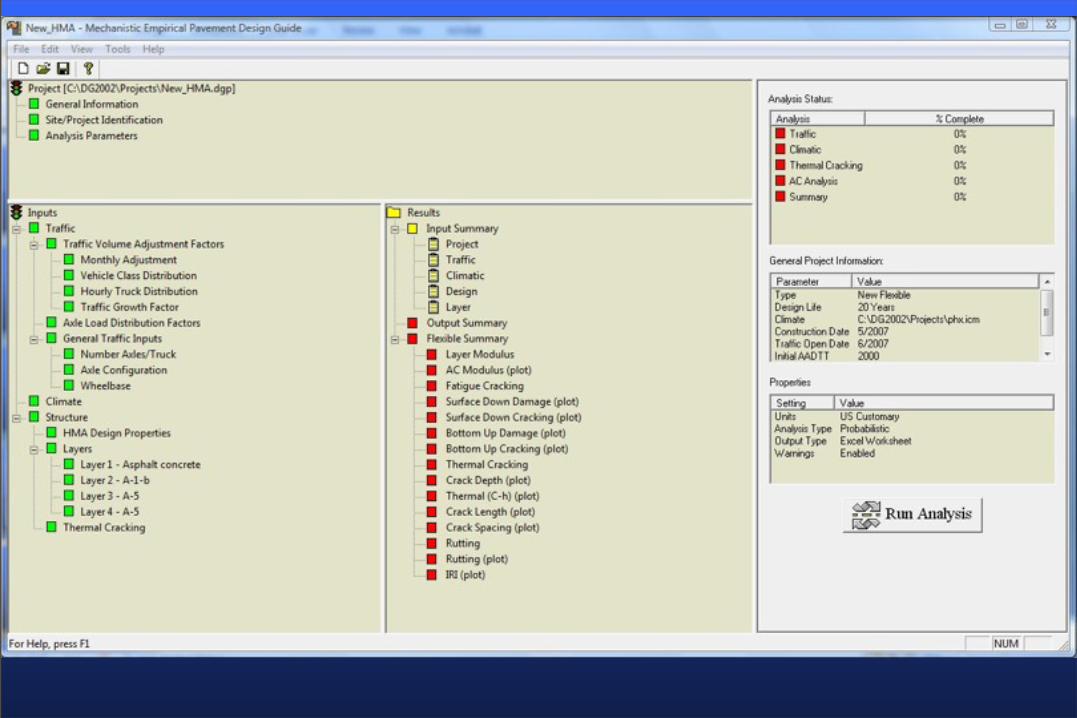
M-E PDG Traffic Inputs
ADVANCED MATERIALSSERVICES, LLC
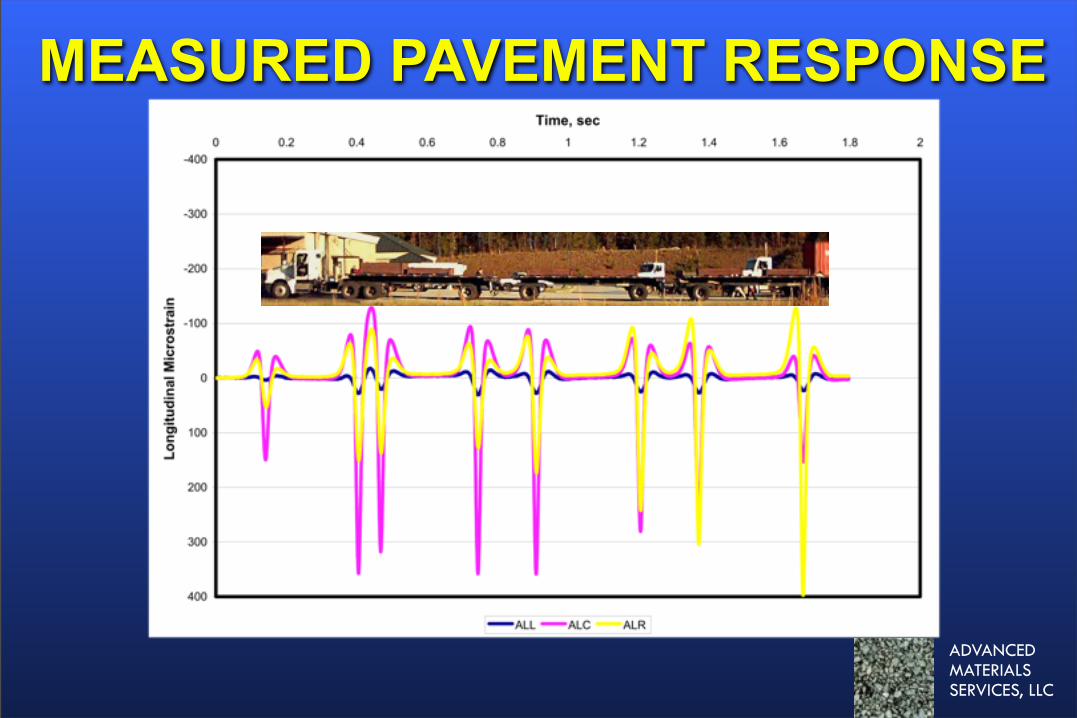
MEASURED PAVEMENT RESPONSE

ADVANCED MATERIALSSERVICES, LLC

ADVANCED MATERIALSSERVICES, LLC
Climate

ADVANCED MATERIALSSERVICES, LLC
Enhanced Integrated Climatic Model
• Weather station or location• Heat capacity, thermal conductivity,
depth of water table• Output
– Calculates every 6 minutes for design life; up to 7 layers. Temperatures collected into 5 “bins” for analysis
– Correction factors to adjust the optimum modulus of unbound layers (moisture and freeze/thaw based)

ADVANCED MATERIALSSERVICES, LLC
Example Temperature Histogram – NCAT Test Track

ADVANCED MATERIALSSERVICES, LLC
Material Properties
ADVANCED MATERIALSSERVICES, LLC
Unbound Layers• Level I – Resilient modulus using stress
dependent FEM. Not calibrated at this time!
• Level II – Resilient Modulus based on correlations with empirical tests– Can use other M-E program to determine
“average” stress dependent modulus (better approach)
ADVANCED MATERIALSSERVICES, LLC
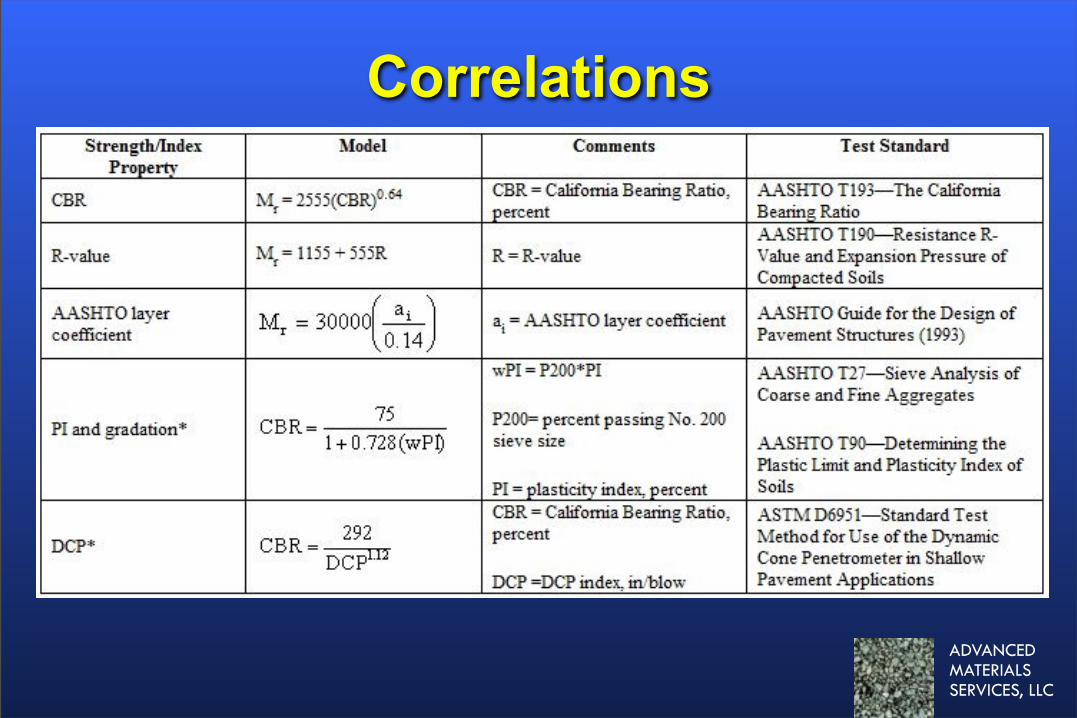
Correlations

ADVANCED MATERIALSSERVICES, LLC
Using Resilient Modulus DataMaterial k1 k2 k3 R2
Granite Base 716.28 0.8468 -0.4632 0.93Subgrade 1878.97 0.4067 -0.7897 0.42
where:Mr = resilient modulus,pa = atmospheric pressure (14.696 psi),θ = bulk stress = σ1+σ2+σ3 = σ1+2σx,y,σ1 = major principal stress = σz + po,σ3 = minor principal stress/confining pressure = σx,y + ko (po)σz = vertical stress from wheel load(s) calculated using layered-elastic theory,σx,y = horizontal stress from wheel load(s) calculated using layered-elastic theory,po = at-rest vertical pressure from overburden of paving layers above unbound layer or subgrade,ko = at-rest earth pressure coefficient,τoct = octahedral shear stress = 1/3((σ1-σ2)2+(σ1-σ3)2+(σ2-σ3)2)1/2, andk1, k2, k3 = regression coefficients.

ADVANCED MATERIALSSERVICES, LLC
Asphalt Inputs• Binder Properties
• Volumetric Properties
• Dynamic Modulus– Levels II and III use Witzak Equation to
predict from gradation, binder and volumetric properties
– Level I test or use Hirsch model
• Low Temperature IDT
ADVANCED MATERIALSSERVICES, LLC
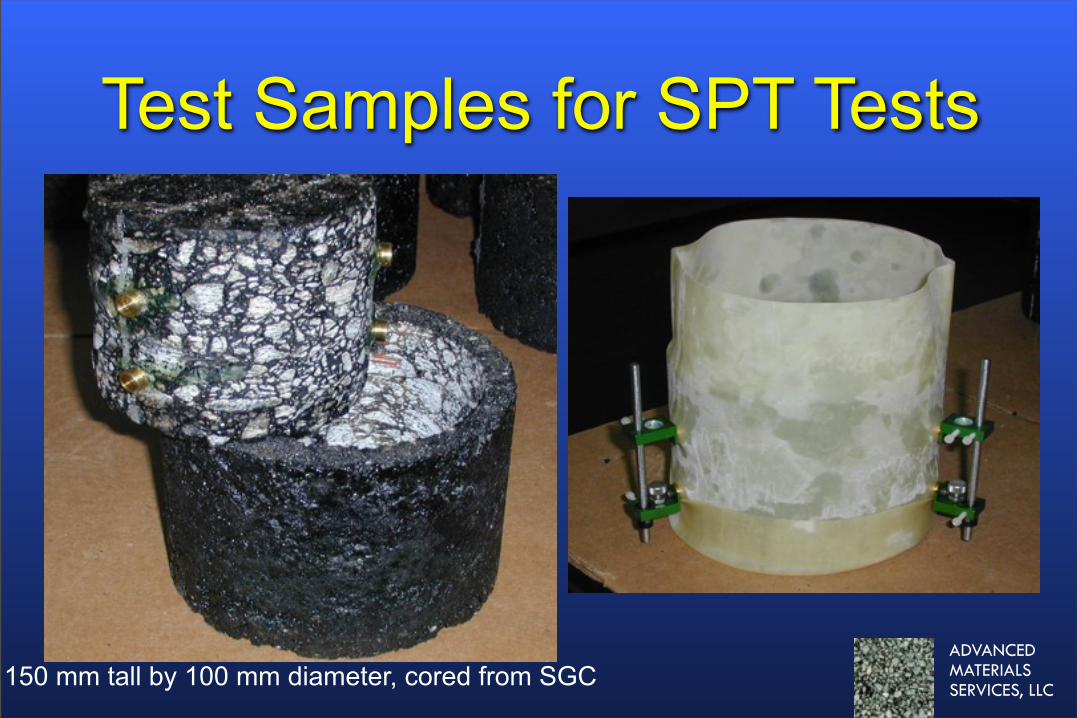
Test Samples for SPT Tests
150 mm tall by 100 mm diameter, cored from SGC

ADVANCED MATERIALSSERVICES, LLC
Dynamic Modulus
φ/ω
σ,ε
Time, t
εoσo
εosin(ωt-φ)
σosin(ωt)

ADVANCED MATERIALSSERVICES, LLC
Faster Traffic orLower Temperatures
Slower Traffic orHigher Temperatures

ADVANCED MATERIALSSERVICES, LLC
Structural Modeling AC Pavements• Multi-layer elastic solution
– Main engine: JULEA
• 2-D Finite element analysis– For special loading conditions,– Non-linear unbound material characterization

ADVANCED MATERIALSSERVICES, LLC
How well does it work?

ADVANCED MATERIALSSERVICES, LLC
Evaluated Using Performance of Structural Sections from 2003

ADVANCED MATERIALSSERVICES, LLC
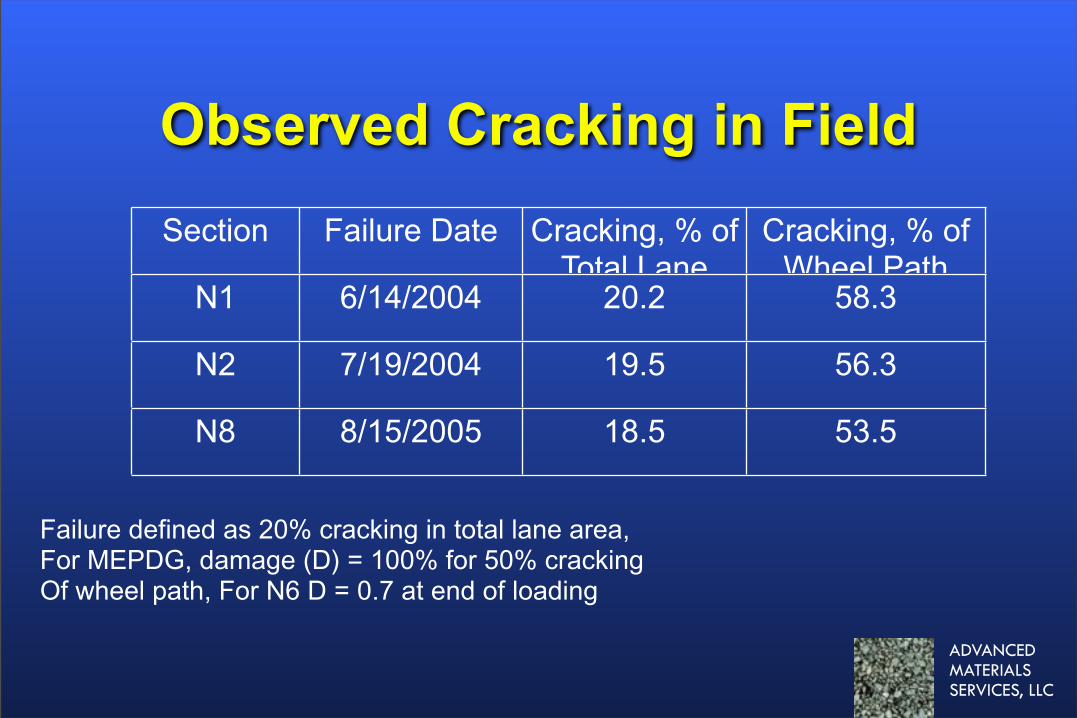
Observed Cracking in Field
ADVANCED MATERIALSSERVICES, LLC
Observed Cracking in FieldSection Failure Date Cracking, % of
Total Lane Area
Cracking, % of Wheel Path
AreaN1 6/14/2004 20.2 58.3
N2 7/19/2004 19.5 56.3
N8 8/15/2005 18.5 53.5
Failure defined as 20% cracking in total lane area,For MEPDG, damage (D) = 100% for 50% crackingOf wheel path, For N6 D = 0.7 at end of loading

ADVANCED MATERIALSSERVICES, LLC
MEPDG Cracking N1

ADVANCED MATERIALSSERVICES, LLC

ADVANCED MATERIALSSERVICES, LLC
MEPDG N2 and N6
ADVANCED MATERIALSSERVICES, LLC
Using Endurance Limit for Pavement Design
Perpetual Pavements

ADVANCED MATERIALSSERVICES, LLC
Definition of the Endurance Limit
HMA Fatigue Endurance Limit – A level of strain below which there is no cumulative damage over an indefinite number of load cycles.
From NCHRP 9-44 HMA Endurance Limit Workshop, August 2007

ADVANCED MATERIALSSERVICES, LLC
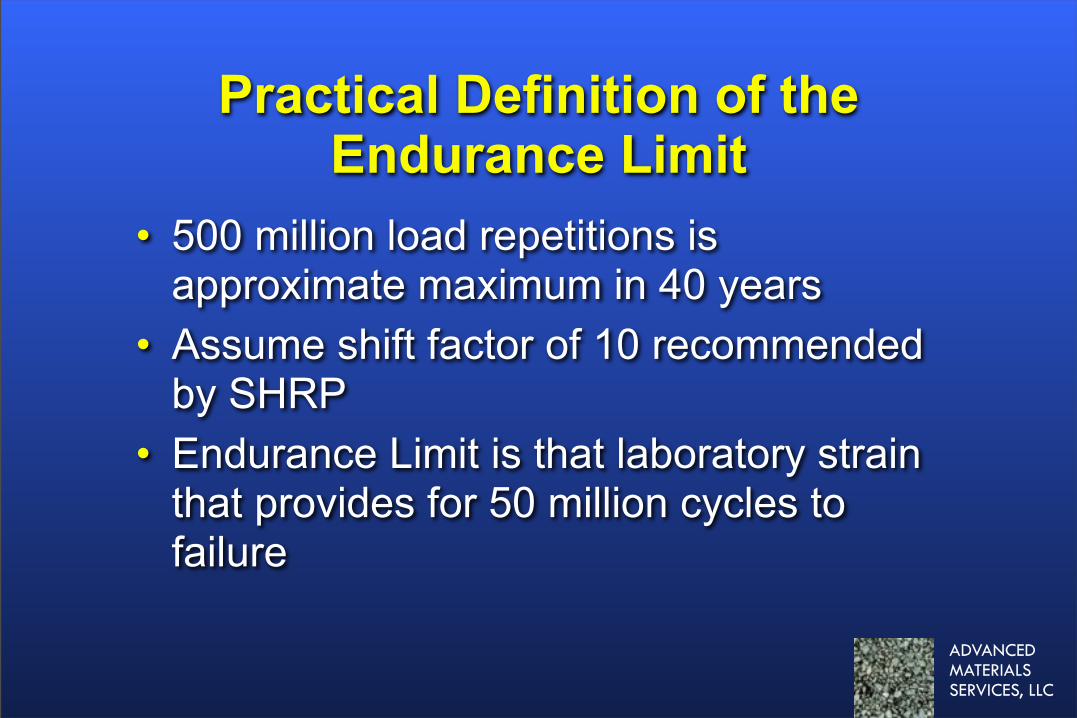
Practical Definition of the Endurance Limit
• Nunn defined long-life pavement as those that last 40 years without structural strengthening
ADVANCED MATERIALSSERVICES, LLC
Practical Definition of the Endurance Limit
• 500 million load repetitions is approximate maximum in 40 years
• Assume shift factor of 10 recommended by SHRP
• Endurance Limit is that laboratory strain that provides for 50 million cycles to failure

ADVANCED MATERIALSSERVICES, LLC
Regions of Fatigue Behavior
DeBenedetto, 1996

ADVANCED MATERIALSSERVICES, LLC
Regions of Fatigue Behavior
DeBenedetto, 1996
50% Initial Stiffness

ADVANCED MATERIALSSERVICES, LLC
BeamFatigue

ADVANCED MATERIALSSERVICES, LLC
AASHTO T321 - Beam Fatigue Test Results
ß1 = shift factor Between lab and field

ADVANCED MATERIALSSERVICES, LLC
Transfer Function Coefficients from Beam Fatigue TestingMix K1 K2 R2 Endurance
Limit, msPG 67-22 7.19E-15 5.78 0.99 151
PG 67-22 Opt.+ 4.42E-09 4.11 0.98 158
PG 76-22 4.66E-12 5.05 0.92 146
All 19.0 mm NMAS mix with same aggregate,Opt.+ has additional 0.7% asphalt

ADVANCED MATERIALSSERVICES, LLC
Fatigue Shift Factor• Laboratory fatigue tests underestimate
field fatigue life, e.g. number of repetitions to some level of cracking
• Shift factor accounts for difference– Ranges from 10 to 100– SHRP recommended 10 – used in NCHRP
9-38
• Accounts for factors such as healing,


PG 67-22 at Optimum
ADVANCED MATERIALSSERVICES, LLC
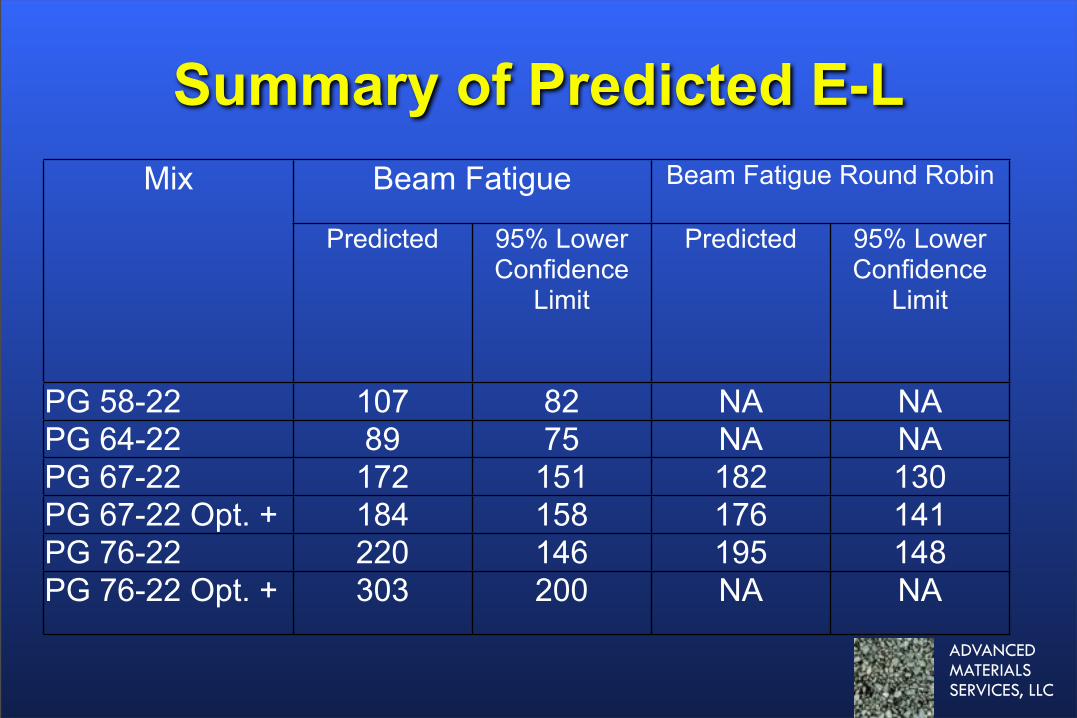
Mix Beam FatigueBeam Fatigue Beam Fatigue Round RobinBeam Fatigue Round RobinMix
Predicted 95% Lower Confidence
Limit
Predicted 95% Lower Confidence
Limit
PG 58-22 107 82 NA NAPG 64-22 89 75 NA NAPG 67-22 172 151 182 130PG 67-22 Opt. + 184 158 176 141PG 76-22 220 146 195 148PG 76-22 Opt. + 303 200 NA NA
Summary of Predicted E-L

ADVANCED MATERIALSSERVICES, LLC
Sensitivity AnalysisFour Analyses:
1. Comparison of conventional and perpetual pavement thickness for 2003 NCAT Test Track structural sections and loading conditions
2. Evaluate sensitivity of perpetual pavement thickness for NCAT Test Track traffic
3. Repeat 1. using MEPDG’s Truck Traffic Classification No. 1 for principal arterials
4. Repeat 2. using MEPDG’s Truck Traffic Classification No. 1 for principal arterials
ADVANCED MATERIALSSERVICES, LLC
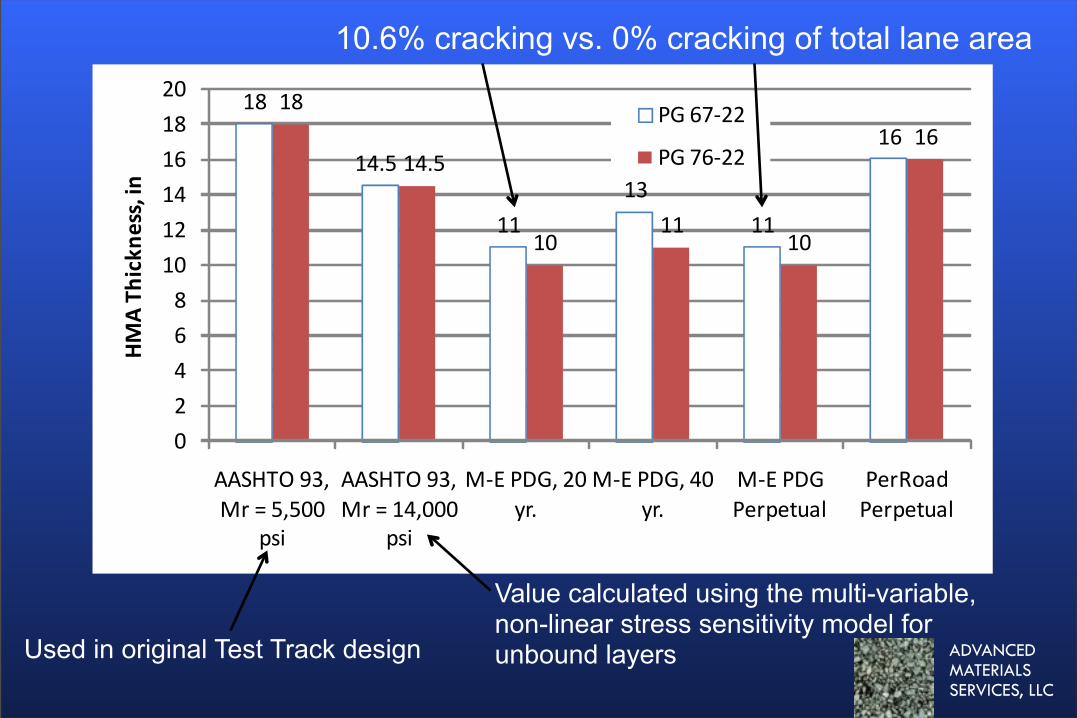
Used in original Test Track design
Value calculated using the multi-variable, non-linear stress sensitivity model for unbound layers
10.6% cracking vs. 0% cracking of total lane area
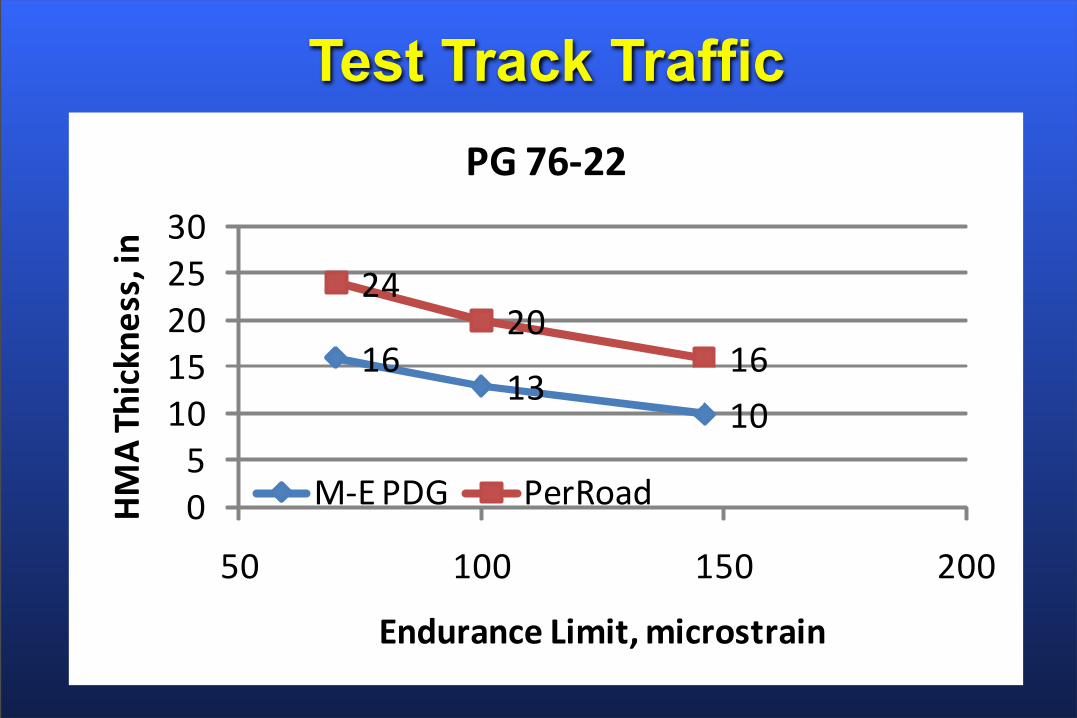
Test Track Traffic
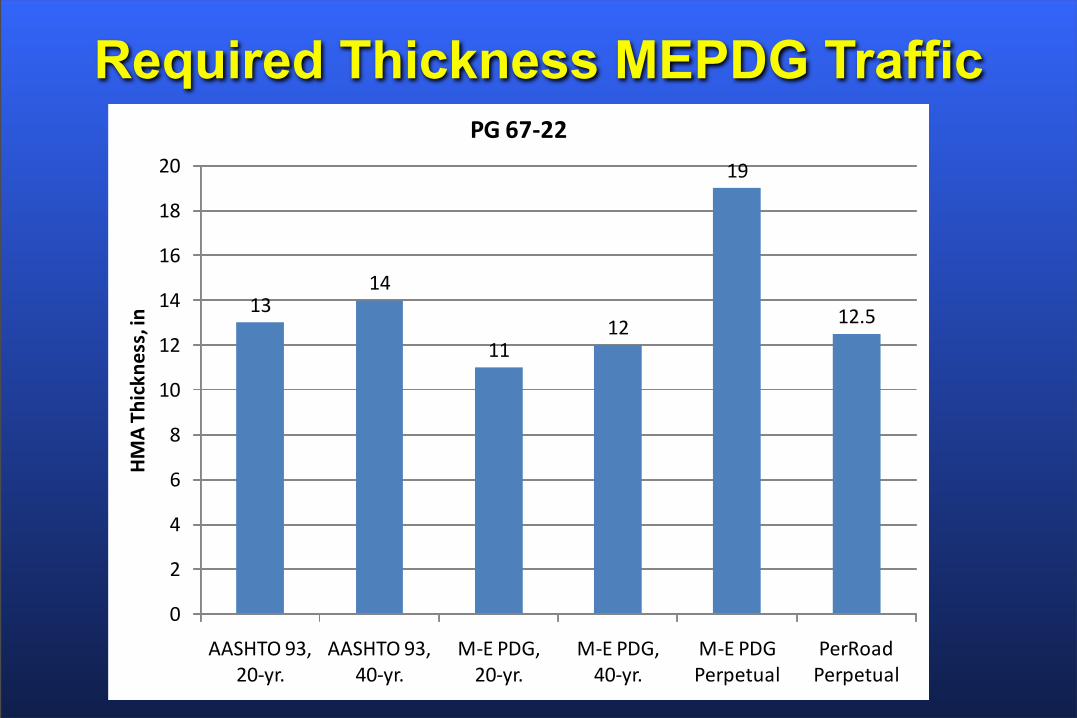
Required Thickness MEPDG Traffic
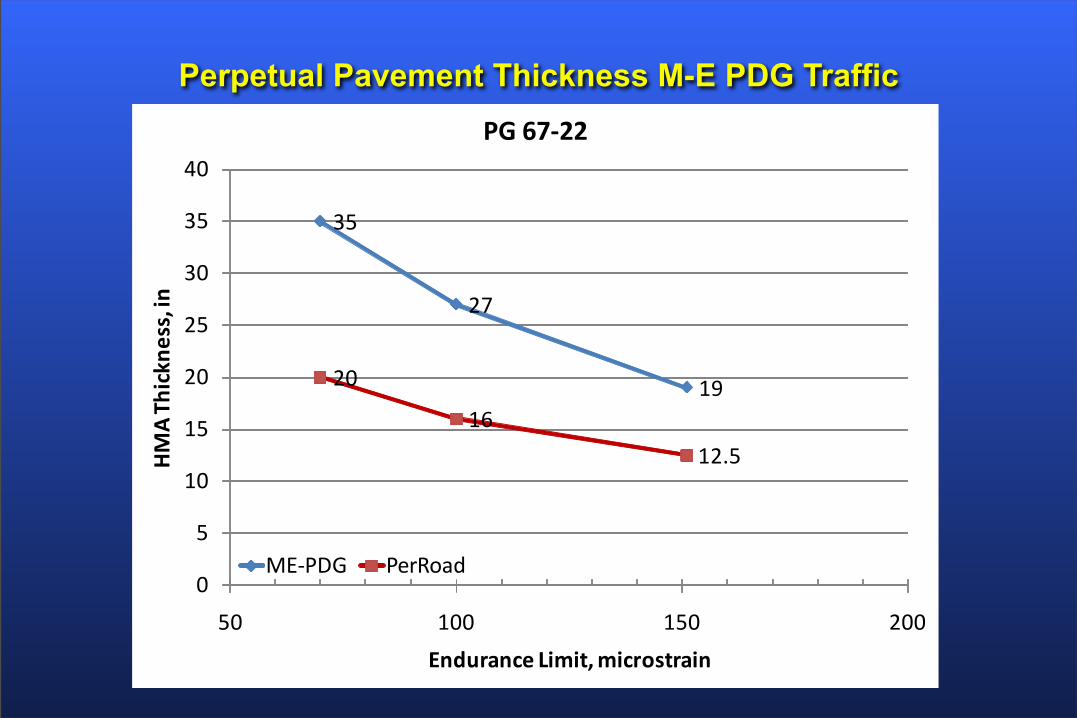
Perpetual Pavement Thickness M-E PDG Traffic

ADVANCED MATERIALSSERVICES, LLC
Summary• Mechanistic-empirical design programs
require more inputs than 93 AASHTO– Some are readily available, some are not
• Nationally calibrated fatigue models appear to do a good job at predicting cracking; rutting overestimated
• M-E PDG and PerRoad can both be used for perpetual designs; M-E PDG more conservative

ADVANCED MATERIALSSERVICES, LLC
Questions?Contact Information:
Brian Prowell
Advanced Material Services, LLC2515 E. Glenn Ave., Suite 107
Auburn, AL 36830


