VALLEY METRO • 101 N 1ST AVE • STE 1300 • PHOENIX AZ • 602-262-7433
MEETING OF THE
Budget and Finance Subcommittee
MEETING DATE
January 15, 2015
TIME 12:00 p.m.
LOCATION Valley Metro 101 N. 1st Ave., 10th Floor Lake Mead Conference Room Phoenix, AZ 85003

VALLEY METRO • 101 N 1ST AVE • STE 1300 • PHOENIX AZ • 602-262-7433
January 5, 2015
Budget and Finance Subcommittee Agenda
Thursday, January 15, 2015 10th Floor, Lake Mead Conference Room
101 N. 1st Avenue, 10th Floor 12:00 p.m.
For those participating by telephone, please mute your phone when not speaking. Action Recommended
1. Public Comment
An opportunity for general public comment on issues related to Valley Metro. Up to three (3) minutes will be provided for each speaker.
For information
2. Minutes Minutes from the October 9, 2014 BFS meeting are presented for approval.
For action
3. FY15 Second Quarter Reports John McCormack will present the Second Quarter 2015 Operating and Capital results.
For information
4. FY15 Mid-Year Budget Adjustment John McCormack will present the FY15 Mid-Year Budget Adjustment for recommendation to forward to the Boards of Directors.
For action
5. Transit Performance Report John McCormack will present an overview of the FY14 TPR results.
For information
2
6. Future BFS Agenda Items Chair Sherwood will request future BFS agenda items from members.
7. Next Meeting The next meeting of the BFS is tentatively scheduled for Thursday, March 12, 2015 at 12:00 p.m.
For information
Qualified sign language interpreters are available with 72 hours notice. Materials in alternative formats (large print, audiocassette, or computer diskette) are available upon request. For further information, please call Rosalia Castro, Valley Metro at 602-495-8211 or TTY at 602-251-2039. To attend this meeting via teleconference, contact the receptionist at 602-262-7433 for the dial-in-information. The supporting information for this agenda can be found on our web site at www.valleymetro.org

11
VALLEY METRO • 101 N 1ST AVE • STE 1300 • PHOENIX AZ • 602-262-7433
DATE AGENDA ITEM 1 January 5, 2015 SUBJECT Public Comment PURPOSE For information BACKGROUND/DISCUSSION/CONSIDERATION An opportunity for general public comment on issues related to Valley Metro. Up to three (3) minutes will be provided to each speaker. COST AND BUDGET None COMMITTEE PROCESS None RECOMMENDATION For information only CONTACT John P. McCormack Chief Financial Officer 602-495-8239 [email protected] ATTACHMENTS None
1
2
VALLEY METRO • 101 N 1ST AVE • STE 1300 • PHOENIX AZ • 602-262-7433
DATE AGENDA ITEM 2 January 5, 2015
Summary Minutes of the Budget and Finance Subcommittee
October 9, 2014 Lake Mead Conference Room
Phoenix, AZ 12:00 p.m.
Meeting Participants Councilmember, Gary Sherwood, City of Glendale Councilmember, Jenn Daniels, Town of Gilbert (via phone) Vice Mayor, Joe Pizzillo, City of Goodyear Chair McDonald called the meeting to order at 12:14 p.m. 1. Public Comment
None 2. Summary Minutes IT WAS MOTIONED BY COUNCILMEMBER SHERWOOD, MOVED BY COUNCILMEMBER DANIELS, SECONDED BY VICE MAYOR PIZZILLO, AND UNANIMOUSLY CARRIED TO APPROVE THE MAY 15, 2014 BUDGET AND FINANCE SUBCOMMITTEE (BFS) SUMMARY MEETING MINUTES.
2
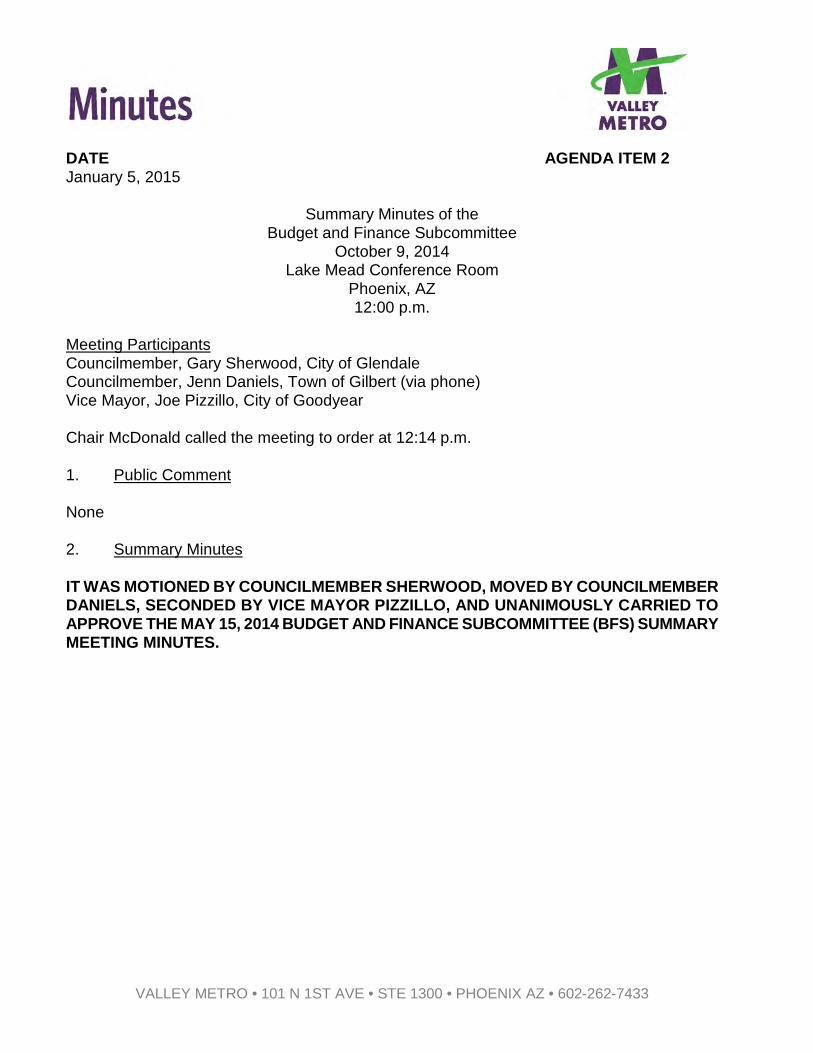
3. FY14 Year-End Update
Valley MetroFiscal Year 2014Financial Results
Budget and Finance SubcommitteeOctober 9, 2014
Councilmember Sherwood introduced John McCormack to present a brief review of the financial highlights of the fiscal year ended June 30, 2013.
Regional Fixed Route Bus Ridership 3-Year Comparison
Regional Fixed Route Ridership was up by 1.3 million passenger rides; a 2.2% decrease over last year.
3
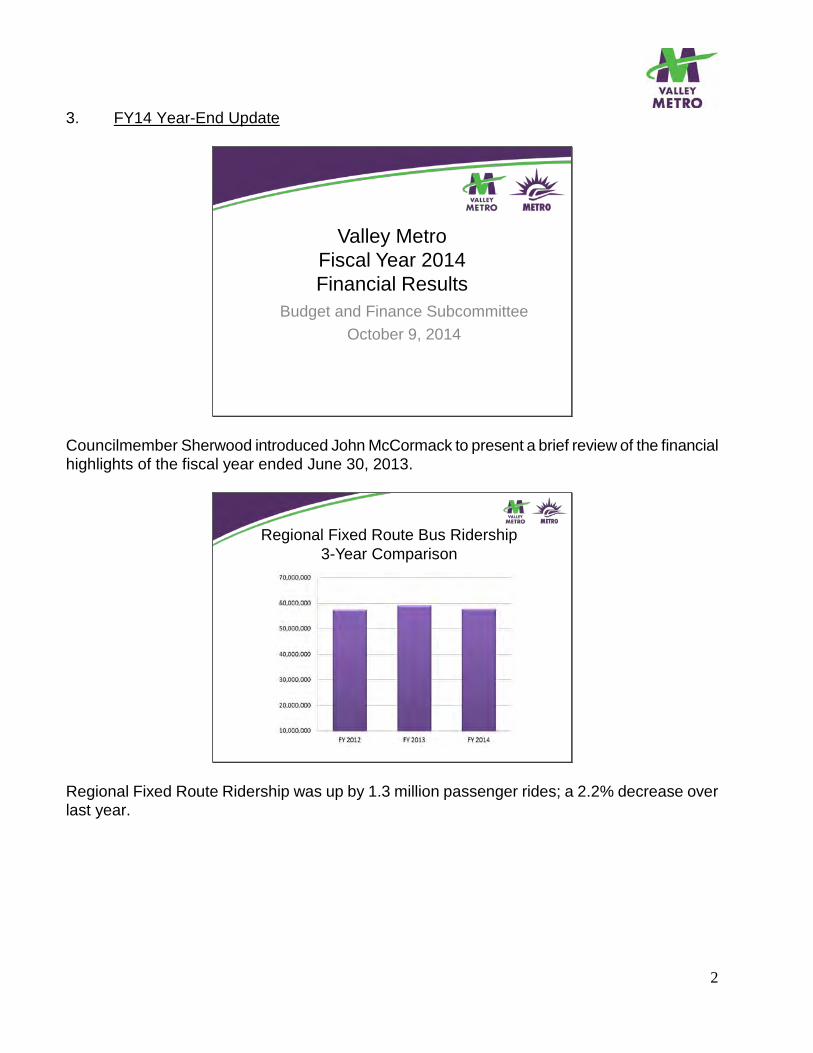
Regional Fixed Route BusAverage Daily Ridership
Average weekday ridership was 195,742, down by 8,278 from FY13, or -4.1%. Saturday average ridership was 93,554, down by 3,230 or -3.3%. Sunday average ridership was 64,526, down by 1,088 or -1.7%.
Light Rail Ridership3-Year Comparison
Light rail ridership grew slightly over FY13 to 45,395 additional riders, or 0.3%. Ridership was up 5% the prior year.
4
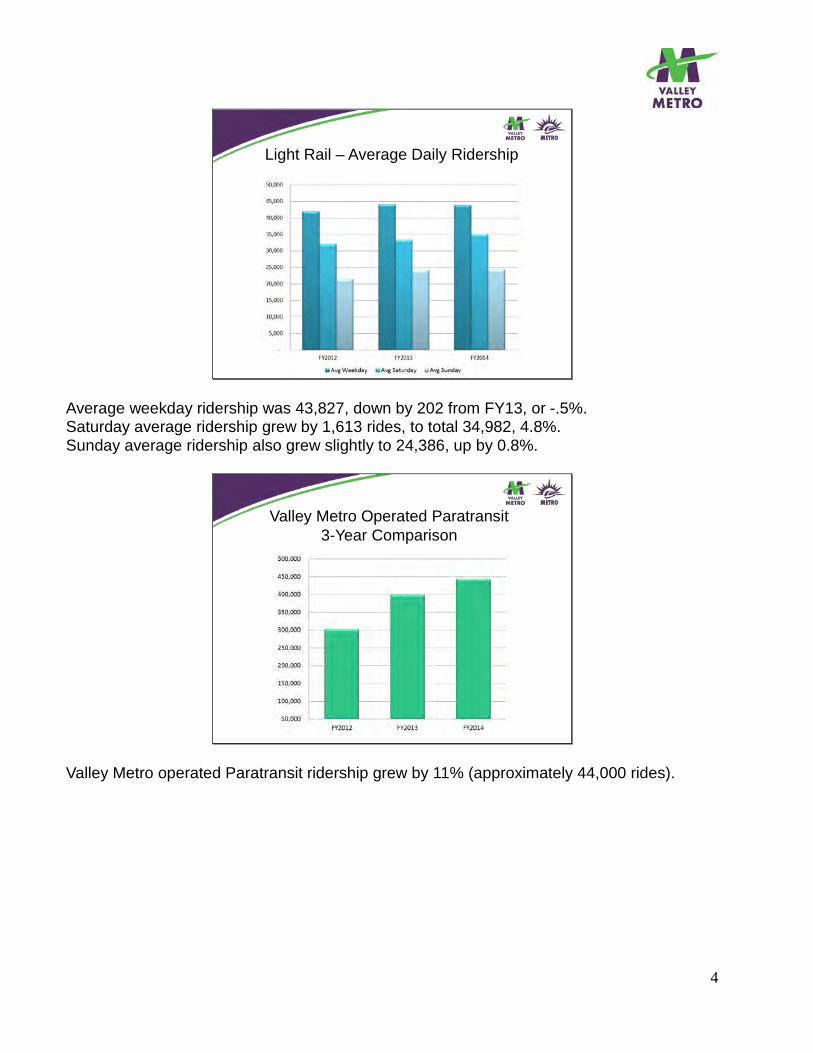
Light Rail – Average Daily Ridership
Average weekday ridership was 43,827, down by 202 from FY13, or -.5%. Saturday average ridership grew by 1,613 rides, to total 34,982, 4.8%. Sunday average ridership also grew slightly to 24,386, up by 0.8%.
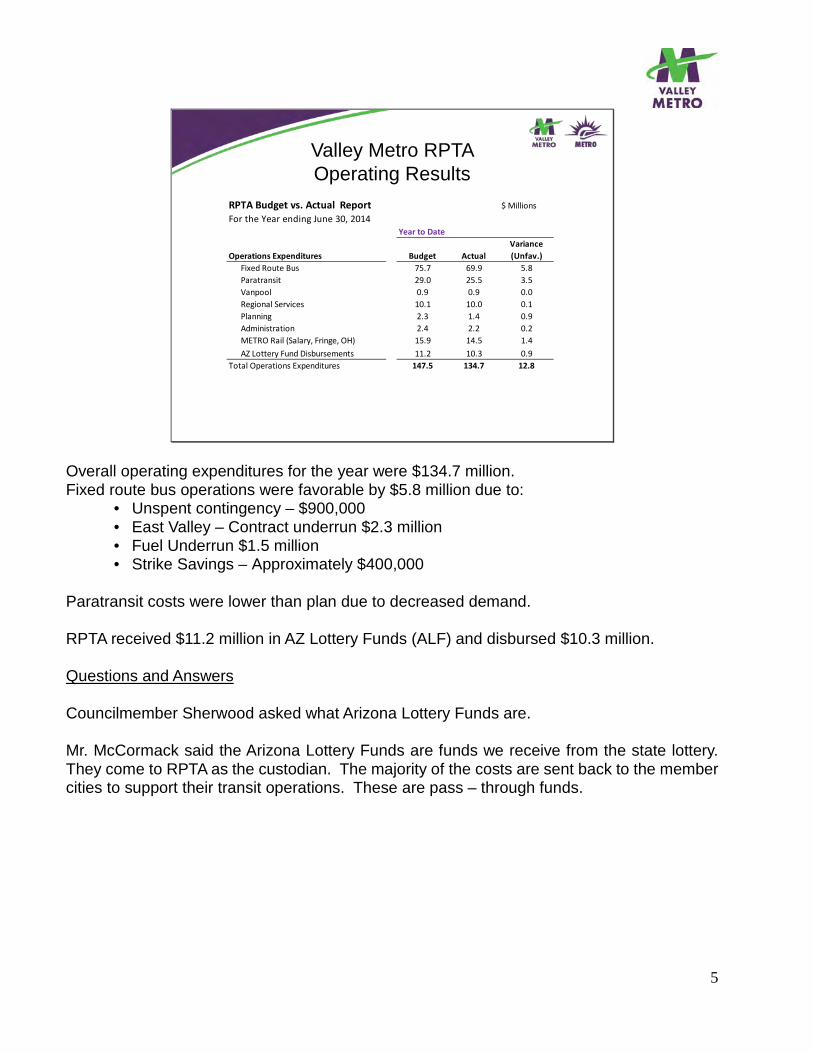
Valley Metro Operated Paratransit3-Year Comparison
Valley Metro operated Paratransit ridership grew by 11% (approximately 44,000 rides).
5
Valley Metro RPTA Operating Results
RtTA Budget vs. Actual Report $ aillionsFor the Year ending June 30, 2014
Year to Date
Operations Expenditures Budget ActualVariance (Unfav.)
Fixed Route Bus 75.7 69.9 5.8taratransit 29.0 25.5 3.5Vanpool 0.9 0.9 0.0Regional Services 10.1 10.0 0.1tlanning 2.3 1.4 0.9Administration 2.4 2.2 0.2aETRO Rail (Salary, Fringe, OH) 15.9 14.5 1.4AZ Lottery Fund Disbursements 11.2 10.3 0.9
Total Operations Expenditures 147.5 134.7 12.8
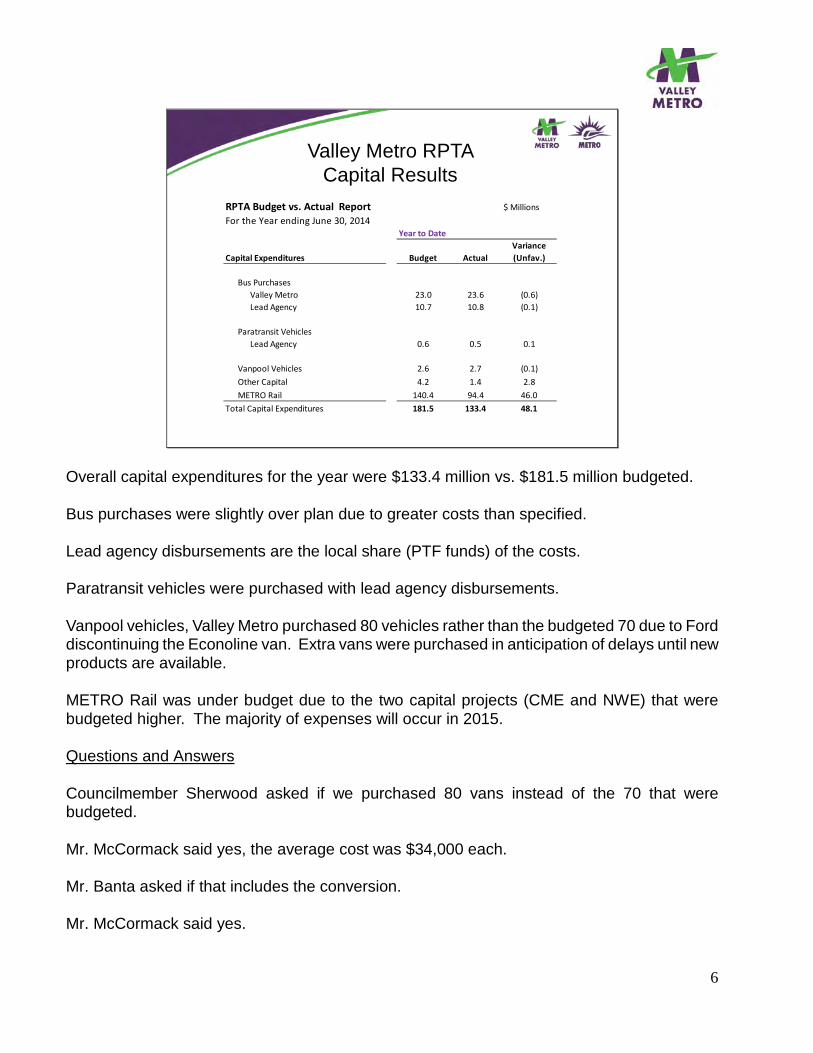
Overall operating expenditures for the year were $134.7 million. Fixed route bus operations were favorable by $5.8 million due to:
• Unspent contingency – $900,000 • East Valley – Contract underrun $2.3 million • Fuel Underrun $1.5 million • Strike Savings – Approximately $400,000
Paratransit costs were lower than plan due to decreased demand. RPTA received $11.2 million in AZ Lottery Funds (ALF) and disbursed $10.3 million. Questions and Answers Councilmember Sherwood asked what Arizona Lottery Funds are. Mr. McCormack said the Arizona Lottery Funds are funds we receive from the state lottery. They come to RPTA as the custodian. The majority of the costs are sent back to the member cities to support their transit operations. These are pass – through funds.
6
Valley Metro RPTA Capital Results
RtTA Budget vs. Actual Report $ aillionsFor the Year ending June 30, 2014
Year to Date
Capital Expenditures Budget ActualVariance (Unfav.)
Bus turchasesValley aetro 23.0 23.6 (0.6)Lead Agency 10.7 10.8 (0.1)
taratransit VehiclesLead Agency 0.6 0.5 0.1
Vanpool Vehicles 2.6 2.7 (0.1)Other Capital 4.2 1.4 2.8aETRO Rail 140.4 94.4 46.0
Total Capital Expenditures 181.5 133.4 48.1
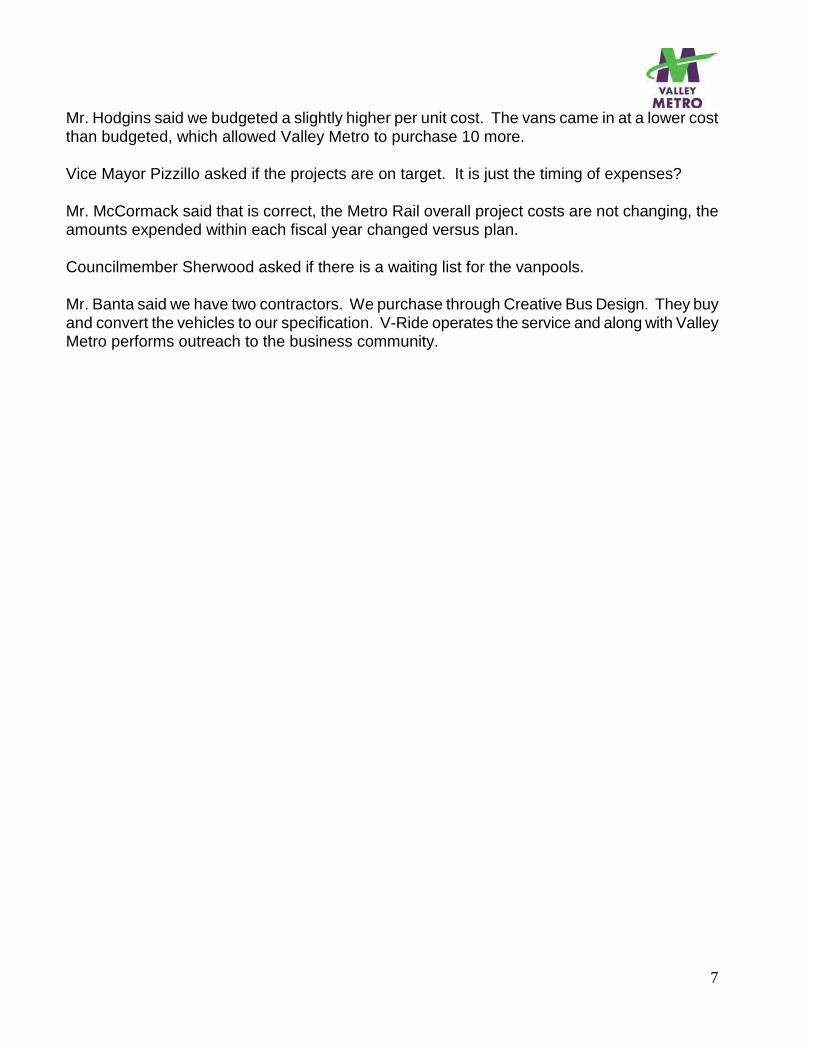
Overall capital expenditures for the year were $133.4 million vs. $181.5 million budgeted. Bus purchases were slightly over plan due to greater costs than specified. Lead agency disbursements are the local share (PTF funds) of the costs. Paratransit vehicles were purchased with lead agency disbursements. Vanpool vehicles, Valley Metro purchased 80 vehicles rather than the budgeted 70 due to Ford discontinuing the Econoline van. Extra vans were purchased in anticipation of delays until new products are available. METRO Rail was under budget due to the two capital projects (CME and NWE) that were budgeted higher. The majority of expenses will occur in 2015. Questions and Answers Councilmember Sherwood asked if we purchased 80 vans instead of the 70 that were budgeted. Mr. McCormack said yes, the average cost was $34,000 each. Mr. Banta asked if that includes the conversion. Mr. McCormack said yes.
7
Mr. Hodgins said we budgeted a slightly higher per unit cost. The vans came in at a lower cost than budgeted, which allowed Valley Metro to purchase 10 more. Vice Mayor Pizzillo asked if the projects are on target. It is just the timing of expenses? Mr. McCormack said that is correct, the Metro Rail overall project costs are not changing, the amounts expended within each fiscal year changed versus plan. Councilmember Sherwood asked if there is a waiting list for the vanpools. Mr. Banta said we have two contractors. We purchase through Creative Bus Design. They buy and convert the vehicles to our specification. V-Ride operates the service and along with Valley Metro performs outreach to the business community.
8
Valley Metro RPTA Cash and Investments
FY13 vs. FY14
Account Description Type of Funds Balance at 6.30.2013
Balance at 6.30.2014 Change
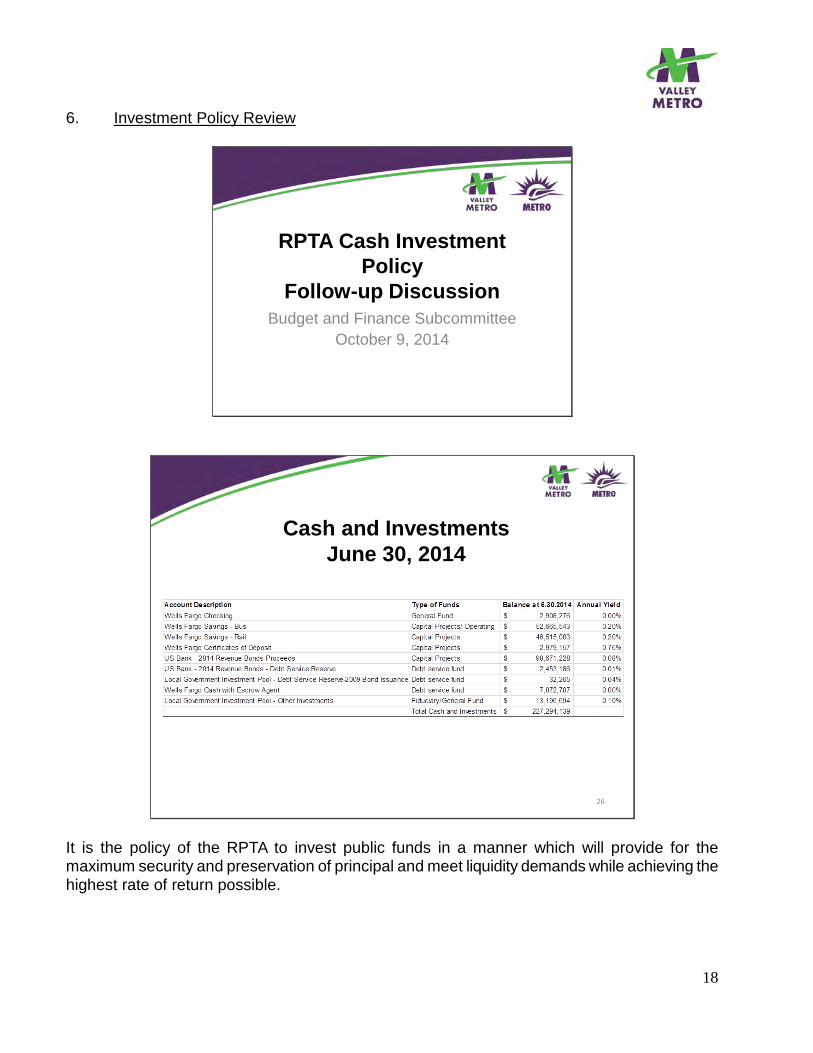
Wells Fargo Checking General Fund 5,439,673 2,908,276 (2,531,397)
Wells Fargo Savings Capital Projects/Operating Reserves 103,127,288 99,180,546 (3,946,742)
Wells Fargo Trust- 2009 Bond Funds Capital Projects 14,688,406 - (14,688,406)
Wells Fargo Certificates of Deposit Capital Projects - 2,979,157 2,979,157
US Bank - 2014 Revenue Bonds Proceeds Capital Projects - 98,671,228 98,671,228
US Bank - 2014 Revenue Bonds - Debt Service Reserve Debt service fund - 2,453,186 2,453,186 Local Government Investment Pool - Debt Service Reserve - 2009 Bond Issuance Debt service fund 144,768 32,265 (112,503)
Wells Fargo Cash with Escrow Agent Debt service fund - 7,872,787 7,872,787
Local Government Investment Pool - Other Investments Fiduciary/General Fund 7,359,298 13,196,694 5,837,396 Total Cash and Investments 130,759,433 227,294,139 96,534,706
Summary of Bond Funds 14,833,174 109,029,466 94,196,292
All Other Cash Reserves 115,926,259 118,264,673 2,338,414
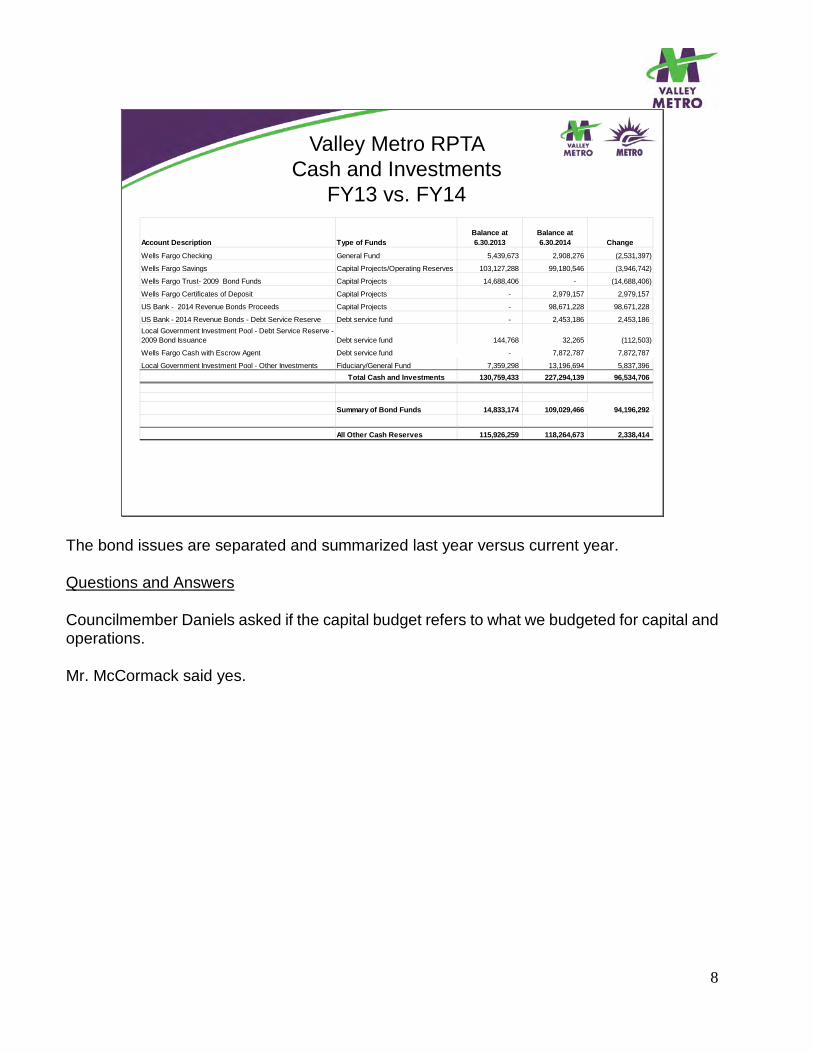
The bond issues are separated and summarized last year versus current year. Questions and Answers Councilmember Daniels asked if the capital budget refers to what we budgeted for capital and operations. Mr. McCormack said yes.
9
4. FY15 First Quarter
Finance FY15 Q1 Report
Budget and Finance SubcommitteeOctober 9, 2014
Valley Metro RPTA Operating Results – Q1
12
RtTA Budget vs. Actual Report $ aillionsFor the quarter ending September 30, 2014
1st Quarter Year to Date
Operations Expenditures Budget ActualVariance (Unfav.) Budget Actual
Variance (Unfav.)
Fixed Route Bus 20.3 20.0 0.3 20.3 20.0 0.3taratransit 6.9 6.5 0.4 6.9 6.5 0.4Vanpool 0.2 0.2 0.0 0.2 0.2 0.0Regional Services 2.8 2.3 0.5 2.8 2.3 0.5tlanning 0.9 0.8 0.1 0.9 0.8 0.1Administration 0.6 0.6 0.0 0.6 0.6 0.0aETRO Rail (Salary, Fringe, OH) 3.9 3.7 0.2 3.9 3.7 0.2
Total Operations Expenditures 35.6 34.1 1.5 35.6 34.1 1.5
Agency FTE's Budget vs. ActualFor the quarter ending September 30, 2014
1st Quarter
Valley aetro Integrated Budget ActualVariance (Unfav.)
Staff (Full Time Equivalents) 296 266 30
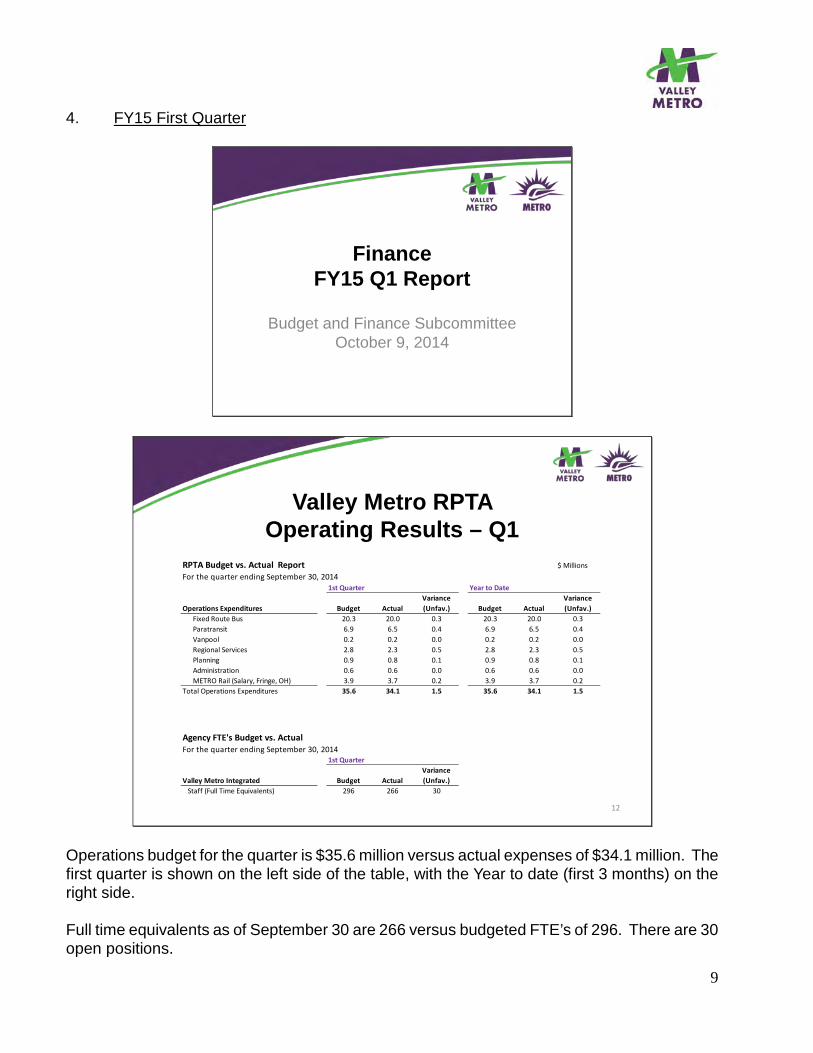
Operations budget for the quarter is $35.6 million versus actual expenses of $34.1 million. The first quarter is shown on the left side of the table, with the Year to date (first 3 months) on the right side. Full time equivalents as of September 30 are 266 versus budgeted FTE’s of 296. There are 30 open positions.
10
Open Positions Status
13
Valley aetro Integrated AgencyFY 2015 Adopted tositions - Status Update
FY14 - Q4 FY15 - Q1
DivisionJune Open
Septempber Open
Operations and aaintenance 15 20Administrative & Organizational Development 2 1tlanning & Development 2 3Safety & Security 2 3Communication & aarketing 1 1Design & Construction 0 1Finance 1 1
Total Open tositions 23 308% 10%
Total Authorized tositions 288 296
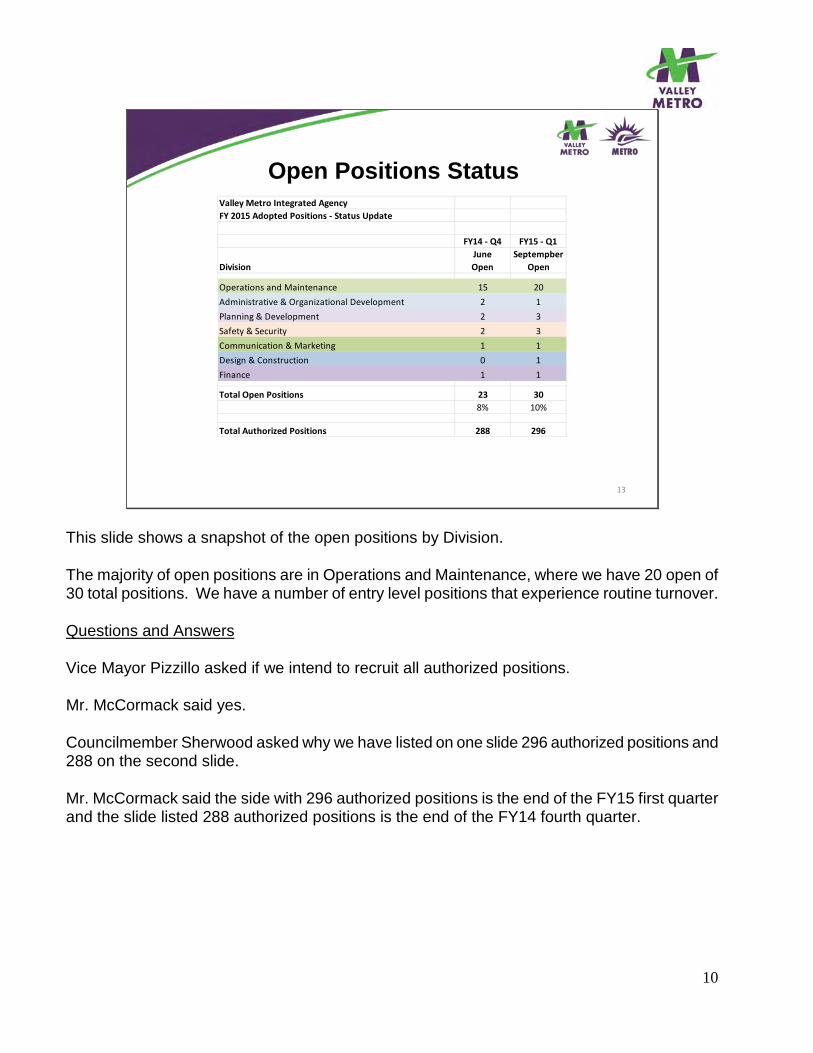
This slide shows a snapshot of the open positions by Division. The majority of open positions are in Operations and Maintenance, where we have 20 open of 30 total positions. We have a number of entry level positions that experience routine turnover. Questions and Answers Vice Mayor Pizzillo asked if we intend to recruit all authorized positions. Mr. McCormack said yes. Councilmember Sherwood asked why we have listed on one slide 296 authorized positions and 288 on the second slide. Mr. McCormack said the side with 296 authorized positions is the end of the FY15 first quarter and the slide listed 288 authorized positions is the end of the FY14 fourth quarter.
11
Valley Metro RPTA Capital Results – Q1
14
RtTA Budget vs. Actual Report $ aillionsFor the quarter ending September 30, 2014
1st Quarter Year to Date
Capital Expenditures Budget ActualVariance (Unfav.) Budget Actual
Variance (Unfav.)
Bus turchasesValley aetro 2.6 0.0 2.6 2.6 0.0 2.6Lead Agency 1.3 0.0 1.3 1.3 0.0 1.3
taratransit VehiclesLead Agency 0.1 0.0 0.1 0.1 0.0 0.1
Vanpool Vehicles 1.1 0.0 1.1 1.1 0.0 1.1Other Capital 4.3 0.0 4.3 4.3 0.0 4.3aETRO Rail 27.3 32.3 (5.0) 27.3 32.3 (5.0)
Total Capital Expenditures 36.7 32.3 4.4 36.7 32.3 4.4
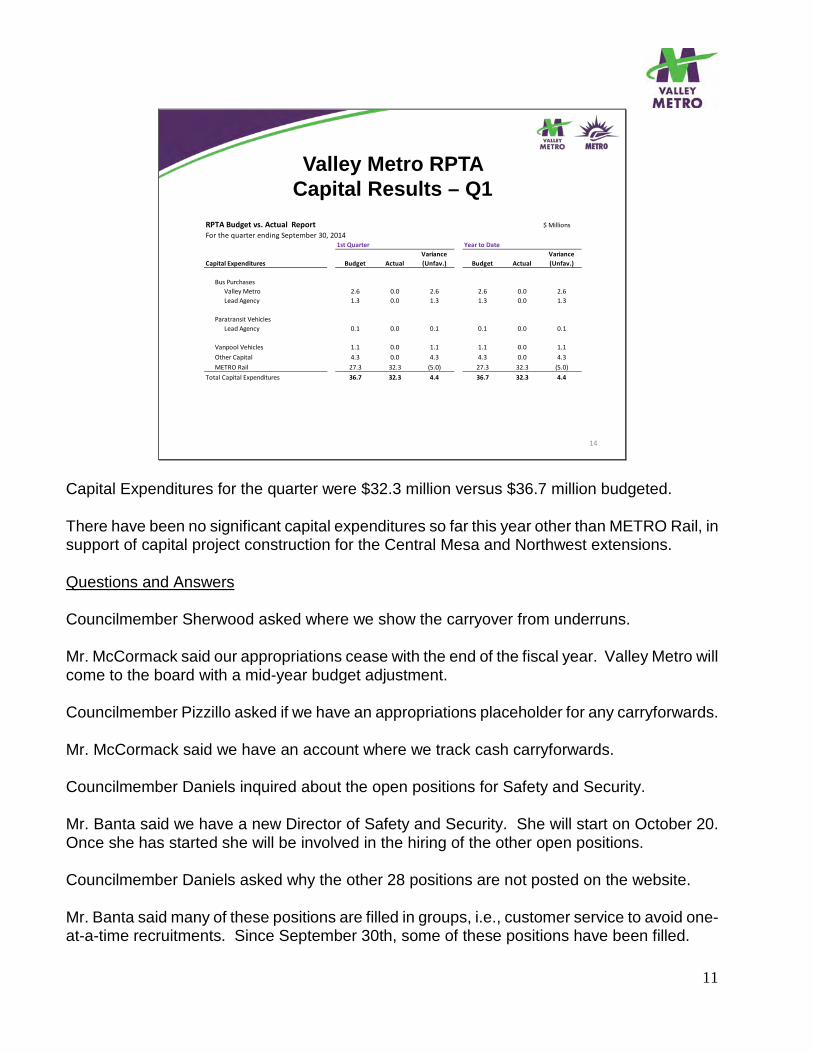
Capital Expenditures for the quarter were $32.3 million versus $36.7 million budgeted. There have been no significant capital expenditures so far this year other than METRO Rail, in support of capital project construction for the Central Mesa and Northwest extensions. Questions and Answers Councilmember Sherwood asked where we show the carryover from underruns. Mr. McCormack said our appropriations cease with the end of the fiscal year. Valley Metro will come to the board with a mid-year budget adjustment. Councilmember Pizzillo asked if we have an appropriations placeholder for any carryforwards. Mr. McCormack said we have an account where we track cash carryforwards. Councilmember Daniels inquired about the open positions for Safety and Security. Mr. Banta said we have a new Director of Safety and Security. She will start on October 20. Once she has started she will be involved in the hiring of the other open positions. Councilmember Daniels asked why the other 28 positions are not posted on the website. Mr. Banta said many of these positions are filled in groups, i.e., customer service to avoid one-at-a-time recruitments. Since September 30th, some of these positions have been filled.
12
Councilmember Sherwood asked what percentage is normally in flux. Mr. McCormack said 8%. Councilmember Daniels requests a quarterly update on open positions.
13
5. Staffing Benchmarks
Staffing LevelComparative Metrics
Budget and Finance SubcommitteeOctober 9, 2014
Councilmember Sherwood introduced John McCormack.
14
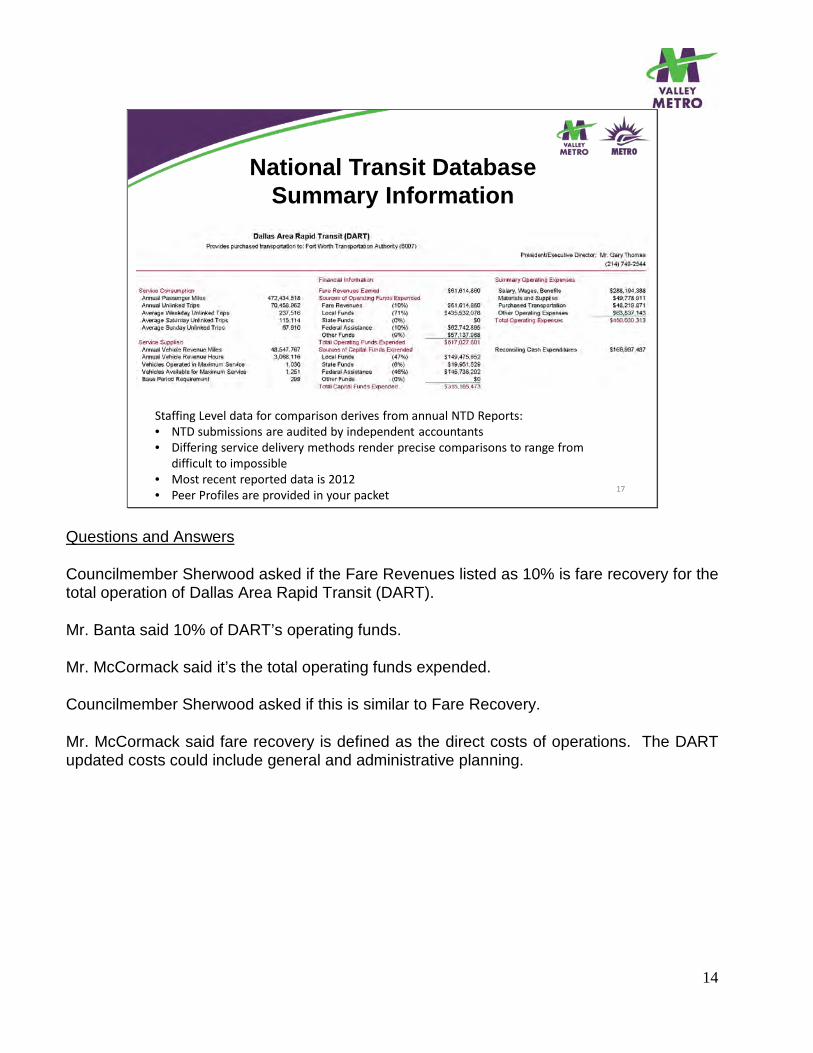
National Transit DatabaseSummary Information
17
Staffing Level data for comparison derives from annual bTD Reports:• bTD submissions are audited by independent accountants• Differing service delivery methods render precise comparisons to range from
difficult to impossible• aost recent reported data is 2012• teer trofiles are provided in your packet
Questions and Answers Councilmember Sherwood asked if the Fare Revenues listed as 10% is fare recovery for the total operation of Dallas Area Rapid Transit (DART). Mr. Banta said 10% of DART’s operating funds. Mr. McCormack said it’s the total operating funds expended. Councilmember Sherwood asked if this is similar to Fare Recovery. Mr. McCormack said fare recovery is defined as the direct costs of operations. The DART updated costs could include general and administrative planning.
15
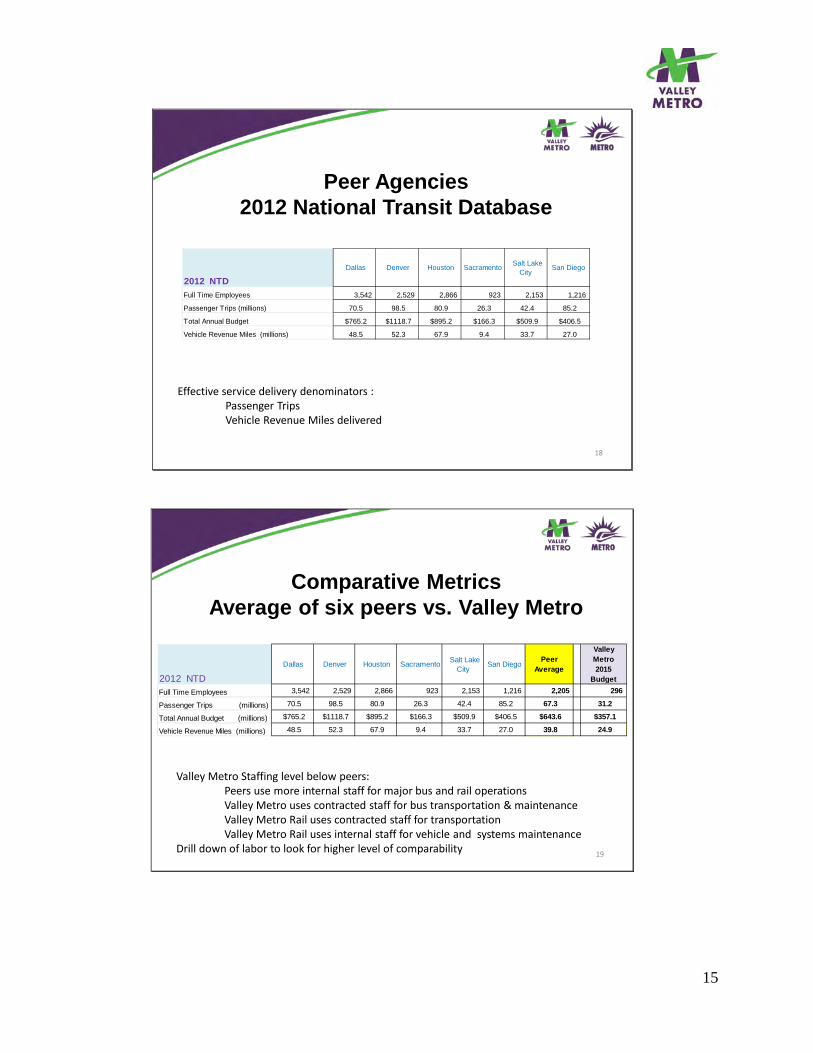
Peer Agencies2012 National Transit Database
18
Effective service delivery denominators :tassenger TripsVehicle Revenue ailes delivered
2012 NTD Dallas Denver Houston Sacramento Salt Lake
CitySan Diego
Full Time Employees 3,542 2,529 2,866 923 2,153 1,216
Passenger Trips (millions) 70.5 98.5 80.9 26.3 42.4 85.2
Total Annual Budget $765.2 $1118.7 $895.2 $166.3 $509.9 $406.5
Vehicle Revenue Miles (millions) 48.5 52.3 67.9 9.4 33.7 27.0
Comparative MetricsAverage of six peers vs. Valley Metro
19
2012 NTD Dallas Denver Houston Sacramento Salt Lake
CitySan Diego
Peer Average
Valley Metro2015
BudgetFull Time Employees 3,542 2,529 2,866 923 2,153 1,216 2,205 296
Passenger Trips (millions) 70.5 98.5 80.9 26.3 42.4 85.2 67.3 31.2
Total Annual Budget (millions) $765.2 $1118.7 $895.2 $166.3 $509.9 $406.5 $643.6 $357.1
Vehicle Revenue Miles (millions) 48.5 52.3 67.9 9.4 33.7 27.0 39.8 24.9
Valley aetro Staffing level below peers:teers use more internal staff for major bus and rail operationsValley aetro uses contracted staff for bus transportation & maintenanceValley aetro Rail uses contracted staff for transportationValley aetro Rail uses internal staff for vehicle and systems maintenance
Drill down of labor to look for higher level of comparability
16
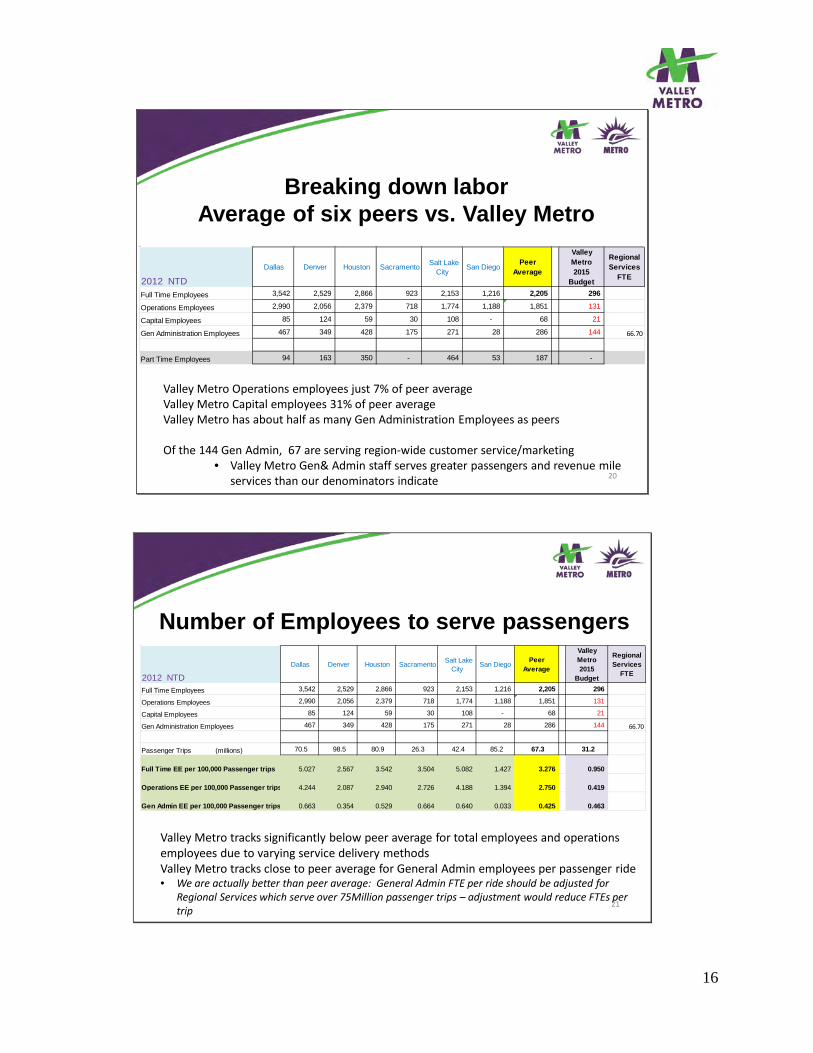
Breaking down laborAverage of six peers vs. Valley Metro
20
2012 NTD Dallas Denver Houston Sacramento Salt Lake
CitySan Diego
Peer Average
Valley Metro2015
Budget
Regional Services
FTE
Full Time Employees 3,542 2,529 2,866 923 2,153 1,216 2,205 296
Operations Employees 2,990 2,056 2,379 718 1,774 1,188 1,851 131
Capital Employees 85 124 59 30 108 - 68 21
Gen Administration Employees 467 349 428 175 271 28 286 144 66.70
Part Time Employees 94 163 350 - 464 53 187 -
Valley aetro Operations employees just 7% of peer average Valley aetro Capital employees 31% of peer average Valley aetro has about half as many Den Administration Employees as peers
Of the 144 Den Admin, 67 are serving region-wide customer service/marketing• Valley aetro Den& Admin staff serves greater passengers and revenue mile
services than our denominators indicate
Number of Employees to serve passengers
21
Valley aetro tracks significantly below peer average for total employees and operations employees due to varying service delivery methodsValley aetro tracks close to peer average for Deneral Admin employees per passenger ride• We are actually better than peer average: General Admin FTE per ride should be adjusted for
Regional Services which serve over 75aillion passenger trips – adjustment would reduce FTEs per trip
2012 NTD Dallas Denver Houston Sacramento Salt Lake
CitySan Diego
Peer Average
Valley Metro2015
Budget
Regional Services
FTE
Full Time Employees 3,542 2,529 2,866 923 2,153 1,216 2,205 296
Operations Employees 2,990 2,056 2,379 718 1,774 1,188 1,851 131
Capital Employees 85 124 59 30 108 - 68 21
Gen Administration Employees 467 349 428 175 271 28 286 144 66.70
Passenger Trips (millions) 70.5 98.5 80.9 26.3 42.4 85.2 67.3 31.2
Full Time EE per 100,000 Passenger trips 5.027 2.567 3.542 3.504 5.082 1.427 3.276 0.950
Operations EE per 100,000 Passenger trips 4.244 2.087 2.940 2.726 4.188 1.394 2.750 0.419
Gen Admin EE per 100,000 Passenger trips 0.663 0.354 0.529 0.664 0.640 0.033 0.425 0.463
17
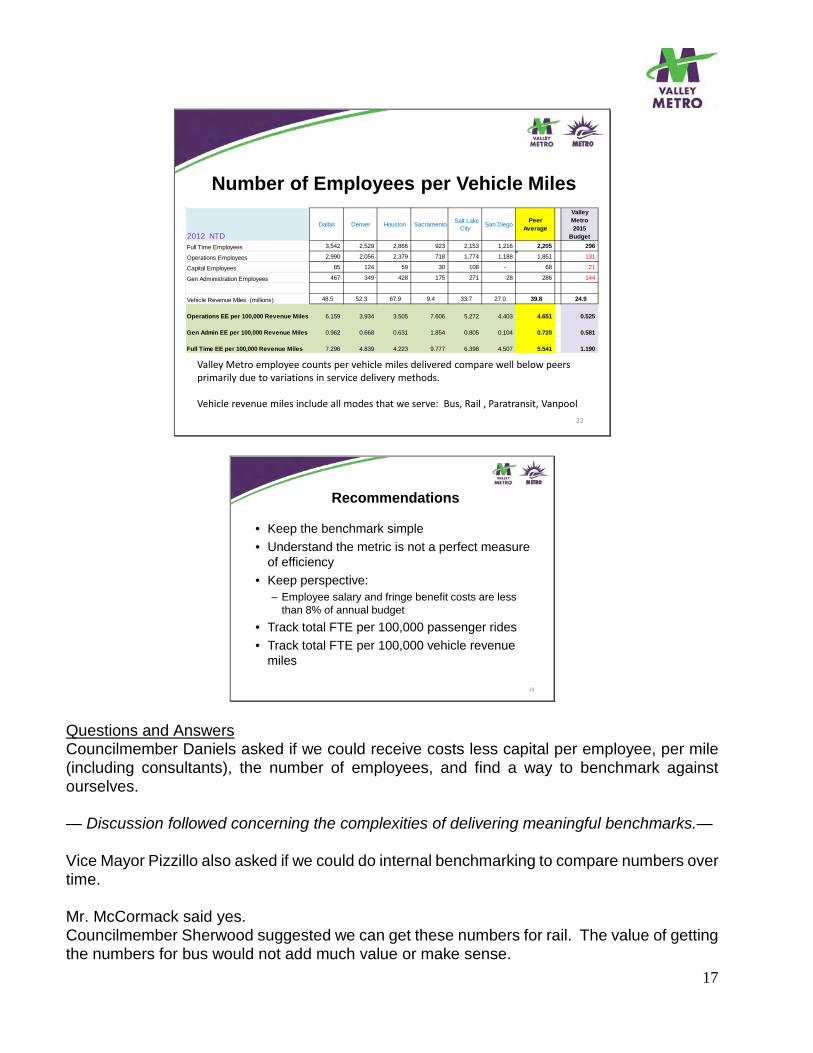
Number of Employees per Vehicle Miles
22
Valley aetro employee counts per vehicle miles delivered compare well below peers primarily due to variations in service delivery methods.
Vehicle revenue miles include all modes that we serve: Bus, Rail , taratransit, Vanpool
2012 NTD Dallas Denver Houston Sacramento Salt Lake
CitySan Diego
Peer Average
Valley Metro2015
BudgetFull Time Employees 3,542 2,529 2,866 923 2,153 1,216 2,205 296
Operations Employees 2,990 2,056 2,379 718 1,774 1,188 1,851 131
Capital Employees 85 124 59 30 108 - 68 21
Gen Administration Employees 467 349 428 175 271 28 286 144
Vehicle Revenue Miles (millions) 48.5 52.3 67.9 9.4 33.7 27.0 39.8 24.9
Operations EE per 100,000 Revenue Miles 6.159 3.934 3.505 7.606 5.272 4.403 4.651 0.525
Gen Admin EE per 100,000 Revenue Miles 0.962 0.668 0.631 1.854 0.805 0.104 0.720 0.581
Full Time EE per 100,000 Revenue Miles 7.296 4.839 4.223 9.777 6.398 4.507 5.541 1.190
Recommendations
23
• Keep the benchmark simple • Understand the metric is not a perfect measure
of efficiency• Keep perspective:
– Employee salary and fringe benefit costs are less than 8% of annual budget
• Track total FTE per 100,000 passenger rides• Track total FTE per 100,000 vehicle revenue
miles
Questions and Answers Councilmember Daniels asked if we could receive costs less capital per employee, per mile (including consultants), the number of employees, and find a way to benchmark against ourselves. — Discussion followed concerning the complexities of delivering meaningful benchmarks.— Vice Mayor Pizzillo also asked if we could do internal benchmarking to compare numbers over time. Mr. McCormack said yes. Councilmember Sherwood suggested we can get these numbers for rail. The value of getting the numbers for bus would not add much value or make sense.
18
6. Investment Policy Review
RPTA Cash InvestmentPolicy
Follow-up DiscussionBudget and Finance Subcommittee
October 9, 2014
Cash and InvestmentsJune 30, 2014
26
It is the policy of the RPTA to invest public funds in a manner which will provide for the maximum security and preservation of principal and meet liquidity demands while achieving the highest rate of return possible.
19
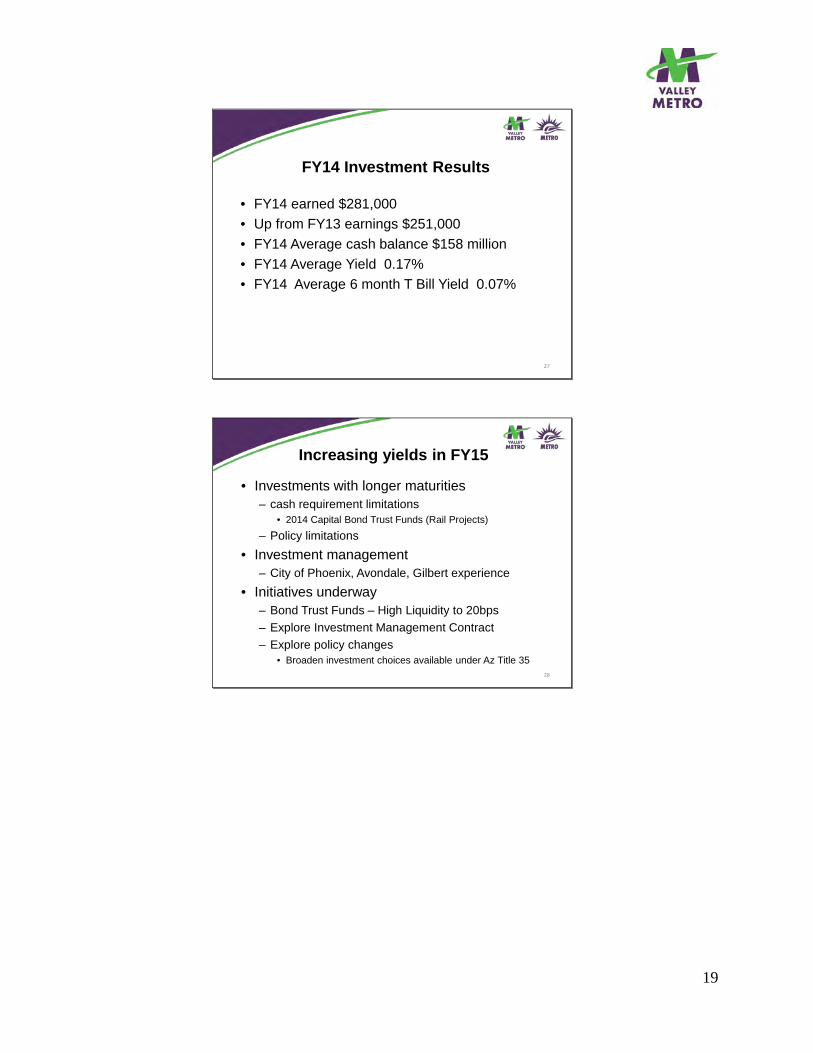
FY14 Investment Results
27
• FY14 earned $281,000• Up from FY13 earnings $251,000• FY14 Average cash balance $158 million• FY14 Average Yield 0.17%• FY14 Average 6 month T Bill Yield 0.07%
Increasing yields in FY15
28
• Investments with longer maturities– cash requirement limitations
• 2014 Capital Bond Trust Funds (Rail Projects)
– Policy limitations• Investment management
– City of Phoenix, Avondale, Gilbert experience• Initiatives underway
– Bond Trust Funds – High Liquidity to 20bps– Explore Investment Management Contract – Explore policy changes
• Broaden investment choices available under Az Title 35
20
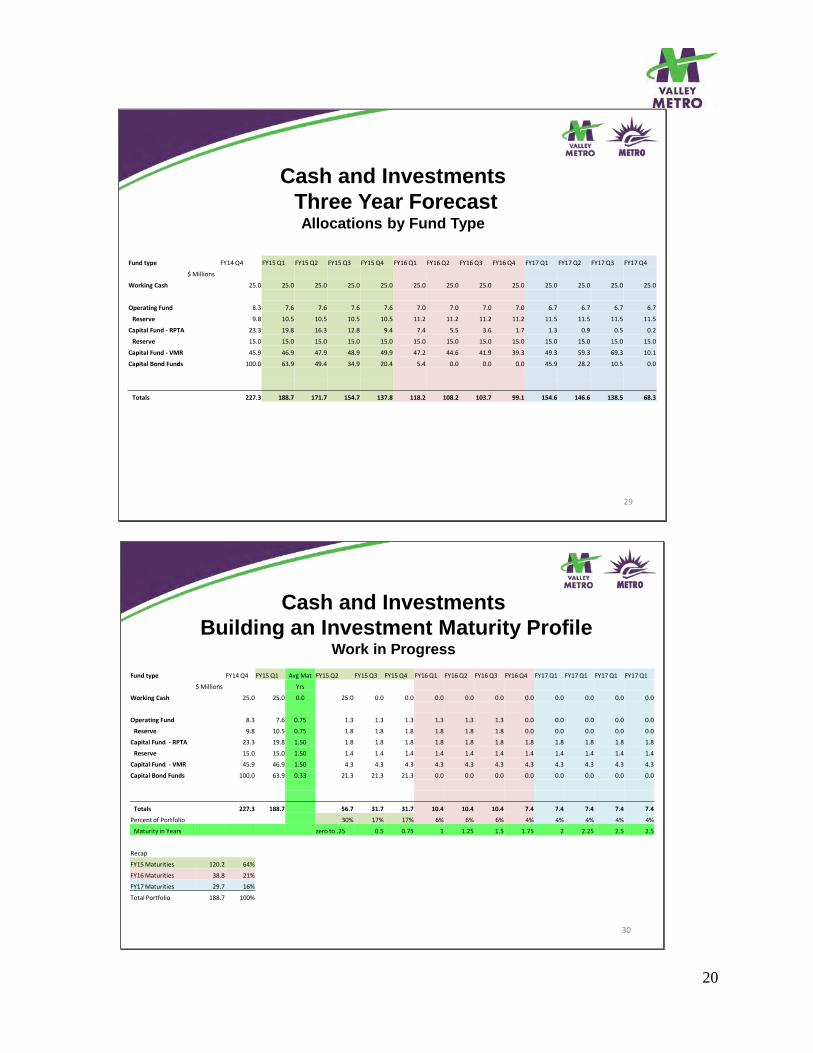
Cash and InvestmentsThree Year ForecastAllocations by Fund Type
29
Fund type FY14 v4 FY15 v1 FY15 v2 FY15 v3 FY15 v4 FY16 v1 FY16 v2 FY16 v3 FY16 v4 FY17 v1 FY17 v2 FY17 v3 FY17 v4
$ aillions
Working Cash 25.0 25.0 25.0 25.0 25.0 25.0 25.0 25.0 25.0 25.0 25.0 25.0 25.0
Operating Fund 8.3 7.6 7.6 7.6 7.6 7.0 7.0 7.0 7.0 6.7 6.7 6.7 6.7
Reserve 9.8 10.5 10.5 10.5 10.5 11.2 11.2 11.2 11.2 11.5 11.5 11.5 11.5
Capital Fund - RtTA 23.3 19.8 16.3 12.8 9.4 7.4 5.5 3.6 1.7 1.3 0.9 0.5 0.2
Reserve 15.0 15.0 15.0 15.0 15.0 15.0 15.0 15.0 15.0 15.0 15.0 15.0 15.0
Capital Fund - VaR 45.9 46.9 47.9 48.9 49.9 47.2 44.6 41.9 39.3 49.3 59.3 69.3 10.1
Capital Bond Funds 100.0 63.9 49.4 34.9 20.4 5.4 0.0 0.0 0.0 45.9 28.2 10.5 0.0
Totals 227.3 188.7 171.7 154.7 137.8 118.2 108.2 103.7 99.1 154.6 146.6 138.5 68.3
Cash and InvestmentsBuilding an Investment Maturity Profile
Work in Progress
30
Fund type FY14 v4 FY15 v1 Avg aat FY15 v2 FY15 v3 FY15 v4 FY16 v1 FY16 v2 FY16 v3 FY16 v4 FY17 v1 FY17 v1 FY17 v1 FY17 v1
$ aillions Yrs
Working Cash 25.0 25.0 0.0 25.0 0.0 0.0 0.0 0.0 0.0 0.0 0.0 0.0 0.0 0.0
Operating Fund 8.3 7.6 0.75 1.3 1.3 1.3 1.3 1.3 1.3 0.0 0.0 0.0 0.0 0.0
Reserve 9.8 10.5 0.75 1.8 1.8 1.8 1.8 1.8 1.8 0.0 0.0 0.0 0.0 0.0
Capital Fund - RtTA 23.3 19.8 1.50 1.8 1.8 1.8 1.8 1.8 1.8 1.8 1.8 1.8 1.8 1.8
Reserve 15.0 15.0 1.50 1.4 1.4 1.4 1.4 1.4 1.4 1.4 1.4 1.4 1.4 1.4
Capital Fund - VaR 45.9 46.9 1.50 4.3 4.3 4.3 4.3 4.3 4.3 4.3 4.3 4.3 4.3 4.3
Capital Bond Funds 100.0 63.9 0.33 21.3 21.3 21.3 0.0 0.0 0.0 0.0 0.0 0.0 0.0 0.0
Totals 227.3 188.7 56.7 31.7 31.7 10.4 10.4 10.4 7.4 7.4 7.4 7.4 7.4
tercent of tortfolio 30% 17% 17% 6% 6% 6% 4% 4% 4% 4% 4%
aaturity in Years zero to .25 0.5 0.75 1 1.25 1.5 1.75 2 2.25 2.5 2.5
Recap
FY15 aaturities 120.2 64%
FY16 aaturities 38.8 21%
FY17 aaturities 29.7 16%
Total tortfolio 188.7 100%
21
Next Steps
31
• Refine Cash Flow forecasts– Further modeling with sensitivity analysis– Extend maturities to improve yields
• Analyze new investment opportunities– Potential Investment Management Contract
• Possible recommendations to amend Investment Policy
• Report back to BFS at next meeting
7. Impacts of Federal Funding Delays or Restrictions
Federal Funds Review
Budget and Finance SubcommitteeOctober 9, 2014
Paul Hodgins presented Federal Funds Review.
22
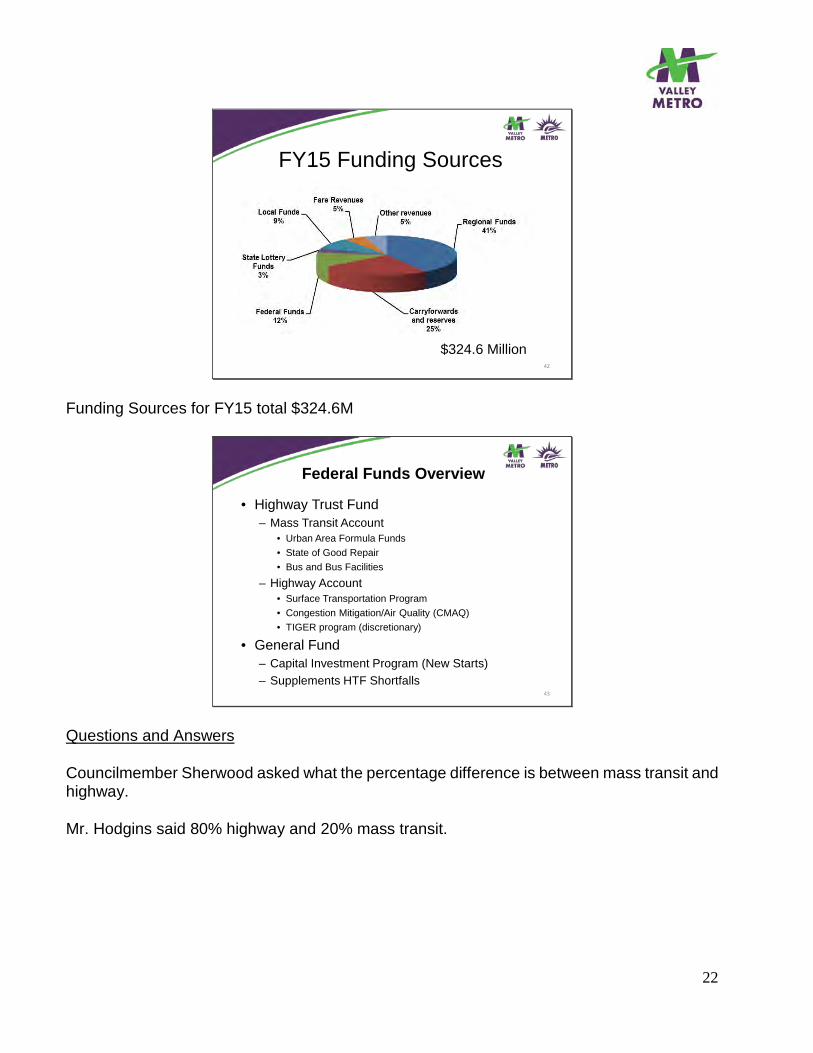
FY15 Funding Sources
42
$324.6 Million
Funding Sources for FY15 total $324.6M
Federal Funds Overview
43
• Highway Trust Fund– Mass Transit Account
• Urban Area Formula Funds• State of Good Repair• Bus and Bus Facilities
– Highway Account• Surface Transportation Program• Congestion Mitigation/Air Quality (CMAQ)• TIGER program (discretionary)
• General Fund– Capital Investment Program (New Starts)– Supplements HTF Shortfalls
Questions and Answers Councilmember Sherwood asked what the percentage difference is between mass transit and highway. Mr. Hodgins said 80% highway and 20% mass transit.

23
HTF Balance – FY14
44
$0.0
$2.0
$4.0
$6.0
$8.0
$10.0
$12.0$
Billi
ons
Highway Account aass Transit Account
The blue line is the highway account. The red line is the mass transit account.
24
45
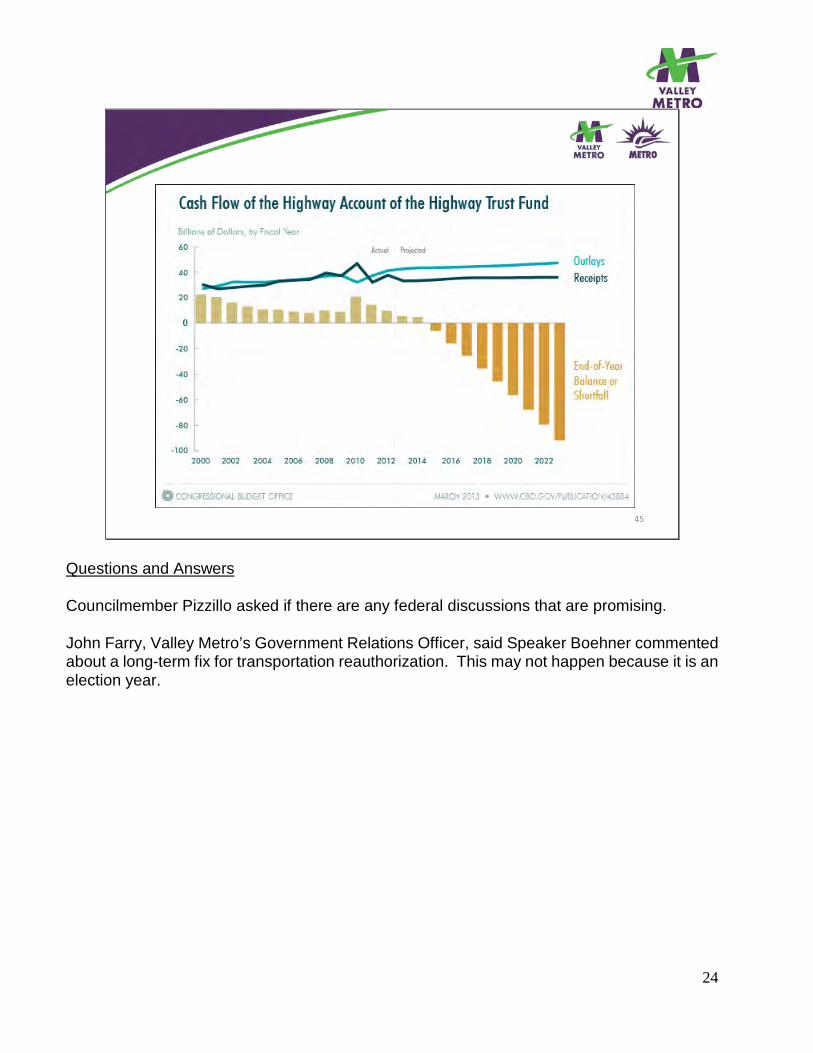
Questions and Answers Councilmember Pizzillo asked if there are any federal discussions that are promising. John Farry, Valley Metro’s Government Relations Officer, said Speaker Boehner commented about a long-term fix for transportation reauthorization. This may not happen because it is an election year.
25
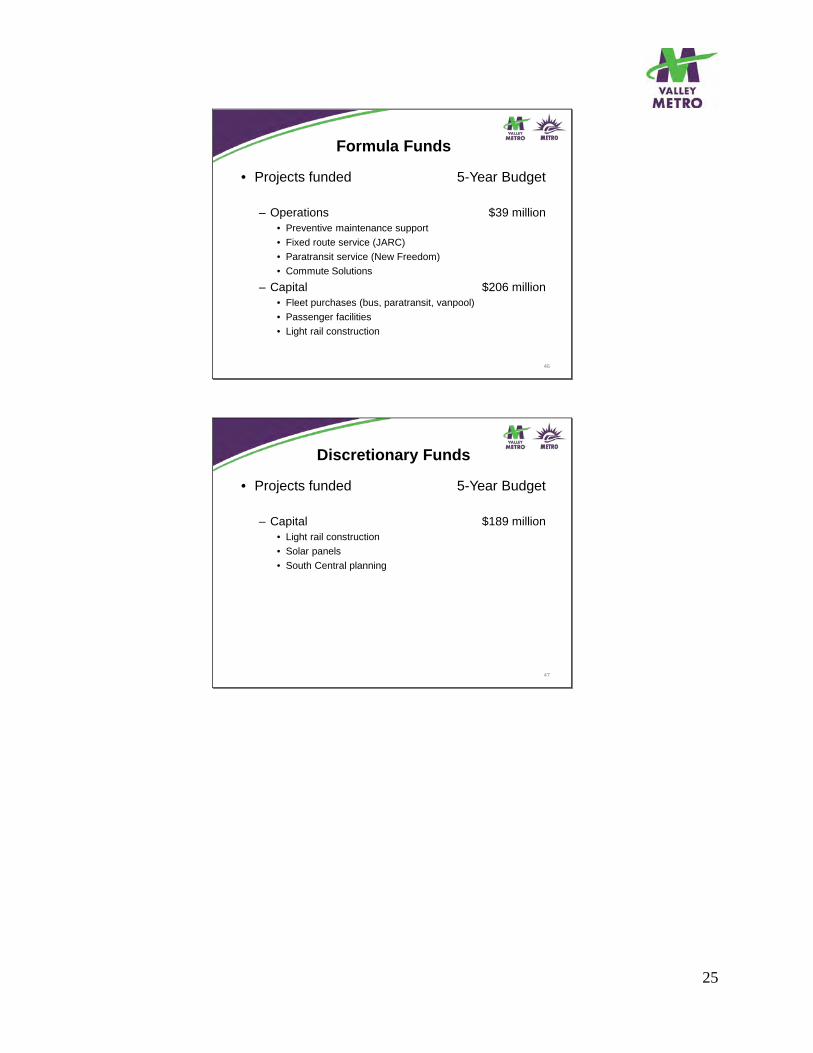
Formula Funds
46
• Projects funded 5-Year Budget
– Operations $39 million• Preventive maintenance support• Fixed route service (JARC)• Paratransit service (New Freedom)• Commute Solutions
– Capital $206 million• Fleet purchases (bus, paratransit, vanpool)• Passenger facilities• Light rail construction
Discretionary Funds
47
• Projects funded 5-Year Budget
– Capital $189 million• Light rail construction• Solar panels• South Central planning
26
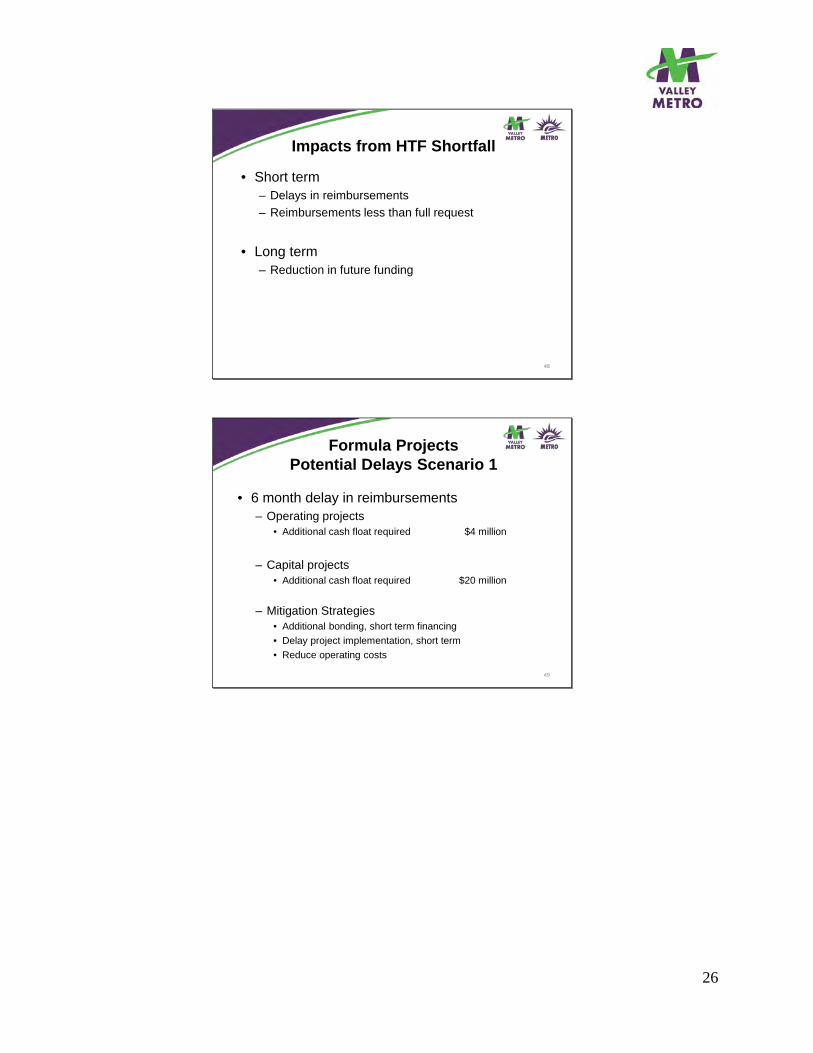
Impacts from HTF Shortfall
48
• Short term– Delays in reimbursements– Reimbursements less than full request
• Long term– Reduction in future funding
Formula ProjectsPotential Delays Scenario 1
49
• 6 month delay in reimbursements– Operating projects
• Additional cash float required $4 million
– Capital projects• Additional cash float required $20 million
– Mitigation Strategies• Additional bonding, short term financing• Delay project implementation, short term• Reduce operating costs
27
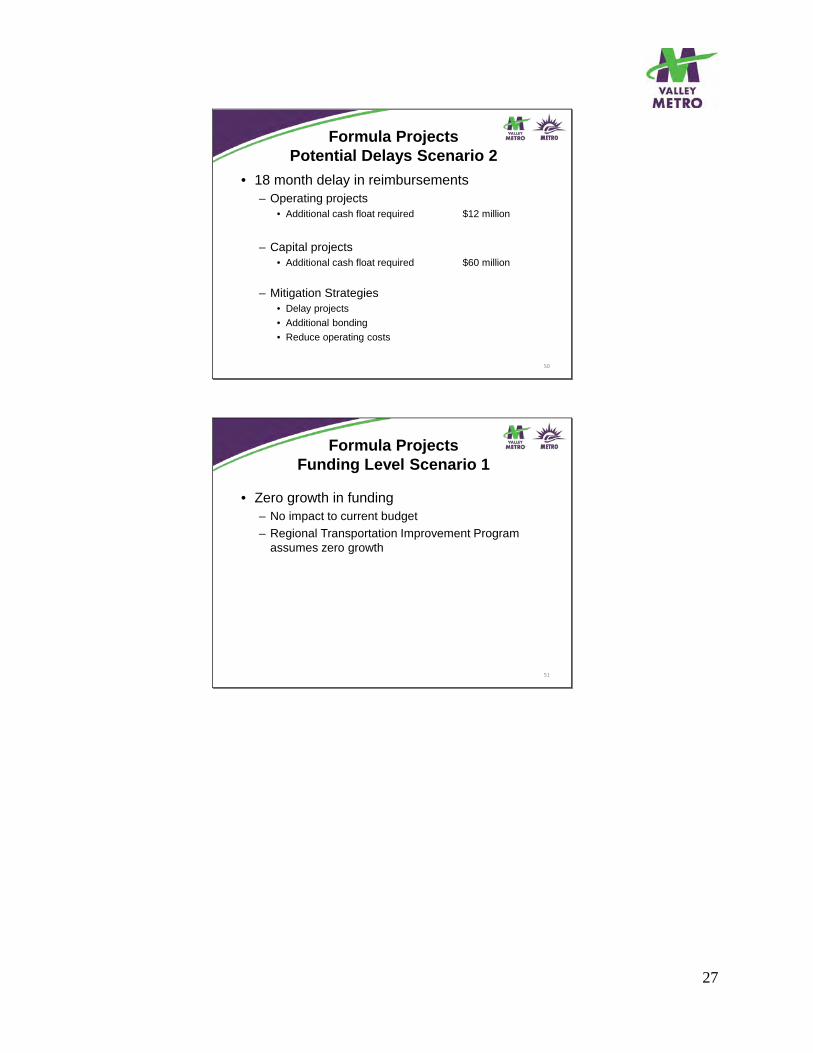
Formula ProjectsPotential Delays Scenario 2
50
• 18 month delay in reimbursements– Operating projects
• Additional cash float required $12 million
– Capital projects• Additional cash float required $60 million
– Mitigation Strategies• Delay projects• Additional bonding• Reduce operating costs
Formula ProjectsFunding Level Scenario 1
51
• Zero growth in funding– No impact to current budget– Regional Transportation Improvement Program
assumes zero growth

28
Formula ProjectsFunding Level Scenario 2
52
• 5% reduction in funding• $3 million annual reduction for region
– Operations $900,000• Increase local funding• Increase fares• Reduce service
– Capital $2,100,000• Increase local funding• Delay projects• Reduce scope of projects
Discretionary ProjectsFunding Level Scenario 3
53
• 5% reduction in funding – National Impact
– Increase competition nationally for limited funds• FY14 national funding level $2.1 billion
– 5% reduction would be $105 million
• FY15 recommended national funding level $2.5 billion– $9.3 billion remaining commitments in existing grants– $27.1 billion projects in process
29
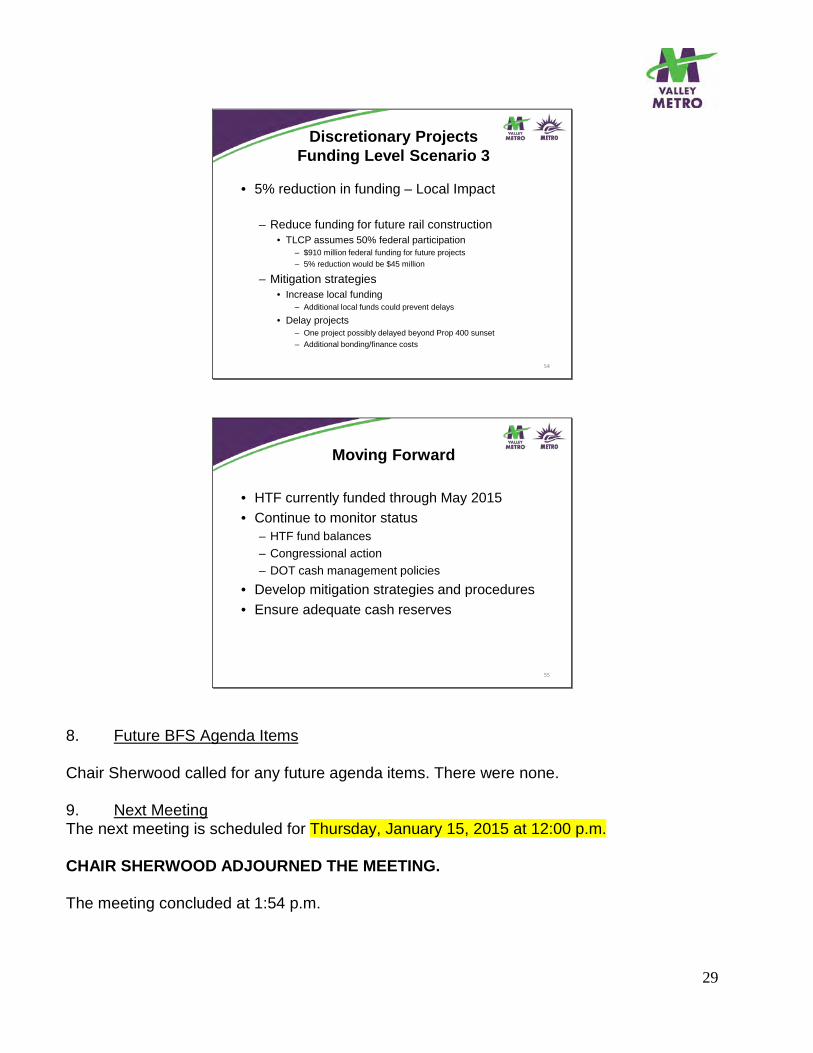
Discretionary ProjectsFunding Level Scenario 3
54
• 5% reduction in funding – Local Impact
– Reduce funding for future rail construction• TLCP assumes 50% federal participation
– $910 million federal funding for future projects– 5% reduction would be $45 million
– Mitigation strategies• Increase local funding
– Additional local funds could prevent delays
• Delay projects – One project possibly delayed beyond Prop 400 sunset– Additional bonding/finance costs
Moving Forward
55
• HTF currently funded through May 2015• Continue to monitor status
– HTF fund balances– Congressional action– DOT cash management policies
• Develop mitigation strategies and procedures• Ensure adequate cash reserves
8. Future BFS Agenda Items
Chair Sherwood called for any future agenda items. There were none. 9. Next Meeting The next meeting is scheduled for Thursday, January 15, 2015 at 12:00 p.m. CHAIR SHERWOOD ADJOURNED THE MEETING. The meeting concluded at 1:54 p.m.

1 1
3
VALLEY METRO • 101 N 1ST AVE • STE 1300 • PHOENIX AZ • 85003 • 602-262-7433
DATE AGENDA ITEM 3 January 5, 2015 SUBJECT FY15 Second Quarter PURPOSE To provide a quarterly update of the Operating and Capital results. BACKGROUND/DISCUSSION/CONSIDERATION John McCormack will present the FY15 Second Quarter 2015 Operating and Capital results. COMMITTEE PROCESS RTAG: December 16, 2014 TMC: January 7, 2015 Budget and Finance Subcommittee: January 15, 2015 Board of Directors: January 22, 2015 RECOMMENDATION For information only CONTACT John P. McCormack Chief Financial Officer 602-495-8239 [email protected] ATTACHMENTS
Finance FY15 Q2 Report
Budget and Finance Subcommittee January 15, 2015
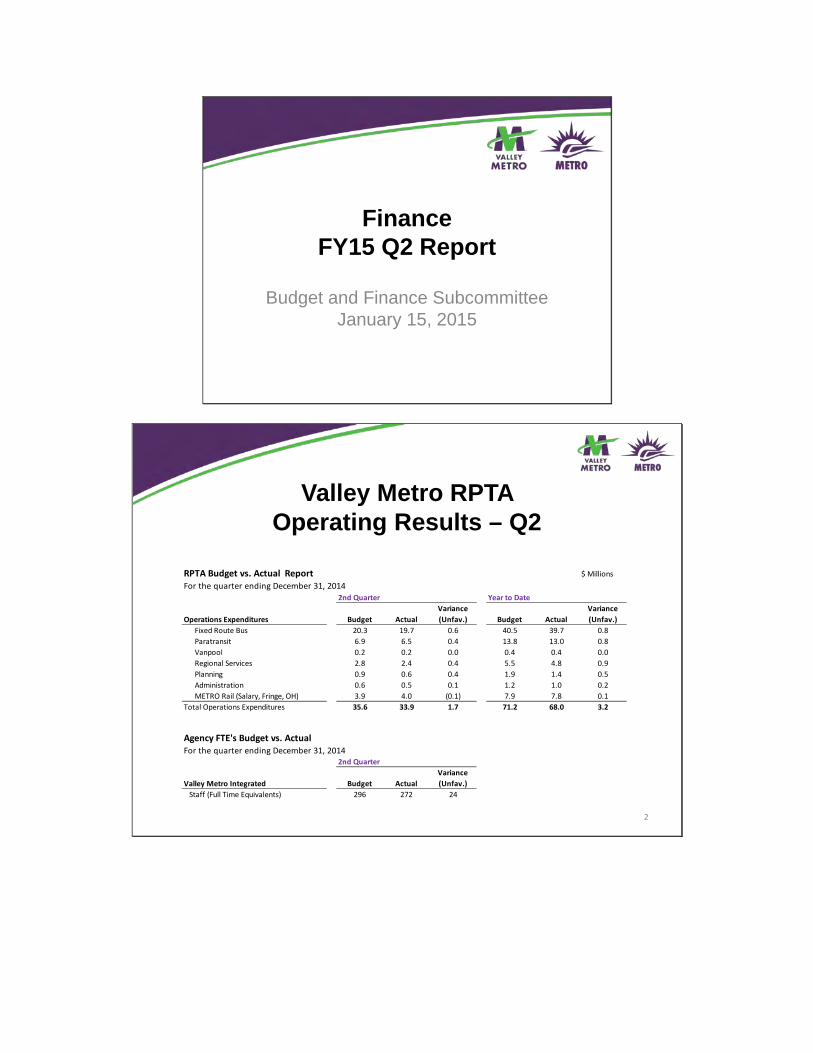
Valley Metro RPTA Operating Results – Q2
2
Agency FTE's Budget vs. ActualFor the quarter ending December 31, 2014
2nd Quarter
Valley aetro Integrated Budget ActualVariance (Unfav.)
Staff (Full Time Equivalents) 296 272 24
RtTA Budget vs. Actual Report $ aillionsFor the quarter ending December 31, 2014
2nd Quarter Year to Date
Operations Expenditures Budget ActualVariance (Unfav.) Budget Actual
Variance (Unfav.)
Fixed Route Bus 20.3 19.7 0.6 40.5 39.7 0.8taratransit 6.9 6.5 0.4 13.8 13.0 0.8Vanpool 0.2 0.2 0.0 0.4 0.4 0.0Regional Services 2.8 2.4 0.4 5.5 4.8 0.9tlanning 0.9 0.6 0.4 1.9 1.4 0.5Administration 0.6 0.5 0.1 1.2 1.0 0.2aETRO Rail (Salary, Fringe, OH) 3.9 4.0 (0.1) 7.9 7.8 0.1
Total Operations Expenditures 35.6 33.9 1.7 71.2 68.0 3.2
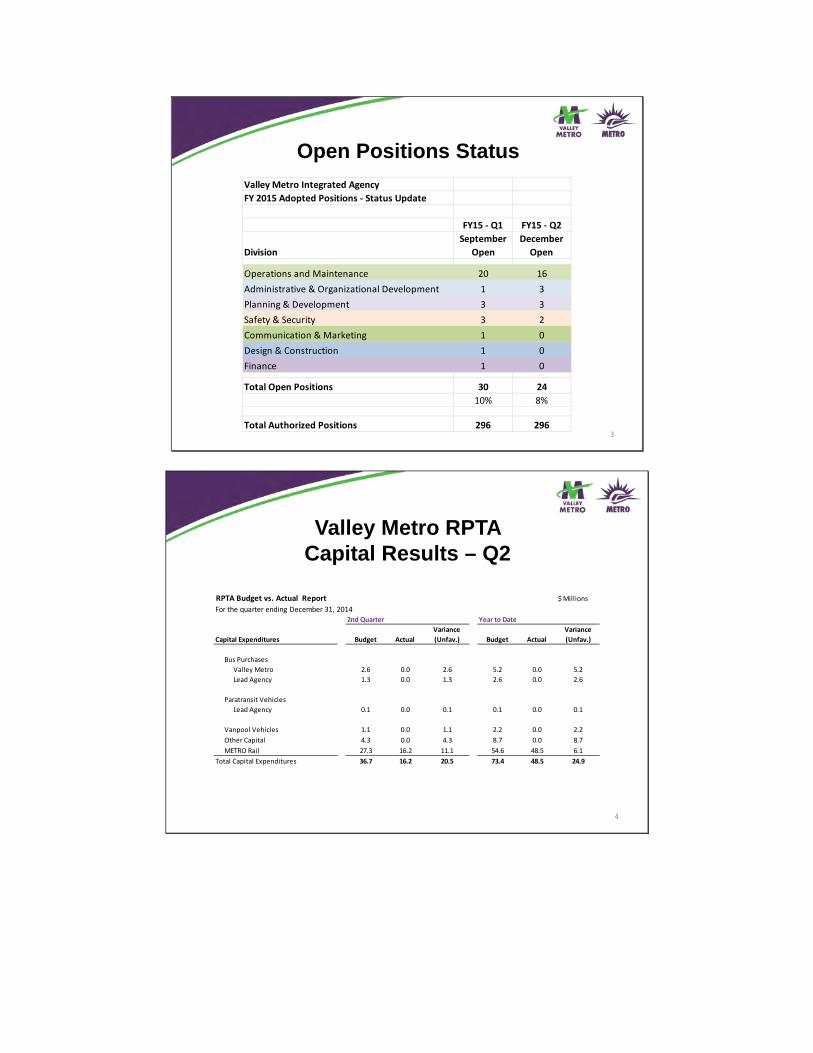
Open Positions Status
3
Valley aetro Integrated AgencyFY 2015 Adopted tositions - Status Update
FY15 - Q1 FY15 - Q2
DivisionSeptember
OpenDecember
Open
Operations and aaintenance 20 16Administrative & Organizational Development 1 3tlanning & Development 3 3Safety & Security 3 2Communication & aarketing 1 0Design & Construction 1 0Finance 1 0
Total Open tositions 30 2410% 8%
Total Authorized tositions 296 296
Valley Metro RPTA Capital Results – Q2
4
RtTA Budget vs. Actual Report $ aillionsFor the quarter ending December 31, 2014
2nd Quarter Year to Date
Capital Expenditures Budget ActualVariance (Unfav.) Budget Actual
Variance (Unfav.)
Bus turchasesValley aetro 2.6 0.0 2.6 5.2 0.0 5.2Lead Agency 1.3 0.0 1.3 2.6 0.0 2.6
taratransit VehiclesLead Agency 0.1 0.0 0.1 0.1 0.0 0.1
Vanpool Vehicles 1.1 0.0 1.1 2.2 0.0 2.2Other Capital 4.3 0.0 4.3 8.7 0.0 8.7aETRO Rail 27.3 16.2 11.1 54.6 48.5 6.1
Total Capital Expenditures 36.7 16.2 20.5 73.4 48.5 24.9
1
4
VALLEY METRO • 101 N 1ST AVE • STE 1300 • PHOENIX AZ • 85003 • 602-262-7433
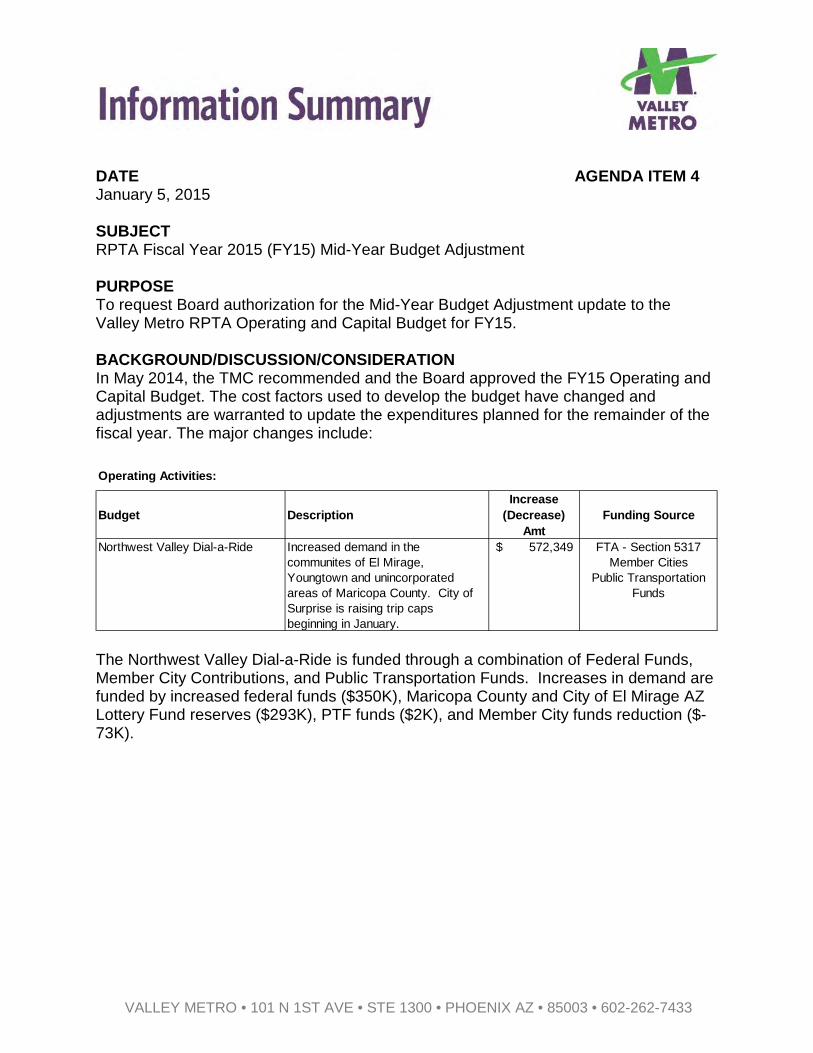
DATE AGENDA ITEM 4 January 5, 2015 SUBJECT RPTA Fiscal Year 2015 (FY15) Mid-Year Budget Adjustment PURPOSE To request Board authorization for the Mid-Year Budget Adjustment update to the Valley Metro RPTA Operating and Capital Budget for FY15. BACKGROUND/DISCUSSION/CONSIDERATION In May 2014, the TMC recommended and the Board approved the FY15 Operating and Capital Budget. The cost factors used to develop the budget have changed and adjustments are warranted to update the expenditures planned for the remainder of the fiscal year. The major changes include:
The Northwest Valley Dial-a-Ride is funded through a combination of Federal Funds, Member City Contributions, and Public Transportation Funds. Increases in demand are funded by increased federal funds ($350K), Maricopa County and City of El Mirage AZ Lottery Fund reserves ($293K), PTF funds ($2K), and Member City funds reduction ($-73K).
Operating Activities:
Budget DescriptionIncrease
(Decrease) Amt
Funding Source
Northwest Valley Dial-a-Ride Increased demand in the communites of El Mirage, Youngtown and unincorporated areas of Maricopa County. City of Surprise is raising trip caps beginning in January.
572,349$ FTA - Section 5317 Member Cities
Public Transportation Funds
2
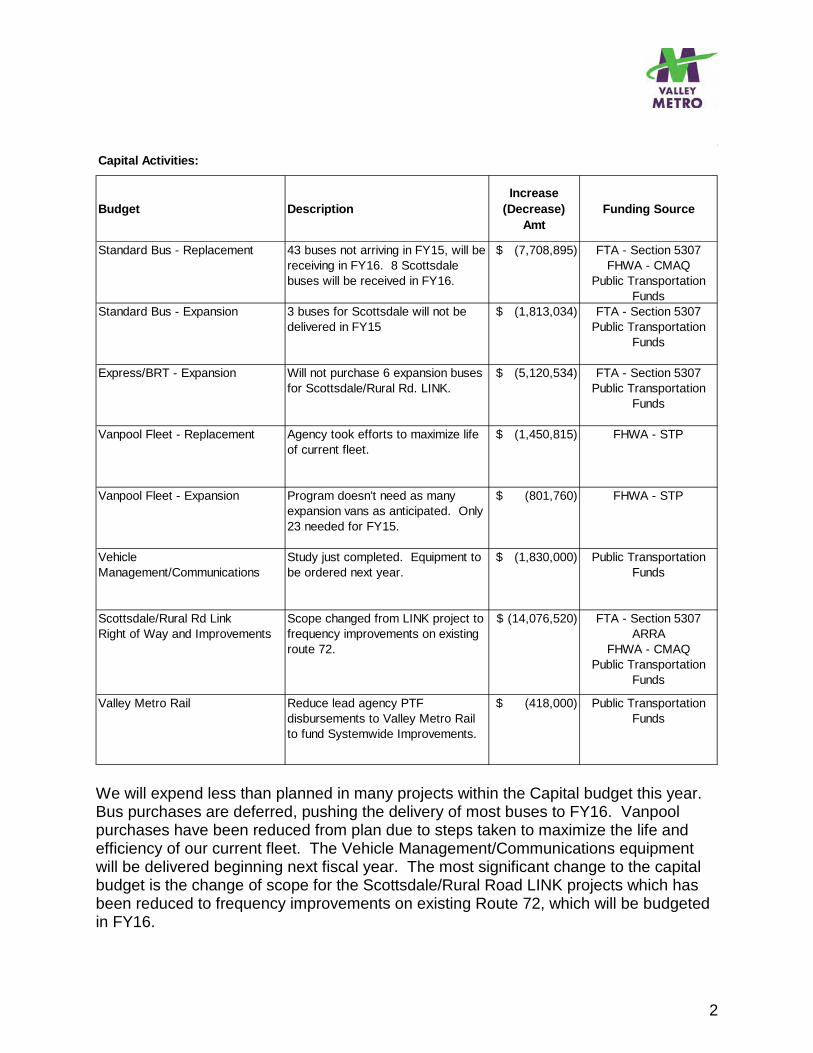
We will expend less than planned in many projects within the Capital budget this year. Bus purchases are deferred, pushing the delivery of most buses to FY16. Vanpool purchases have been reduced from plan due to steps taken to maximize the life and efficiency of our current fleet. The Vehicle Management/Communications equipment will be delivered beginning next fiscal year. The most significant change to the capital budget is the change of scope for the Scottsdale/Rural Road LINK projects which has been reduced to frequency improvements on existing Route 72, which will be budgeted in FY16.
Capital Activities:
Budget DescriptionIncrease
(Decrease) Amt
Funding Source
Standard Bus - Replacement 43 buses not arriving in FY15, will be receiving in FY16. 8 Scottsdale buses will be received in FY16.
(7,708,895)$ FTA - Section 5307FHWA - CMAQ
Public Transportation Funds
Standard Bus - Expansion 3 buses for Scottsdale will not be delivered in FY15
(1,813,034)$ FTA - Section 5307Public Transportation
Funds
Express/BRT - Expansion Will not purchase 6 expansion buses for Scottsdale/Rural Rd. LINK.
(5,120,534)$ FTA - Section 5307Public Transportation
Funds
Vanpool Fleet - Replacement Agency took efforts to maximize life of current fleet.
(1,450,815)$ FHWA - STP
Vanpool Fleet - Expansion Program doesn’t need as many expansion vans as anticipated. Only 23 needed for FY15.
(801,760)$ FHWA - STP
Vehicle Management/Communications
Study just completed. Equipment to be ordered next year.
(1,830,000)$ Public Transportation Funds
Scottsdale/Rural Rd Link Right of Way and Improvements
Scope changed from LINK project to frequency improvements on existing route 72.
(14,076,520)$ FTA - Section 5307 ARRA
FHWA - CMAQPublic Transportation
Funds
Valley Metro Rail Reduce lead agency PTF disbursements to Valley Metro Rail to fund Systemwide Improvements.
(418,000)$ Public Transportation Funds
3
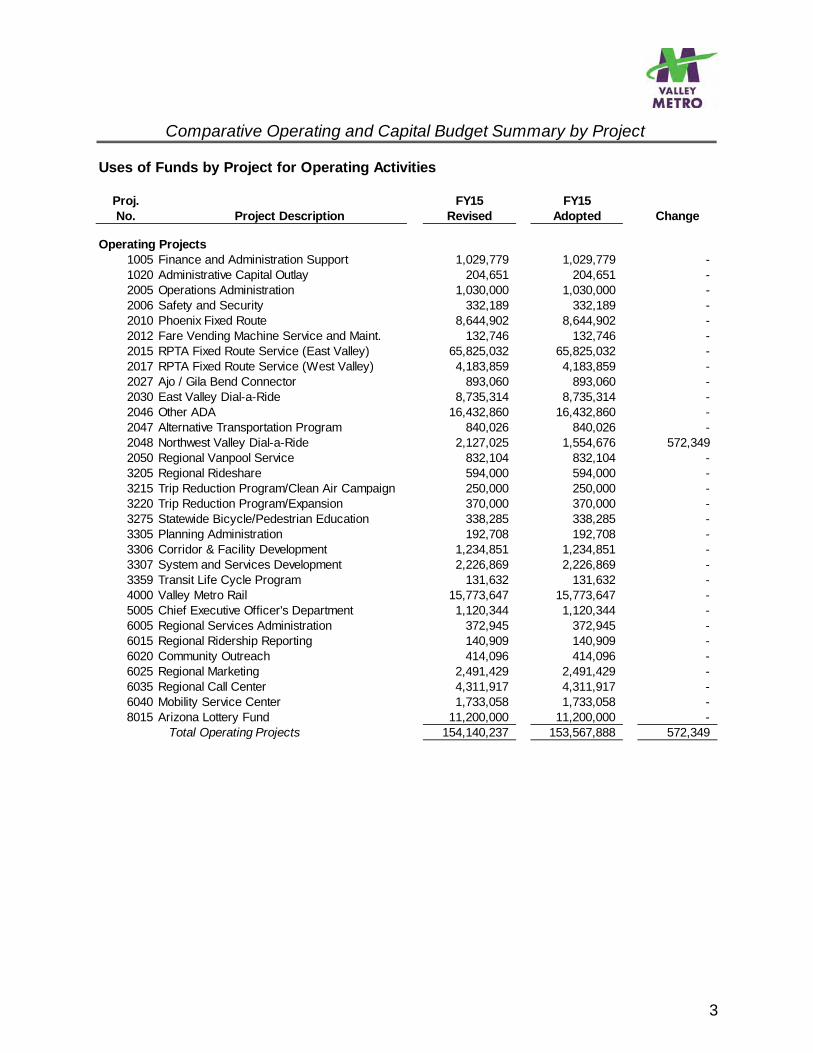
Comparative Operating and Capital Budget Summary by Project
Uses of Funds by Project for Operating Activities
Proj. FY15 FY15No. Project Description Revised Adopted Change
Operating Projects1005 Finance and Administration Support 1,029,779 1,029,779 - 1020 Administrative Capital Outlay 204,651 204,651 - 2005 Operations Administration 1,030,000 1,030,000 - 2006 Safety and Security 332,189 332,189 - 2010 Phoenix Fixed Route 8,644,902 8,644,902 - 2012 Fare Vending Machine Service and Maint. 132,746 132,746 - 2015 RPTA Fixed Route Service (East Valley) 65,825,032 65,825,032 - 2017 RPTA Fixed Route Service (West Valley) 4,183,859 4,183,859 - 2027 Ajo / Gila Bend Connector 893,060 893,060 - 2030 East Valley Dial-a-Ride 8,735,314 8,735,314 - 2046 Other ADA 16,432,860 16,432,860 - 2047 Alternative Transportation Program 840,026 840,026 - 2048 Northwest Valley Dial-a-Ride 2,127,025 1,554,676 572,349 2050 Regional Vanpool Service 832,104 832,104 - 3205 Regional Rideshare 594,000 594,000 - 3215 Trip Reduction Program/Clean Air Campaign 250,000 250,000 - 3220 Trip Reduction Program/Expansion 370,000 370,000 - 3275 Statewide Bicycle/Pedestrian Education 338,285 338,285 - 3305 Planning Administration 192,708 192,708 - 3306 Corridor & Facility Development 1,234,851 1,234,851 - 3307 System and Services Development 2,226,869 2,226,869 - 3359 Transit Life Cycle Program 131,632 131,632 - 4000 Valley Metro Rail 15,773,647 15,773,647 - 5005 Chief Executive Officer's Department 1,120,344 1,120,344 - 6005 Regional Services Administration 372,945 372,945 - 6015 Regional Ridership Reporting 140,909 140,909 - 6020 Community Outreach 414,096 414,096 - 6025 Regional Marketing 2,491,429 2,491,429 - 6035 Regional Call Center 4,311,917 4,311,917 - 6040 Mobility Service Center 1,733,058 1,733,058 - 8015 Arizona Lottery Fund 11,200,000 11,200,000 -
Total Operating Projects 154,140,237 153,567,888 572,349
4
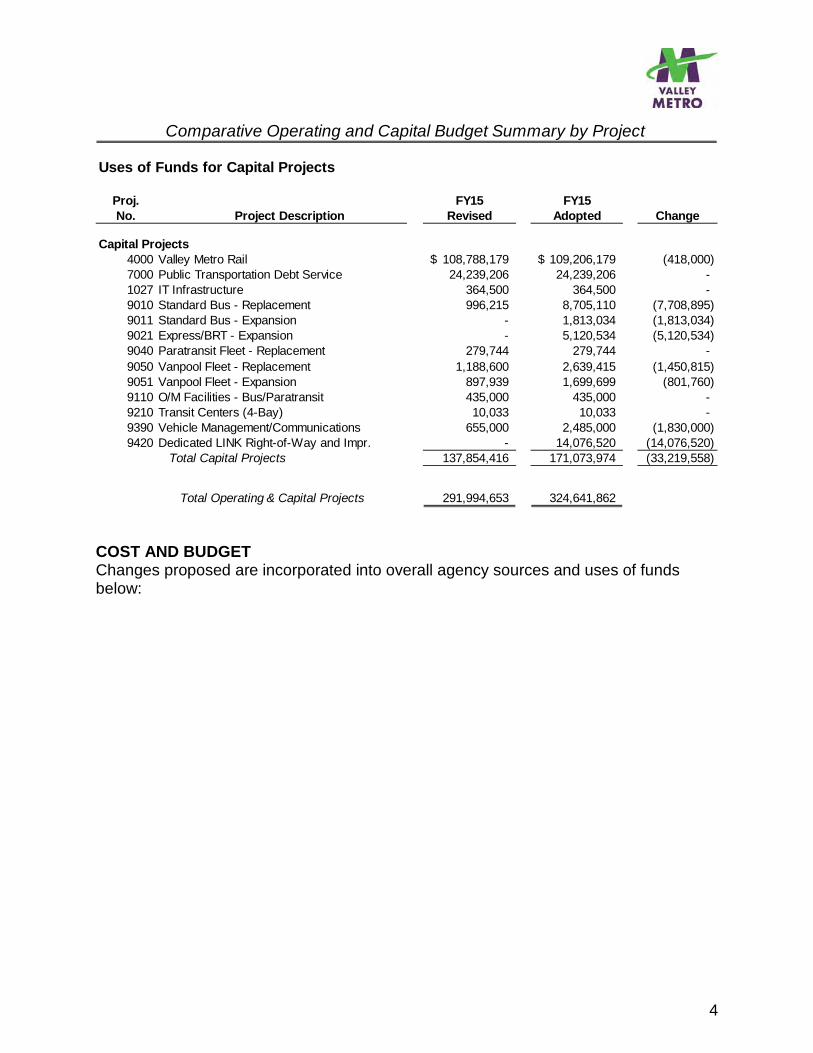
COST AND BUDGET Changes proposed are incorporated into overall agency sources and uses of funds below:
Comparative Operating and Capital Budget Summary by Project
Uses of Funds for Capital Projects
Proj. FY15 FY15No. Project Description Revised Adopted Change
Capital Projects4000 Valley Metro Rail 108,788,179$ 109,206,179$ (418,000) 7000 Public Transportation Debt Service 24,239,206 24,239,206 - 1027 IT Infrastructure 364,500 364,500 - 9010 Standard Bus - Replacement 996,215 8,705,110 (7,708,895) 9011 Standard Bus - Expansion - 1,813,034 (1,813,034) 9021 Express/BRT - Expansion - 5,120,534 (5,120,534) 9040 Paratransit Fleet - Replacement 279,744 279,744 - 9050 Vanpool Fleet - Replacement 1,188,600 2,639,415 (1,450,815) 9051 Vanpool Fleet - Expansion 897,939 1,699,699 (801,760) 9110 O/M Facilities - Bus/Paratransit 435,000 435,000 - 9210 Transit Centers (4-Bay) 10,033 10,033 - 9390 Vehicle Management/Communications 655,000 2,485,000 (1,830,000) 9420 Dedicated LINK Right-of-Way and Impr. - 14,076,520 (14,076,520)
Total Capital Projects 137,854,416 171,073,974 (33,219,558)
Total Operating & Capital Projects 291,994,653 324,641,862
5
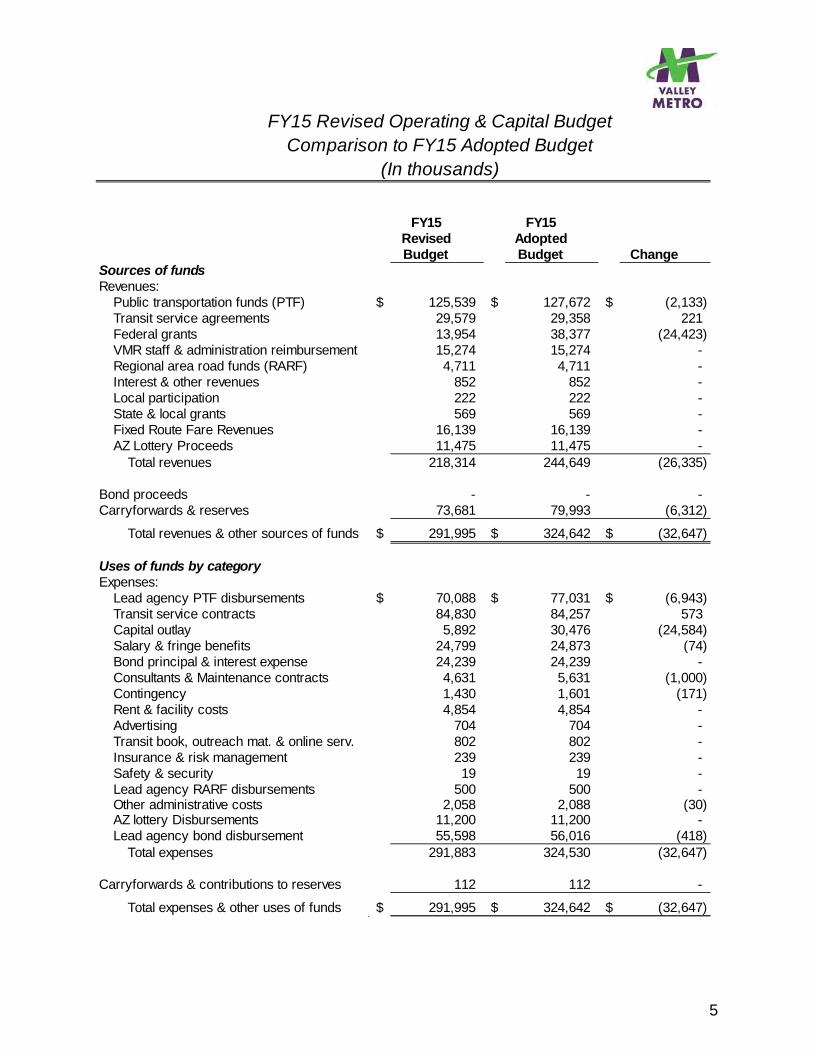
FY15 Revised Operating & Capital BudgetComparison to FY15 Adopted Budget
(In thousands)
FY15 FY15Revised AdoptedBudget Budget Change
Sources of fundsRevenues:
Public transportation funds (PTF) $ 125,539 $ 127,672 $ (2,133) Transit service agreements 29,579 29,358 221 Federal grants 13,954 38,377 (24,423) VMR staff & administration reimbursement 15,274 15,274 - Regional area road funds (RARF) 4,711 4,711 - Interest & other revenues 852 852 - Local participation 222 222 - State & local grants 569 569 - Fixed Route Fare Revenues 16,139 16,139 - AZ Lottery Proceeds 11,475 11,475 -
Total revenues 218,314 244,649 (26,335)
Bond proceeds - - - Carryforwards & reserves 73,681 79,993 (6,312)
Total revenues & other sources of funds $ 291,995 $ 324,642 $ (32,647)
Uses of funds by categoryExpenses:
Lead agency PTF disbursements $ 70,088 $ 77,031 $ (6,943) Transit service contracts 84,830 84,257 573 Capital outlay 5,892 30,476 (24,584) Salary & fringe benefits 24,799 24,873 (74) Bond principal & interest expense 24,239 24,239 - Consultants & Maintenance contracts 4,631 5,631 (1,000) Contingency 1,430 1,601 (171) Rent & facility costs 4,854 4,854 - Advertising 704 704 - Transit book, outreach mat. & online serv. 802 802 - Insurance & risk management 239 239 - Safety & security 19 19 - Lead agency RARF disbursements 500 500 - Other administrative costs 2,058 2,088 (30) AZ lottery Disbursements 11,200 11,200 - Lead agency bond disbursement 55,598 56,016 (418)
Total expenses 291,883 324,530 (32,647)
Carryforwards & contributions to reserves 112 112 -
Total expenses & other uses of funds $ 291,995 $ 324,642 $ (32,647)
6
COMMITTEE PROCESS RTAG: December 16, 2014 for information Financial Working Group: December 16, 2014 for information TMC: January 7, 2015 approved Budget and Finance Subcommittee: January 15, 2015 for action Board of Directors: January 22, 2015 for action RECOMMENDATION It is recommended that the Board of Directors authorize the Mid-Year Budget Adjustment update to the Valley Metro RPTA Operating and Capital Budget for FY15. CONTACT John P. McCormack Chief Financial Officer 602-495-8239 [email protected] ATTACHMENT None

1 1
5
VALLEY METRO • 101 N 1ST AVE • STE 1300 • PHOENIX AZ • 85003 • 602-262-7433
DATE AGENDA ITEM 5 January 5, 2015 SUBJECT Fiscal Year 2014 (FY14) Transit Performance Report (TPR) PURPOSE To provide information to the Budget and Finance Subcommittee and Member Cities regarding ridership, operating costs, fare revenue, and performance indicators contained in the FY14 Transit Performance Report. BACKGROUND/DISCUSSION/CONSIDERATION The Transit Performance Report (TPR) is updated annually using data provided by our member agencies and the Valley Metro Regional Ridership Report. For the FY14 TPR, the reporting basis continues to use the updated methodology used in the FY12 and FY13 TPRs. In general this reporting basis incorporates a greater scope of operating activities to conform with National Transit Database (NTD) standards. COST AND BUDGET None COMMITTEE PROCESS RTAG: December 16, 2014 for information TMC: January 7, 2015 for information Budget and Finance Subcommittee: January 15, 2015 for information Board of Directors: January 22, 2015 for information RECOMMENDATION This item is being presented for information only. CONTACT John P. McCormack Chief Financial Officer 602-495-8239 [email protected] ATTACHMENTS FY14 TPR Report
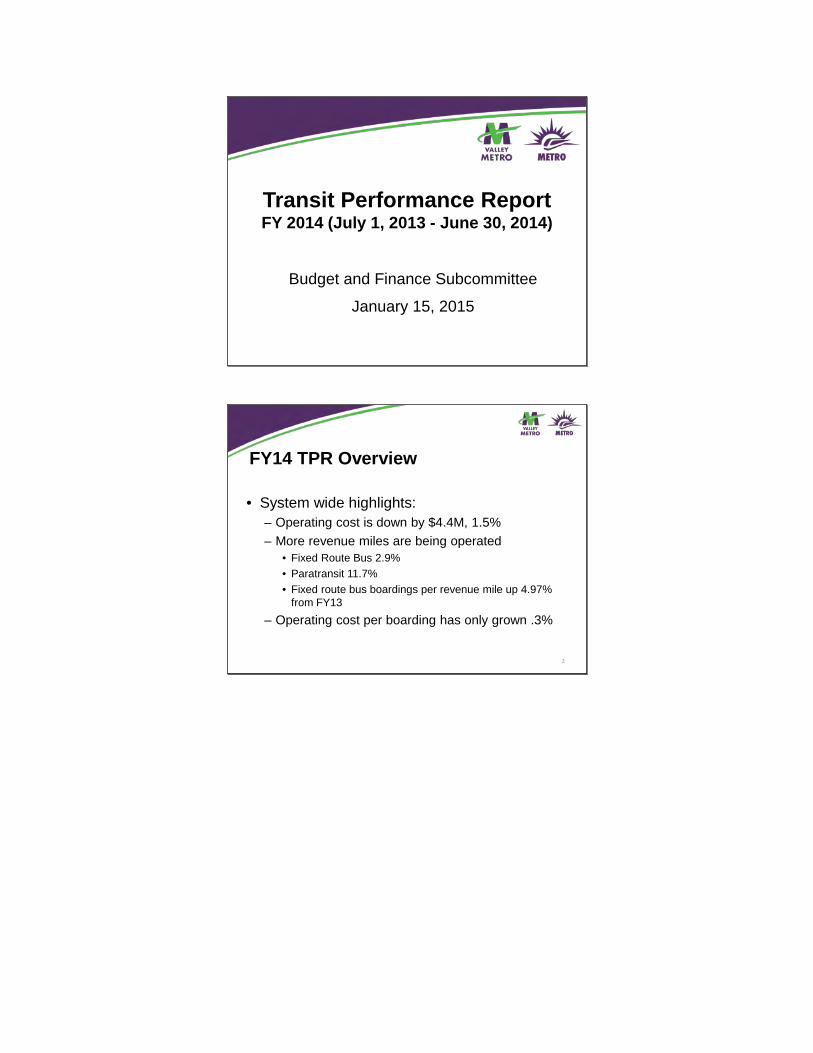
Transit Performance Report FY 2014 (July 1, 2013 - June 30, 2014)
Budget and Finance Subcommittee
January 15, 2015
FY14 TPR Overview
• System wide highlights:– Operating cost is down by $4.4M, 1.5%– More revenue miles are being operated
• Fixed Route Bus 2.9%• Paratransit 11.7%• Fixed route bus boardings per revenue mile up 4.97%
from FY13– Operating cost per boarding has only grown .3%
2
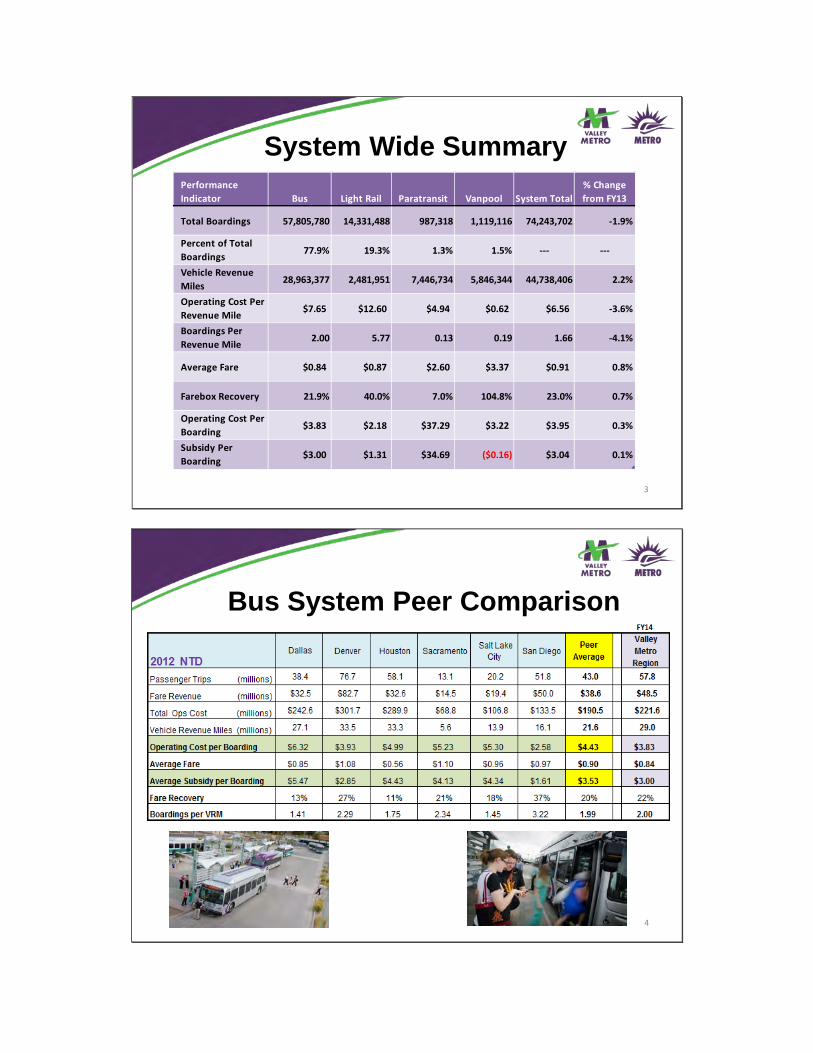
System Wide Summary
3
terformance Indicator Bus Light Rail taratransit Vanpool System Total
% Change from FY13
Total Boardings 57,805,780 14,331,488 987,318 1,119,116 74,243,702 -1.9%
tercent of Total Boardings 77.9% 19.3% 1.3% 1.5% --- ---
Vehicle Revenue ailes 28,963,377 2,481,951 7,446,734 5,846,344 44,738,406 2.2%
Operating Cost ter Revenue aile $7.65 $12.60 $4.94 $0.62 $6.56 -3.6%
Boardings ter Revenue aile 2.00 5.77 0.13 0.19 1.66 -4.1%
Average Fare $0.84 $0.87 $2.60 $3.37 $0.91 0.8%
Farebox Recovery 21.9% 40.0% 7.0% 104.8% 23.0% 0.7%
Operating Cost ter Boarding $3.83 $2.18 $37.29 $3.22 $3.95 0.3%
Subsidy ter Boarding $3.00 $1.31 $34.69 ($0.16) $3.04 0.1%
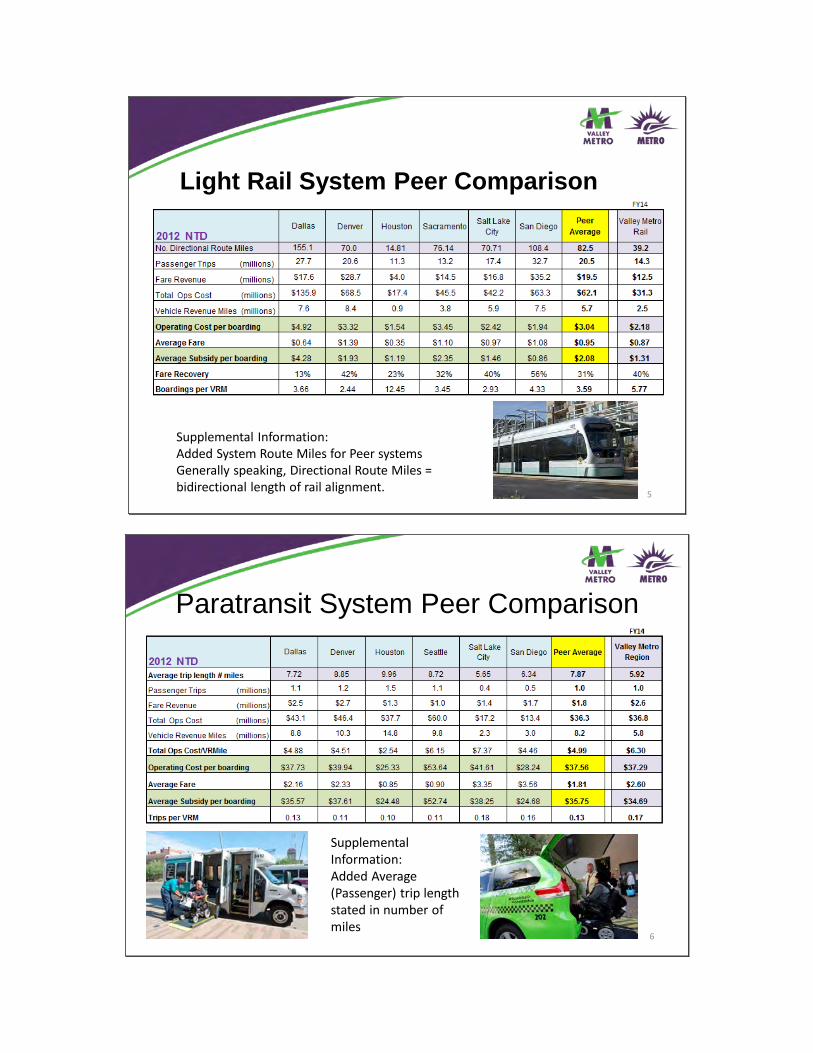
Bus System Peer Comparison
4
Light Rail System Peer Comparison
Supplemental Lnformation:Added System Route ailes for teer systemsGenerally speaking, Directional Route ailes = bidirectional length of rail alignment.
5
Paratransit System Peer Comparison
Supplemental Lnformation:Added Average (tassenger) trip length stated in number of miles
6
End of presentation
7

V A L L E Y M E T R O
Transit Performance ReportF Y 2014 (JULY 1, 2013 - JUNE 30, 2014)
valleymetro.org
2
COST EFFICIENCY & SERVICE EFFECTIVENESS | PERFORMANCE RESULTS
Transit Performance Report (TPR) | FY 2014 (July 1, 2013 - June 30, 2014)
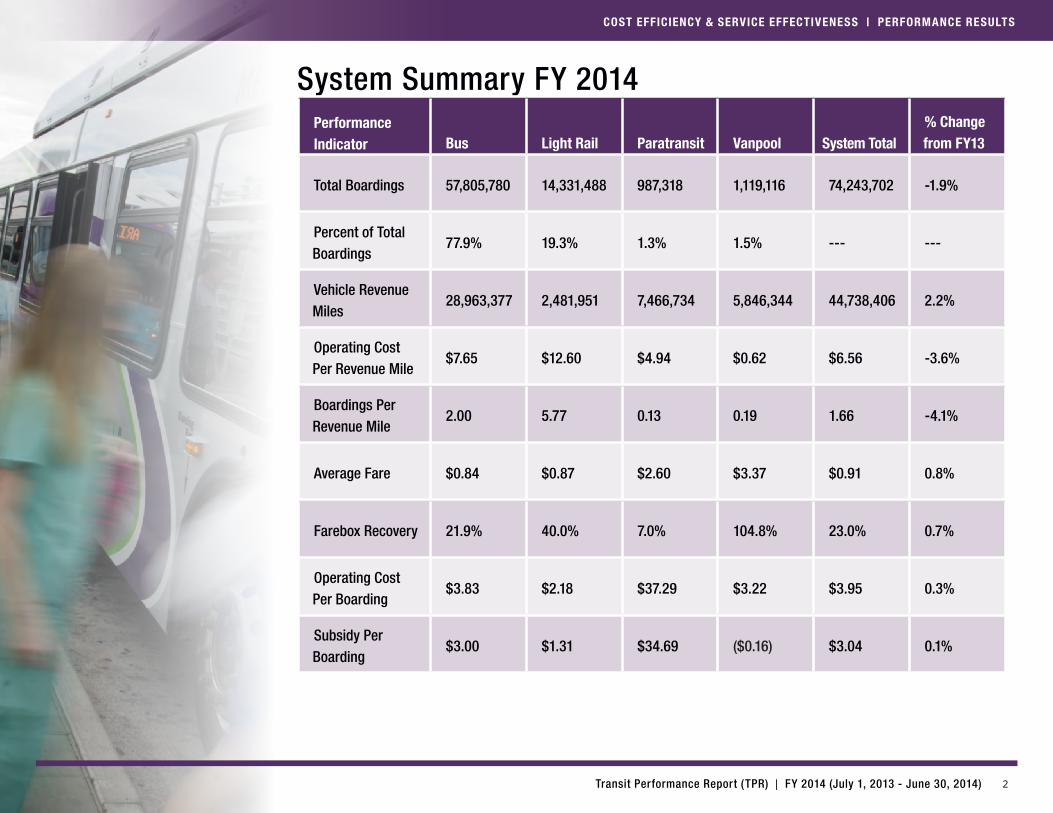
System Summary FY 2014Performance Indicator Bus Light Rail Paratransit Vanpool System Total
% Change from FY13
Total Boardings 57,805,780 14,331,488 987,318 1,119,116 74,243,702 -1.9%
Percent of Total Boardings
77.9% 19.3% 1.3% 1.5% --- ---
Vehicle Revenue Miles
28,963,377 2,481,951 7,466,734 5,846,344 44,738,406 2.2%
Operating Cost Per Revenue Mile
$7.65 $12.60 $4.94 $0.62 $6.56 -3.6%
Boardings Per Revenue Mile
2.00 5.77 0.13 0.19 1.66 -4.1%
Average Fare $0.84 $0.87 $2.60 $3.37 $0.91 0.8%
Farebox Recovery 21.9% 40.0% 7.0% 104.8% 23.0% 0.7%
Operating Cost Per Boarding
$3.83 $2.18 $37.29 $3.22 $3.95 0.3%
Subsidy Per Boarding
$3.00 $1.31 $34.69 ($0.16) $3.04 0.1%
3
COST EFFICIENCY & SERVICE EFFECTIVENESS | PERFORMANCE RESULTS
Transit Performance Report (TPR) | FY 2014 (July 1, 2013 - June 30, 2014)
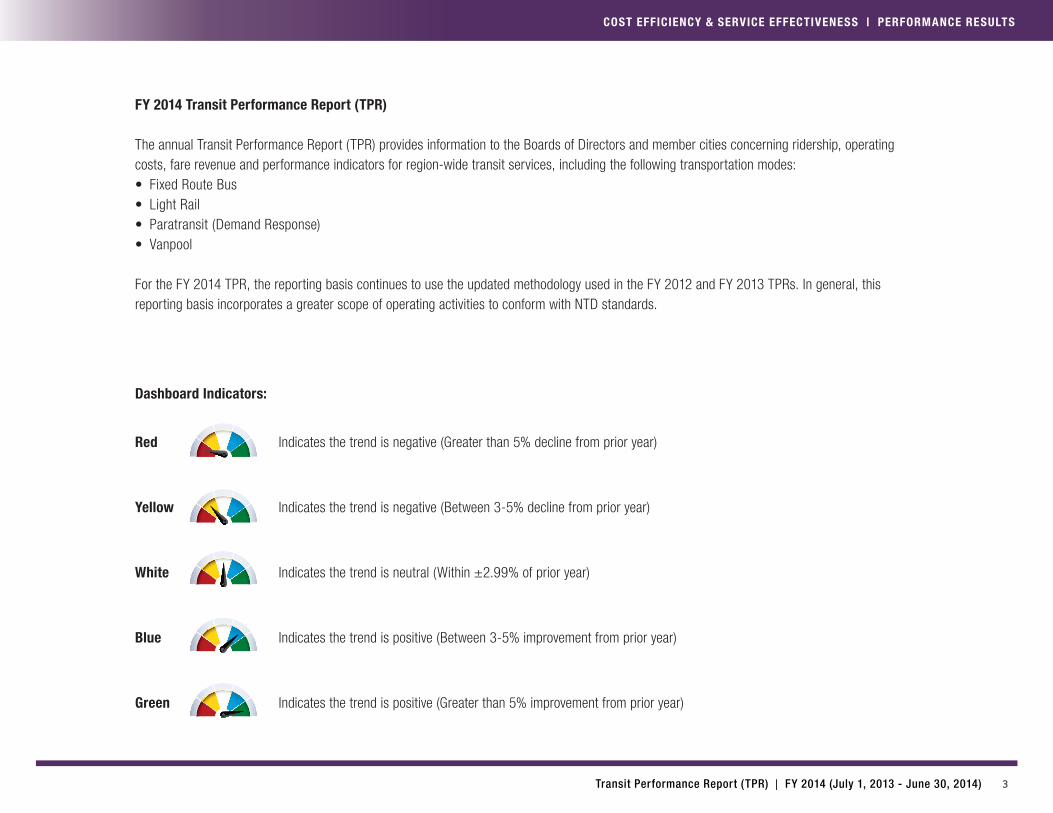
Red Indicates the trend is negative (Greater than 5% decline from prior year)
Yellow Indicates the trend is negative (Between 3-5% decline from prior year)
White Indicates the trend is neutral (Within ±2.99% of prior year)
Blue Indicates the trend is positive (Between 3-5% improvement from prior year)
Green Indicates the trend is positive (Greater than 5% improvement from prior year)
FY 2014 Transit Performance Report (TPR)
The annual Transit Performance Report (TPR) provides information to the Boards of Directors and member cities concerning ridership, operating costs, fare revenue and performance indicators for region-wide transit services, including the following transportation modes:• Fixed Route Bus• Light Rail• Paratransit (Demand Response)• Vanpool
For the FY 2014 TPR, the reporting basis continues to use the updated methodology used in the FY 2012 and FY 2013 TPRs. In general, this reporting basis incorporates a greater scope of operating activities to conform with NTD standards.
Dashboard Indicators:
4
COST EFFIC IENCY & SERV ICE EFFECT IVENESS | PERFORMANCE RESULTS
Transit Performance Report (TPR) | FY 2014 (July 1, 2013 - June 30, 2014)
Farebox Recovery Ratio
100%
90%
80%
70%
60%
50%
40%
30%
20%
10%
0%
Operating Cost Per Boarding
$5.00
$4.50
$4.00
$3.50
$3.00
$2.50
$2.00
$1.50
$1.00
$0.50
$0.00
Operating Subsidy Per Boarding
$4.00
$3.50
$3.00
$2.50
$2.00
$1.50
$1.00
$0.50
$0.00
Operating Cost Per Revenue Mile
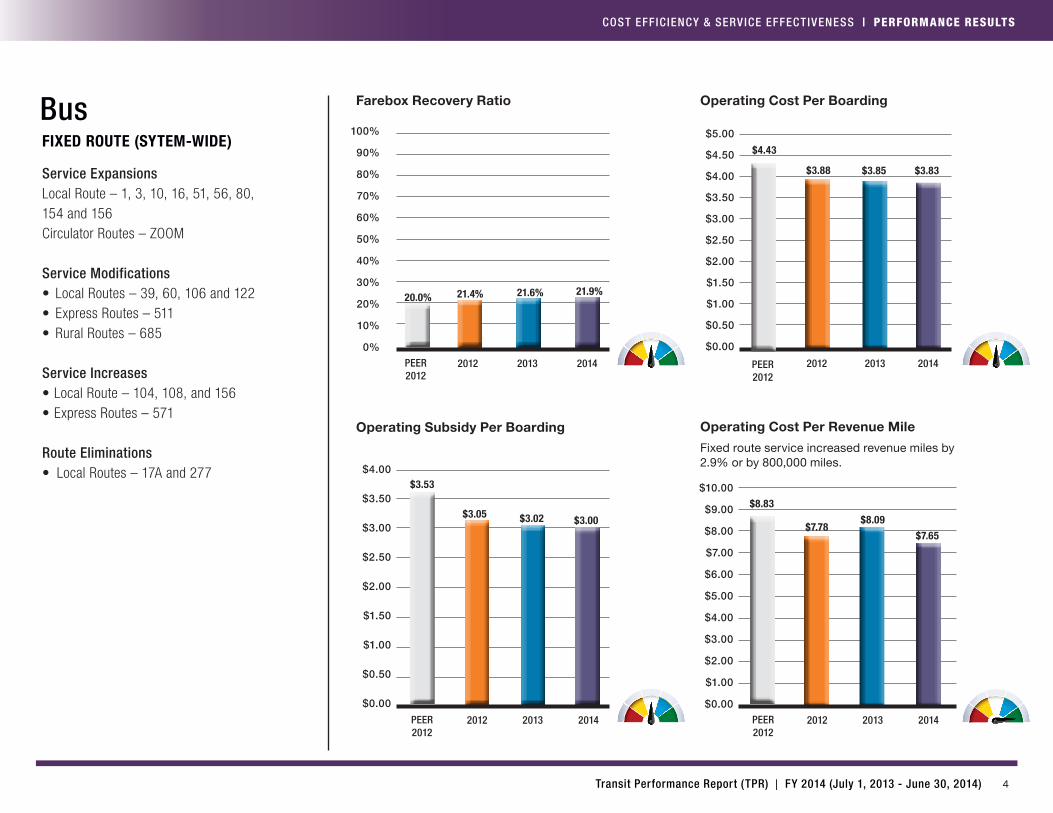
Fixed route service increased revenue miles by 2.9% or by 800,000 miles.
$10.00
$9.00
$8.00
$7.00
$6.00
$5.00
$4.00
$3.00
$2.00
$1.00
$0.00
21.4%
$3.88
$3.05$7.78
2012 20142013
21.6%
$3.85
$3.02
$7.65
2012 20142013
2012 20142013
2012 20142013
BusFIXED ROUTE (SYTEM-WIDE)
Service ExpansionsLocal Route – 1, 3, 10, 16, 51, 56, 80, 154 and 156Circulator Routes – ZOOM
Service Modifications• Local Routes – 39, 60, 106 and 122• Express Routes – 511• Rural Routes – 685
Service Increases• Local Route – 104, 108, and 156• Express Routes – 571
Route Eliminations• Local Routes – 17A and 277
21.9%
$3.83
$3.00 $8.09
20.0%
PEER2012
$3.53
PEER2012
$4.43
PEER2012
$8.83
PEER2012
5
COST EFFIC IENCY & SERV ICE EFFECT IVENESS | PERFORMANCE RESULTS
Transit Performance Report (TPR) | FY 2014 (July 1, 2013 - June 30, 2014)
Average Fare
$0.83
$1.00
$0.90
$0.80
$0.70
$0.60
$0.50
$0.40
$0.30
$0.20
$0.10
$0.00
Annual Increase / Decrease in Total Boardings
15%
12%
9%
6%
3%
0%
-3%
-6%
-9%
-12%
-15%
Annual Increase / Decrease in Weekday Average Boardings
15%
12%
9%
6%
3%
0%
-3%
-6%
-9%
-12%
-15%
Annual Increase / Decrease in Saturday Average Boardings
15%
12%
9%
6%
3%
0%
-3%
-6%
-9%
-12%
-15%
$0.83
-2.23%
-3.59%-4.16%
2012 20142013 201420132012
2012 20142013 201420132012
$0.84
4.88%
3.37%
6.56%
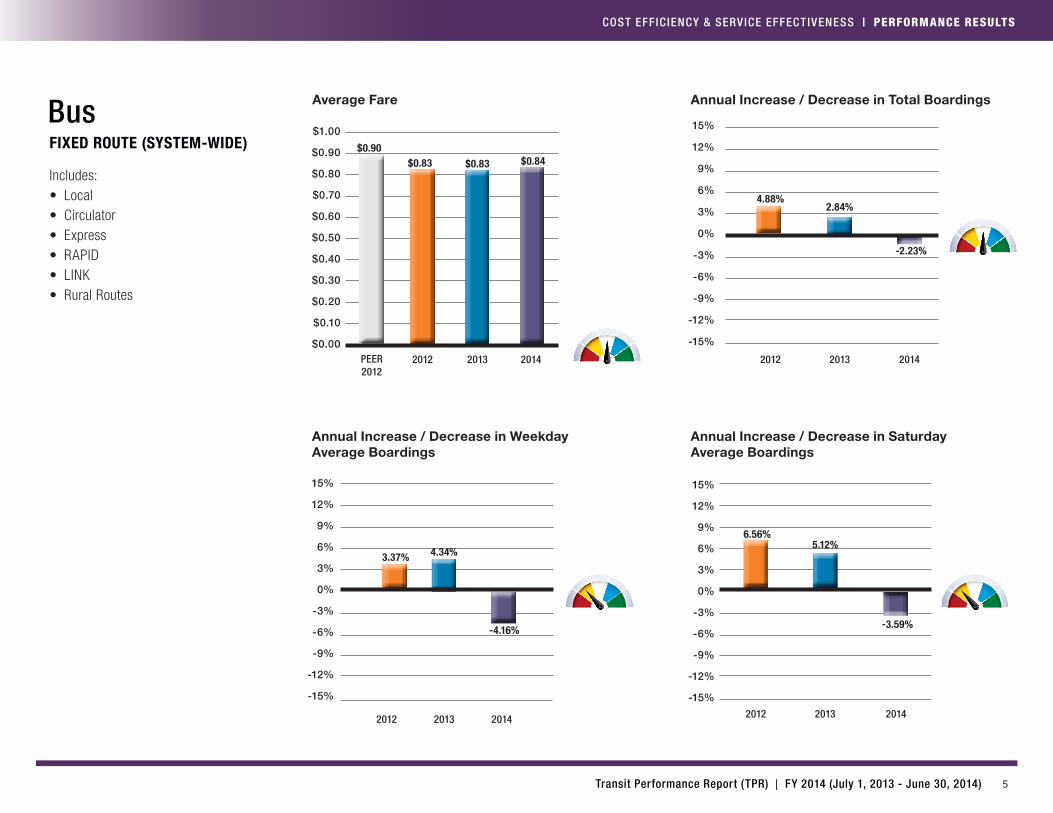
BusFIXED ROUTE (SYSTEM-WIDE)
Includes:• Local• Circulator• Express• RAPID• LINK• Rural Routes
2.84%
4.34%5.12%
$0.90
PEER2012
6
COST EFFIC IENCY & SERV ICE EFFECT IVENESS | PERFORMANCE RESULTS
Transit Performance Report (TPR) | FY 2014 (July 1, 2013 - June 30, 2014)
Boardings Per Revenue Mile
5.0
4.5
4.0
3.5
3.0
2.5
2.0
1.5
1.0
0.5
0.0
Annual Increase / Decrease in Sunday Average Boardings
15%
12%
9%
6%
3%
0%
-3%
-6%
-9%
-12%
-15%
-2.17%
2.00
201420132012
2.00
2012 20142013
3.60%
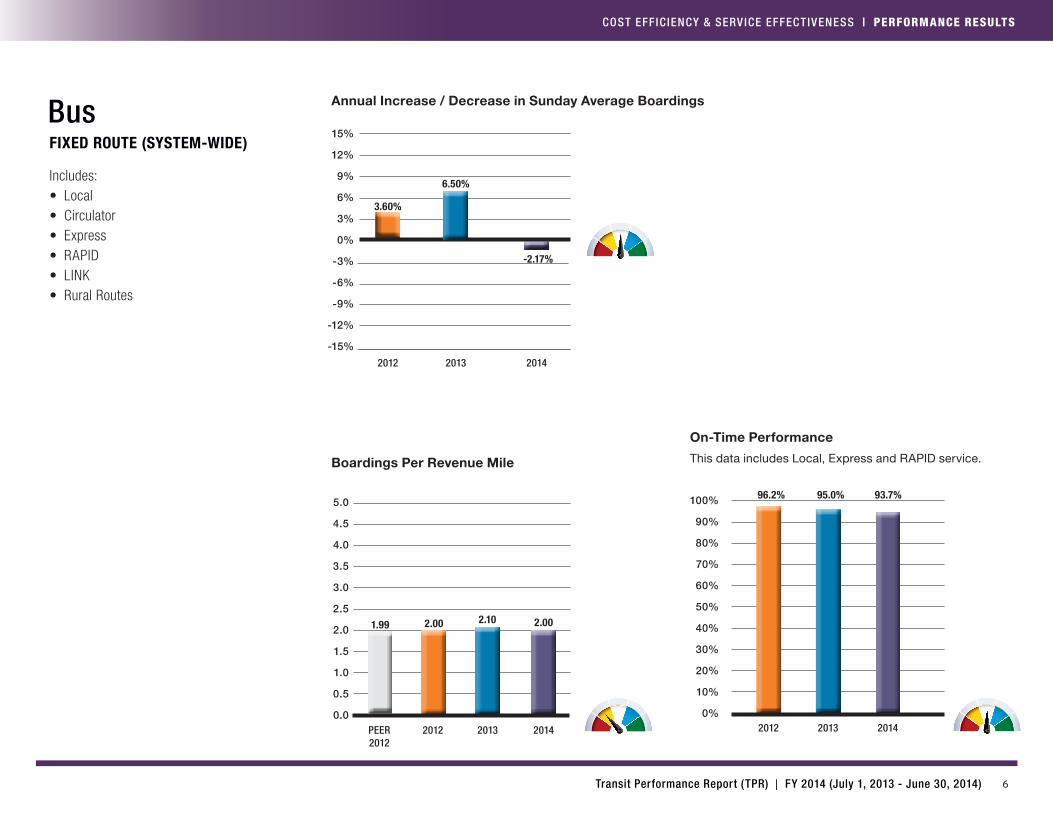
Includes:• Local• Circulator• Express• RAPID• LINK• Rural Routes
BusFIXED ROUTE (SYSTEM-WIDE)
6.50%
2.10
On-Time Performance
This data includes Local, Express and RAPID service.
100%
90%
80%
70%
60%
50%
40%
30%
20%
10%
0%
95.0%
2012 20142013
96.2% 93.7%
1.99
PEER2012
7
COST EFFIC IENCY & SERV ICE EFFECT IVENESS | PERFORMANCE RESULTS
Transit Performance Report (TPR) | FY 2014 (July 1, 2013 - June 30, 2014)
8
COST EFFIC IENCY & SERV ICE EFFECT IVENESS | PERFORMANCE RESULTS
Transit Performance Report (TPR) | FY 2014 (July 1, 2013 - June 30, 2014)
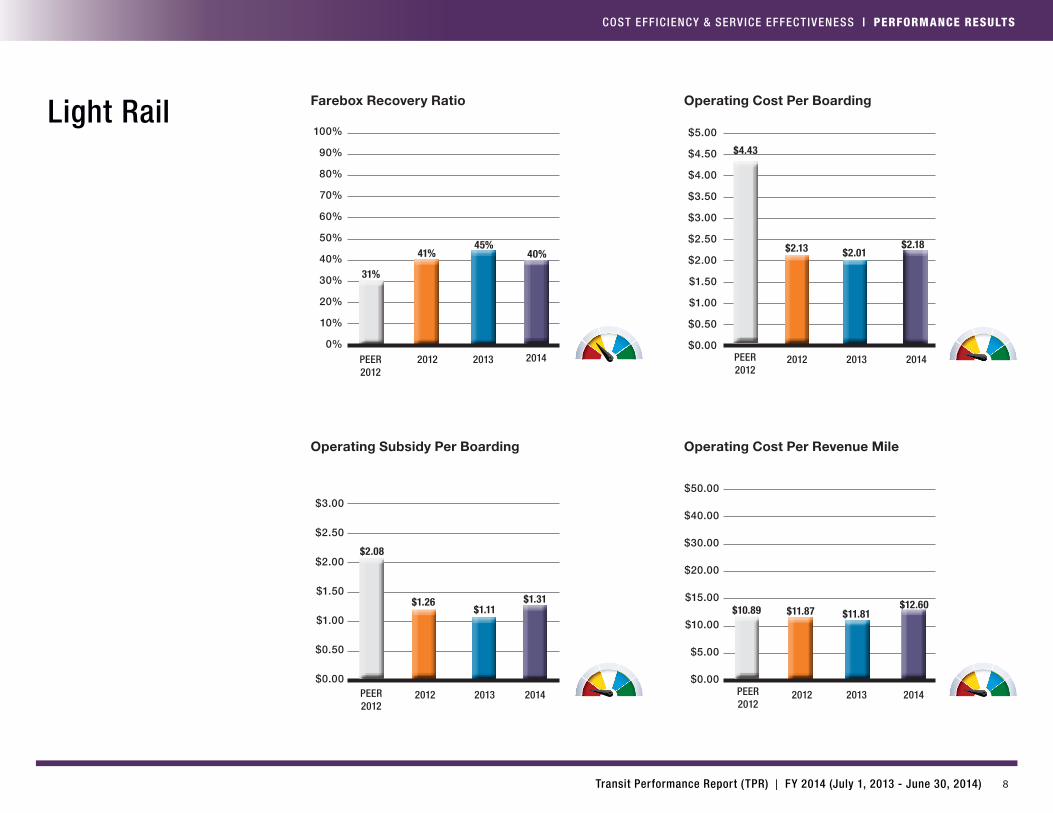
Farebox Recovery Ratio
100%
90%
80%
70%
60%
50%
40%
30%
20%
10%
0%
45%
Operating Cost Per Boarding
$2.13
$5.00
$4.50
$4.00
$3.50
$3.00
$2.50
$2.00
$1.50
$1.00
$0.50
$0.00
Operating Cost Per Revenue Mile
$50.00
$40.00
$30.00
$20.00
$15.00
$10.00
$5.00
$0.00
Operating Subsidy Per Boarding
$3.00
$2.50
$2.00
$1.50
$1.00
$0.50
$0.00
$1.11
$2.01
$1.26$11.87
41%$2.18
$1.31 $12.60
PEER2012
20132012
2012 20142013 2012 20142013
2012 20142013
Light Rail
31%
$11.81
40%
2014
PEER2012
$2.08
PEER2012
$4.43
$10.89
PEER2012
9
COST EFFIC IENCY & SERV ICE EFFECT IVENESS | PERFORMANCE RESULTS
Transit Performance Report (TPR) | FY 2014 (July 1, 2013 - June 30, 2014)
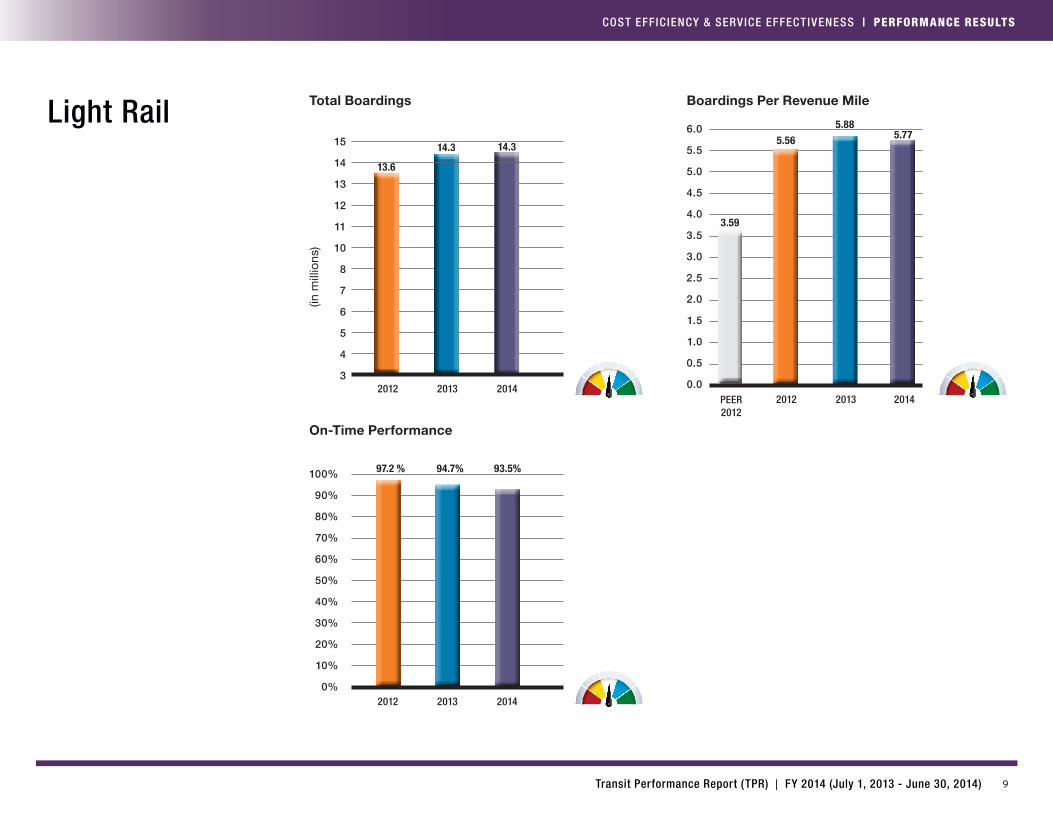
Boardings Per Revenue Mile
6.0
5.5
5.0
4.5
4.0
3.5
3.0
2.5
2.0
1.5
1.0
0.5
0.0
5.77
Total Boardings
15
14
13
12
11
10
8
7
6
5
4
3
(in m
illio
ns)
13.6
On-Time Performance
100%
90%
80%
70%
60%
50%
40%
30%
20%
10%
0%
14.35.56
14.3
94.7%
5.88
2012 20142013
2012 20142013
2012 20142013
Light Rail
97.2 % 93.5%
3.59
PEER2012
10
COST EFFIC IENCY & SERV ICE EFFECT IVENESS | PERFORMANCE RESULTS
Transit Performance Report (TPR) | FY 2014 (July 1, 2013 - June 30, 2014)
11
COST EFFICIENCY & SERVICE EFFECTIVENESS | PERFORMANCE RESULTS
Transit Performance Report (TPR) | FY 2014 (July 1, 2013 - June 30, 2014)
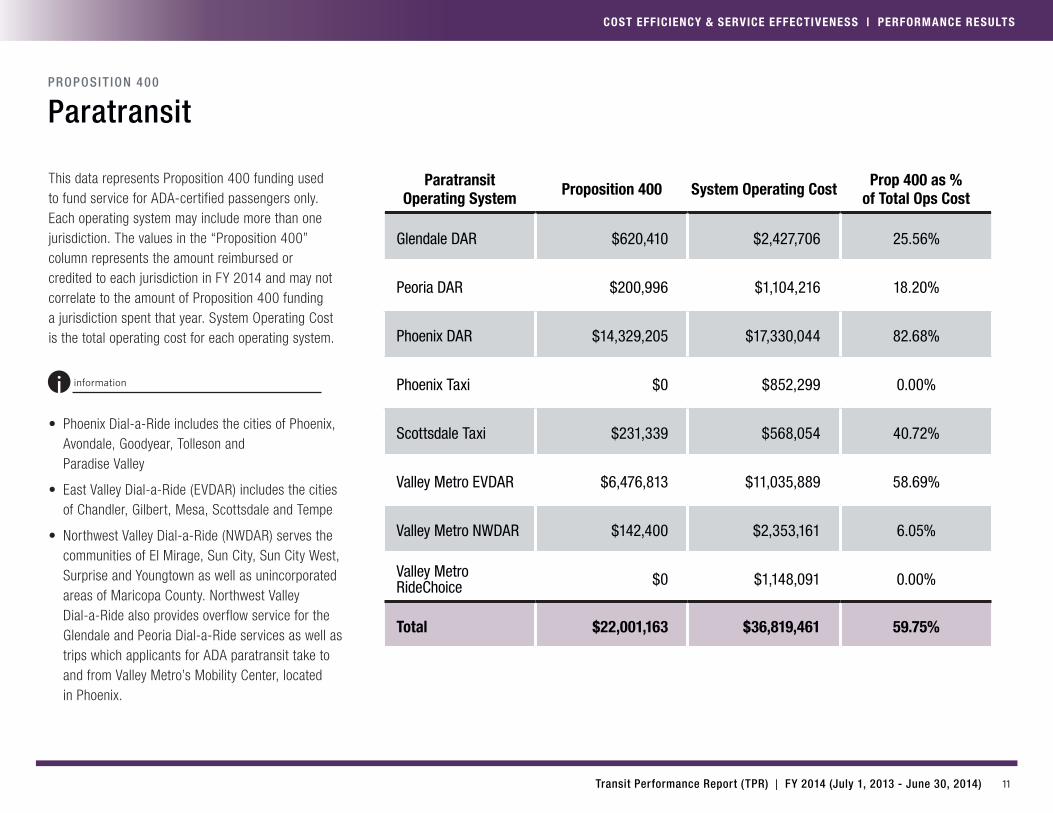
• Phoenix Dial-a-Ride includes the cities of Phoenix, Avondale, Goodyear, Tolleson and Paradise Valley
• East Valley Dial-a-Ride (EVDAR) includes the cities of Chandler, Gilbert, Mesa, Scottsdale and Tempe
• Northwest Valley Dial-a-Ride (NWDAR) serves the communities of El Mirage, Sun City, Sun City West, Surprise and Youngtown as well as unincorporated areas of Maricopa County. Northwest Valley Dial-a-Ride also provides overflow service for the Glendale and Peoria Dial-a-Ride services as well as trips which applicants for ADA paratransit take to and from Valley Metro’s Mobility Center, located in Phoenix.
This data represents Proposition 400 funding used to fund service for ADA-certified passengers only. Each operating system may include more than one jurisdiction. The values in the “Proposition 400” column represents the amount reimbursed or credited to each jurisdiction in FY 2014 and may not correlate to the amount of Proposition 400 funding a jurisdiction spent that year. System Operating Cost is the total operating cost for each operating system.
PROPOSIT ION 400
Paratransit
information
Paratransit Operating System Proposition 400 System Operating Cost Prop 400 as %
of Total Ops Cost
Glendale DAR $620,410 $2,427,706 25.56%
Peoria DAR $200,996 $1,104,216 18.20%
Phoenix DAR $14,329,205 $17,330,044 82.68%
Phoenix Taxi $0 $852,299 0.00%
Scottsdale Taxi $231,339 $568,054 40.72%
Valley Metro EVDAR $6,476,813 $11,035,889 58.69%
Valley Metro NWDAR $142,400 $2,353,161 6.05%
Valley Metro RideChoice $0 $1,148,091 0.00%
Total $22,001,163 $36,819,461 59.75%
12
COST EFFICIENCY & SERVICE EFFECTIVENESS | PERFORMANCE RESULTS
Transit Performance Report (TPR) | FY 2014 (July 1, 2013 - June 30, 2014)
Operating Cost Per Boarding
$50.00
$45.00
$40.00
$35.00
$30.00
$25.00
$20.00
$15.00
$10.00
$5.00
$0.00
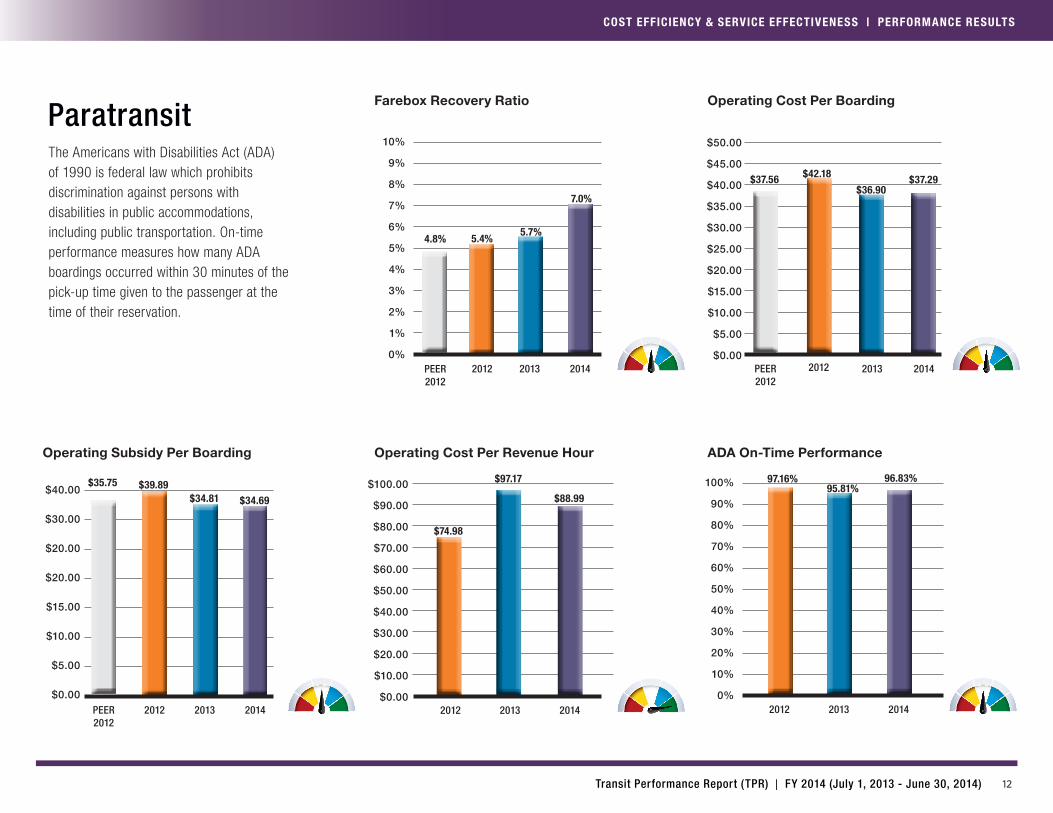
$42.18 $37.29$36.90
2012 20142013
Farebox Recovery Ratio
10%
9%
8%
7%
6%
5%
4%
3%
2%
1%
0%
5.4%5.7%
7.0%
2012 20142013
Operating Subsidy Per Boarding
$40.00
$30.00
$20.00
$20.00
$15.00
$10.00
$5.00
$0.00
$34.81 $34.69$39.89
2012 20142013
Operating Cost Per Revenue Hour
$97.17$100.00
$90.00
$80.00
$70.00
$60.00
$50.00
$40.00
$30.00
$20.00
$10.00
$0.00
$88.99
$74.98
2012 20142013
ADA On-Time Performance
100%
90%
80%
70%
60%
50%
40%
30%
20%
10%
0%
97.16% 96.83%95.81%
2012 20142013
ParatransitThe Americans with Disabilities Act (ADA) of 1990 is federal law which prohibits discrimination against persons with disabilities in public accommodations, including public transportation. On-time performance measures how many ADA boardings occurred within 30 minutes of the pick-up time given to the passenger at the time of their reservation.
4.8%
PEER2012
$37.56
PEER2012
$35.75
PEER2012
13
COST EFFIC IENCY & SERV ICE EFFECT IVENESS | PERFORMANCE RESULTS
Transit Performance Report (TPR) | FY 2014 (July 1, 2013 - June 30, 2014)
14
COST EFFICIENCY & SERVICE EFFECTIVENESS | PERFORMANCE RESULTS
Transit Performance Report (TPR) | FY 2014 (July 1, 2013 - June 30, 2014)
Farebox Recovery Ratio
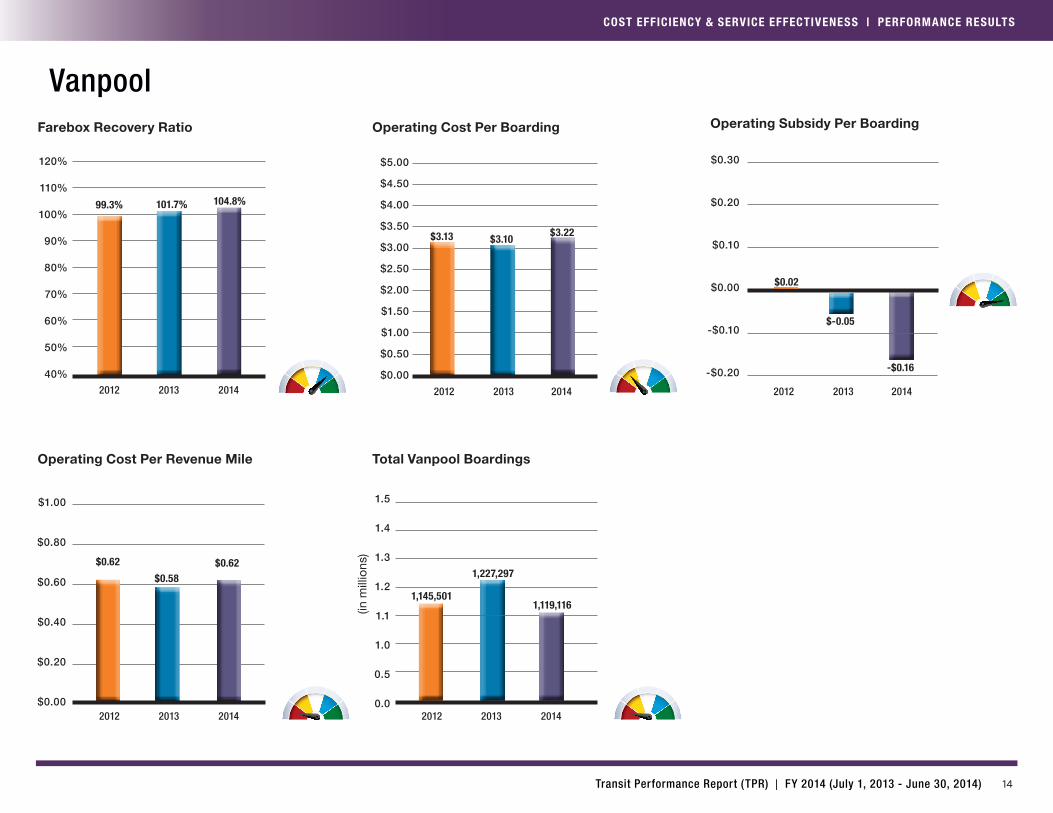
101.7%
Operating Cost Per Boarding
$3.22
$5.00
$4.50
$4.00
$3.50
$3.00
$2.50
$2.00
$1.50
$1.00
$0.50
$0.00
$3.10
Vanpool
Operating Cost Per Revenue Mile
$1.00
$0.80
$0.60
$0.40
$0.20
$0.00
$0.62
99.3%
$3.13
$0.62
2012 20142013
120%
110%
100%
90%
80%
70%
60%
50%
40%
2012 20142013
2012 20142013
Operating Subsidy Per Boarding
$0.30
$0.20
$0.10
$0.00
-$0.10
-$0.20
$-0.05
$0.02
-$0.16
2012 20142013
Total Vanpool Boardings
1.5
1.4
1.3
1.2
1.1
1.0
0.5
0.0
1,227,297
1,145,501
2012 20142013
(in m
illio
ns)
104.8%
$0.58
1,119,116
15Transit Performance Report (TPR) | FY 2014 (July 1, 2013 - June 30, 2014)
Average FareAverage fare is the average price a person pays for a transit trip. It is equal to total fare revenue collected divided by total boardings.
BoardingA boarding is known as an unlinked passenger trip. Every time a person boards a vehicle it is counted as a boarding. For example, if a person makes a trip involving one transfer, this trip is counted as two boardings.
CirculatorsCirculator routes typically serve small specific areas with short routes that are designed to provide connections between transportation systems and other area attractions, like employment centers or schools. Many circulator routes charge no fare.
Express/RAPIDExpress/RAPID routes provide higher speed services by operating within a limited stop and other enhancements. Express/RAPID routes operate on regional freeways.
Farebox Recovery RatioThis is the percentage of total operating cost that is covered by fares collected. It is equal to total fare revenue collected divided by total operating costs.
Fixed RouteFixed route bus service typically operates along a designated or “fixed” route with no deviations. Characteristics of this service type include controlled vehicle frequencies and scheduled passenger stops. In this report, fixed route service comprises Local, Express, RAPID, LINK, Circulator and Rural Connector routes.
LINK ServiceLINK is a type of bus service operating on arterial streets that functions as an extension of Valley Metro Rail and features limited stops, signal priority and near level
boarding.
Local Bus RouteLocal bus routes may operate on either arterial or local collector streets. These are designed to serve localized trip patterns with one or more cities.
National Transit Database (NTD)National Transit Database was established by Congress as a primary source for information and statistics on the transit system in the United States. Any recipients of Federal Transit Administration funding are required to submit data to the NTD.
Net Vanpool StartsCalculated by subtracting number of deleted vanpools from the number of new vanpools started.
On-Time PerformanceADAPercent of all ADA trips that are picked up within the 30 minute ready window.
BusPercent of all trips that operate no more than 0 minutes early and 5 minutes late, compared to scheduled arrival/departure times at published time points.
RailPercent of all trips that arrive at the opposite terminal within 0 minutes early and 5 minutes late of scheduled arrival times.
Operating CostTotal costs associated with the operation of revenue vehicles which includes maintenance and administrative costs. These are gross costs (fare revenue has not been subtracted).
Glossary
16Transit Performance Report (TPR) | FY 2014 (July 1, 2013 - June 30, 2014)
Paratransit ServiceThis service is a shared-ride origin to destination service where an individual can request transportation from one specific location to another specific location at a certain time. This service complements fixed route service. Some systems restrict service to those who are ADA certified, while other systems offer service to the general public.
Revenue HourA revenue hour is an hour that one vehicle in revenue service is available to pick up fare-paying passengers. If ten vehicles are in revenue service for two hours each, they collectively perform twenty revenue hours of service.
Revenue MileA revenue mile is a mile traveled by one vehicle in revenue service that is available to pick up revenue passengers. If ten vehicles are in service for two miles each, they collectively perform twenty revenue miles of service.
Revenue ServiceRevenue service occurs when a vehicle is available to the general public and there is an expectation of carrying passengers who pay the required fare. Vehicles operated in fare-free service are also considered in revenue service. Revenue service includes layover/ recovery time, but does not include deadhead (i.e. travel from garage to the start point of a route) or vehicle maintenance testing.
Rural RoutesRural routes typically provide connections between rural and urban communities.
Subsidy per BoardingAlso known as net operating cost per boarding, this is the operating cost per boarding minus the fare revenue per boarding. This number indicates the amount of public funding that is used to make up the difference between the cost of providing transportation service and the revenue generated by this service on a per boarding basis.
Weekday / Saturday / Sunday Average Daily BoardingsThis measures boardings on a typical weekday, Saturday or Sunday. This is calculated by dividing total boardings on a weekday, Saturday or Sunday by the number of weekdays, Saturdays or Sundays in the fiscal year.
RPT2802
Glossary

16

VALLEY METRO • 101 N 1ST AVE • STE 1300 • PHOENIX AZ • 602-262-7433
DATE AGENDA ITEM 6 January 5, 2015 SUBJECT Future BFS Agenda Item Requests PURPOSE For information BACKGROUND/DISCUSSION/CONSIDERATION Chair Sherwood will request future BFS agenda items from members.
March 2015 Tentative Agenda
• Preliminary FY16 Budget • RPTA – VMR Program Agreement Update
COST AND BUDGET None COMMITTEE PROCESS None RECOMMENDATION For information only CONTACT John P. McCormack Chief Financial Officer 602-495-8239 [email protected] ATTACHMENTS None

1 1
7
VALLEY METRO • 101 N 1ST AVE • STE 1300 • PHOENIX AZ • 602-262-7433
DATE AGENDA ITEM 7 January 5, 2015 SUBJECT Next Meeting PURPOSE For information and discussion BACKGROUND/DISCUSSION/CONSIDERATION The next meeting of the BFS is tentatively scheduled for Thursday, March 12, 2015 at 12:00 p.m.
COST AND BUDGET None COMMITTEE PROCESS None RECOMMENDATION For information only CONTACT John P. McCormack Chief Financial Officer 602-495-8239 [email protected] ATTACHMENTS None


