Download - Mega Trends Impact on Urban Logistics presented at eyefortransport's 3PL Summit- North America

1 NA99-13
Global Mega Trends and Implications to Urban Logistics
Sandeep Kar
Global Director- Commercial Vehicle Research

2 NA99-13
1. Urbanization 2. Connectivity and
Convergence
4. Future Infrastructure
Development
There Will be 35 Mega
Cities Globally By 2025
Demanding For Unique
City Logistics Solutions
By 2025, each person will
have a minimum of five
connected devices
By 2025, 20% of retail will
happen through online
channels
By 2025, globally over
$800 billion will be spent on
high speed rail projects.
What does this mean for Urban Logistics?
500 million deliveries per
person per day to cities
‘On-the-fly’ deliveries will
have to made anywhere,
anyhow, faster and
quicker
Demand for urban parcel
deliveries will increase –
shipments to become
smaller and frequent
Multi-modal, low carbon
footprint, mission critical
utilization of road, rail,
marine, and air
infrastructure
3. Bricks & Clicks
Source: United Nations, Department of Economic and Social Affairs, Population Division
(2012). World Urbanization Prospects: The 2011 Revision , Frost & Sullivan, 2012
Mega Trends Driving Urban Logistics Industry

3 NA99-13
Urbanization Trends Influencing Urban Logistics Development of Mega Cities, Mega Regions, Mega Corridors, and Mega Slums to Drive Demand for
Logistics Services in Urban Areas
MEGA REGIONS
Cities combining with
suburbs to form regions
(Population of over 15
million) (21 Mega Regions
in 2025)
EXAMPLE: National capital
region of Delhi (includes
New Delhi, Noida, Greater
Noida, Ghaziabad,
Gurgaon, Faridabad)
MEGA
CORRIDORS
The corridors connecting
two major cities or Mega
Regions (60 km or more
apart, and with a
combined population of 25
million or more) (37 Mega
Corridors in 2025
EXAMPLE: Guangzhou-
Shenzhen-Hong Kong
Corridor
MEGA CITY
City with a minimum
population of 8 million and
a GDP of $250 billion in
2025 (12 Mega Cities in
2011 and 35 Mega Cities in
2025)
EXAMPLE: Greater Tokyo
(Population of over 27
million by 2025)
MEGA SLUMS
1 billion urban poor live in
an area measuring just 1.5
square miles
Source: Frost & Sullivan Analysis. Image Source: Dreamstime
Urbanization Trends, Global, 2011–2025

4 NA99-13
The Future of Urban Distribution The Hub-and-Spoke Logistics Model In Urban Environment Will Feature Mega Size Warehouses on Outskirts of
Cities, with Smaller Decentralized Warehouses Inside the City Perimeter
The Spokes: Drop off delivery points for
double-trailer trucks
Heavy commercial
vehicles (double-
trailer trucks) will carry
goods to big warehouses
at outskirts
Macro to Micro Implications
The Hub: Central Distribution Centers
• All trucks to operate at 80%–
100% capacity (load factor)
• New technologies in tracking
deliveries, such as track and
trace, RFID in warehouses to
evolve
• New business models, such as
in-night services, special
delivery, and self-collection
points, to grow in popularity
• ~50% reduction in trucks going
in and out of cities
• Ensures “on-time delivery” for
retailers
Medium and
light CVs will
deliver goods to
warehouses within
city
Outer Ring Road
~ 25 miles from
City Center
Source: Frost & Sullivan Analysis.
Illustration of Global Urban Distribution in 2025

5 NA99-13
Multimodal Trends Influencing Urban Logistics Road and Rail Accounted for Nearly 60% of Total Domestic Freight Traffic in Large Trading Regions, Such as
EU and US in 2010
Modal Split of Domestic Freight, % (Million tonne per km), Global, 2010
Source: Eurostat, US Bureau of Transportation Statistics
29%
31%
12%
8%
Road Rail Water Air
49%
10%
38%
0%
Road Rail Water Air
Modal Split of Domestic Freight, United States, %
(Million tonne per km), 2010
Modal Split of Domestic Freight, EU-27, % (Million
tonne per km), 2010

6 NA99-13
Multimodal Trends Influencing Urban Logistics — High Speed Rail High-speed Rail To Improve Logistics By Freeing Up Space For Freight and Offering Exclusive High-speed
Logistics Solutions
Source: Frost & Sullivan Analysis
Freeing up space for freight on road
and standard rail tracks as more
people move to high-speed mobility
High-speed freight trains that
transport cargo exclusively at the
same service cost as air, but at lesser
carbon cost
High-speed Mobility High-speed Logistics
• Congestion zones, low
emission zones
• Multimodal access point
• Reliable and convenient
• Reduction in delay and
commutation time
• Transport up to 300 km/h
in some countries
• Night time transportation:
no non-peak hours
restrictions
• Short transport time and
lesser truck trips
• Green in comparison to
planes
Impact of High-speed Rail on Logistics, Global
Image Source: Dreamstime

7 NA99-13
Connectivity Trends Influencing Urban Logistics — Location-based
Services (LBS) Over 40% of the connected devices globally will be LBS enabled by 2020
2011
Non-LBS Devices
5.58 Billion
Non-
Internet
Users
Total: 6.00 Billion
Connected Devices
LBS Devices
0.42 Billion
(7% of total)
LBS Devices
35.20 Billion
(44% of total)
2020
Total: 80.00 Billion
Connected Devices
Source: Frost & Sullivan
Subscriber Forecast of LBS Devices, Global, 2011 and 2020
Non-LBS Devices
44.80 Billion
• Navigation services will continue to drive growth in this market
• Core navigation features include voice-guided turn-by-turn directions with updated maps, 3D moving maps, and automatic rerouting for missed turns
• Enhanced features include integration with contacts; multiple route capability; real-time traffic; gas prices and weather information; voice recognition for address input; traffic-optimized routing; intelligent navigation rerouting and updated estimated time of arrival based on current traffic flow, among others

8 NA99-13
Bricks and Clicks: Growth in Online Retail to 2025 Global Online Retail Sales To Reach $4.3 Trillion By 2025 Accounting for 19% of Total Retail
Source: Frost & Sullivan analysis.
1.320 1.300
0.210 0.170 0.090
0
0.2
0.4
0.6
0.8
1
1.2
1.4
United States China UnitedKingdom
Japan Germany
$11.8 Trillion
$23.0Trillion
Retail Market
Size
Retail Market
Size
$0.550
Trillion
$11.250
Trillion
$4.300
Trillion
$18.700
Trillion
24% 18%
26% 10%
15%
5%
19%
2011 2025 Online Retail Top Markets, 2025
Online Sales Non-Online Sales % share of online in
total retail
1 2 3 4 5

9 NA99-13
Bricks and Clicks: Impact of Bricks and Clicks on Store Formats Retail Formats Are Becoming Smaller and Unique With More Emphasis Being Placed on the Concept and
Urban Location of the Store
0
20000
40000
60000
80000
100000
120000
140000
Pre-1970s 1970s 1980s 1990s 2000 2010 2011 2012
Av
era
ge S
tore
Siz
e (
Sq
ft)
Grocery
Stores
Convenience
Stores
Supermarkets
Club
Warehouses
Hypermarkets
Concept Stores
Express Stores
Store Format Average
Size
Grocery Store: Small market for
basic groceries
8,000
Convenience Store: A small
store selling basic items and
over-the-counter medicines
10,000
Supermarket: Large-size grocery
and basic items
80,000
Club Warehouse: Large store
selling only bulk quantities (e.g.
Sam’s Club)
100,000
Hypermarket: Large stores
combining a supermarket and a
department store (e.g., Carrefour
in UK; Wal-Mart Supercenter in
United States)
120,000
Concept Stores: Small- to
medium-sized manufacturer
stores (e.g., Apple)
50,000
Express Store: Small
convenience stores (e.g., Wal-
Mart Express)
12,000
Era of Expansion Era of Contraction
Source: RetailNet and Frost & Sullivan Analysis.
Evolution of Retail Formats, Global, 1970–2012

10 NA99-13
Bricks and Clicks: From Big-Box to Small Box Retailer Store Size to be 15%–20% Less than the Current Average Store Size by 2020
Size: 200,000 Sqft Size: 10,000 Sqft
Location: Semi-urban areas—less dense areas with small
populations.
Accessibility: Car drives–5 to 6 miles from city centers and urban
hubs.
Building Format: Leased/owned, large scale standalone
properties.
Shelf Capacity: 120,000 items Shelf Capacity: 12,000 items
15%–20%
smaller
Location: Urban shopping centers—a minimum of 1,000
urban population per sqkm
Accessibility: Walkable distance–2 to 3 miles from city
centers and urban hubs
Building Format: Leased small stores fit into existing city
buildings.
Big-Box Small Box
Source: Frost & Sullivan Analysis. Image Source: Dreamstime

11 NA99-13
Bricks and Clicks: New Retailing Business Models Case Study: Tesco Virtual Store Sparks New Generation of Grocery Shopping
1
2 3
4
Choose
grocery item
from “virtual
shelves”
Smartphone app registers
product of choice The product lands in
customer’s “virtual cart”
The product is
delivered to the
customer at a time
and date of his
choice
Number 1 shopping app in Korea,
with over 900,000 downloads
Online sales increased by 130%
since launch in 2011
Home plus online membership increased
by 76% since launch in 2011.
Virtual Store—The Fourth-
generation Retail Store
Virtual Store: Tesco Virtual Store Sparks New Generation of Grocery Shopping
Single virtual store opened in a subway
Source: RetailNet and Frost & Sullivan Analysis. Image Source: Tesco

12 NA99-13
Regional Distribution Center to Shop
(In-House)
Bricks (pre-2000) +Advent of Clicks (post-2000)
Source: Frost & Sullivan Analysis.
Impact of Bricks and Clicks on Logistics Evolution of Bricks and Clicks Model in Logistics
Central Distribution Center to Customer
(Packing and Last Mile Delivery Outsourced)
Bricks and Clicks (2012 and Beyond) Hub and Spoke For Faster Deliveries
(Special Delivery Options Such as Same-Day Outsourced)
E.g. Wal-Mart US E.g. Amazon US
Same-Day Night Time Robotic Warehouses Stores as DCs Locker Boxes
Each distribution
center supports 90
to 100 stores in a
200-mile radius.
Closest Central
Distribution center
identifies and sorts
product which then
packed and
delivered by UPS
Image Source: Dreamstime, Wal-Mart, Amazon and Tesco
13 NA99-13
Urban Logistics
14 NA99-13
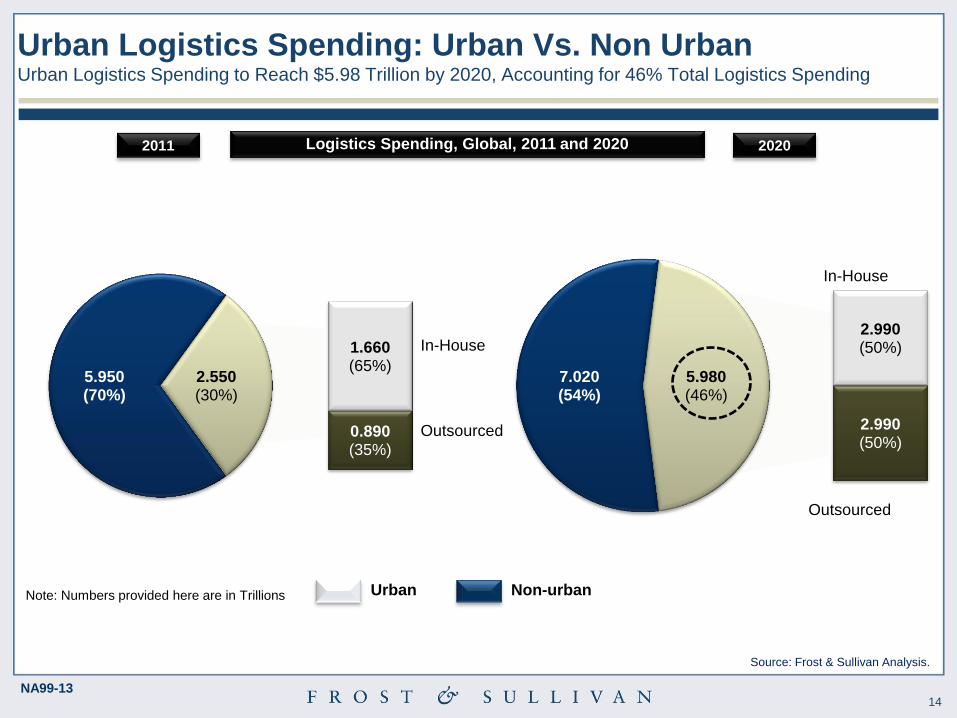
5.950 (70%)
1.660 (65%)
0.890 (35%)
2.550 (30%)
Urban Logistics Spending: Urban Vs. Non Urban Urban Logistics Spending to Reach $5.98 Trillion by 2020, Accounting for 46% Total Logistics Spending
7.020 (54%)
2.990 (50%)
2.990 (50%)
5.980 (46%)
2011 2020
In-House
Outsourced
In-House
Outsourced
Urban Non-urban
Logistics Spending, Global, 2011 and 2020
Source: Frost & Sullivan Analysis.
Note: Numbers provided here are in Trillions

15 NA99-13
Retail Pharmaceutical Food & Beverages
Smaller Stores Generic Medicines
More regulations
Chilled and Frozen
Food Industry Trend
Urban Logistics
Implication
Smaller shelf size –
need for constant
replenishment
No more
homogenous single
supply chain model
Need for Cold Supply
Chain Services
Urban Logistics
Services
Retail Consolidation
Centres Pack-to-order
Refrigerated Locker
Boxes
Top Industries Leveraging Urban Logistics Services in Future
Source: Frost & Sullivan Analysis.

16 NA99-13
$2.55
trillion
$5.98
Trillion
50% 55% Transportation & Distribution
Warehousing
Value-Added
2011 2020
2.5x Urban Logistics Spending
32%
18%
23%
22%
Urban Logistics Spending by Segments Transportation Costs will Rise and Account for Majority of Urban Logistics Costs while Warehousing Costs
Decline

17 NA99-13
Examples of Key Cities That Have Trialed City Logistics Policies: Time Windows, Vehicle Weight Restrictions, and Multimodal Initiatives Emerge As Most Popular Measures
Implemented For City Logistics Management
City Low
Emission
Zones
Time
Windows
Vehicle
Weight
Restrictions
Pricing /
Subsidies
Loading
and
unloading
zones
Special
Lanes
Urban
Consolidation
centers
Multimodal
Initiatives
London
Barcelona
Berlin
New York
Paris
Tokyo
Utrecht
Beijing
Mexico City
Mumbai
Seoul
Source: Turblog, World Bank, International Transportation Forum, MDS Transmodal Limited, Frost & Sullivan
Measures by City Authorities to Manage Urban Logistics, Global, 2005–2012
Highly Active / Implemented

18 NA99-13
Examples of Urban Logistics Business Models From LSPs* Targeted Deliveries, Hybrid Fleets, and Bundling of Consignments Emerge As Most Popular Measures
Implemented For City Logistics Management
Off-peak
Deliveries
(Night
Deliveries/
Early-morning
Deliveries)
Green
Vehicles
(Electric,
Hybrid,
Natural Gas)
Non-
conventional
modes of
Delivery
(Trams, Foot,
Bicycles)
Urban
Consolidation
centers
Locker Boxes
(Automated
Locker Boxes)
Pick-up Vans/
Outlets
(Parked Vans;
Store-pick-
ups)
Smart routing
and
Scheduling
(sensors, GPS,
telematics,
real-time
monitoring)
DHL
UPS
FedEx
TNT
Kuehne-
Nagel
DB
Schenker
*The above examples are tactics and strategies trialed/piloted by LSPs in certain cities only (mainly in Europe). These are currently not offered
in all cities as full-time services. These examples have been collated here for illustration purposes only.
Source: Frost & Sullivan Analysis.
Business Models by LSPs Targeting Urban Logistics, Global, 2005–2012
Highly Active / Implemented

19 NA99-13
Urban Logistics Trends : Trends in Urban Freight Distribution Distribution will be Shared and become more Consolidated
Deliveries to cities travel
from warehouses directly
to distribution points,
making multiple trips and
resulting in high
congestion and rising
C02 emissions in urban
areas
Consolidation centers in
cities will sort and
dispatch goods
intelligently, avoiding the
need for multiple trips
and thereby reducing
congestion and C02
levels
Without Consolidation Centers
With Consolidation Centers
Source: Frost & Sullivan Analysis.
20 NA99-13
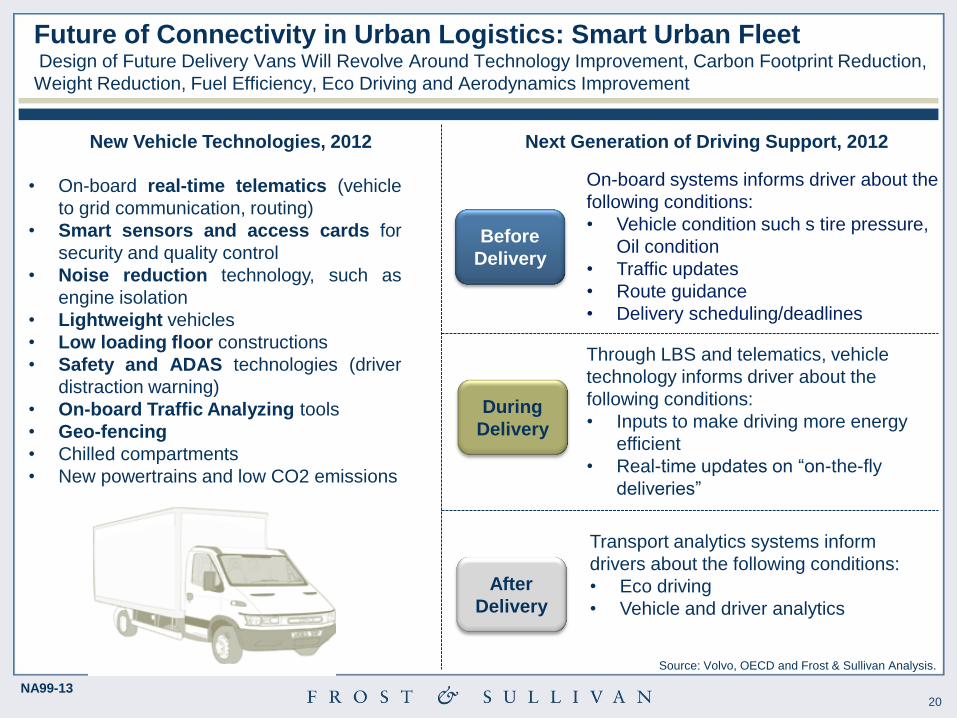
Future of Connectivity in Urban Logistics: Smart Urban Fleet Design of Future Delivery Vans Will Revolve Around Technology Improvement, Carbon Footprint Reduction,
Weight Reduction, Fuel Efficiency, Eco Driving and Aerodynamics Improvement
Before
Delivery
During
Delivery
After
Delivery
• On-board real-time telematics (vehicle
to grid communication, routing)
• Smart sensors and access cards for
security and quality control
• Noise reduction technology, such as
engine isolation
• Lightweight vehicles
• Low loading floor constructions
• Safety and ADAS technologies (driver
distraction warning)
• On-board Traffic Analyzing tools
• Geo-fencing
• Chilled compartments
• New powertrains and low CO2 emissions
New Vehicle Technologies, 2012 Next Generation of Driving Support, 2012
On-board systems informs driver about the
following conditions:
• Vehicle condition such s tire pressure,
Oil condition
• Traffic updates
• Route guidance
• Delivery scheduling/deadlines
Through LBS and telematics, vehicle
technology informs driver about the
following conditions:
• Inputs to make driving more energy
efficient
• Real-time updates on “on-the-fly
deliveries”
Transport analytics systems inform
drivers about the following conditions:
• Eco driving
• Vehicle and driver analytics
Source: Volvo, OECD and Frost & Sullivan Analysis.
21 NA99-13
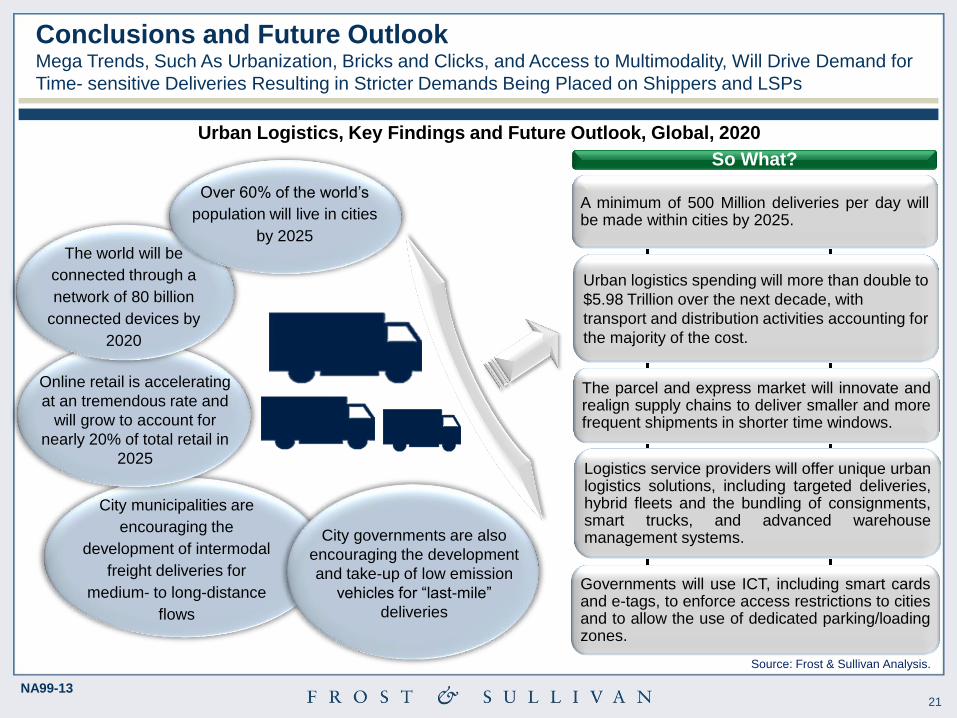
A minimum of 500 Million deliveries per day will be made within cities by 2025.
Urban logistics spending will more than double to
$5.98 Trillion over the next decade, with
transport and distribution activities accounting for
the majority of the cost.
So What ?
Over 60% of the world’s
population will live in cities
by 2025 The world will be
connected through a
network of 80 billion
connected devices by
2020
Online retail is accelerating
at an tremendous rate and
will grow to account for
nearly 20% of total retail in
2025
The parcel and express market will innovate and realign supply chains to deliver smaller and more frequent shipments in shorter time windows.
City municipalities are
encouraging the
development of intermodal
freight deliveries for
medium- to long-distance
flows
Logistics service providers will offer unique urban logistics solutions, including targeted deliveries, hybrid fleets and the bundling of consignments, smart trucks, and advanced warehouse management systems.
Governments will use ICT, including smart cards and e-tags, to enforce access restrictions to cities and to allow the use of dedicated parking/loading zones.
City governments are also
encouraging the development
and take-up of low emission
vehicles for “last-mile”
deliveries
So What?
Conclusions and Future Outlook Mega Trends, Such As Urbanization, Bricks and Clicks, and Access to Multimodality, Will Drive Demand for
Time- sensitive Deliveries Resulting in Stricter Demands Being Placed on Shippers and LSPs
Urban Logistics, Key Findings and Future Outlook, Global, 2020
Source: Frost & Sullivan Analysis.

22 NA99-13
Thank You
Sandeep Kar Global Director- Commercial Vehicle Research
Direct: +1. 416.490.7796
Fax: +1.416.490.1533
Email: [email protected]


