
1
White Paper
Menu Modeling Demonstrates Feasibility, Nutritional Value and Affordability of Frozen Foods
Betsy Hornick, MS, RD
Summary
Frozen foods fit the way people live and eat today. Results from menu modeling show that realistic, balanced and affordable menus featuring mostly frozen foods can meet energy, nutrient and cost goals based on recommendations from the 2015-2020 Dietary Guidelines for Americans (DGAs), MyPlate, and the U.S. Department of Agriculture’s (USDA) Moderate Cost Food Plan. Consumers often believe that fresh foods are the most nutritious, yet recent research reveals that the nutritional value of frozen fruits and vegetables is generally equal to, and in some cases better than, their fresh counterparts. Evidence also suggests that consumers of frozen meals tend to eat more vegetables, beans and whole grains. To evaluate the feasibility, nutritional value and affordability of a weekly menu consisting primarily of frozen foods, menu modeling was used to bring recommended USDA food patterns to life with frozen foods. Seven days of menus featuring frozen foods were developed to meet the needs of an adult woman 19-50 years (1,800-2,000 calories), based on recommendations from the 2015-2020 DGAs, MyPlate food group guidelines and Dietary Reference Intakes (DRIs). Meals and snacks included prepared frozen food items or were based on simple recipes using frozen foods. Menus were analyzed for energy and key nutrients, including fat, saturated fat, sodium, potassium, carbohydrates, dietary fiber, protein, vitamins A, C, and D, calcium, and iron. Daily and weekly menu cost was calculated based on cost per serving data obtained from retail stores.
Introduction
Today’s frozen food aisles offer a wide variety of
easy-to-prepare, nutritious and affordable foods
representing all five recommended food groups.
Over the past 50 years, as the amount of time
Americans spend in meal preparation has steadily
declined(1), frozen foods have become a staple
with convenience as a major factor in their
popularity. Frozen foods can be used as ingredients
or meal components, as well as ready-to-cook foods
appropriate for any meal and eating occasion,
including main dishes, side dishes, snacks,
complete meals, and desserts. Frozen food makers
are continually offering new, innovative food
options to meet evolving consumer needs and
desires. Many products now contain less fat, sugar
and sodium. Others make use of whole wheat
grains, added fiber and contain no trans fat. Single-
serve frozen dishes or meals help to support portion
control and may assist in weight management.(2)
Frozen meals can be more sustainable by
minimizing food waste, and are often more
affordable compared to equivalent restaurant
meals.(2,3)

American Frozen Food Institute 2
A menu modeling study was conducted to assess
the feasibility, nutritional value and affordability of
a weekly menu consisting primarily of frozen
foods. Menu modeling is a tool for bringing daily
food patterns to life with foods available to
consumers. It was used in this analysis to evaluate
the nutritional profile of realistic menus that
demonstrate how specific frozen foods can be
included in a healthy, balanced eating plan. The
primary objective of this study was to determine if
a practical and realistic weekly menu using
primarily frozen foods could meet recommended
nutrition guidelines. A secondary objective was to
evaluate cost of the menu for comparison with
USDA Food Plan costs.(4)
Methods
Daily menus that included a variety of frozen food
items were developed to meet the energy and
nutrient goals of an adult female, and comply with
recommended food group amounts from the
Healthy U.S.-Style Eating Pattern for a 2,000
calorie diet.(5) Menus were analyzed using the
ESHA Nutrition Analysis and Product Labeling
Software. Nutrition and cost information were
collected for frozen food items from several retail
stores in the Chicago/Northern Illinois region,
including Walmart, Aldi, and Woodman’s.
Nutrient data from product labels and cost per
serving were entered into the ESHA Food
Processor database, which includes both
manufacturer nutrient data as well as data from the
most current USDA National Nutrient Database for
Standard Reference.(6)
Major brands used in the menus included Nestlé,
ConAgra, Kellogg’s, General Mills, Kraft Heinz,
Pinnacle Foods Group, Hillshire/Tyson’s, Dole and
The Schwan Food Company, as well as private
labels from Walmart and Aldi food stores. Efforts
were made to include a variety of food items
representative of a typical market basket, including
national brands and some “better-for-you” products
(1-3 items per day) available in retail stores and
accessible to a wide range of consumers. “Better-
for-you” products were defined for this study as
items available with fewer calories, fat, or sodium,
or fortified with additional nutrients or containing
whole grains, as compared to a regular version.
Frozen food items appropriate for breakfast, lunch,
dinner, and snacks made it possible to feature
primarily frozen foods in all meals and snacks. To
help meet energy and nutrient requirements in some
of the daily menus, frozen yogurt and a few non-
frozen food items (milk, yogurt, spreads, oil, coffee
and tea) were included.
Results
A weekly menu comprised of nearly all (~95%)
frozen foods met most DGA and MyPlate food
group recommendations for an adult woman (19-50
years). This translated to an average of 90 percent
of the calories coming from frozen foods in the 7
days of menus, with daily calories from frozen
foods ranging from 84-100 percent. The weekly
menus met, on average, at least two-thirds of daily
requirements for nutrients identified in the DGAs
as falling short in typical diets (calcium, vitamin D,
potassium, fiber, iron).(5) The average daily cost
of the frozen food menu was $8.52 with a weekly
cost of $59.6 (Table 1) which is within limits for
the USDA weekly moderate-cost food plan for an
adult female 19-50 years of age as of June 2015
($59.70).(4)
Daily menus met recommended guidelines (+/-
10%) for the primary targets for a 2,000-calorie
diet, including most MyPlate food groups, as well
as nutrient needs when averaged over the seven
days (Tables 2 and 3). Daily sodium ranged
between 2,240 and 2,450 milligrams over the 7
days, with an average (2,383 mg) below the Daily
Value of 2,400 milligrams. Energy and other key
nutrients, including total fat, saturated fat, trans fat,
carbohydrates, and fiber were within Daily Value
goals. Secondary targets to meet at least two-thirds
of the Daily Value for reported vitamins and
minerals (vitamin A, vitamin C, calcium, and iron)

American Frozen Food Institute 3
were met when averaged over the seven days. The
recommended daily vitamin D intake would be
easier to achieve (average of 67% DV in this
Table 1: Weekly costs for frozen food menus
COST
Daily Average $8.52
Weekly Total $59.66
analysis) if the three servings/day from the dairy
group were met, although the average calcium
provided did meet the requirement for an adult
woman (1,000 mg/day). Nutrients of public health
concern—potassium and vitamin D—were
included in the analysis; however, the amounts
were extrapolated from USDA data since these
nutrients are not consistently reported on food
labels, and should be considered estimates.
Table 2: Weekly averages for energy and nutrients in the frozen food daily menus
*Data extrapolated from USDA database for nutrients not reported on label
Table 3: Weekly averages for food group amounts in frozen food daily menus
NUTRIENT WEEKLY AVERAGE %DV
Calories 1,916 -
Fat (g) 55 85
Saturated fat (g) 16 81
Trans fat (g) 0 -
Cholesterol (mg) 182 61
Sodium (mg) 2,383 99
Potassium (mg)* 3,219 92
Carbohydrates (g) 280 93
Dietary Fiber (g) 26 106
Sugars (g) 114 -
Protein 77 -
Vitamin A (IU) 5,483 109
Vitamin C (mg) 143 263
Calcium (mg) 1,007 103
Iron (mg) 12.2 70
Vitamin D (IU)* 268 67
MYPLATE FOOD GROUPS
WEEKLY AVERAGE GOALS FOR 2,000 CALORIE DIET PERCENT OF GOAL
Grains/ whole grains
6.5 oz 2.8 oz
6 oz 3 oz
108 93
Fruits 2.2 cups 2 cups 110
Vegetables 2.5 cups 2.5 cups 100
Dairy 1.9 cups 3 cups 63
Protein 5.4 oz 5.5 oz 98

American Frozen Food Institute 4
Discussion
Key Findings
Several observations and challenges were noted in
the evaluation of study results.
A weekly menu comprised of nearly all (~95%)
frozen foods met most DGA recommendations
for an adult woman (19-50 years), including at
least 2/3 of nutrients that typically fall short in
the American diet.
All food groups are well represented in frozen
foods. However, meeting daily food group
recommendations for dairy foods that are not
desserts can be challenging if using the 2015-
2020 Healthy U.S.-Style Eating Pattern.
Additional servings of milk and yogurt may be
needed to meet recommended daily dairy group
amounts, which would also help to meet
vitamin D goals. However, if using the new
Healthy Mediterranean-Style Eating Pattern,
dairy food group recommendations are more
easily met.
Frozen foods are typically easy to prepare and
serve. Many frozen prepared foods are ready-
to-cook and serve, while others require only
simple assembly and heating. Although not
measured in this study, there may be significant
time saved in preparing a frozen food, such as
lasagna or other main dish items, compared to
the home-cooked versions.
“Better-for-you” options are available in most
frozen food categories, making it easier for
consumers to control intakes of calories, fat,
sugar, saturated fat and sodium, and help to
improve intakes of typically under-consumed
nutrients, including calcium, fiber, potassium,
vitamin D, and iron. Daily sodium was below
2,400 milligrams, which is the most current and
available regulatory requirement for the Daily
Value of sodium.
Comparing the Nutrition Facts Panel on varying
brands and food items for amounts of nutrients
to limit, including fat, saturated fat, cholesterol,
and sodium, makes it possible to meet daily
recommendations, which is especially
important for individuals needing to address
certain health conditions, such as diabetes or
heart disease. For example, the selection of
foods lower in sodium, such as frozen
vegetables without sauces or seasonings, helps
to balance out foods higher in sodium.
Sodium in frozen food items can vary
considerably by the type of dish, ingredients
and level of preparation completed. Similar
products were compared in this analysis to
select frozen food items with lower amounts of
sodium. In addition to adding flavor, it should
be noted that sodium has other functional roles
in processed foods, including improving
texture, inhibiting growth of microorganisms
that cause spoilage and stabilizing ingredients
with high water content.
Frozen foods containing sugars used in the
menus were considered ‘nutrient-rich’ because
they also contributed to meeting food group
servings and nutrient requirements. For
example, frozen oatmeal provided a key source
of fiber, and frozen yogurt helped to meet daily
calcium requirements. Other menu examples of
nutrient-rich foods with sugars included frozen
fruit and bars, smoothies, bagels, and waffles.
Sugars provided an average of 24 percent of
daily calories, which included both naturally
occurring sugars from fruit and milk products,
and sugar added to certain foods.
The menu costs fell within the goal for USDA’s
Moderate Cost Meal Plan of $59.70 per week.
This was possible using a combination of
private label and major brands. This research
project did not rely on coupons; however, the
use of coupons and monitoring for store
specials also would help to control costs.

American Frozen Food Institute 5
A potential limitation in the feasibility of a
frozen food menu may include frozen storage
space, which will vary by individual freezer and
the frequency of grocery shopping.
Implications
Freezing as a means of safely preserving food has
been utilized for thousands of years. Today, a wide
variety of single ingredient and prepared frozen
foods has greatly improved the accessibility of safe,
nutritious, and affordable foods. With the rise in
availability of many different frozen foods and the
recognition that Americans do not meet
recommended daily intakes of fruits and
vegetables(7), has come heightened interest in the
potential nutritional advantages of frozen foods,
especially frozen fruits and vegetables. The 2015-
2020 DGA recommends increasing intakes of fruits
and vegetables in any form, including fresh, frozen,
and canned, dried and 100 percent juice
products.(5) Other food groups to encourage,
including whole grains and dairy foods, are also
available in the frozen food aisle. A recent analysis
of the nutrient intakes of consumers of frozen meals
compared to consumers of quick service restaurant
meals found that those who consumed frozen meals
had lower calorie intakes (253 calories on average)
and better Healthy Eating Index (HEI) scores,
which included higher intakes of vegetables, beans,
and whole grains.(8)
The belief that fresh foods have significantly
greater nutritional value compared to their frozen
counterparts has been disproven, with evidence that
some frozen fruits and vegetables are nutritionally
superior compared to their fresh counterparts.(9-
11) Fresh produce can spend several weeks in the
chain of producers, wholesalers, and retailers
before reaching consumers. Once in the home,
surveys show that Americans may, on average,
store perishable fruits and vegetables for up to five
days or more, based on bi-weekly grocery shopping
habits.(12) Over this extended period from farm to
table, varying levels of deterioration of certain
nutrients occurs. Frozen fruits and vegetables are
picked and frozen at their peak ripeness, often
within four to six hours of harvest, locking in the
nutrient value and flavor at the point of freezing.
Additionally, there may be greater consistency and
uniformity in the quality of frozen produce
compared to fresh.
A “market basket” study by the University of
Georgia mimicked consumer purchasing and
storage habits for blueberries, strawberries, corn,
broccoli, cauliflower, green beans, green peas and
spinach and analyzed the nutrient content under
three conditions: frozen; fresh (on the day of
purchase); and fresh-stored (after five days of
storage in a kitchen refrigerator).(9) The study
results revealed that the nutritional value of many
frozen fruits and vegetables are generally
equivalent to that of their fresh counterparts, and
levels of some nutrients in frozen fruits and
vegetables, including vitamins A and C and B-
vitamin, folate, is actually greater than that of fresh-
stored produce. This is likely due to the nutrient
degradation that occurs in fresh produce during
storage.
Similarly, two recent studies from the University of
California-Davis compared the retention of
vitamins, minerals, fiber and total phenolics
(health-promoting plant compounds) of eight
commonly purchased fruits and vegetables
(blueberries, strawberries, carrots, corn, broccoli,
green beans, green peas and spinach) in refrigerated
and frozen storage.(10,11) Locally grown,
harvested and stored fruits and vegetables were
analyzed under the following conditions: frozen
(analyzed within 24 hours of harvest and after 10
and 90 days of storage in a freezer) and fresh-stored
(analyzed within 24 hours of harvest and after three
and 10 days of storage in a refrigerator). The
nutritional value of water-soluble vitamins, namely
the amount of riboflavin (vitamin B2) and vitamin
C (ascorbic acid), was found to be generally the
same or greater in frozen versus fresh produce.
Additionally, the nutrient value of five minerals
(calcium, magnesium, zinc, copper, and iron), fiber
and total phenolics were, for the most part, well-

American Frozen Food Institute 6
conserved in frozen fruits and vegetables as
compared to fresh. Overall, these studies confirm
that the nutritional value of frozen fruits and
vegetables are generally equal to, and in some cases
better than, their fresh counterparts.
The affordability of frozen food compared to eating
out has also been recognized as a potential
advantage.(2) Frozen foods are often lower in cost
per serving than their fresh counterparts, and prices
are typically stable and projectable, especially for
frozen produce.(13) Compared to refrigerated
foods, frozen foods have much greater shelf life by
their very nature. Frozen fruits and vegetables can
be more easily portioned and stored for later use,
which reduces spoilage and food waste, further
increasing consumer value. A recent study of the
sustainability of frozen and fresh food in the United
Kingdom found that the significant reduction in
food waste associated with frozen foods (5.9
percent) vs. fresh food (10.4 percent) may have
important implications in developing strategies for
sustainable dietary options.(3)
The wide variety of frozen food items available to
consumers makes it easy to find food items that can
be combined to create realistic and appealing
menus that fit within dietary guidelines.
Convenient frozen prepared meal and snack items
were used in the menus, as well as frozen food
ingredients, to create simple and healthful meals.
In addition to affordability and nutritional value,
other advantages of frozen foods include
accessibility, convenience, food safety, quality, and
reduced waste.
Disclosures
Written by Betsy Hornick, MS, RD, LDN who is an Illinois-
based food and nutrition communications consultant and
also serves as the Academy of Nutrition and Dietetics
Manager of Acquisitions and Development. At the time of
publication, Ms. Hornick was a member of FoodMinds’
expert network. FoodMinds is a food and nutrition affairs
company that represents a range of food, nutrition, and
wellness organizations, including the American Frozen
Foods Institute. Financial support for the menu modeling
study was provided by the American Frozen Food Institute.
References
1. Hamrick KS, Andrews M, Guthrie J, Hopkins D,
McClelland K. How much time do Americans spend on
food? U.S. Department of Agriculture, Economic
Research Service, 2011. http://www.ers.usda.gov/media/
149404/eib86.pdf
2. American Frozen Foods Institute. Frozen Food Myths.
http://howfreshstaysfresh.com
3. Martindale W. Using consumer surveys to determine
food sustainability. Br Food J. 2014;116:1194-1204.
4. USDA. Official USDA Food Plans: Cost of Food at
Home at Four Levels, U.S. Average, May 2015.
http://www.cnpp.usda.gov/sites/default/files/CostofFoo
dJun2015.pdf
5. U.S. Department of Agriculture, and U.S. Department of
Health and Human Services. Dietary Guidelines for
Americans, 2015-2020. 8th Edition. http://health.gov/
dietaryguidelines/2015/guidelines/
6. U.S. Department of Agriculture, Agricultural Research
Service. 2014. USDA National Nutrient Database for
Standard Reference, Release 27. Nutrient Data
Laboratory Home Page. http://www.ars.usda.gov/
nutrientdata
7. Krebs-Smith SM, Guenther PM, Subar AF, Kirkpatrick
SI, Dodd KW. Americans do not meet federal dietary
recommendations. J Nutr. 2010;140:1832-38.
8. Fulgoni VI, Comerford KB, Krumhar KC. Consumption
of frozen meals as compared to quick service restaurant
meals is associated with better nutrient intakes in adult
participants of the National Health and Examination
Survey (2001-2010). J Acad Nutr Diet. 2014;114(Suppl
2):A-48.
9. University of Georgia. Potential Nutritional Effects of
Replacing Fresh Fruits and Vegetables in the Diets of
Americans with Frozen Counterparts. http://www.
frozenfoodfacts.org/assets-foundation/misc/images/UG
A%20Extended%20abstract.pdf
10. Bouzari A, Holstege D, Barrett DM. Vitamin retention in
eight fruits and vegetables: A comparison of refrigerated
and frozen storage. J Agric Food Chem. 2015;63:957-62.
11. Bouzari A, Holstege D, Barrett DM. Mineral, fiber, and
total phenolic retention in eight fruits and vegetables: A
comparison of refrigerated and frozen storage. J Agric
Food Chem. 2015;63:951-6.
12. Food Marketing Institute U.S. Grocery Shopper Trends
2012 Executive Summary; http://www.icn-net.com/
docs/12086_FMIN_Trends2012_v5.pdf
13. Stewart, Hayden, Jeffrey Hyman, Jean C. Buzby,
Elizabeth Frazão, and Andrea Carlson. How Much Do
Fruits and Vegetables Cost? EIB-71, U.S. Department of
Agriculture, Economic Research Service. February 2011.

American Frozen Food Institute 7
American Frozen Food Institute 8
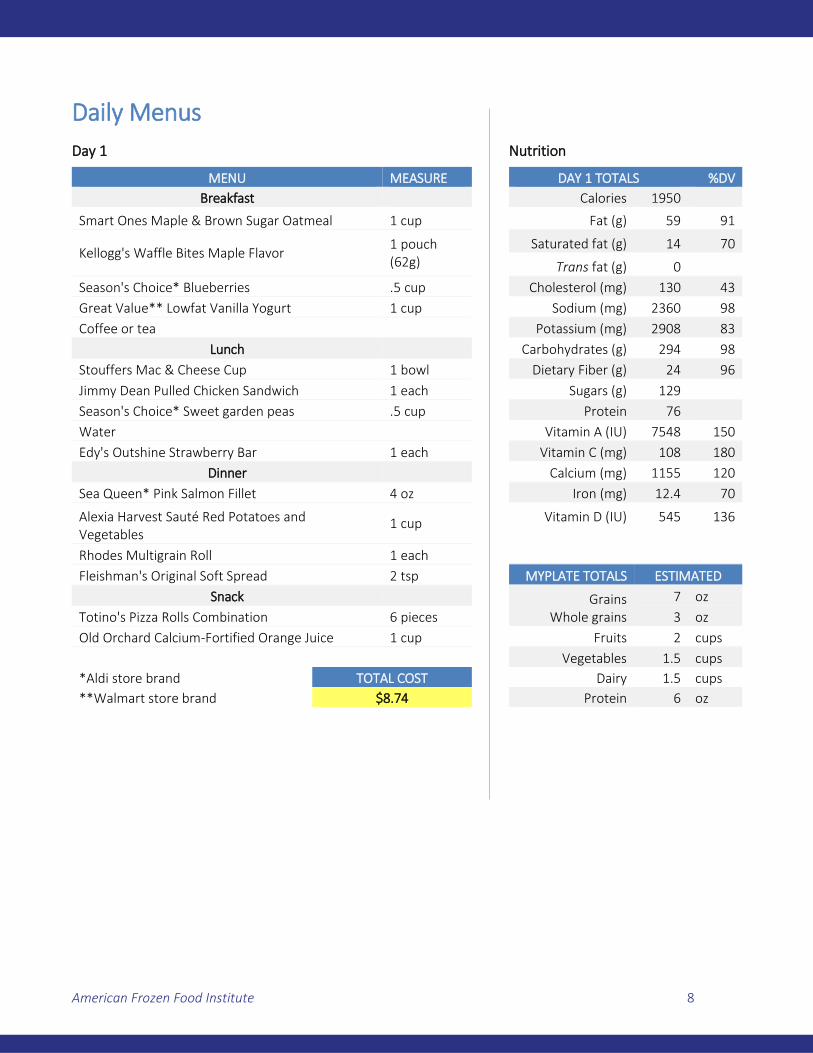
Daily Menus
Day 1 Nutrition
MENU MEASURE
DAY 1 TOTALS %DV
Breakfast Calories 1950
Smart Ones Maple & Brown Sugar Oatmeal 1 cup
Fat (g) 59 91
Kellogg's Waffle Bites Maple Flavor 1 pouch (62g)
Saturated fat (g) 14 70
Trans fat (g) 0
Season's Choice* Blueberries .5 cup Cholesterol (mg) 130 43
Great Value** Lowfat Vanilla Yogurt 1 cup Sodium (mg) 2360 98
Coffee or tea Potassium (mg) 2908 83
Lunch Carbohydrates (g) 294 98
Stouffers Mac & Cheese Cup 1 bowl Dietary Fiber (g) 24 96
Jimmy Dean Pulled Chicken Sandwich 1 each Sugars (g) 129
Season's Choice* Sweet garden peas .5 cup Protein 76
Water Vitamin A (IU) 7548 150
Edy's Outshine Strawberry Bar 1 each Vitamin C (mg) 108 180
Dinner Calcium (mg) 1155 120
Sea Queen* Pink Salmon Fillet 4 oz Iron (mg) 12.4 70
Alexia Harvest Sauté Red Potatoes and Vegetables
1 cup
Vitamin D (IU) 545 136
Rhodes Multigrain Roll 1 each
Fleishman's Original Soft Spread 2 tsp MYPLATE TOTALS ESTIMATED
Snack Grains Whole grains
7 oz
Totino's Pizza Rolls Combination 6 pieces 3 oz
Old Orchard Calcium-Fortified Orange Juice 1 cup Fruits 2 cups
Vegetables 1.5 cups
*Aldi store brand TOTAL COST Dairy 1.5 cups
**Walmart store brand $8.74 Protein 6 oz

American Frozen Food Institute 9
Daily Menus
Day 2 Nutrition
MENU MEASURE
DAY 2 TOTALS %DV
Breakfast Calories 1860
Aunt Jemima Ham & Cheese Omelet with Home Fries
1 serving
Fat (g) 62 95
Saturated fat (g) 17 85
Lender's Cinnamon Raisin Bagel 1 each Trans fat (g) 0
Fleishman's Original Soft Spread 2 tsp Cholesterol (mg) 310 103
Dole Shakers Smoothie- Mixed Berry 1 serving Sodium (mg) 2350 98
Coffee or tea Potassium (mg) 2634 75
Lunch Carbohydrates (g) 252 84
Ball Park Turkey Patty 1 patty Dietary Fiber (g) 21 84
Rhodes Multigrain Roll 1 each Sugars (g) 99
Alexia Sweet Potato Fries 3 oz Protein 77
Nature's Nectar* Apple Juice 1 cup Vitamin A (IU) 5180 100
Dinner Vitamin C (mg) 168 280
Tombstone Original Vegetable Pizza 1 slice Calcium (mg) 1005 100
Alexia Sauté Reds with Portabella Mushrooms, Green Beans, Onions
1 cup Iron (mg) 10.2 60
Vitamin D (IU) 161 40
Season's Choice* Strawberries and Blueberries 1 cup
Low-fat milk 1 cup
Snack MYPLATE TOTALS ESTIMATED
Edy's Simply Yogurt Blueberry Bar 1 bar Grains Whole grains
6 oz
2 oz
*Aldi store brand TOTAL COST Fruits 2.5 cups
$8.42 Vegetables 2.5 cups
Dairy 2.5 cups
Protein 4.5 oz

American Frozen Food Institute 10
Daily Menus
Day 3 Nutrition
MENU MEASURE
DAY 3 TOTALS %DV
Breakfast Calories 1930
Great Value** Lowfat Vanilla Yogurt 1 cup
Fat (g) 47 72
Special K Egg with Vegetables & Pepper Jack Cheese Flatbread Breakfast Sandwich
1 sandwich Saturated fat (g) 15 75
Trans fat (g) 0
Dole Peaches 1 cup Cholesterol (mg) 215 72
Coffee or tea Sodium (mg) 2320 97
Lunch Potassium (mg) 3657 102
Lean Cuisine Philly Style Steak & Cheese Panini 1 sandwich Carbohydrates (g) 292 97
Season's Choice* Extra Fine Green Beans 1 cup Dietary Fiber (g) 30 120
Dole Banana Dippers with Almonds 1 pkg Sugars (g) 140
Nature's Nectar* Apple Juice 1 cup Protein 84
Dinner Vitamin A (IU) 4902 100
Stir-fry made with Tyson Chicken Breast, boneless, skinless
4 oz Vitamin C (mg) 150 420
Calcium (mg) 1000 100
Season's Choice* Broccoli Stir-Fry 1 cup Iron (mg) 12 70
Canola oil 1 tsp
Vitamin D (IU) 144 36
Bird's Eye Steamfresh Brown Rice 1 cup
Rhodes Dinner roll 1 each
Dean's Frozen Greek Yogurt .5 cup MYPLATE TOTALS ESTIMATED
Bird's Eye Raspberries in syrup .5 cup Grains Whole grains
7 oz
Snack 3 oz
Pagoda Vegetable Egg Roll withSweet Chili Dipping Sauce
1 each Fruits 2.5 cups
Vegetables 2.5 cups
Dairy 2.5 cups
*Aldi store brand TOTAL COST Protein 6.5 oz
**Walmart store brand $10.65

American Frozen Food Institute 11
Daily Menus
Day 4 Nutrition
MENU MEASURE
DAY 4 TOTALS %DV
Breakfast Calories 1930
Red Baron Biscuit Style Sausage Scrambler 1 each
Fat (g) 69 106
Ore Ida Hash Browns .75 cup Saturated fat (g) 20 100
Fleishmann's Original Soft Spread 2 tsp Trans fat (g) 0
Tropicana Calcium & Vitamin D-Fortified Orange Juice
1 cup Cholesterol (mg) 165 55
Sodium (mg) 2410 100
Lunch Potassium (mg) 3871 110
Healthy Choice Sesame Chicken w Linguine & Vegetables
1 meal Carbohydrates (g) 243 81
Dietary Fiber (g) 34 136
Libby's Steam n Go Edamame 1 cup Sugars (g) 95
Dole Sunshine Blend- oranges, strawberries, pineapple
1 cup Protein 93
Vitamin A (IU) 7492 150
Water Vitamin C (mg) 174 290
Dinner Calcium (mg) 1175 120
Shepherds Pie made w/ 85% lean ground beef 3 oz Iron (mg) 12.9 70
Bird's Eye Recipe Ready Mirepoix .5 cup
Vitamin D (IU) 261 65
Mareta Marinara Sauce .5 cup
Ore Ida Steam n Mash Potatoes .75 cup
Rhodes Dinner roll 1 each MYPLATE TOTALS ESTIMATED
Low-fat milk 1 cup Grains Whole grains
6 oz
Snack 2 oz
TGI Friday's Spinach Artichoke Dip .25 cup Fruits 2 cups
Rhodes Multigrain roll 1 each Vegetables 2.5 cups
Dairy 1.5 cups
TOTAL COST Protein 5 oz
$8.82
American Frozen Food Institute 12
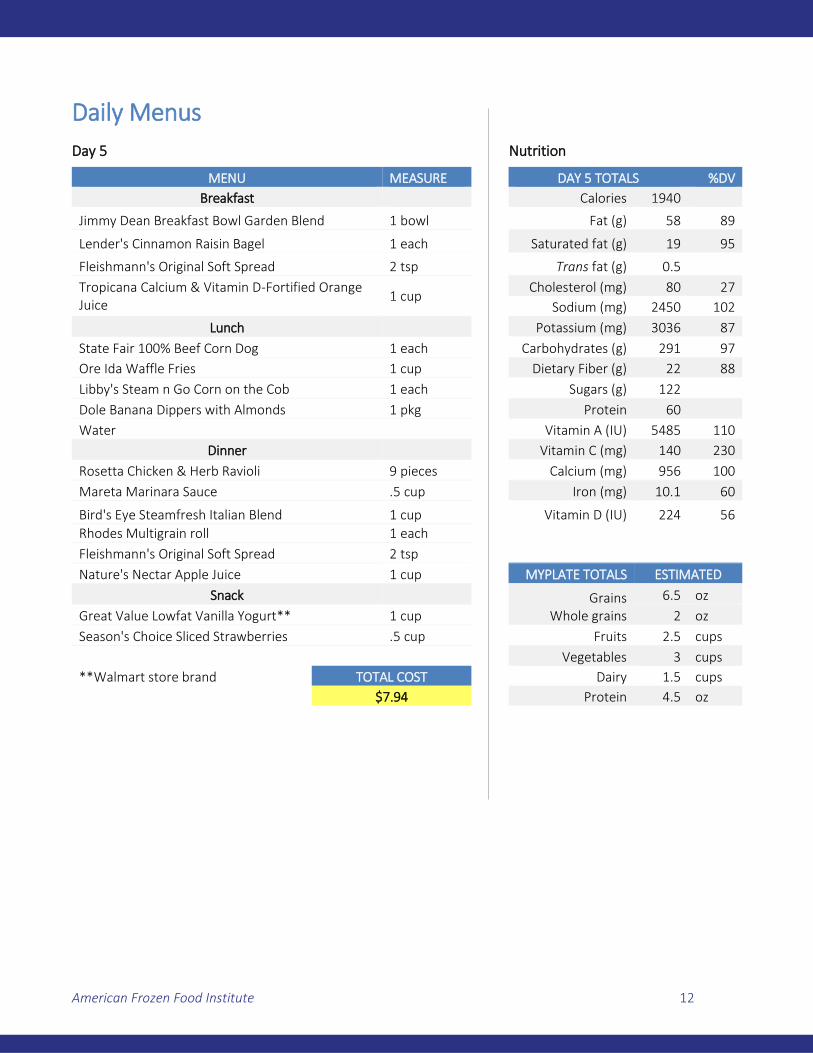
Daily Menus
Day 5 Nutrition
MENU MEASURE
DAY 5 TOTALS %DV
Breakfast Calories 1940
Jimmy Dean Breakfast Bowl Garden Blend 1 bowl
Fat (g) 58 89
Lender's Cinnamon Raisin Bagel 1 each Saturated fat (g) 19 95
Fleishmann's Original Soft Spread 2 tsp Trans fat (g) 0.5
Tropicana Calcium & Vitamin D-Fortified Orange Juice
1 cup Cholesterol (mg) 80 27
Sodium (mg) 2450 102
Lunch Potassium (mg) 3036 87
State Fair 100% Beef Corn Dog 1 each Carbohydrates (g) 291 97
Ore Ida Waffle Fries 1 cup Dietary Fiber (g) 22 88
Libby's Steam n Go Corn on the Cob 1 each Sugars (g) 122
Dole Banana Dippers with Almonds 1 pkg Protein 60
Water Vitamin A (IU) 5485 110
Dinner Vitamin C (mg) 140 230
Rosetta Chicken & Herb Ravioli 9 pieces Calcium (mg) 956 100
Mareta Marinara Sauce .5 cup Iron (mg) 10.1 60
Bird's Eye Steamfresh Italian Blend 1 cup
Vitamin D (IU) 224 56
Rhodes Multigrain roll 1 each
Fleishmann's Original Soft Spread 2 tsp
Nature's Nectar Apple Juice 1 cup MYPLATE TOTALS ESTIMATED
Snack Grains Whole grains
6.5 oz
Great Value Lowfat Vanilla Yogurt** 1 cup 2 oz
Season's Choice Sliced Strawberries .5 cup Fruits 2.5 cups
Vegetables 3 cups
**Walmart store brand TOTAL COST Dairy 1.5 cups
$7.94 Protein 4.5 oz

American Frozen Food Institute 13
Daily Menus
Day 6 Nutrition
MENU MEASURE
DAY 6 TOTALS %DV
Breakfast Calories 1880
Lean Cuisine Turkey Sausage Scramble 1 bowl
Fat (g) 51 78
Lender's Cinnamon Raisin Bagel 1 each Saturated fat (g) 14 70
Fleishmann's Original Soft Spread 2 tsp Trans fat (g) 0
Smoothie made with Great Value** Lowfat Vanilla Yogurt
1 cup Cholesterol (mg) 140 47
Sodium (mg) 2350 98
Season's Choice Berry Medley .5 cup Potassium (mg) 3210 92
Tropicana Calcium & Vitamin D-Fortified Orange Juice
.5 cup Carbohydrates (g) 276 92
Dietary Fiber (g) 24 96
Lunch Sugars (g) 108
Van de Camps Fish Sandwich Fillet 1 each Protein 76
Rhodes Multigrain roll 1 each Vitamin A (IU) 1752 35
Season's Choice* Veggie Fries 3 oz Vitamin C (mg) 131 220
Nature's Nectar Apple Juice 1 cup Calcium (mg) 795 80
Dinner Iron (mg) 11.7 70
Tyson Chicken Drumsticks, baked 4 oz
Vitamin D (IU) 400 100
Green Giant Steamers Broccoli Florets 1 cup
Bremer* Pasta Shells with Pesto Sauce 1 cup
Water MYPLATE TOTALS ESTIMATED
Snack Grains Whole grains
6 oz
Dole Banana Dippers with Almonds 1 pkg 2 oz
Fruits 2 cups
*Aldi store brand TOTAL COST Vegetables 3 cups
**Walmart store brand $7.94 Dairy 1.5 cups
Protein 6 oz

American Frozen Food Institute 14
Daily Menus
Day 7 Nutrition
MENU MEASURE
DAY 7 TOTALS %DV
Breakfast Calories 1920
Jimmy Dean Egg White, Spinach & Mozzarella Flatbread
1 sandwich
Fat (g) 40 62
Saturated fat (g) 15 75
Good Food Made Simple Steel Cut Oats w Maple Syrup
1 bowl Trans fat (g) 0
Cholesterol (mg) 235 78
Season's Choice* Sliced Strawberries .5 cup Sodium (mg) 2440 102
Tropicana Calcium & Vitamin D-Fortified Orange Juice
1 cup Potassium (mg)
Carbohydrates (g) 314 105
Lunch Dietary Fiber (g) 30 120
El Monterey Burrito Chicken, Rice, Beans 1 each Sugars (g) 106
Bird's Eye Steamfresh Southwestern Corn 1 cup Protein 73
Nature's Nectar* Apple Juice 1 cup Vitamin A (IU) 6022 120
Dinner Vitamin C (mg) 131 220
Reames Homestyle Egg Noodles 1 cup Calcium (mg) 960 100
Fit & Active* Turkey Meatballs 3 oz Iron (mg) 16 90
Libby's Maui Blend with Pineapple Glaze 1 cup
Vitamin D (IU) 144 36
Dean's Frozen Greek Yogurt .5 cup
Bird's Eye Raspberries in syrup .5 cup
Water MYPLATE TOTALS ESTIMATED
Snack Grains Whole grains
7 oz
Lean Pocket Whole Grain Chicken & Broccoli 1 each 3 oz
Fruits 2 cups
*Aldi store brand TOTAL COST Vegetables 2.5 cups
$7.15 Dairy 2 cups
Protein 5.5 oz


