
Meteorology Review Meteorology Review ObjectivesObjectives
InteractiveInteractive
Prepare for the Quiz and Regents ExamPrepare for the Quiz and Regents Exam
EckertEckert

1.1. Using the Using the Temperature ChartTemperature Chart in the ESRT in the ESRT make conversions between themake conversions between the
three temperature scales. three temperature scales.
The chart is on page 13 of the ESRT. The chart is on page 13 of the ESRT. Example; 140Example; 140o o F equals 60F equals 60oo C and 333 C and 333oo KelvinKelvin

What temperature in What temperature in degrees Fahrenheit is degrees Fahrenheit is equal to 40equal to 40oo C? C?
104104ooFF
What temperature in What temperature in degrees Celcius is degrees Celcius is equal to 40equal to 40oo F? F?
44ooCC

2. 2. Using the Using the Dewpoint TemperaturesDewpoint Temperatures in the ESRT, in the ESRT, determine the dewpointdetermine the dewpoint
temperature, given the dry-bulb and wet-bulb temperature, given the dry-bulb and wet-bulb
temperatures,temperatures,
The chart is on page 12 of the ESRT. The chart is on page 12 of the ESRT. Example; if the dry-bulb temperature is 16Example; if the dry-bulb temperature is 16o o
C, and the wet-bulb temperature is 12C, and the wet-bulb temperature is 12o o C, C, the dew point is 9the dew point is 9o o C.C.

What is the dew point if the dry-bulb is 6 and the wet-bulb is 4?
Remember the “difference.”
Dry = 6Dry = 6
Difference = 2Difference = 2
11ooCC

3. 3. Using the Using the Relative HumidityRelative Humidity in the ESRT, in the ESRT, determine the relativedetermine the relative
humidity, given the dry-bulb and wet-bulb humidity, given the dry-bulb and wet-bulb
temperaturestemperatures
The chart is on page 12 of the ESRT. The chart is on page 12 of the ESRT. Example; if the dry-bulb temperature is 20Example; if the dry-bulb temperature is 20o o
C, and the wet-bulb temperature is 15C, and the wet-bulb temperature is 15o o C, C, then the relative humidity is 58%.then the relative humidity is 58%.

What is the relative humidity if the dry-bulb is 6 and the wet-bulb is 4?
72%72%

4.4. a. Given a barograph, determine the air a. Given a barograph, determine the air
pressure to the nearest hundredth of an inchpressure to the nearest hundredth of an inch Students have a worksheet that contains a Students have a worksheet that contains a
barograph and problems where they must barograph and problems where they must read it.read it.
Picture from: http://www.yachtfiona.com/stormwithfionaname.html

4b. Using the 4b. Using the Pressure ChartPressure Chart in the ESRT, make air in the ESRT, make air
pressure conversion between millibars and inchespressure conversion between millibars and inches
The chart is on page 13 of the ESRT. The chart is on page 13 of the ESRT. Example; 1020.0 millibars equals 30.12 Example; 1020.0 millibars equals 30.12 inches inches

5.5. a. Name the source of most of a. Name the source of most of the Earth's energy.the Earth's energy.
The SunThe Sun
Picture from: http://stloe.most.go.th/html/lo_index/LOcanada7/703/4_en.htm

5b. List two other sources of energy 5b. List two other sources of energy for the earth.for the earth.
1) The decay of radioactive material in the 1) The decay of radioactive material in the Earth.Earth.
2) Heat left over from the formation of the 2) Heat left over from the formation of the EarthEarth..

6. 6. Describe the effect air temperature Describe the effect air temperature has on the air's capacity to hold waterhas on the air's capacity to hold water..
The higher the air temperature the more The higher the air temperature the more water vapor the air can hold.water vapor the air can hold.
Picture from:http://asd-www.larc.nasa.gov/edu_act/clouds_fig28.gif

7. 7. Identify the relationship between dewpoint and Identify the relationship between dewpoint and air temperature, that increases the probability of air temperature, that increases the probability of
precipitationprecipitation..The closer the dew point is to the air The closer the dew point is to the air
temperature the greater the probability of temperature the greater the probability of precipitation.precipitation.

8. 8. Describe the relationship between Describe the relationship between
relative humidity and air pressurerelative humidity and air pressure As relative humidity increases air pressure As relative humidity increases air pressure
decreases.decreases.

9. 9. Explain how changes in air temperature relate Explain how changes in air temperature relate to changes in air pressure.to changes in air pressure.
The lower the air temperature the higher the The lower the air temperature the higher the air pressureair pressure..

10. 10. Explain 3 conditions that lead to Explain 3 conditions that lead to the formation of a cloud:the formation of a cloud:
1) There must be water in the air.1) There must be water in the air.
2) There must be a surface for the cloud 2) There must be a surface for the cloud droplets to form on. (Condensation nuclei)droplets to form on. (Condensation nuclei)
3) The air temperature must be equal to the 3) The air temperature must be equal to the dew point.dew point.

11. 11. Explain how vertical movement in the Explain how vertical movement in the atmosphere results in changes in air temperature, atmosphere results in changes in air temperature,
air pressure, and dewpointair pressure, and dewpoint As air rises air pressure decreases allow the As air rises air pressure decreases allow the
air to expand, this causes the air air to expand, this causes the air temperature and dew point to decrease. temperature and dew point to decrease. The air temperature falls faster than the The air temperature falls faster than the dew point. This change in temperature as a dew point. This change in temperature as a result of a change in pressure is called an result of a change in pressure is called an adiabatic temperature change adiabatic temperature change

Picture from: http://www.csupomona.edu/~hcmireles/Courses/Sci210/Activities2005/MLittle2.html

12.12. a. Explain, which condition of cloud a. Explain, which condition of cloud formation, may result in the occurrence formation, may result in the occurrence
of precipitationof precipitation..For rain to happen a cloud needs to be stable For rain to happen a cloud needs to be stable
enough to allow for the time it takes for enough to allow for the time it takes for thousands of cloud droplets to join together thousands of cloud droplets to join together to form a rain droplet.to form a rain droplet.

12b. Identify one effect that 12b. Identify one effect that precipitation has on the atmosphere precipitation has on the atmosphere
Precipitation cleans the atmosphere Precipitation cleans the atmosphere

13. 13. Construct an isoline map, Construct an isoline map, given measured values.given measured values.
The students have had many practice maps to The students have had many practice maps to work on. There are 3 basic rules to follow:work on. There are 3 basic rules to follow:
1) Isolines never cross.1) Isolines never cross. 2) Isolines either form a circle or go to the 2) Isolines either form a circle or go to the
edge of the map.edge of the map. 3) You must follow the stated interval.3) You must follow the stated interval.

14. 14. Calculate the gradient on an isoline map, given Calculate the gradient on an isoline map, given the difference in field value between two locations, the difference in field value between two locations,
using the formula in the ESRTusing the formula in the ESRT..The formula is on page 1 of the ESRTThe formula is on page 1 of the ESRT

15. 15. Explain the relationship between air Explain the relationship between air
pressure gradient and wind velocitypressure gradient and wind velocity. . The greater the air pressure gradient the The greater the air pressure gradient the
greater the wind velocity.greater the wind velocity.

16. 16. Given a weather map showing isobars, identify Given a weather map showing isobars, identify on the map the area having the greatest pressure on the map the area having the greatest pressure
gradientgradient The wind velocity is the greatest where the The wind velocity is the greatest where the
isobars are closest togetherisobars are closest together
Picture from: http://www.physicalgeography.net/fundamentals/7n.html
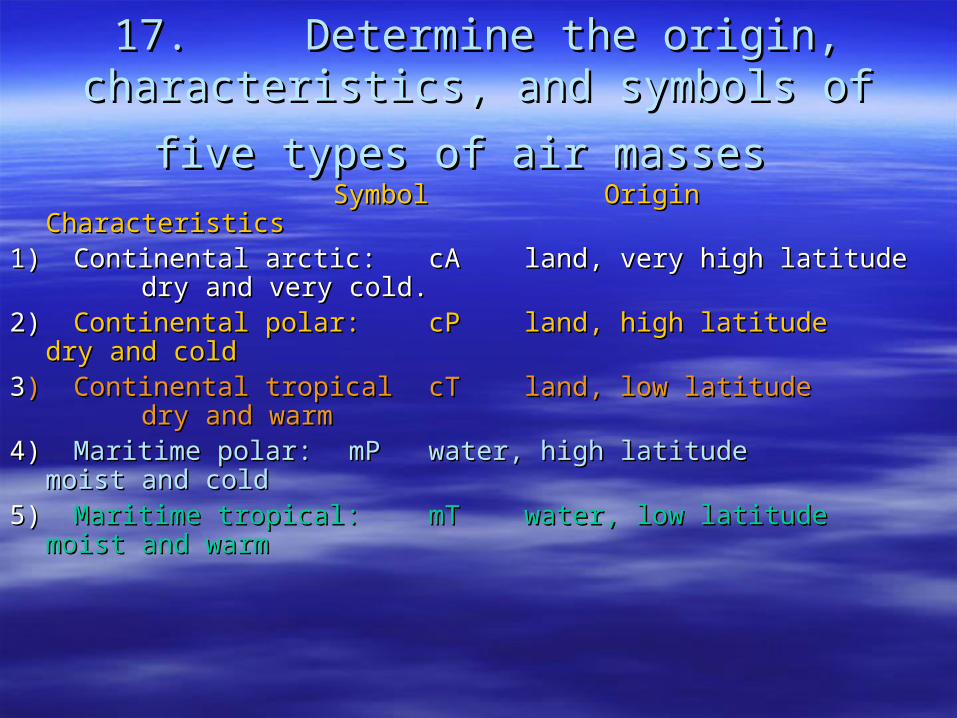
17. 17. Determine the origin, characteristics, and Determine the origin, characteristics, and
symbols of five types of air massessymbols of five types of air masses SymbolSymbol Origin Origin CharacteristicsCharacteristics
1) Continental arctic: 1) Continental arctic: cAcA land, very high latitude land, very high latitude dry and very cold.dry and very cold.2) 2) Continental polar:Continental polar: cP cP land, high latitudeland, high latitude dry and cold dry and cold33) Continental tropical) Continental tropical cTcT land, low latitude dry and warmland, low latitude dry and warm4) 4) Maritime polar:Maritime polar: mP mP water, high latitude water, high latitude moist and coldmoist and cold5) 5) Maritime tropical:Maritime tropical: mTmT water, low latitudewater, low latitude moist and warm moist and warm

http://members.aol.com/pakulda/images/stpptam.gif

18.18. a. Describe the air circulation pattern of a a. Describe the air circulation pattern of a low-pressure system:low-pressure system:
On the surface air moves in towards the On the surface air moves in towards the center and rotates counterclockwise.center and rotates counterclockwise.
In the center air risesIn the center air rises
http://www.uwsp.edu/gEo/faculty/ritter/images/atmosphere/pressure_wind/high_pressure_small.jpg
http://www.usatoday.com/weather/tg/wlowpres/wlowpres.htm
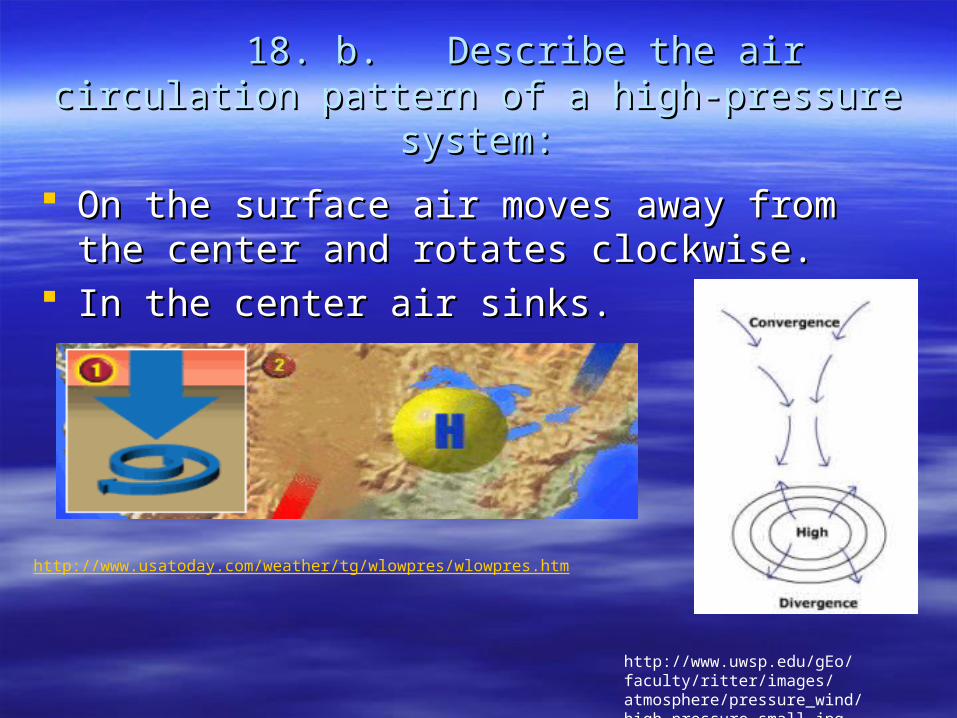
18. b. Describe the air circulation pattern of a 18. b. Describe the air circulation pattern of a high-pressure system:high-pressure system:
On the surface air moves away from the On the surface air moves away from the center and rotates clockwise.center and rotates clockwise.
In the center air sinks.In the center air sinks.
http://www.usatoday.com/weather/tg/wlowpres/wlowpres.htm
http://www.uwsp.edu/gEo/faculty/ritter/images/atmosphere/pressure_wind/high_pressure_small.jpg

19. 19. Using Using Weather Map Symbols and Present Weather Map Symbols and Present WeatherWeather in the ESRT, interpret information given in in the ESRT, interpret information given in
the station model formatthe station model format..The information students need is on page 13 The information students need is on page 13
of the ESRT. Students have a worksheet, of the ESRT. Students have a worksheet, which gives them practice reading, and which gives them practice reading, and make station models.make station models.

20.20. a. Locate the positions of a weather front on a. Locate the positions of a weather front on a weather map.a weather map.
Weather fronts always radiate Weather fronts always radiate from the center of low-from the center of low-pressure systems. The pressure systems. The actual fronts are located actual fronts are located between station models between station models that are close to each that are close to each other, but have very other, but have very different weather different weather conditions. For example conditions. For example two cities that near each two cities that near each other but have a 20other but have a 20oo temperaturetemperature differencedifference
http://ww2010.atmos.uiuc.edu/guides/mtr/af/frnts/wfrnt/gifs/cyc2.gif
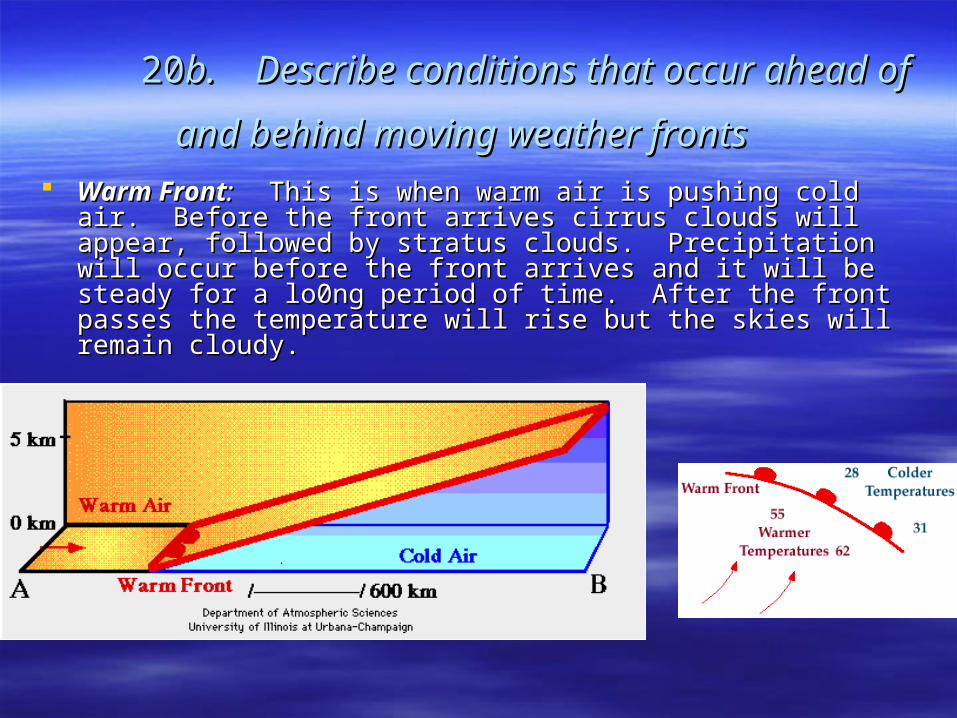
2020b. Describe conditions that occur ahead of b. Describe conditions that occur ahead of
and behind moving weather frontsand behind moving weather fronts Warm FrontWarm Front::This is when warm air is pushing cold air. This is when warm air is pushing cold air.
Before the front arrives cirrus clouds will appear, followed by Before the front arrives cirrus clouds will appear, followed by stratus clouds. Precipitation will occur before the front arrives stratus clouds. Precipitation will occur before the front arrives and it will be steady for a lo0ng period of time. After the front and it will be steady for a lo0ng period of time. After the front passes the temperature will rise but the skies will remain passes the temperature will rise but the skies will remain cloudy.cloudy.

2020b. Describe conditions that occur ahead b. Describe conditions that occur ahead of and behind moving weather frontsof and behind moving weather fronts
Cold FrontCold Front:: This is when cold air is pushing warm This is when cold air is pushing warm air. Cumulus clouds are found right at the front air. Cumulus clouds are found right at the front boundary. Rain is often hard but last for a short boundary. Rain is often hard but last for a short period of time. After the front passes temperature period of time. After the front passes temperature will fall but the skies will be clear.will fall but the skies will be clear.

21. 21. Analyze how wind direction is influenced by Analyze how wind direction is influenced by the rotation of the Earth.the rotation of the Earth.
This is the Coriolis Effect. North of the equator This is the Coriolis Effect. North of the equator the rotation of the Earth causes winds to the rotation of the Earth causes winds to curve to the right. South of the equator curve to the right. South of the equator winds curve to the left.winds curve to the left.
http://nsidc.org/arcticmet/images/factors/coriolis.gif

22. 22. Using the Using the Planetary Wind and Moisture BeltsPlanetary Wind and Moisture Belts in ESRT, identify the prevailing wind direction and in ESRT, identify the prevailing wind direction and
moisture conditions at specified latitudesmoisture conditions at specified latitudes The map is on page 14 of the ESRT. We live The map is on page 14 of the ESRT. We live
at 43at 43oo N, which the map shows is dominated N, which the map shows is dominated by winds that come from the southwest. 30by winds that come from the southwest. 30oo N is a latitude that has very dry climates.N is a latitude that has very dry climates.

23. 23. Predict the direction and rate of movement of Predict the direction and rate of movement of
weather systems and air masses in North Americaweather systems and air masses in North America
Because of the prevailing westerlies in North Because of the prevailing westerlies in North America, weather systems move from west America, weather systems move from west to east. They move on the average 400 to to east. They move on the average 400 to 600 miles a day600 miles a day..

24. 24. Construct a diagram of a land breeze or sea Construct a diagram of a land breeze or sea breeze. Label areas of high and low pressure, air breeze. Label areas of high and low pressure, air
temperatures, and wind direction.temperatures, and wind direction.
Sea breeze:Sea breeze: Happens during the daytime. Happens during the daytime. Wind blows from the water towards the land. The Wind blows from the water towards the land. The land has lower air pressure and a higher land has lower air pressure and a higher temperature than the water.temperature than the water.
Land breezeLand breeze: Happens during the nighttime. : Happens during the nighttime. Wind blows from the land to the water. The water Wind blows from the land to the water. The water has lower air pressure and a higher temperature has lower air pressure and a higher temperature than the landthan the land..

Sea BreezeSea Breeze
http://www.williamsclass.com/EighthScienceWork/Atmosphere/seabreeze.gif

Land BreezeLand Breeze
http://www.physicalgeography.net/fundamentals/images/landbreeze.gif

25.25. a. Describe how the location of the jet stream a. Describe how the location of the jet stream affects weather in North America.affects weather in North America.
The jet stream can move air masses around, The jet stream can move air masses around, which helps to determine the weather an which helps to determine the weather an area is going to have. The jet stream also area is going to have. The jet stream also acts as a temperature barrier. North of the acts as a temperature barrier. North of the jet stream will be cold, south will be warm.jet stream will be cold, south will be warm.
http://ww2010.atmos.uiuc.edu/guides/maps/upa/gifs/jet1.gif

25. b. Using the 25. b. Using the Planetary Wind and Moisture BeltsPlanetary Wind and Moisture Belts in the ESRT, in the ESRT,
determine the location of the Polar Jet Stream and determine the location of the Polar Jet Stream and the Subtropical Jet Stream.the Subtropical Jet Stream.
The map is on page 14 of the ESRT. The Polar The map is on page 14 of the ESRT. The Polar Front Jet Stream is found at 60Front Jet Stream is found at 60oo N and 60 N and 60oo S. S. The Subtropical Jet Stream is found at 30The Subtropical Jet Stream is found at 30oo N N and 30and 30oo S. S.

26. 26. Given a weather map, determine the weather Given a weather map, determine the weather conditions for a specified location in the next 24 conditions for a specified location in the next 24
hourshours Warm frontWarm front:: Gentile rain precedes the front. Gentile rain precedes the front.
Cirrus then stratus cloud also precede the front. Cirrus then stratus cloud also precede the front. After the front passes temperatures will increase After the front passes temperatures will increase and skies will remain cloudy.and skies will remain cloudy.
Cold front:Cold front: Heavy rain as the front passes. Heavy rain as the front passes. Cumulonimbus clouds are found at the front. After Cumulonimbus clouds are found at the front. After the front passes temperatures will drop and the the front passes temperatures will drop and the skies clear.skies clear.
Low pressureLow pressure: : Warm temperatures with clouds Warm temperatures with clouds and possibly rain.and possibly rain.
High pressureHigh pressure: : Cold temperatures with clear Cold temperatures with clear skies. skies.

27. 27. Analyze the differences in the origin and Analyze the differences in the origin and
characteristics of hurricanes and tornadoescharacteristics of hurricanes and tornadoes HurricanesHurricanes form over water near the equator in form over water near the equator in
the late summer or early fall. They cover 100's of the late summer or early fall. They cover 100's of square miles and last for days. Wind speeds are square miles and last for days. Wind speeds are from about 74 to 200 mph. The greatest danger is from about 74 to 200 mph. The greatest danger is from the storm surge.from the storm surge.
TornadoesTornadoes form over land at mid latitudes in the form over land at mid latitudes in the spring. They cover yards and last for minutes. spring. They cover yards and last for minutes. They produce the greatest wind speed on Earth. They produce the greatest wind speed on Earth. The top speed is unknown. The greatest danger The top speed is unknown. The greatest danger is from wind blown projectiles.is from wind blown projectiles.

28.28. Using Properties of Water in the ESRT, Using Properties of Water in the ESRT, determine the amount of energy absorbed or determine the amount of energy absorbed or
released during a phase change.released during a phase change.
The chart is on page 1 of the ESRT. If 10 g of The chart is on page 1 of the ESRT. If 10 g of ice melts 800 calories (10 * 80) of energy is ice melts 800 calories (10 * 80) of energy is stored. If 10 g water vapor is converted to stored. If 10 g water vapor is converted to liquid water 5,400 calories (10 * 540) of liquid water 5,400 calories (10 * 540) of energy is releasedenergy is released

29. 29. Evaluate the need for severe Evaluate the need for severe weather emergency preparedness.weather emergency preparedness.
Students have a pamphlet outlining how to Students have a pamphlet outlining how to prepare for various severe weather prepare for various severe weather conditions.conditions.

30. Describe variables that cause 30. Describe variables that cause daily temperature change daily temperature change
Cloud cover during the day blocks sunlight Cloud cover during the day blocks sunlight reducing the temperature. At night clouds reducing the temperature. At night clouds prevent re-radiated energy from the Earth prevent re-radiated energy from the Earth from going in to space that keeps the from going in to space that keeps the temperature relatively high. The duration of temperature relatively high. The duration of insolation also is important; the greater the insolation also is important; the greater the duration of insolation the higher the duration of insolation the higher the temperaturetemperature
31. In weather forecasting, evaluate the use of 31. In weather forecasting, evaluate the use of technology such as satellite images, radar, weather technology such as satellite images, radar, weather
maps and computers.maps and computers.
Increased technology has allowed accurate Increased technology has allowed accurate forecasts and has decreased loss of life.forecasts and has decreased loss of life.

32. 32. Using the Using the Selected Properties of Earth’s Selected Properties of Earth’s AtmosphereAtmosphere, determine the characteristics of the , determine the characteristics of the layers of the Earth's atmosphere using the ESRT.layers of the Earth's atmosphere using the ESRT.
The charts are on page 14 of the ESRT. These The charts are on page 14 of the ESRT. These charts show that as altitude increase air charts show that as altitude increase air pressure and the amount of water vapor pressure and the amount of water vapor decrease. The charts also have the four decrease. The charts also have the four main layers of the atmosphere labeled, and main layers of the atmosphere labeled, and how the temperature changes in each of how the temperature changes in each of these atmospheric layersthese atmospheric layers

What layer of the atmosphere has a temperature of -60 degrees Celsius?
MesosphereMesosphere
What is the altitude of the Stratopause in miles?
30 mi30 mi
What happens to water vapor as you increase in altitude? decreasesdecreases

33. Given the Dry-bulb and Dew point temperature, 33. Given the Dry-bulb and Dew point temperature, determine the elevation of a cloud base using determine the elevation of a cloud base using
the Cloud Base Altitude chartthe Cloud Base Altitude chart..Students have a worksheet that has the chart Students have a worksheet that has the chart
with several problems that required them to with several problems that required them to use the chart use the chart

VocabularyVocabulary
Atmosphere - Layer of gas that surrounds the Earth.Atmosphere - Layer of gas that surrounds the Earth. Weather - The short term atmospheric conditions in an Weather - The short term atmospheric conditions in an
area.area. Dewpoint - The temperature at which the air becomes Dewpoint - The temperature at which the air becomes
saturated.saturated. relative humidity- A comparison between how much water relative humidity- A comparison between how much water
is in the air to how much water the air could hold.is in the air to how much water the air could hold. jet stream - This is a high altitude, fast moving, river of air.jet stream - This is a high altitude, fast moving, river of air. prevailing wind - This is the direction that the wind comes prevailing wind - This is the direction that the wind comes
from most of the time for a given from most of the time for a given location. location.

VocabularyVocabulary
wind - Wind is the movement of air over the surface wind - Wind is the movement of air over the surface of the Earth.of the Earth.
conduction - Energy transfer method that involves conduction - Energy transfer method that involves collisions between particles. collisions between particles.
precipitation - This is water falling from the skyprecipitation - This is water falling from the sky radiation - Energy transfer method in which the radiation - Energy transfer method in which the
energy travels at the speed of light in transverse energy travels at the speed of light in transverse waves waves
weather front - A weather front is the boundary weather front - A weather front is the boundary between two different air massesbetween two different air masses

VocabularyVocabulary
convection - Energy transfer method that is the convection - Energy transfer method that is the result of differences in density. result of differences in density.
air mass - An air mass is a large body of air, air mass - An air mass is a large body of air, which has the same weather characteristics which has the same weather characteristics through out.through out.
anemometer - A tool use to measure wind anemometer - A tool use to measure wind velocity.velocity.
Barometer - A tool used to measure air Barometer - A tool used to measure air pressure.pressure.


