
Metrics-Driven Design
In Gods we trust, all others bring data.
by Joshua Porter

Dustin Curtis’ Twitter copy test was hugely popular, showing widespread interest in testing.

@bokardo
Small changes in copy can have large effects.

“Unfortunately for me, there was one small problem I didn’t see back then.”
Doug Bowman describes the reasons why he left Google after 3 years.

Metrics-Driven Design
“Daring. Decisive. Conviction.
Doug Bowman on Design at Google
Without a person at (or near) the helm who thoroughly understands the
principles and elements of Design, a company (Google) eventually runs out
of reasons for design decisions. With every new design decision, critics cry
foul. Without conviction, doubt creeps in. Instincts fail. “Is this the right
move?” When a company is filled with engineers, it turns to engineering to
solve problems. Reduce each decision to a simple logic problem. Remove
all subjectivity and just look at the data. Data in your favor? Ok, launch it.
Data shows negative effects? Back to the drawing board. And that data
eventually becomes a crutch for every decision, paralyzing the company
and preventing it from making any daring design decisions.

Metrics-Driven Design
“Daring. Decisive. Conviction.
Doug Bowman on Design at Google
Yes, it’s true that a team at Google couldn’t decide between two blues, so
they’re testing 41 shades between each blue to see which one performs
better. I had a recent debate over whether a border should be 3, 4 or 5
pixels wide, and was asked to prove my case. I can’t operate in an
environment like that. I’ve grown tired of debating such minuscule design
decisions. There are more exciting design problems in this world to tackle.

41 Bucket Split Test: ~2.5% of users each got a shade for 2 weeks.
41 Shades of Blue Test
Gmail Google Searchlink color
A perfect example of extreme optimization...testing tiny changes in shades of blue.

The more green the link, the worse the click-through. More blue = higher CTR.

Intuition-Driven Data-Driven
Design Spectrum
Make best-guesses
Rely on previous experience
Study what others are doing
Use best practices, principles & patterns
Might use data for trend-watching
Don’t have time to test details
Aesthetics are integral
Rely on our gut
Creative, visionary
Every design choice is tested
Takes others experience with a grain of salt
Design is a logic problem
Rely on data for decision-making
Aesthetics are secondary
No detail is too small to test
Never trust your gut
Cold, calculating
instinctive, subjective, daringDoug’s words:
deliberate, objective, safeImplied:

PoliticsPolitics, not a measurable user experience, often determines the design choices of many teams.

Prayerhttp://www.flickr.com/photos/c0t0s0d0/2334183401/
Prayer becomes the technique of choice on projects with no clear metrics.

Paralysishttp://www.flickr.com/photos/tmh9/245066417/
Paralysis is what happens when you don’t have clear design direction.

Metrics-Driven Design The grass is always greener on other mountainsides.
The Local Maxima Problem
Your Design
A Better Design
Optimized at Local Maxima
Current
Optimization only goes so far. UX Designers need to make bold leaps to find the next mountain.

Intuition-driven Design
Data-driven Optimization
Therefore, we need a balance between optimization and intuition. Both are necessary.

Metrics-Driven Design
“Balance
Evidence & Intuition
Radical innovation requires both evidence and intuition: evidence to become informed, and intuition to inspire us in imagining and creating new and better possibilities.
Jane Fulton Suri, IDEO
Metrics-Driven Design Goal: Healthy Business
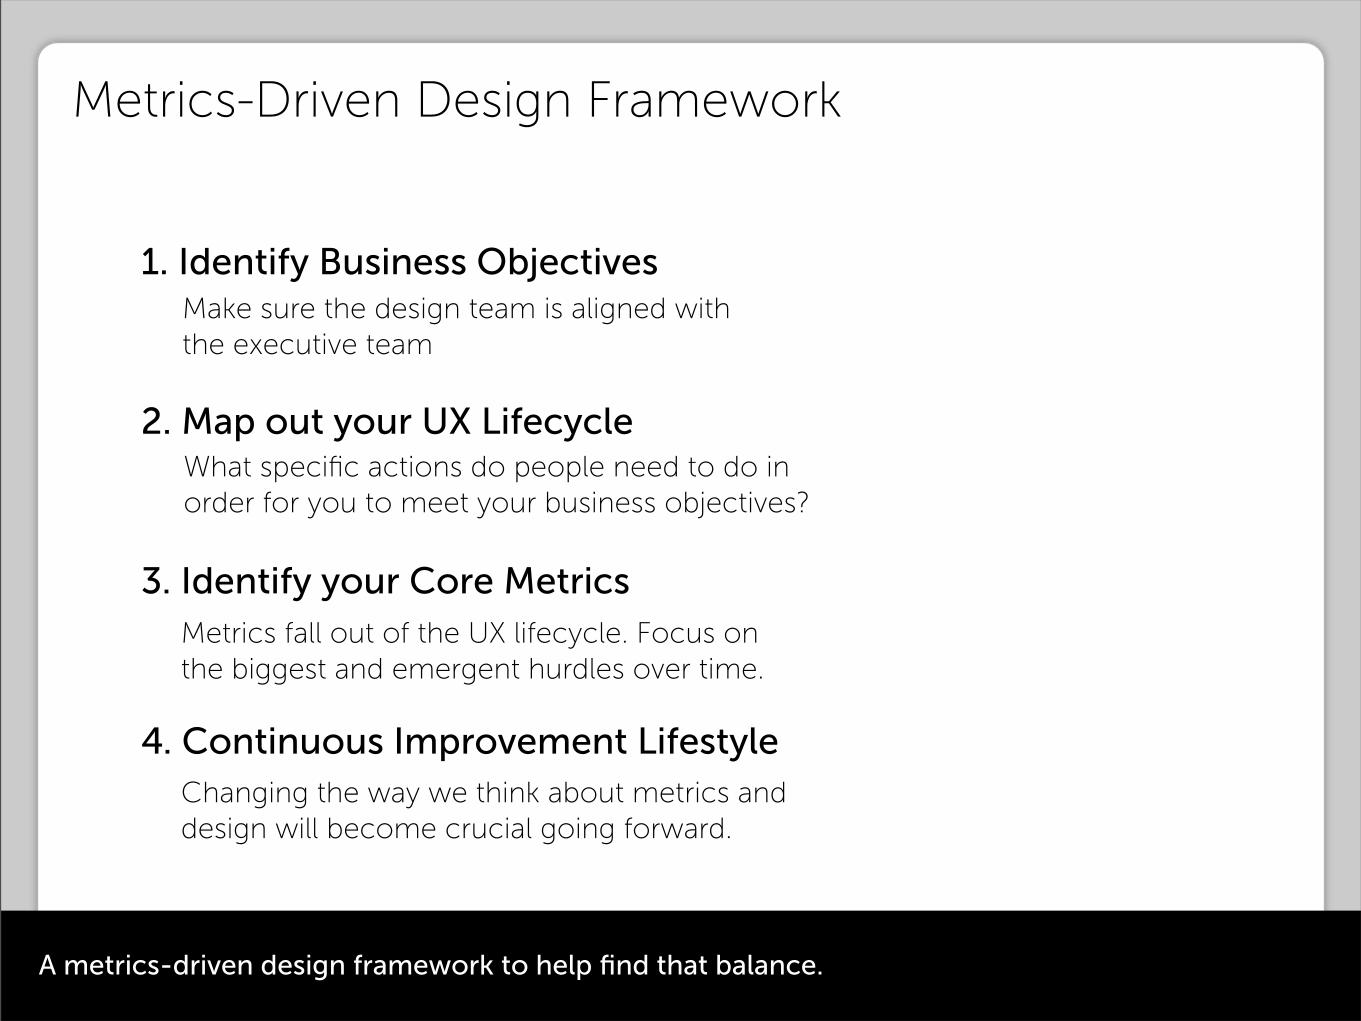
3. Identify your Core Metrics
2. Map out your UX Lifecycle
1. Identify Business Objectives
Metrics fall out of the UX lifecycle. Focus on the biggest and emergent hurdles over time.
What specific actions do people need to do in order for you to meet your business objectives?
Make sure the design team is aligned with the executive team
4. Continuous Improvement LifestyleChanging the way we think about metrics and design will become crucial going forward.
Metrics-Driven Design Framework
A metrics-driven design framework to help find that balance.
Identify Business ObjectivesMake sure the design team is aligned with the executive team1

Step 1: Identify Business Objectives/Goals
Answers the questions:
• What is our product/service for?
• Why does our web site exist?
• Do designers and executives agree?
• What activity do people need to do in order for our business to be
successful?

Existing Design:Typical Sign-up
Sign-up Use Customer
Suggested Change:Lazy Registration
Use Sign-up Customer
Client Disconnect on Business Goals
Client’s business objectives were not aligned with designer’s goal of positive user experience.

Map out the UX LifecycleWhat specific actions do people need to do in order for you to meet your business objectives?2

Metrics-Driven Design Microcopy
The UX Lifecycle
Interested Trial/beta User Customer PassionateCustomer
As people use your web application, they go through four major stages.

Metrics-Driven Design Microcopy
The UX Lifecycle
Interested Trial/beta User Customer
Sign-up EngagementFirst-time Use
PassionateCustomer
Between each stage is a hurdle, primary hurdles in the user experience.
Referral

Awareness First-time Use Referral
The UX Lifecycle
Sign-up Engagement
Attention Acquisition Retention Referral Revenue
Awareness Sign-inSign-up Create Landing Page
Example of fleshing out steps in lifecycle
Edit Page
Create test variation Publish page Set up Custom Domain
Drive Traffic Return to view Conversion data Wait for test result
Take action on test result Refer someone else Create 2nd page
Rinse & Repeat
Dave McClure’s Metrics for Pirates
Designing for the Social Web (my book)

Identify Core MetricsMetrics fall out of the UX lifecycle. Focus on the biggest and emergent hurdles over time.3

Most analytics packages display way too much non-actionable data.

Metrics-Driven Design Ego
Vanity Metrics
Vanity metrics: You can’t take action on them, but they make you feel good.

Metrics-Driven Design Pretty graphs do not actionable metrics make.
Actionable Metrics
1. A/B split testsRefute or confirm a specific hypothesis
2. Funnel metrics & cohort analysisMeasure lifecycle events over time
3. Customer satisfaction over timeGet a general sense of user experience
http://bthuener.posterous.com/vanity-metrics-vs-actionable-metrics-guest-po-2
Actionable metrics are those that give you enough information to make decisions from.

Metrics-Driven Design
Conversion Funnel Analysis
A
B
C
A
B
C
100%
60%
20%
Funnel analysis is great for optimizing flows through several screens (over major hurdles)
Metrics-Driven Design
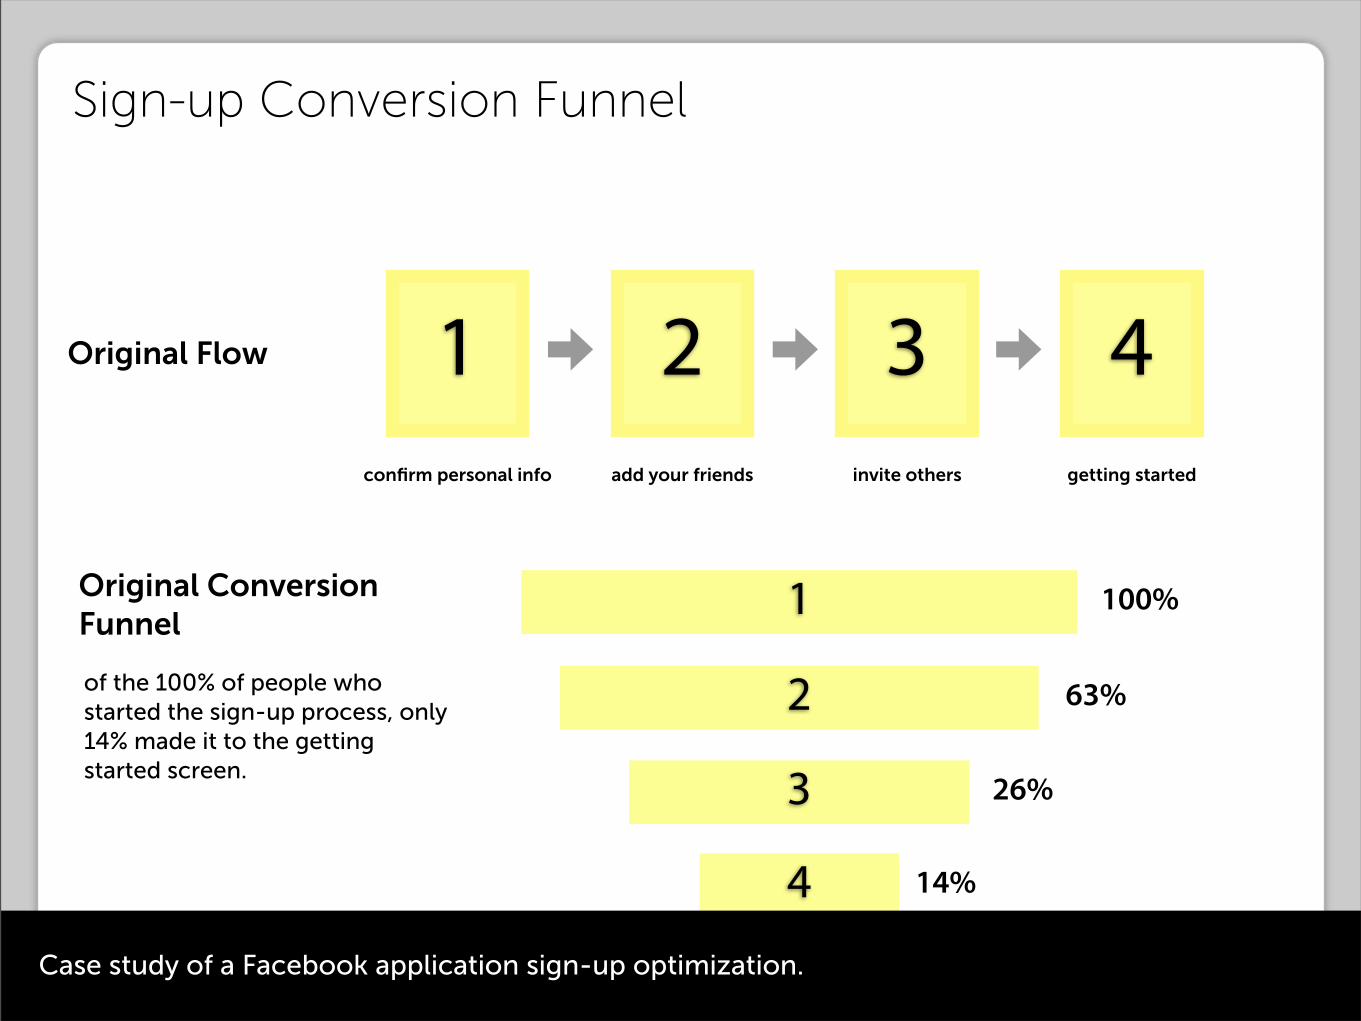
Sign-up Conversion Funnel
1confirm personal info add your friends invite others getting started
2 3 4Original Flow
1
2
3
4
100%
63%
26%
14%
Original Conversion Funnel
of the 100% of people who started the sign-up process, only 14% made it to the getting started screen.
Case study of a Facebook application sign-up optimization.

Metrics-Driven Design Removing stuff is a quick way to improve your funnel
Sign-up Conversion Funnel
add your friends
2getting started
4New Flow
New Conversion Funnelof the 100% of people who started the sign-up process, 86% made it to the getting started screen.
2
4
100%
86%
New design: two fewer screens and improved copywriting. Big improvement.

Stage UX Lifecycle Actions Conversion % Value
Acquisition Visits web site, browses blogs 100% $0.05
Activation Creates new blog and attaches custom domain 2.6% $2.00
Engagement Writes 1 blog post per week for 1 month 1.3% $30.00
Referral Refers 2 people/month to service 1.1% $5.00
Revenue Upgrades to paying plan 0.65% $60.00
You can use a funnel view for the entire UX lifecycle...and attach value at each step.

Month 1 Month 2 Month 3 Month 4 Month 5 Month 6 Month 7 Month 8 Month 9 Month 10 Month 11 Month 12
January 100% 20% 19% 13% 13% 10% 12% 11% 7% 7% 7% ?
February 100% 21% 16% 13% 11% 9% 9% 7% 7% 7% ?
March 100% 24% 20% 17% 15% 13% 11% 10% 10% ?
April 100% 31% 27% 24% 19% 15% 12% 12% ?
May 100% 31% 27% 25% 21% 18% 16% ?
June 100% 39% 28% 24% 20% 19% ?
July 100% 40% 33% 27% 23% ?
August 100% 47% 41% 32% ?
September 100% 52% 43% ?
October 100% 53% ?
November 100% ?
December?
http://redeye.firstround.com/2008/01/after-the-techc.html
Cohort Analysis
Cohort analysis: valuable for knowing how well your design is improving over time.

Metrics-Driven Design
Emergent Metrics: 5 Friends
The magic number is 5. Once a FriendFeed user found five friends, they became active users.
Bret Taylor, Friendfeed
Friendfeed introduced a novel stream element b/c emergent metrics showed friending was crucial.

Metrics-Driven Design Speed without context is wasted.
Engagement Matters: Twitter
http://www.lukew.com/ff/entry.asp?1039
Twitter changed to categories in their sign-up flow b/c metrics showed popularity wasn’t working.

Metrics-Driven Design LTV = Lifetime value
Acquisition vs. Referral: Dropbox
Ran Google Adwords campaigns to drive traffic to dropbox.com
The traffic that completed the lifecycle:
1) Searched on a keyword2) Visited their site3) Signed-up for service4) Became a customer
cost them $233-$388 per person!(for a $99 product)
Dropbox used Adwords to drive traffic early on. Cost per acquisition (CPA) was sky high.

Metrics-Driven Design Referral = Word of Mouth
Dropbox Lifecycle
Referral program with 2-sided incentive increased sign-ups by 60% permanently.
30 days prior to April 2010, Dropbox users sent 2.8 million direct referral invites.
So Dropbox changed to a referral model...with amazing results.

Metrics-Driven Design Do you know what your net promoter score is?
Referral: Net Promoter Score
How likely is it that you would recommend our company to a friend or colleague?
1 2 3 4 5 6 7 8 9 100
Net promoter score gives you a simple way of taking the temperature of your customers.

Metrics-Driven Design Do you know what your net promoter score is?
Net Promoter Score
How likely is it that you would recommend our company to a friend or colleague?
1 2 3 4 5 6 7 8 9 10
PromotersPassivesDetractors
0
Score = % Promoters - % Detractors
It is said that managers at Apple call back detractors within 24 hours.

Metrics-Driven Design
“Mint.com & Net Promoter Score
Maybe we didn’t have a high viral coefficient but we had a great net promoter score.
Jason Putorti, Lead Designer, Mint.com
Mint.com realized that they won’t have high metrics for all categories, but NPS was valuable.
Metrics-Driven Design I will miss you after my talk today.
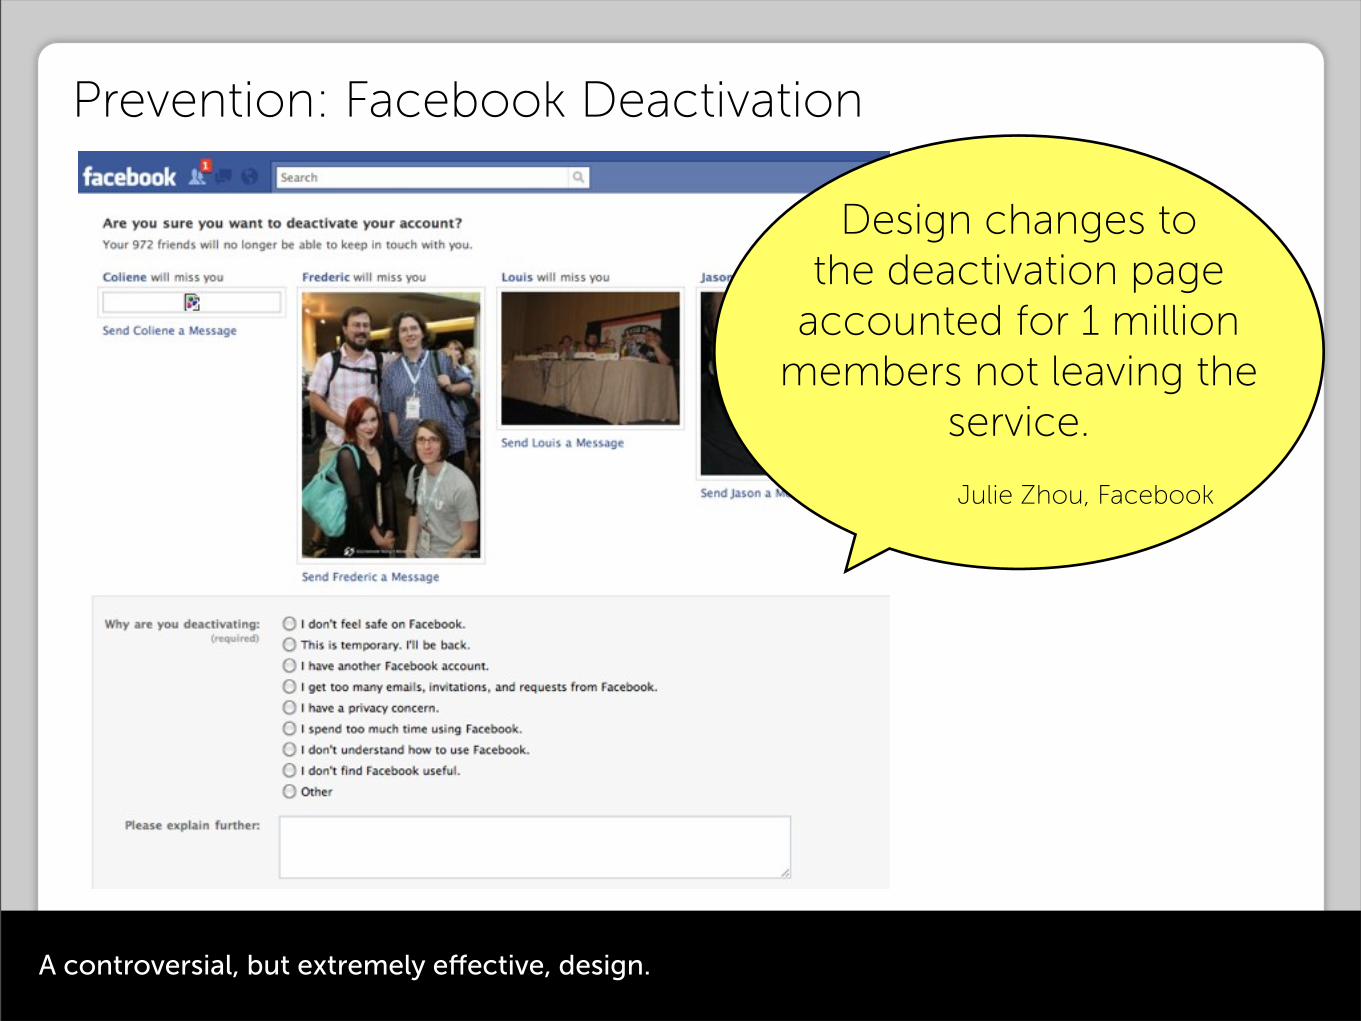
Prevention: Facebook Deactivation
Design changes to the deactivation page
accounted for 1 million members not leaving the
service.
Julie Zhou, Facebook
http://www.readwriteweb.com/archives/what_happens_when_you_deactivate_your_facebook_acc.php
A controversial, but extremely effective, design.

Metrics-Driven Design
“Once you’re lucky, twice you’re good.
Is there one metric that drives others?
At Blogger, we determined that our most critical metric was number of posts. An increase in posts meant that people were not just creating blogs, but updating them, and more posts would drive more readership, which would drive more users, which would drive more posts.
Ev Williamsfounder of Blogger (& Twitter)

Continuous Improvement LifestyleChanging the way we think about metrics and design will become crucial going forward.4

Metrics-Driven Design
Cycle of Work (applied Kaizen Cycle)
1. Release your design to create a baseline.
2. Measure the design focusing on actionable metrics
3. Gauge measurements against biz requirements
4. Design/redesign to meet requirements
5. Standardize the new, improved design (or revert!)
6. Continue cycle ad infinitum
Kaizen was popularized by the Toyota manufacturing method. It applies to metrics as well.

Metrics-Driven Design Reminder: Principal = Person & Principle = Thing
Principles of Metrics-Driven Design
1. No design survives contact with the user.
2. Small improvements, taken together, yield huge results.
3. Optimize in small steps; innovate with daring leaps.
4. Testing is empowering, reversion is cleansing.
5. Metrics are not creative: human beings are.
6. All team members are responsible for the user experience.
7. If metrics aren’t actionable, they aren’t useful.
8. Design is never done.
9. No data is important but your own.
A few high-level principles that help get us into the mindset of metrics-driven design.

Performable homepage with green button.

Performable homepage with red button.
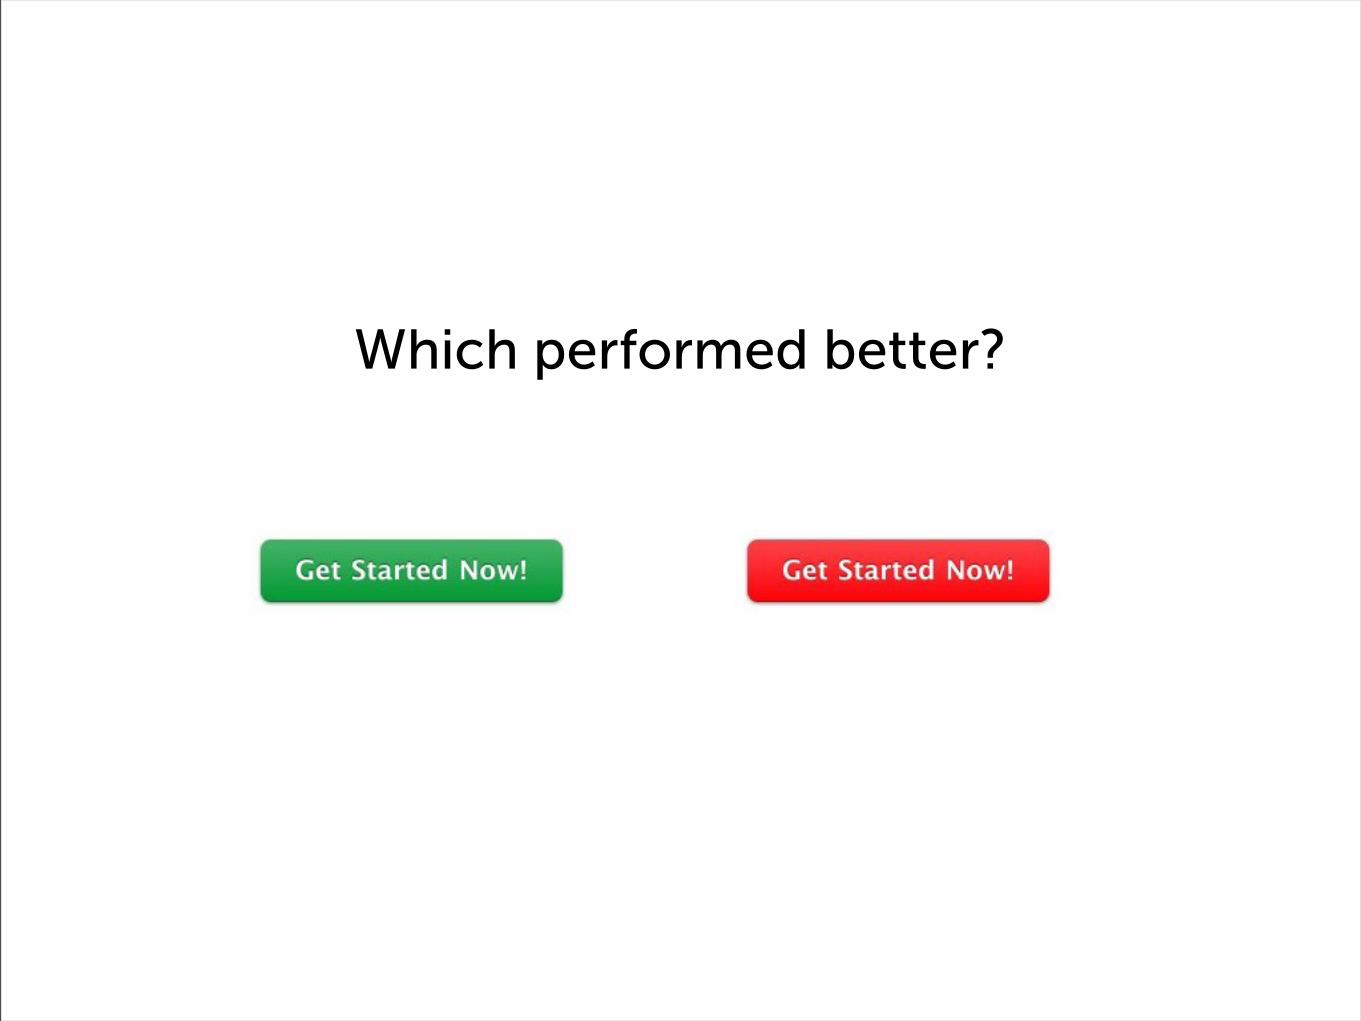
Which performed better?

Red outperformed green by 21%.
For more on statistical significance, see http://www.cennydd.co.uk/2009/statistical-significance-other-ab-test-pitfalls/Quite a difference: Red outperformed Green by 21%.

Metrics-Driven Design Recap
3. Identify your Core Metrics
2. Map out your UX Lifecycle
1. Identify Business Objectives
Metrics fall out of the UX lifecycle. Focus on the biggest and emergent hurdles over time.
What specific actions do people need to do in order for you to meet your business objectives?
Make sure the design team is aligned with the executive team
4. Continuous Improvement LifestyleChanging the way we think about metrics and design will become crucial going forward.
Metrics-Driven Design Framework

Metrics-Driven Design Thank You!
Looking Forward
1. New Mindset: Continuous Improvement
2. Change in Agency Relationship
3. Death of single-project based usability/UX
4. Huge migration to testing within design process
5. Still using intuitive design to innovate
6. Testing as empowering & fun, not cold & calculating
7. UX Designers judged on actual effectiveness of design
What’s next?

Metrics-Driven Design Thank You!
More Info
I’m currently product guy at Performable, where we’re building a testing platform to help people optimize web sites. Find out what copywriting, design elements, and layouts work best for your audience.
Performable Blog http://blog.performable.com
A blog filled with A/B test results, articles on testing, copywriting, marketing, and user experience.
http://www.abtests.com
A blog filled with A/B test results, articles on testing, copywriting, marketing, and user experience.
ABtests.com
http://www.performable.comPerformable

Metrics-Driven Design
Thank you!


