
DISCUSSION DRAFT
The views and interpretations in this document are those of the authors and should notbe attributed to the World Bank, to its affiliated organizations, or to any individualacting in their behalf.
AGP- 4
U~~~~~W JL ~~ L - ~VOL. 2
MEXICO: GOVERNMENT INTERVENTION ON AGRICULTURAL PRICES
(Volume II)
AGREP Division Working Paper No. 4
Prepared by:
Hilda Yumiseva (consultant).Economics & Policy DivisionAgriculture & Rural Development Department
March 1978
Pub
lic D
iscl
osur
e A
utho
rized
Pub
lic D
iscl
osur
e A
utho
rized
Pub
lic D
iscl
osur
e A
utho
rized
Pub
lic D
iscl
osur
e A
utho
rized
Pub
lic D
iscl
osur
e A
utho
rized
Pub
lic D
iscl
osur
e A
utho
rized
Pub
lic D
iscl
osur
e A
utho
rized
Pub
lic D
iscl
osur
e A
utho
rized


MEXICO
TABLE OF CONTENTS
Page No.
I. Price and Subsidy Policy 1
1. Product Prices 1
2. Input Prices 8
1I. Measurement of Incentive Coefficients 17
1. Corn 18
2. Wheat 21
3. Beans 25
4. Rice 29
5. Sorghum 32
6. Soybeans 34
7. Cotton 37
III. Conclusions 40
References 42
Annex I Commodity Tables
Annex II Methodology
Annex III


H.Y.2-13
I. Price and Subsidy Policy
1. Product Prices
From its beginning, in 1937, the agricultural price support program
in Mexico aimted at regulating the movement of prices to avoid wide fluctua-
tions--to protect the farmer--and to increase agricultural productivity.
Under this system, the government intervenes in the market marginally, allowing
a free market to coexist. It establishes a perfectly elastic potential demand
for the product at a minimum price. Farmers are likely to sell at this price
only if they cannot find buyers at higher prices.
One of the greatest difficulties encountered by the Mexican govern-
ment has been establishing adequate levels of support prices and, especially,
making them available to all farmers. Another problem has been that they have
not taken into account production costs, particularly during the first two
decades. An aim of the support policies has been that of regulating produc-
tion; however, support prices were only announced at the time of harvesting.
It was not until the early 1960s when the government started to announce sup-
port prices prior to planting.
Government intervention in the market for agricultural products
dates from 1937, when the "Comite Regulador del Trigo" was created. In 1941
it was replaced by the "Nacional Reguladora y Distribuidora" and in 1947 by
the "Compania Exportadora e Importadora"' (CEIMSA). This agency was in charge
of procurement, distribution, and trade of wheat, corn and beans. That year,
the "Direccion General de Precios" was created to set ceiling retail prices;
however, its actions were overshadowed by CEIMSA's activities.
The period from 1937-1952 was characterized by a lack of experience.
Prices were set too low to provide incentives to farmers and CEIMSA became an
instrument to help ease inflationary pressures caused by the loss of purchas-

- 2 -
ing power of the peso. Producers were obliged to sell to CEIMSA, and credit was
was denied to those who did not comply. Between 1939 and 1949, prices re-
ceived by farmers declined by 12% for corn, by 18% for rice, and by 25% for
beans. With domestic prices falling substantially below international prices,
agricultural exports increased in spite of increasing export taxes.
While agricultural prices were virtually fixed, industrial prices
were free to fluctuate. Industry benefitted from low-priced agricultural in-
puts, and there was, thus, a transfer of income from agriculture to industry.
Rather than stimulating agricultural productivity and growth, price supports
did the opposite.
During 1953 to 1958, controls were relaxed, particularly after the
devaluation of the peso in 1954. The Government allowed free trade on grains,
but during the bumper crop year of 1954, it had to step in to prevent prices
from falling below support levels. In 1955 CEIMSA's purchasing activities
were handed over to the Banco Ejidal and Banco Agricola. Conflicts of objec-
tives and rivalry between CEIMSA and the banks developed; each paying higher
prices (by hiring intermediaries who also found this a lucrative activity) to
attract sellers. Total purchases in this period amounted to about 25% of
total demand. These years were characterized by low productivity and a grad-
ual increase of domestic prices to the level of foreign prices. Though they
often exceeded these,domestic prices still remained below cost. Support
prices increased by an average of 7% per year (Table 1) whereas input prices
grew by an average of 18%.
Especially in the case of corn, the low support price was further
subsidized by CEIMSA to grain millers in the Federal District. In 1958 corn
was sold there at Mex$520 (the support price was Mex$800) and at Mex$850
elsewhere. Marketing costs were estimated at Mex$230 per ton, which implied
a subsidy of at least Mex$180 per ton.

-3-
Table 1. PRICES OF CORN, WHEAT, AND BEANS GUARANTEED BYCEIHSA AND CONASUPO, 1953-1972
(pesos per ton)
Year Corn Wheat BeansPrice Region Price Region Price Region
1953 500 Entire country 830 Entire country 1,250 Entire country1954 550 Entire country 913 Entire country 1,500 Entire country1955 550 Entire country 913 Entire country 1,500 Entire country1956 562 Entire country 913 Entire country 1,500 Entire country1957 680 Entire country 913 Entire country 1,500 Entire country1958 800 Entire country 913 Entire country 1,500 Entire country1959 800 Entire country 913 Entire country 1,500 Entire country1960 800 Entire country 913 Entire country 1,500 Entire country1961 800 Entire country 913 Entire country 1,750 Entire country1962 800 Entire country 913 Entire country 1,750 Entire country1963 940 Entire country 913 Entire country 1,750 Entire country1964 940 Entire country 913 Entire country 1,750 Entire country1965 940 Entire country 840 Entire country 1,750 Entire country
1966-1971 940 Non-irrigated 800 Terr.B.C., Sina- 1,750 Entire country800 Irrigated loa, Sonora
913 Rest of country1972 940 Not-Irrigated 800 Terr.B.C., Sina- 1,750 Entire country
840 Irrigated loa, Sonora913 Rest of tountry
Source: CONASUPO
The government subsidy program represented a heavy burden on its
budget. In 1954 this subsidy amounted to Mex$223 million, in 1956 to Mex$326
million, and in 1958 to Mex$360 million.
The agricultural price policy, until 1961, favored mainly urban
consumers. With the creation of the Compania de Subsistencias Populareas
(CONASUPO) in 1961, the Government support program acquired a social orienta-
tion, which also aimed at improving the standard of living of producers.
Guaranteed prices were to be reviewed periodically and were to reflect increases
in production costs. Prices of vegetable oils (sesame, soybean and safflower)
were also supported in the early 1960s. In this period, the price program for
wheat, combined with an aggressive development policy which tended to lower
domestic costs, moved the country from the position of a net importer to that

-4-
of net exporter. Production of corn also increased substantially but not
because there was a sound policy of production expansion. It must be em-
phasized that Mexico became a net exporter of both grains with heavy subsi-
dization by the government. In 1963 Mexico's net imports of corn were
450,000 tons. In 1964 net exports of 250,000 tons were made at a loss of
about 20% of the domestic support price. That year, about 500,000 tons
of wheat were also subsidized exports. Most of the wheat purchased was from
larger farmers of the irrigated Northwest and was sold to processing plants
under CONASUPO's control at a loss. Small farmers benefitted little from
the program. At the same time that Mexico experienced bumper crops, the sup-
port price for non-irrigated corn rose from Mex$800 to Mex$940 per ton and
this resulted in enormous agency losses, insolvency, and in November 1964 the
entrance of CONASUPO into receivership and reorganization.
A 1965 decree formed an expanded version of CONASUPO and redefined
its objectives and structure. The primary target groups were about 94% of
the farm units having annual sales of less than Mex$12,000 (accounting for 33%
of agricultural output) and 57Z of the population with annual incomes of less
than Mex$12,000. The price support program did not have a rigid structure.
CONASUPO did not have the obligation to sustain prices every year in every
region of the country. Decisions on intervention policy were taken at the
beginning of each crop year. Intervention depended on the circumstances.
For instance, CONASUPO was very active in the markets for corn and wheat,
but less active in the market for vegetable oil. In other cases, as with
non-irrigated rice, it acted only as coordinator of prices between producers
and processors.
The lack of sufficient storage facilities has been one of the major
problems of the price support system, often forcing small farmers to resort
to middlemen who paid lower than support prices. It is only in 1967 when the

expansion of CONASUPO's storage facilities, Almacenes Nacionales de Deposito
(ANDSA), took priority. CONASUPO expanded its receiving points to rainfed
areas (in ejidos as well as railway stations) bringing the total storage
capacity to 3.7 million tons. By the end of 1968, this figure rose to 5.7
million tons. Storage facilities have been growing rapidly thereafter.
The wheat program was reorganized in 1966. Due to export losses,
the support price was lowered from Mex$913 to Mex$800 for irrigated wheat
in the Northwest. The higher price remained for the rest of the country.
Thus, in the case of wheat and corn, there was a two-price system. Losses
in the wheat market amounted to Mex$97 million in 1967 and were reduced
to Mex$75 million in 1968.
CONASUPO has had problems disposing of bean surpluses. Sales in
the domestic market have been difficult due to the poor quality of most
varieties grown, and exports even more difficult. In 1966/67, CONASUPO de-
cided to limit its price support to varieties more acceptable to the consumer.
It also decided to limit purchases to rainfed areas, where the production of
beans is important and no substitute crop could be easily found. Losses,
however, continued: the total loss in 1967 was Mex$47 million and about
Mex$38 million in 1968.
Price supports for rice were effective in certain years only. CONA-
SUPO discontinued minimum price supports in 1963. The market operated smoothly
since then, with the exception of 1967 when a large crop harvested forced
CONASUPO to purchase the surplus.
Minimum prices for sorghum were maintained in the decade of the
1960s at Mex$625. A stabilization program for oilseed such as cottonseed,
sesame, safflower and soya was established in 1966. It covers producers, con-
sumers and processors. Minimum prices apply to raw products and ceiling prices
to consumer products (oil and feed cake). The price objectives in oilseeds
have been attained with relatively small purchases by CONASUPO.
- 6-
The price policy of the Mexican government tended to discourage
the production of the main export crop, cotton, during the 1960s in an ef-
fort to stimulate the production of grains, mainly sorghum. Until the mid-
dlesl960s cotton exports had an ad valorem tax of 22% per kilogram. It was
then reduced to 9.5Z. Exports declined by 13% in 1963 and by 372 in 1967.
The area under cultivation diminished though yields showed a steady upward
tread. It was not until the 1970s when the government undertook a revision
of the support system which had artifically discouraged production.
The second half of the 1960s registered a slow-down in agricultural
production due to adverse weather, and the increasing demand pressures of a
rapidly growing population made imports of staples more and more necessarybetween Supply and Demand
to close the gap(. In 1969 Mexico was obliged to import large quantities of
corn. Wheat exports declined in 1970 and in 1971 Mexico became again a net
importer of this cereal. It was only in 1973 that CONASUPO changed the thrust
of its support prices in order to provide better incentives to local farmers.
But this change in policy partly reflected CONASUPO's need to reduce the
heavy financial burden of growing import subsidies in the face of rising
commodity prices in world markets. Most of CONASUPO's export losses were
attributed to corn; in 1969-72, they averaged Mex$350 per ton. To meet this
deficit CONASUPO receives Mex$l billion per year, half of which-is made
available from the Bank of Mexico, though the Treasury also assumes the resulting
resulting debt of CONASUPO (at the end of the year) to the Bank of Mexico.
Thc new price policy aimed at discouraging production, above domestic
needs, of basic crops. Despite this reorientation, some controlled prices
remained below international levels.

- 7 -
During 1974 agricultural crops were affected by a severe frost, but
1975 was a good agricultural year, thanks to the combination of favorable
weather and the positive respnnse of farmers to higher support prices for
certain products. Production of sorghum, beans, corn, rice, safflower, barley,
and soybeansv-subject to the price support policies--increased significantly
during 1975. However, despite the growth in the output of these products,
GDP generated in the agricultural sector did not increase relatively because
of a sharp drop in both volume and value of cotton production. As the inter-
national price of cotton fell, farmers shifted to other crops which benefitted
from the domestic price support policy.
In 1974-1975, CONA-
SUPO made record imports to compensate for the poor 1974 crop and to prevent
an even sharper rise in domestic prices of basic foods. In 1976, by contrast,
imports were limited to, at most, one million tons of corn. There were even
some small exportable surpluses of beans, rice, and safflower oil. In re-
sponse to this, CONASUPO lowered its support prices for beans, rice and saf-
flower, and raised those for corn and other crops. As a result of these price
adjustments, corn production is expected to be stimulated further.
The apparent slowdown of inflation after 1975 may be partly attributed
to the activities of CONASUPO and the Price Control Law which sets maximum
prices for goods of social utility and public interest (foods, medicines and
petroleum products). Other items could be increased only when justified by
a cost increase of more than 5 percent and then the average increase may not
exceed the rise in costs.

Draft2/10/78
-8-
2. Input Prices
Fertilizer
Mexico has a well developed fertilizer industry based on
extensive resources of natural gas and sulphur. In 1974, production and
consumption of fertilizer were roughly balanced but practically all the
phosphate rock (96%), and over one-third of the ammonia required had to be
imported. By 1980, however, Mexico is expected to become self-sufficient
iu fertilizers with the discovery and drilling in recent years, of phosphate
rock deposits in Baja California and the increased production of ammonia
by Petroleos Mexicanos, PEMEX, the government-owned oil company.
Between 1940-53 increases in land area harvested and mechanization
accounted for almost one-half and 40%, respectively, of the increase in crop
production. After 1953, over three-fourths of the change in crop production
was attributable to changes in crop yields due to increased applications
of chemical fertilizer. Fertilizer consumption grew at an average rate of
10% annually during 1963-73, reaching in 1973 a total of 750,000 nutrient
tons Table , of which 70% was nitrogen (N), 25% phosphate (P205) and
5% potassium (K20). Consumption is expected to grow at 8.6% annually
through 1985.
Table . Mexico: Fertilizer Consumption(000 tons)
Year N. P205 K20 Total
1960 128.6 34.2 6.7 169.51961 128.9 44.9 9.1 182.91962 147.0 45.2 13.4 205.61963 197.1 68.5 13.7 279.31964 240.6 69.1 16.5 326.21965 250.6 75.6 21.6 347.81966 279.6 87.1 20.0 386.71967 309.4 102.9 17.1 429.41968 353.2 120.2 21.4 494.81969 398.0 125.3 19.6 542.91970 405.0 117.8 22.3 545.11971 434.5 148.3 22.8 605.61972 485.1 148.2 31.4 664.7

-9-
Year N P205 K20 Total
1973 559.7 158.6 33.1 751.4
Ave. Annual Rates of Growth
1963/73 11.0% 8.8% 9.2% 10.4%1968/73 9.7% 5.7% 9.1% 8.7%
Source: Industrial Projects Department
Approximately 22% of cultivated land in Mexico is irrigated. Yields
for wheat, sorghum and cotton are considerably higher than the world average,
although that for corn is lower than in all other major producing countries.
Averages of fertilizer usage in Mexico mark a wide variety of agricultural
practices, ranging from modern farming in the irrigated Northwest, where
fertilizer dosagesapproach optimum economic rates, to no fertilizer in
rainfed areas. The present average rate of fertilizer application (29
nutrient kg/ha)-- although nearly twice for all developing countries combined-
is below the world's average of 50 kg/ha.
Production and distribution of fertilizer in Mexico is mainly carried
out by three enterprises, PEMEX and Guanos y Fertilizantes Mexicanos
(GUANOMEX), which are government-owned, and Fosfatados Mexicanos S.A.
(FFM), though majority-owned by the Bank of Mexico, it is largely considered
a private enterprise. PEMEX produces all the ammonia made locally and
GUANOMEX all other nitrogenous fertilizers, with the exception of (by-
product) ammonium sulphate. Phosphate fertilizers are produced by GUANOMEX
and FFM (one of the largest phosphoric acid exporters in the world).
GUANOMEX was established in 1943 to industrialize the guano deposited by
marine birds on the offshore Pacific Islands. In 1948 a government decree
broadened the scope of GUANOMEX's activities into the filed of production and
distribution of chemical fertilizers. In 1949 the company expanded to produce
single superphospahte and bone meal. In 1950, GUANOMEX dominated the market

- 10 -
producing 81 percent of the national output of superphosphates, 45 percent.
of the formulas and 27 percent of the bone meal. That year GUANOMEX
built the first plant for the manufacture of amonium sulphate in Latin
America. The green revolution brought about as spectacular increase in the
use of fertilizers in Mexico. In 1950, the national consumption of
nitrogen, phosphorous and potassium was in the order of 12,000 tons; ten years
later it had grown fourteen times, to 170,000 tons, GUANOMEX was not able to
meet the demand. By 1964, it supplied only 17 percent of the production
of nitrate fertilizers and 75 percent phosphates. Thus, a large part of the
demand was met through imports. In 1965, a major step toward eliminating
fertilizer shortages was taken with the initiation of the nationalization
of the industry. By 1969, most of the largest producers of fertilizers had
been acquired by GUANOMEX, and over 90 percent of the nitrogen and
phosphorous nutrients were of national origin.
The government controls the price of fertilizer and that of the
company's raw material ammonia, through a pricing policy which is directed
towards avoiding great fluctuations in prices and which largely determines
the company's profit ability. The other major input, phosphate rock
has been dependent on international prices. Prices are controlled by the
government both at the factory gate and at the farm level. The current
fertilizer pricing consists of an official price at warehouses on rail
arywbere in Mexico. The costs of trucking to any other warehouses in the
area are added on and this becomes the price paid by the farmers. Since
1965, efforts have been made to equalize freight costs, but only in 1973
were fertilizer prices made uniform for most destinations. The first
fertilizers prices to be equalized in the late 1960's were ammonium nitrate,
urea and ammonium phosphate. In 1974, GUANOMEX still incurred losses in

the production of ammonium sulphate and;.simple superphosphate. Although
domestic fertilizer prices have increased in the 1970's, they still remain
substantially below those prevailing in the international market
(table ). In 1974, export prices for urea ranged between M$3940/4375
Table . Mexico: Fertilizer Prices Paid by Farmers(pesos per ton)
Year Ammonia Urea
1965 1225 14611970 965 14201971 992 13501972 892 13501973 1273 13501974 1644 1485
per ton f.o.b. Northern Europe and between M $4475/4625 per ton f.o.b.
U.S. Gulf Ports.. GUANOMEX has been able to sell at lower prices because of
the relatively low transfer price (M$525 per ton) for the ammonia it receives
from PEMEX. Two crops, wheat and rice, have even compared with other
countries. It takes less kilos of both crops to purchase a kilo of
nutrient in Mexico than in the United States, India and Italy (Table ).
Table . Various Countries: Kilos of Crops Neededto Purchase 1 kilo of Nutrient, 1974-75
Wheat Rice
N P205 N P2 05
Mexico 2.61 2.98 1.79 2.03U. S. A. 5.21 4.36 3.38 2.83India 4.32 5.33 2.86 3.53Italy 2.43 2.61 2.03 2.18Japan 1.33 1.97 0.64 0.95
SOURCE: IBRD, Industrial Projects Department.
From these two tables, it can be seen that a very good incentive exists for
farmers to utilize fertilizer in Mexico, and is undoubtedly one reason for
the rapid increase in fertilizer use by large farmers.

- 12 -
To compensate GUANOMEX for the high costs of imported ammonia, as well as
of other imported raw materials not reflected in the final price, the government
has established a compensatory fund of M$500 million. It was expected that in
1978 GUANOMEX would not receive this compensation since it expected to become
self-sufficient in the production of ammonia and fertilizer prices were
projected to be in line with international prices.
Tractors
A large part of the long-term credit made available to farmers by the
federal government, as well as private lenders, has been spent on agricultural
machinery since 1940. By 1950 Mexico's agricultural sector had become the most
extensively mechanized in Latin America. The overvaluation of the peso, until
1948 (when it devalued 40Z), apparently made agricultural machinery imports
a relatively inexpensive alternative to national production.
During 1940-50 the high rate of mechanization on large private farms
was accompanied by a rapidly growing number of hired laborers, but during the
following decade machinery largely replaced agricultural laborers. Between
1940 and 1960, the ratios of machinery to labor increased 7 times on large
farms, 3.5 times in ejidos and 80 percent in small private farms. Between
1962 and 1965 the number of tractors in irrigation districts increased by 40%.
Currently, the demand is about 8,800 tractors per year, of which about 7,000
supplied domestically.
The first plant to assemble tractors in Mexico was set up in 1950.
It is not until 1965 when the government authorized the fabrication of tractors.
In 1966 two companies, John Deere and International Harvester, were operating
in Mexico. In 1967 two additional companies joined, Massey Ferguson and
Ford Motor Co. Until 1971, all four companies manufactured tractors of 35-85 HP.

- 13 -
imports were permitted only of higher-power units. In 1971 tractors of 123 HP
were produced and in 1974 of 160 HP, imports were permitted of units of at least
135 HP and 165 HP, respectively, in these years. Production increased from
467 units in 1966 to 7,000 in 1974 (table ), whereas imports show a de-
clining trend from 6300 in 1966 to 1500 in 1974. Most of the imports of new
tractors, as well as all used units, come from the United States.
Table Mexico: Tractors - Production, Imports and Prices
Price fora 60-HP
Year Production Imports TractorNew Used (pesos)
1966 467 ...1967 2798 ...
1968 5367 2569 3601969 5059 2515 338 ...1970 3965 1891 307 90,7001971 5076 1580 241 91,4251972 6677 1426 305 93,6021973 1/ 6646 896 250 94,9631974 - 7402 470 130 98,047
SOURCE: F. T. Noyola, FIRA, Caracteristicasde la Oferta y la Demandade Tractores Agricolas y Mtquinas Combinadas in Mexico, 1975.Prices derived using the 1970 price as base year from FIRA,Relacid'n Entre Precios de los Insumos y de los ProductosAgropecuarios, 1970-77.1/ estimate
Production of tractors is subject to strict regulation by the
Secretaria de Industria y Comercio. At least 60 percent of the total costs
of production must originate in the domestic market. Prices must not be
greater than 25% above those in the country of origin. The manufacturer must
guarantee parts for at least 10 years for discontinued models. There are no
restrictions on the -imports of caterpillars and combines. Exports started
in 1973 by Massey Ferguson.

- 14 -
Seeds
With the production of high-yielding wheat and corn seeds in the
late 1940's, the National Corn Commission and the Commission for the Increase
and Distribution of Improved Seeds (wheat seeds) came into being to control
the propagation and distribution of improved seeds. The latter was abolished
shortly thereafter and the task was given to the official banks--Banco Nacional
de Credito Ejidal and Banco Nacional de Credito Agricola. During the early
1950s, the Institute of Agricultural Research (IIA) was also engaged in the
multiplication of seeds. This system proved ineffective because of the rivalry
which developed among IIA and the National Corn Commission. The services pro-
vided by the two producing agencies continued to be unsatisfa tory and federal
subsidies poured into both programs with little effect on production. Between
1941 and 1961, the output of the Corn Commission could have supplied only
about 2 percent of the corn land in Mexico; and the production of IIA much less.
In 1961 both agencies were fused to form the National Institute of
Agricultural Research (INIA), and responsibility was vested in a new organiza-
tion, the National Seed Production Agency (PRONASE), dependent of the Secretaria
de Agricultura y Ganaderia. This agency was to receive the genetic material
from INIA, multiply it through contracts with farmers or in its own fields, and
to distribute the certified seeds through the official banks, private retailers,
and its own regional offices. PRONASE, thus, legally came to have a monopoly
over the production and distribution of seeds; it was hoped that this would
eliminate rivalry and would ensure more effective use of offical subsidies.
Despite this reorganization, little of substance seems to have taken place
during 1961-69. Powerful groups of farmers from the Northwest continued to
purchase directly from INIA and their seeds were usually of better quality than
those from PRONASE. During this period, PRONASE produced an average of 6,500
tons of certified corn seeds, 760 tons of certified bean seeds, and 21,000 of

wheat seeds.(cotton, potatoes, rice, and sorghum seeds were also produced
in small quantities). About 200 minlion pesos a year were spetn on imports
of oilseed, grain, forage and vegetable seeds. It is only in the 1970s when
more emphasis was placed on the latter.
In 1971, with a new reorganization, the above quantities were in-
creased to 10,650, 2,200 and 27,500, respectively, in one year. If, as
estimated for 1968, a total of 20Z of all corn land, 40% of
that for beans, and 90% of wheat land was in fact planted with high-
yielding seeds, the difference in production was covered by private farmers'
organizations and companies. Between 1965 and 1972, PRONASE's exports of
high-yielding wheat seeds accounted for only 8Z of total exports of
wheat seed. The remaining 92% has been exported by large farmer organizations.
Imports and exports of seeds are permitted only by approval of
the Direccion General de Agricultura. Mexico is a net exporter of wheat seeds
(Table _) and a net importer of sorghum, soybeans and rice seeds.
Table . MEXICO: NET EXPORTS OF SEEDS
(tons)
Year Corn Wheat Beans Sorghum Rice Soybeans
1969 -1,918 6,070 .,. -4,850 -230 -17,000
1970 -374 12,630 -24 -14,570 - -16,800
1971 1,577 77,800 -85 -8,970 -804 -12,800
1972 194 17,760 2,458 -11,400 -1,642 -9,100
1973 -285 7,582 885 .- 13,800 -1,220 -28,700
1974 2,415 18,160 -290 -18,480 ... -10,100
Source: Direccion General de Agricultura.
Presently, the marketing channels of PRONASE's seeds are mainly the
agricultural credit banks (70 percent), Banco Nacional de Credito Ejidal and

- 16 -
Banco Nacional de Credito Agrficla, who are also in charge of supervising
the use of these seeds by small farmers and ejidatarios.
Water
Gravity water, from reservoirs or rivers, has been subsidized
by the Mexican government. The water control law of 1934 stipulates that
the reserves of dams in all irrigation districts were to be used first to
satisfy all the needs of the smallest farmers and ejidatarios of each area,
and only thereafter the requirements of large landowners. In fact, however,
this provision has been virtually ignored; and the system put into practice
provided .ach farmer, regardless of the size of his holding, with sufficient
water to plant a fixed proportion of his land. If this proportion was small
enough (as it usually was), then small farmers could not get full benefits
from the program.
To correct this situation, Directive Committees responsible to
the Ministry of Water Resources and Agriculture were formed in order to select
a crop program for a given season. Each farmer is then allotted only enough
water to fulfill his part at the precise time that the chosen crops require
irrigation. In this way, the Government exercises both control over water
supplies as well as production. The official policy has placed greater empha-
sis on wheat, corn, and cotton. Until the 1960s, these crops accounted for
roughly 85% of all cultivated land in irrigation districts, and thereafter
for over 50%. Charges for a thousand cubic meters of unsubsidized gravity
water are Mex$75 and for subsidized an average of Mex$10.50-

- 17 -
II. Measurement of Incentive Coefficients
Nominal Protection Coefficients (NPC) and Effective Protection
Coefficients (EPC) were calculated for 6 grains and cotton, following the
methodology developed by Bela Balassa. Producer Retention Coefficients were
also calculated. The period covered by this study is 1960-1975. The reason
for selecting 1960 as the beginning of the period is that the government's
price support policy changed significantly in the late 1950's and early 160's.
This was done to encourage the production of Mexico's major grain corps, corn
and wheat. The production of sorghum and soybeans also becomes significant
in 1960.
A description of the procedure followed for the calculation of these
coefficients is given in Annex 2, Appendix. The methodology used is similar
for all crops.
Since CONASUPO is the only importer of grains, the assumption was
made that no tariffs on grains existed. The NPC then becomes merely the ratio
of farm gate prices to border prices. The criterion for selecting the import
or the export price to be used as the border price was as follows: when
exports of a commodity accounted for at least 3% of its production, the
export price was used; when imports of the commodity accounted for at least
4% of the production, the import price was used (Table A, Annex 1). When
the commodity was both imported and exported, an average of both prices was
usually taken. For years where the criteria were not met, the price was
estimated.
Production cost data for irrigated, rainfed and tropical districts
are available only for 1968, and the assumption was made that costs remained
unchanged two years before and two years afterwards. This allowed the
calculation of EPCs for 5 years, 1966 - 70.

- 18 -
1. Corn
Historically, corn has been one of the major staples in Mexico.
Grown practically all over the country, under different production patterns,
corn production accounts for 5 percent of agricultural output. Land planted
with corn increased from 5.5 million ha in 1960 to 8.3 million ha in 1966,
but had decreased to 7.5 million ha in 1973 and to 6.7 million ha in 1975.
Yields show an upward trend, increasing 21X between 1960 and 1975 (Table 1,
Annex 1). Corn has benefited from research; hybrid seed varieties grow
on 10 of the corn areas.
Data on production costs for 1968 from the CHAC model developed
by the Bank were used for the calculation of the EPCs. Chemicals account for
34 percent and 47 percent of total costs excluding labor in irrigated and
temporal districts, respectively. Water represents 8 percent of input costs
in irrigated districts. Seeds account for 5 percent and machinery for 36
percent of total costs in both irrigated and temporal districts. Draft
animals (mules) account for 90 percent of total costs in tropical districts.
In areas, where production as carried on in a traditional manner,
-- intercropped with beans -- corn has to be highly subsidized, because adequate
alternative corps are not available. As a result of the high costs of subsidizing
corn, pressure had been increasing to confine subsidization to the areas where
no crop alternatives exist. Data on prices are shown in Table A, Annex 1.
a) Nominal Protection Coefficient
Except for 1963 and 1970, positive protection on corn, as measured
by the NPC, remained at a high level from 1960 to 1972 (Table 1). The NPC
is particularly large after 1963, when guaranteed prices for nonirrigated
corn were increased from Mex$800 to Mex$940 per ton raising the farm gate price
* Total costs in this text refer to secondary inputs.

- 19 -
Table 1. Mexico: Corn -- Incentive Coefficients
NominalProtection EFFECTIVE PROTECTION COEFFICIENT
Year Coefficient Irrigated Temporal Tropical Country
1960 1.21 - - - -
1961 1.18 - - - -
1962 1.23 - - - -
1963 1.07 - - - -
1964 1.34 - - - -
1965 1.34 - - - -
1966 1.34 2.34 2.82 1.35 1.77
1967 1.30 2.07 2.42 1.31 1.66
1968 1.44 2.95 4.00 1.45 2.04
1969 1.29 2.17 2.62 1.45 1.68
1970 0.99 1.09 1.11 0.99 1.04
1971 1.17 - - - -
1972 1.28 - - - -
1973 0.83 - - - -
1974 0.74 _
1975 1.02 -

- 20 -
by 24 percent. Low and negative levels of protection (1963, 1970, 1973-75)
reflects large imports. The years 1973-75, show negative protection because
of sharp increases in world prices.
b) Effective Protection Coefficients. An examination of the EPCs
indicates that the protection level of value added in corn production has been
consistently above the protection level of its price. The EPCs follow
closely the movement of the NPCs (figure 1), and are an average of 67 percent
above them in 1966-70 in irrigated districts, and even higher in rainfed districts.
No evidence of protection of value added was found in tropical districts.
2- -. EPC iet
epc (rrm
1.1 8 -_- EK(PCCTIPOAA
I . ,5~~~~~~~~~~~~~~~~~. il
, . -_, /-
.(-,' _,_,_---\. /- ' *~~\. 1 '
1.0 .
K _ -. /'
Corn: Nominal and Effective Protection CoefficientFigure 1

- 21 -
Value added represents a high proportion of product prices in all
districts: 54 percent in irrigated, 48 percent in rainfed and 99 percent in
tropical districts. As a percentage of world prices value added accounts for
26 on irrigated districts, on rainfed districts and 98 percent on tropical
districts. This indicates that inputs other than land labor are cheaper
at domestic prices than at world prices. These inputs are relatively more
expensive in rainfed districts than in irrigated ones, because yields are
lower. In spite of this the EPCs -in rainfed districts are consistently
higher than the EPCs in irrigated districts due to the more intensive use
of subsidized chemicals (47 percent in rainfed and 34 percent in irrigated
districts) which decrease the value added at world prices.
c) Producer Retention Coefficient. These coefficients were calculated
for irrigated and temporal districts taking into account non-traded inputs;
water and draft animals. In irrigated districts, water accounts for 8
percent of total costs at domestic prices but for 29% of costs at world prices.
This difference reflects a subsidy on this input of about 65 percent, which
makes value added at world prices negative in most years. (Table 2.)
Table 2. Mexico: Corn Producer Retention Coefficient
Year Irrigated Temporal
1966 - 7.2 34.5
1967 - 24.5 6.5
1968 - 4.4 - 10.1
1969 - 7.6 18.0
1970 2.2 1.1
2. Wheat
In terms of domestic consumption and of research efforts devoted to its
production, wheat has been one of the most important crops in Mexico. Domestic
consumption of wheat increased from 1.4 million tons in 1961 to 2.8 million
tons in 1973 (Table 2 Annex 1).

- 22 -
Traditionally, Mexico was a net importer of wheat. Only in 1956
did it achieve self-sufficiency for the first time. In the period 1963 - 70
Mexico exported relatively small amounts (mainly seeds) except for 1964,
1965 and 1969 when exports were respectively 21, 41, and 13 percent of
production. During 1971-76 Mexico reverted to imports once again.
The area harvested has shown a downward trend in the period
considered (Table 2a, Annex 1). Yields, however showed a steady upward
trend. In 1964, the average yield was 2,600kg/ha. The area cultivated
was 20.5 percent lower than in 1961 and total production was 14 percent
greater. The distribution of production by regions also changed,
shifting more and more to the irrigated Northwest. In the early 1960s,
the Northwest produced 54 percent of the crop on 36 percent of the
arable land. In the late 1960s, over 80 percent of the crop was produced
in the Northwest in 72 percent of the arable land.
Since 1959 the operation of the domestic wheat market rests on the
following norms: Industrialists buy all the crop of the interior, except
that of the Northwest, at the guaranteed price under quality control and at
locations designated by CONASUPO. CONASUPD buys all the crop from the Northwest
and distributes it accordlng to contracts previously established. The sale
price represents the net cost of purchase; the handling costs being absorbed
by CONASUPO via subsidies from the government. In case of deficient supply
CONASUPO has imported at higher than domestic prices. Export prices of wheat
have tended to be lower than guaranteed prices.
a) Nominal Protection Coefficients.
Because the implicit border prices presented many irregularities,
the U.S. No. 1 wheat (Gulf Ports) price series was used because the quality
difference with Mexican varieties is small. Protection on wheat was

- 23 -
moderately positive from 1960 to 1971. The early 1970s show negative levels
of protection reflecting a change in policy towards subsidized exports.
(Table 3.)
Table 3. Mexico: Wheat - Incentive Coefficients
Protection EFFECTIVE PROTECTION COEFFICIENTYear Coefficient Irrigated Temporal Tropical Country
1960 1.17 -
1961 1.22 - - -
1962 1.19 - - - -
1963 1.23 - - - -
1964 1.17 - - - -
1965 1.30 - - - -
1966 1.13 1.54 1.41 - 1.47
1967 1.10 1.46 1.32 - 1.39
1968 1.17 1.72 1.58 - 1.65
1969 1.21 1.89 1.76 - 1.83
1970 1.18 1.79 1.64 - 1.72
1971 1.02 - - - -
1972 0.91
1973 0.66
1974 0.56
1975 0.81
- 24 -
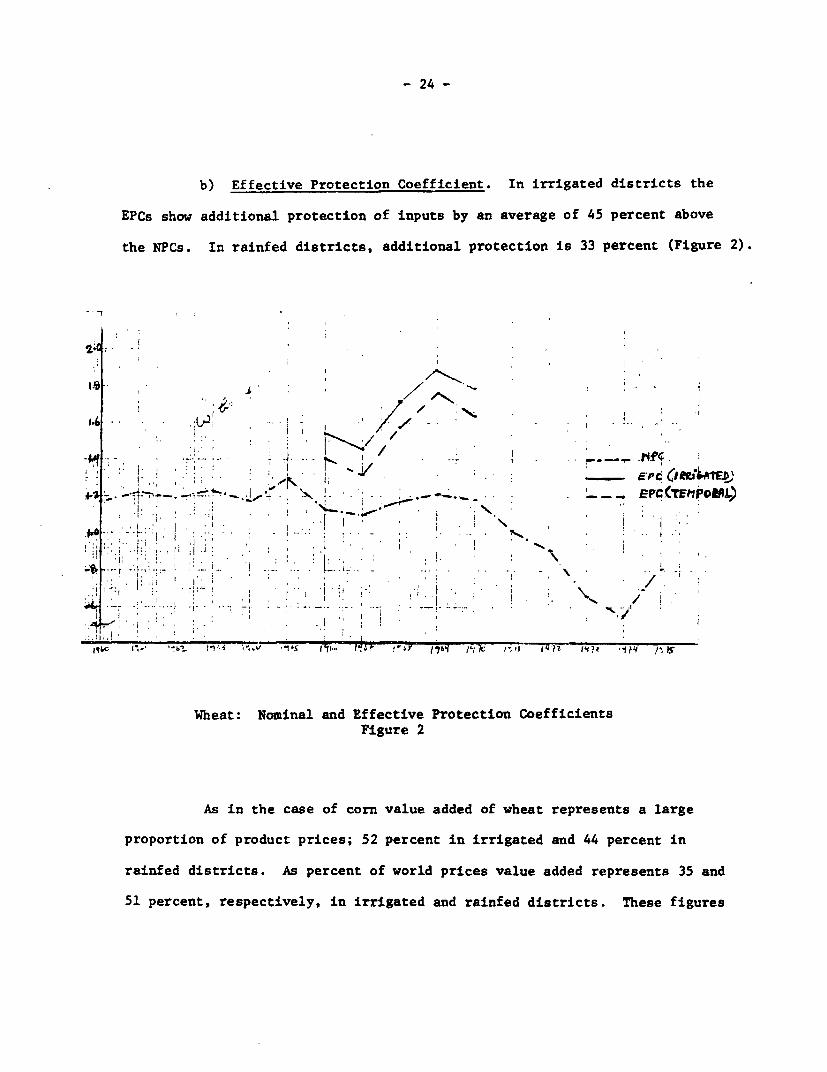
b) Effective Protection Coefficient. In irrigated districts the
EPCs shaw additional protection of inputs by an average of 45 percent above
the NPCs. In rainfed districts, additional protection is 33 percent (Figure 2).
*I 7 I te*.6 !. . , i
~~ Y *.* -........ ~~~~~~EPCCTE1IPOIAL)!0 .jb ,c 7r 1i I- . .i8.6 Wea: . v-- *Ks41-&. .t - \ - I
Wha:Nominal and Effective Protection CoefficientsFigure 2
As in the case of corn value added of wheat represents a large
proportion of product prices; 52 percent in irrigated and 44 percent in
rainfed districts. As percent of world prices value added represents 35 and
51 percent, respectively, in irrigated and rainfed districts. These figures

- 25 -
clearly show that inputs are cheaper at domestic than at world prices in
irrigated districts, whereas the opposite is true in rainfed districts.
The value added/price ratio in rainfed districts is below that for
irrigated districts. Two factors account for this: more intensive use of
machinery, and lower yields. The resulting EPCs in rainfed districts are
always below those in irrigated districts. This indicates that price policy
on inputs and products, has not changed the relative returns to land determined
by location and fertility of land.
c) Producer Retention Coefficient. Examination of retention
coefficients for irrigated and temporal districts (Table 4) shows further
subsidization of domestic inputs. As in. the case of corn, the large positive
-Table 4. Mexico: Wheat - Producer Retention Coefficients
Year Irrigated Temporal
1966 9.9 1.7
1967 14.2 0.2
1968 - 22.7 2.1
1969 - 8.1 2.7
1970 - 10.2 2.3
and negative coefficients for irrigated districts reflect primarily water
subsidies. Water accounts for 14 percent of the cost of inputs at domestic
prices and 40 percent at world prices.
3. Beans
Together with corn, beans have been one of the major staples of the
Mexican diet. Although grown practically all over the country, the highest
yields have been achieved in rainfed regions.
Historically, Mexico was a net exporter of beans until the early
1950's when production began to lag behind conaumption. (Tables 3, 3a, Annex 1).

- 26 -
This trend was reversed in the 1960's and continued through the present.
During 1966-69 10 percent of total annual production of beans was exported.
Insufficient foreign demand resulted in lower prices and a consequent
revision of domestic policy to reduce the area under cultivation.
CONASUPO has periodically over and under procured beans. In 1974
it imported 42,000 tons and in 1975 77,000 tons (Total World Trade is about
150,000 tons). The company appeared to have overeacted to an expected
production drop by symultaneously importing and drastically raising the
domestic support price. The greater than foreseen jump in production resulted
in growing inventories. At the beginning of 1976 CONASUPO had 484,627 tons
stored. Monthly consumption was.running at 10,000 tons, thus leaving a
carryover balance of 360,000 tons. Although some exports had been made,
this stock was tieing up both storage capacity and working capital.
a) Nominal Protection Coefficient. For the period 1960-68
negative levels of protection are shown by the NPCs (Table 5.) A relaxation
of price policy does, however, take place after 1964; a situation of free trade
seems to have prevailed. Positive levels of protection in 1969-71 reflect
lower international prices.
b) Effective Protection Coefficient. Protection of value added for
beans is minimal during 1966-68. The NPCs for 1969 and 1970, however, show
greater levels of protection in response to lows in international prices and
demand.
In 1968, value added as a fraction of domestic product prices was
52 and 56 percent respectively for irrigated and temporal districts. (Figure
3).

- 27 -
Table 5. Mexico: Beans. - Incentive Coefficients
NominalProtection EFFECTIVE PROTECTION COEFFICIENT
Year Coefficient Irrigated Temporal Tropical Country
1960 0.64
1961 0.74 - - -
1962 O.79 _
1963 0.81 - -
1964 0.82 - -
1965 0.86 - - - -
1966 0.94 0.95 0.95 0.88 0.94
1967 0.94 0.96 0.96 0.93 0.95
1968 0.98 1.06 1.05 0.98 1.02
1969 1.55 3.96 3.27 1.59 2.26
1970 1.93 9.47 2.01 3.72
1971 1.86 - - -
1972 0.64 - - _
1973 1.14 - - -
1974 0.59 - _ _
1975 0.62 - - _
It represented 49 and 53 percent respectively at world prices. Inputs were,
therefore, relatively cheaper in temporal than in irrigated districts, and
production was.mroe efficient in the former. There is no evidence of input
subsidization in tropical districts; value added as a fraction of produce
prices at domestic and world prices is 96 percent.

- 28 -
7 j _| ' I.T '--
I I.~ ~ ~~~ _ , '1*
* ' , I II
/ ,, [, , ,~~. i I. ./ i
# 1 ; '' 1 ~ ~~~~~I r/4/
J4" ' 'l. ,41. 1 . / ' - _- ,' (.I hi r-,
t2 ~ ~ eas Noina an Efetv Prtcto _C__fficients
I.. ,. '
sam. / dsei
wa ter Is/,ounts for 14 x pecet o the cos oft input#s atdoetic price andh 37
Beans: Nominal and Effective Protection CoefficientsFigure 3
c) Producer Retention Coefficient. These coefficients reveal the
same trend as wheat and corn in irrigated districts. (Table 6). Subsidized
water accounts for 14 percent of the cost of inputs at domestic prices and 37
percent at world prices.
Table 6. Mexico. Beans - Producer Retention Coefficients
Year Irrigated Temporal
1966 9.6 0.9
1967 24.4 0.9
1968 -11.2 1.0
1969 - 0.1 5.5
1970 - 0.8 -19.2

- 29 -
4. Rice
Rice grows mainly in irrigated and tropical areas. This crop is
very suceptible to weather. The area planted with rice shows an upward
trend in the period considered, but yields have been erratic (Table 4,
Annex 1). Chemicals, seeds, water and machinery use account for 39, 23,
16 and 18 percent of total input costs, respectively in irrigated districts.
whereas, in the tropics seeds account for 34% and draft animals most of the
remaining.
Guaranteed prices for rice on different areas were established
by CONASUPO (Table 4a , Annex 1.) Millers usuAlly buy the palay at
guaranteed prices and their excess purchases are bought by CONASUPO. In this
way, the millers are obliged to buy from any seller who offers the product
but favoring ejidatarios and small farmers.
a) Nominal Protection Coefficient. Guaranteed prices for rice have
been in effect during certain years only. They were discontinued during 1960
and 1962-65. Negative protection characterizes years when Mexico was a net
importer of rice (Table 6.)
b) Effective Protection Coefficient. An examination of the value
added as a proportion of price (Table 7) explains the slightly
different pattern of behavior of EPCs. In 1966 and 1967, input prices are
Table 7 Mexico: Rice - Value added as a fraction on price.
Year Irrigated TropicalWorld Price Domestic World Price Domestic
1966 0.72 0.65 0.96 0.95
1967 0.72 0.64 0.96 0.95
1968 0.31 0.66 0.91 0.95
1969 0.31 0.67 0.91 0.95
1970 0.71 0.67 0.96 0.96
cheaper at world prices than at domestic prices which implies negative protection for
inputs as shown by lower EPCs for with respect to NPCs. The opposite prevails

- 30 -
Table 6. Mexico: Rice - Incentive Coefficients
NominalProtection EFFECTIVE PROTECTION COEFFICIENT
Year Coefficient Irrigated Tropical Country
1960 0.61 - -
1961 1.17 - -
1962 1.27 - -
1963 0.70 -
1964 0.72 - -
1965 0.75 - -
1966 0.74 0.67 0.73 0.71
1967 0.73 0.65 0.72 0.69
1968 1.88 3.99 1.96 2.47
1969 1.94 4.21 2.03 2.59
1970 0.82 0.77 0.81 0.79
1971 1.72 - -
1972 1.57 - -
1973 0.44 - -
1974 0.53 - -
1975 0.68 - -

- 31 -
in 1968 and 1969; the EPCs are greater than the NPCs. Product prices
are assumed to be the same for all districts regardless of irrigation
technology. They are national prices derived from country statistics and
as such tend to bias the calculation of incentive coefficients. With input
costs constant, variations in value added reflect solely changes in border
prices. In the case of rice, border prices change from Mex$1510 (import) in
1966-67 to Mex$610 (export) in 1968-69, but this may not necessarily mean
that in 1968-69 value added is protected relative to 1966-67.
c) Producer Retention Coefficient. In general, these coefficients
are larger than EPCs in irrigated districts and relatively close to EPCs
in tropical districts (Table 8).
Table 8. Mexico: Rice -- Producer Retentions Coefficients
Year Irrigated Tropical
1966 1.0 0.7
1967 0.9 0.7
1968 -2.9 2.2
1969 -3.0 2.3
1970 1.2 0.8
5. Sorghum
Production of sorghum on a large scale started in 1957.
Two factors influenced this development: a faster growth of agriculture
and low international prices of cotton which prompted the substitution of cotton
by sorghum.
The area cultivated with sorghum increased from 98,000 ha in 1957 to
229,000 ha in 1974. Sorghum ranks third in crop area. Yields increased
from 790 hg/ha in 1960 to 2800 hg/ha in 1970 (Table 5, Annex 1) due mainly to the
development of hybrid varieties, better disease and weed control, and a more

- 32 -
Table 9. Mexico: Sorghum -- Incentive Coefficient
NominalProtection EFFECTIVE PROTECTION COEFFICIENT
Year Coefficient Irrigated Temporal Country
1960 0.98 - -
1961 0.78 - -
1962 0.78 - -
1963 0.85 - -
1964 0.80 - -
1965 0.83 - -
1966 1.02 1.19 1.18 1.18
1967 0.99 1.14 1.13 1.13
1968 1.00 1.80 1.69 1.74
1969 1.04 1.27 1.24 1.25
1970 0.96 1.05 1.05 1.05
1971 1.08 - - -
1972 0.93 - - -
1973 0.68 - - -
1974 0.71 - - -
1975 1.09 -

- 33 -
efficient use of fertilizers.
a) Nominal Protection Coefficient. Moderate levels of
taxation prevailed during the first half of the 1960's. From 1966 to
1971 the NPCs reflect the abolishing of these taxes (Table 9).
b) Effective Protection Coefficient. Protection to value added
on sorghum is systematically above the protection levels on the product
prices. EPCs were higher by an average of 59 percent in irrigated districts
and by 27 percent in rainfed districts (Figure 4).
2ic~ ~ ~ ~ ~ ~ ~ ~ ~ ~ ~ ~~~~~~~rp{s / \ _ ~~~~~~~~~~~~~~~~~~~~'Pc( i6
-I7 -- -7
14 1_ X~~~~4m,a
SI' ... -- 4;
Sorghum: Nominal and Effective Protection CoefficientsFigure 4
Value added accounts for 47 percent of domestic prices and 38 percent
of world prices in irrigated districts and for 51 percent of domestic
prices and 42 percent of world prices in temporal districts. In both
cases, inputs are more expensive at world prices.

- 34 -
c) Producer Retention Coefficient. For irrigated sorghum, these
coefficients are larger than the EPCs because of the importance of water as
an input component (10 percent of production costs at domestic prices and
34 percent at world prices). The inclusion of non-traded inputs i.e. mules
does not change the size of the coefficients (Table 10).
Table 10. Mexico: Sorghum. - Producer Retention Coefficient
Year Irrigated Temporal
1966 3.4 1.1
1967 3.3 1.1
1968 18.6 2.0
1969 4.1 1.2
1970 2.3 1.0
6. Soybeans
Production, trade and price data on soybeans can be found in Annex I
(Tables 6, and 6a). Production of soybeans for commercial purposes started
in 1958. Since that year, increments in the rate of growth of productivity
and in area have placed Mexico in the second place in Latin America and in
the sixth place worldwide. Soybeans consumption has not spread much in Mexico
because of established dietary patterns. Most of the soybeans production
is used for the manufacture of oils.
a) Nominal Protection Coefficient. In the period considered,
Mexico was a net importer of soybeans. Except for 1970 and 1971, fairly
large levels of taxation, 26 percent, are shown by the NPCs (Table 11).

- 35 -
Table 11 MEXICO - Soybeans - Incentive Coefficients
YEAR Nominal EFFECTIVE PROTECTION COEFFICIENTProtectionCoefficient Irrigated Tropical Country
1960 0.77
1961 0.61
1962 0.75
1963 0.75
1964 0.69
1965 0.69
1966 0.70 0.62 0.67 0.65
1967 0.72 0.66 1.00 0.68
1968 0.78 0.73 1.00 0.75
1969 0.77 0.72 0.97 0.73
1970 1.12 1.11 1.14 1.18
1971 0.93
1972 0.68
1973 0.87
1974 -
1975 -

- 36 -
b) Effective Protection Coefficient. Additional taxation to
soybeans production is shown by the EPCs. They are consistently lower
than the NPCs by a range of 1 to 12 percent in irrigated districts. Tropical
soybeans production show moderate levels of protection. As a percent of
price value added is 67 percent at domestic prices and 73 percent at world
prices in irrigated districts. Inputs are, thus, cheaper at world prices
(Figure 5). The opposite holds for tropical soybeans.
1.2
A3 ~ ~ ~ ~ ~ ~
Soybeans: NominalandffectivePr tection f fi c e n
to0 r-- ,'d** /;. - -- 17ZOPIQL)
.9 , / ;
/~, !/ ; ,
.9 'vE -,¢--.---,.,,Jj
Soybeans: Nominal and Effective Protection CoefficientsFigure 5
c) Producer Retention Coefficient. Although retention levels
are greater than nominal protection, they are still below 1, except for
1970 (Table 12). This indicates that the protectionist policy has subsidized
inefficient soybeans production.

- 37 -
Table 12. Mexico: Soybeans. - Producer Retention Coefficient
Year Irrigated Tropical
1966 0.8 0.6
1967 0.8 0.7
1968 1.0 0.7
1969 0.9 0.7
1970 2.5 1.2
7. Cotton
Cotton is the major agricultural export of Mexico. From 1960
to 1975, 75 percent of its production was exported. Most of the cotton is
produced in the Northwest. The area used for cotton production has declined
in the last 16 years, from 870,000 ha in 1961 to 235,000 ha in 1976 (Table 7,
Annex I). Several factors have influenced this trend: the increase in the
cost of production, the decrease in the prices of fiber 1/ in the 1960s and
the need to diversify grain production. However, at the same time that the
area and production declined, yields have increased rapidly. With improved
methods of production, Mexico has become one of the leading producers of
cotton fiber.
In the period under study, price policy on cotton tended to discourage
production for export in an effort to promote the production of grains, mainly
sorghum and wheat. Cotton exports had an ad-valorem tax of 22 percent per
kilogram until 1963 when it was reduced to 9.5 percent. An ad-valorem tax
of 9 to 15 percent was applied to cotton exports from the northern states.
1/ Prices for Mexican 1-1/16" strict middling cotton averaged $862 per tonc.i.f. Liverpool in the 1950's. In the early 1960's, the US surplus cottondepressed this price to less than $700.

- 38 -
Export prices derived from volume/value data (Table 7a, Annex I)
in dollars and peses for the period 1960 - 69, showed an implicit exchange
rate 25 percent lower than the official rate. No evidence of exchange rate
taxation for cotton was found. It would thus, be worth while to investigate
the source of this discrepancy.
a) Nominal Protection Coefficient. The price series reported by
the IMF for Mexican cotton at Brownsville was used for border prices. The
NPCs (Table 13) indicate a level of taxation of 10 percent
Table 13 MEXICO - Cotton - Incentive Coefficients
YEAR NominalProtection EFFECTIVE PROTECTION COEFFICIENT**Coefficient* Irrigated Country
1960 0.85
1961 0.90
1962 0.91
1963 0.90
1964 0.89
1965 0.94
1966 0.98 1.00 1.00
1967 0.88 0.86 0.86
1968 0.90 0.89 0.89
1969 0.99 1.02 1.02
1970 0.94 0.94 0.94
1971 0.94
1972 1.01
1973 0.96
1974 0.82
1975 -
* coefficients for cotton lint
** coefficients for unprocessed raw cotton

- 39 -
in the 1960's. It is relaxed after 1968 and is consistent with the
government policy in those years to promote cotton production and exports
through increased investment on research.
b) Effective Protection Coefficient. No evidence was found of
protection to value added by the EPCs.-/
c) Producer Retention Coefficient. Retention coefficients are
greater than 1 for all years (Table 14).
Table 14. Mexico: Cotton. - Producer Retention Coefficient
Year Irrigated
1966 1.24
1967 1.04
1968 1.05
1969 1.33
1970 1.16
Once again, they reflect the large share of the water subsidy.
1/ See Annex II, Methodology for a description of how EPCs for cottonwere calculated.

- 40 -
III. Conclusions
All export grains were subject basically to the same price policy
(as measured by the EPC). Corn and whear were most heavily subsidized.
Value added turned out to be a large proportion of the product
price ranging from 50 percent on wheat production to 69 percent on cotton
production in irrigated districts at domestic prices. In temporal districts
this proportion is smaller, from 44 percent on wheat production to 60 percent
in beans production. Lower yields in the latter districts account for this
result. In the tropics, value added was always about 90 percent. These
figures reflect the large dependency of Mexican agriculture on the primary
factors of production.
The result that inputs are in general cheaper at domestic prices
in irrigated areas would tend to reflect an overvalued peso. Meaningful
conclusions based on the results obtained in this study as to the welfare
implications of the Mexican price policy could not be made because of the
roughness of product prices. Some of the drawbacks are explained in the
methodology section.
Present support prices tend to promote the production of corn rather
than wheat, although wheat prices are higher on international markets. While
domestic prices need not necessarily reflect world market situations, Mexico
as exporter (on balance) of corn and an importer of wheat, should probably
bring its prices more closely into line with international prices. The govern-
ment has announced plans to increase the wheat price by shifting some import
outlays to domestic producers in the expectation that rising domestic production
would at least match foregone imports. This would probably have a negative

- 41 -
effect on cotton production which is competing with a wheat-soybean rotation
in the northern irrigation districts. Since cotton is one of the most important
agricultural exports, the option of closing the wheat-corn price gap by
reducing the corn price and introducing only a slight increase in the wheat
price might be considered.
The corn support price must also be seen in terms of rural welfare.
In regions where traditional smallholder agriculture prevails, the support
price has an important social function, since farmers depend almost exclusively
on corn for cash incomes.
The most likely change in the support program would be the extension
of the two-price system to additional agricultural products, and the reduction
of the support prices now paid to irrigated farmers. Moreover, the irrigated
farmer receives a subsidy in the form of cheap water. In order to adjust output
more closely to demand and to comparative advantage without losing sight of
welfare objectives, it would be necessary to bring the differential price of
corn into line with regional production cost differentials. Corn production
costs in irrigated areas are in the order of Mex$600. This contrasts with
the costs of nearly the support price in rainfed areas.

- 42 -
References
Alisky, Marvin."CONASUPO: A Mexican Agency Which Makes Low-Income WorkersFeed their Government Cares", Inter American Economic Affairs,Vol XXVII No 3, 1973.
Austin, James E."CONASUPO and Rural Development", IBRD, December, 1976.
Banco de Mexico.Credito Agropecuario 1966-70, (Mexico) 1972."Indicadores Economicos".Informe Anual.
Banco Nacional de Comercio Exterior.Mexico's Main Export Products, (Mexico), 1964.Comercio Exterior de Mexico.
Barraza, Luciano and Soliz, Leopoldo."Agricultural Policies and the Role of the Sectoral Model",
in IBRD, Multilevel Planning: Case Studies in Mexico, 1973.
CONASUPO 76, (Mexico, CONASUPO), 1976.
F.A.0.Trade Yearbook.Production Yearbook.
Fernandez and Fernandez, Ramon and Acosta, Ricardo.Politica Agricola, (Mexico, Fondo de Cultura Economica), 1961.
F.I.R.A.Relacion Entre Precios de los Insumos y de los Productos Agropecuarios,
1970-77.
"Gaceta CONASUPO".(Mexico, CONASUPO), No 18, February 15, 1975.
Gumpel, Henry and Margain, Hugo.Taxation in Mexico, Harvard University: World Tax Series,
(Boston, Little, Brown and Co.), 1957.
Hewitt de Alcantara."Modernizing Mexican Agriculture", (United Nations), 1975.
IBRD.The Agricultural Economy of Mexico, 1969.Report No 547, ME, 1974.Report No WH - 194a, 1969.I.P.D., Report No 734 - ME, Appraisal of Fertilizer Project,May 5, 1975.

- 43 -
International Customs Tariff Bureau.The International Customs Journal, Mexico, (13th ed.), No 27,
(Brussels), 1974.
International Monetary Fund.SM/75/4SM/76/200SM/70/180
Lopez Rosado, Diego.Problemas Economicos de Mexico (3rd ed.), Instituto de
Investigaciones Economicas, UNAM, (Mexico), 1970.
Nacional Financiera.La Economia Mexicana en Cifras. (Mexico), 1972.
Noyola, F. T., F.I.R.A.,Caracteristicas de la Oferta y la Demanda de Tractores
Agricolas y Maguinas Combinadas en Mexico, 1975.
Secretaria de Agricultura y Ganaderia, INIA,XV Anos de Investigacion Agricola, October 1976.Consumos Aparentes 1925-1971.!!Boletin Interno".Precios de Garantia de Productos Agricolas, 1976.
Secretaria de Hacienda y Credito Publico.Tarifa del Impuesto General de Exportacion (Mexico), 1958.
Secretaria de Industria y Comercio, Direccion General de Estadistica,Anuario Estadistico de Comercio Exterior.Anuario Estadistico Compendiado de los Estados Unidos Mexicanos.Informe Anual.
United Nations.International Trade Yearbook.
Universidad Autonoma de Mexico.Problemas Actuales de Mexico, (Mexico, Instituto de Investigacion
Economicas), 1954.
Velez, Ruben M."La Politica de Precios del-Sector Agropecuario", InvestigacionEconomica, Vol XXXV, No 138, (Mexico, UNAM) April-June, 1976.


TABLE A. MEXICO: PERCENT OF PRODUCTION EXPORTED AIID IMPORTED
Corn Wheat teans Rice Sorahum Soybeans Sesame CottonPercent Percent Percent Percent Percent- Percent Percent Percent
Year ExDOrtCd Insorted Exported Imported Exported Imported Exported Imioorted Exported Imported I..ot'ted Iporte mmeorted Elported
1960 8.40 0.5 - - - 4.7 0.6 6.8 - 4.6 2.4 - - 69.21961 - 0.5 - - - 1.3 0.9 0.7 - 10.8 2.2 - - 69.81962 1.5 - - 0.4 0.5 21.8 - 0.4 20.6 4.2 1.2 - 90.11963 - 6.8 4.2 - 4.7 1.3 - 0.6 - 34.3 1.6 13.4 - 71.21964 3.3 - 20.9 0.5 2.2 0.9 _ 0.6 - 4.1 3.2 1.0 - 58.51965 15.1 0.1 41.3 - 1.9 - - 4.7 0.3 4.6 4.9 0.2 - 77.31966 9.2 - 2.9 - 11.0 - - 3.3 2.4 1.6 5.3 1.8 - 80.01967 14.6 - 7.6 - 7.3 - - - 23.6 0.3 4.1 14.2 - 54.51968 9.9 - 0.t _ 2.3 - 13.2 - 7.8 2.8 4.4 1.4 0.3 56.71969 2.4 0.1 12.9 - 6.4 - - 1.2 1.8 0.5 5.4 1.7 - 95.91970 - 8.3 1.5 - 1.2 0.9 - 4.0 1.6 0.9 47.3 2.0 0.5 68.51971 2.8 0.2 4.7 9.6 - - - 0.2 0.Z U.7 Z0.8 3.2 - 44.71972 4.6 Z.2 0.1 35.4 4.2 0.3 2.9 0.2 - 9.5 2.8 9.8 - 52.81973 0.3 1x,.3 0.5 34.3 2.8 1.8 2.7 8.4 - 0.4 7.2 9.8 - 55.01974 - 16..2 0.7 35.0 - 4.7 0.9 15.2 - 13.4 88.5 7.8 - 34.01975 - 31.0 1.1 3.1 - 7.3 - - - 29.8 3.1 10.7 - 79.61976 - 10.8 0.4 - 3.7 - - - - 1.3 121.5 10.9 - 67.6

Table No. I HEXICO: CORN--PRODUCTION, TRADE AND DOMESTIC USE
AREA YIELD PRODUCTION EXPORTS IMPORTS PRODUCTION DOMESTIC USE
YEAR Total Volume Value Volume Value Per Capita Total Per Capita('000 ha) (kg/ha) '0o00 tons) (tons) ('000 pesos) (tons) ('000 pesos) V (kg): ('000 tons) (kg)
1960 5,558.4 975 5,419.8 457,300 275,000 26,000 23,750 155 4,988.5 1431961 6,287.7 993 6,246.1 - - 31,100 29,000 173 6,277.1 1741962 6,371.7 995 6,337.3 3,500 3,125 94,900 85,125 170 6,428.7 1731963 6,963.0 987 6,870.2 411 ... 466,500 410,625 178 7,336.3 1911964 7,460.6 1,133 8,454.0 282,400 198,875 35,000 39,250 213 8,206.6 2061965 7,718.4 1,158 8,936.4 1,346,789 965,085 11,125 20,675 218 7,600.7 1851966 8,287.0 1,il9 9,271.5 851,809 584,210 4,486 8,810 218 8,424.2. 1991967 7,611.0 1,130 8,603.3 1,.253,890 907,694 4,918 10,318 194 7,354.3 1661968 7,676.0 1,181 9,061.8 896,05b 581,347 5,499 11,378 198 8,171.2 1781969 7,103.5 1,184 8,410.9 788,419 545,268 8,442 16,075 177 7,630.9 1611970 7,439.7 1,194 8,879.4 2,065 * -. 736,008 704,065 181 9,613.3 1961971 7,691.6 1,272 9,785.8 276,707 212,585 17,588 24,766 193 9,526.7 1881972 7,292.2 1,127 9,223.3 423,694 273,424 200,848 212,612 178 9,000.4 1741973 7,606.3 1,131 8,609.1 26,922 18,341 1,143,713 154,395 161 9,725.9 1811974 6,717.2 1,168 7,847.8 1,012 .&.. 1,270,442 2,459,985 141 9,117.2 1641975 6,694.3 1,264 8,458.6 6,278 .- .. 2,620,363 4,970,828 147 11,072.7 1931976 6,864.5F 1,2180 8,360.6F 864 F 5,782 902,253F 1,762,020 140 9,262.0 156
F FAO Estimate.
Sources: Production data from: Secretaria de Agricultura y GanaderLa (Direccidn Ceneral de Economia Agricola);Consumos Aparentes 1925-1971 and "Boletin Interno" Vol iv, No 10, March 1977. Trade data from :Secretaria de Industriay Comercio; Anuario Estadlstico de Comercio Exterior (peso values), Banco de Mexico, "Indicadores Econ6micos" (dollar Valueand F.A.O. : Trade Yearbook (for 1960-64).
OQptD0
x-

TABLE la. .MXICO: CORN. -- PRICE DATA(pesos per ton)
Guaranteed Prices 1/ Average 2 Wholesale 3/ Import Export 5/ U.S. LNo 2 CoaYear Tamaulipas Rest of M;exico Rural Price Price Price Price c.i.f.
19S0 . ., 800 729 798 913 601 716"'.l* 800 749 855 932 ... 639
800 762 952 897 893 63i1953 803 940 942 922 880 ... 761.cO4 800 940 945 993 1121 704 769i955 800 940 959 1048 1858 717 806i95,6 800 940 918 1069 1964 686 8202.67 800 940 940 1000 2098 724 782
800 940 934 1010 2C69 649 7C319i3 800 940 894 1045 1904 692 '7671970 800 . 940 905 1135 913 4/ 1350 89.1,71 800 940 900 1117 1438 768 850.972 840 940 900 1118 1058 645 .640'373 940 940 1100 1229 1319 4/ 681 14591974 1500 1500 1460 1541 1961 4/ 4882 19361975 1750 1900 1860 2223 1813 4/ 2083 16121976 2340 2250 2583 1622 4/* ... 2048
* rxport and import prices for all commodities were derived from dollar values using the average quarterly exchangerate $ 5; 15.42 - $1
Sources:
I/ a" average R?.ral Pricas !:on I.B.sPic .i.. .'.r etural Economy of Mexico, 1969", a.. flireccidn General deEcono=:a Agricola, Secretaria de Agriculturt y Ganader:a, "Precios de Garantia de Productos Agricolas", 1977
2/ D.G.E.A. and, James E. Austin, I.B.R.D., "CCNASUP0 76", 19763/ iholesale prices at Mfexico City for "Tierra Alta" type corn, from F.A.0., Production Yearbook.4/ Secretarila de Agricultura y Ganaderla, Comision Coordinadora.del Sector Agropecuario.O/ Derived from Trade data for all commodities.' >
x .

TABLE No 2: MEXICO: WHEAT-- PRODUCTION, TRADE AND DOMESTIC USE
AREA YIELD PRODUCTION EXPORTS IMPORTS PW DUCT ION DOMESTIC USE
YEAR ('000 ha) (Kg/ha) Total Volume Value Volume Value Per CaPita Total Per Capita('000 tons) (tons) ('000 pesos) (tons) I('O00 pesos) (kg) ('000 tons) (kg)
1960 840 1,417 1,190 - - 34.1 1,190.0 34.11961 836 1,676 1,402 - - - 38.8 1,402.0 38.9
1962 748 1,946 1,455. 1,000 1,625 - 39.0 1,454.0 39.01963 819 2,079 1,703 72,300 62,000 - 44.3 1,630.7 42.41964 818 2,692 2,144 576,000 447,250 9,900 14,250 53.9 1,577.9 39.71965 858 2,505 1,659 684,534 520,124 1,539 2,104 40.4 976.0 23.71966 731 2,254 i,612 46,848 48,388 40: 87 38.0 1,565.2 36.81967 778 2,727 Z,061 212,373 157,382 . 47.8 1,848.6 41.71968 791 2,547 1,780 2,714 3,382 - 45.4 1,777.3 38.71969 783 2,447 1,915 247,313 147,913 - 49.0 1,667.7 35.11970 886 3,020 2,676 41,670 39,562 601 662. 54.5 2,634.9 53.71971 614 2,981 1,831 85,642 91,926 176,723 146,648 36.0 1,922.1 37.81972 687 2,635 1,809 15,789 34,162 640,034 581,577 36.0 2,433.2 47.01973 640 3,265 2,091 10,704 23,087 718,327 976,206 39.0 2,798.6 52.21974 774 3,602 2,789 18,971 58,810 975,882 2,360,807 50.3 3,745.9 67.51975 778 3,596 2,798 30,749 126,500 86,332 217,550 48.7 2,853.6 49.71976 797 4,207 3,354 12,629 46,506 1,505 3,700 56.4 3,342.9 56.2
Sources: Production data: Direccido General de Economfa Agrdcola and FAO, Production Yearbook.
Trade data: Secretarda de Industria Y Comercio, Banco de Mexico and FAO.
S'-

TABLE: 2a MEXIC0: WHEAT -- PRICE DATA(pesos por ton)
Guaranteed Price- 2/ 3/Sonora, Sinaloa 1/ Av. Rural Wholesale Export Import No 1 S.R.W.
Year Baja Calif Rest of Country All of.Mexico Price Price Price Price U.S. (AtlanticPorts)
1960 800/913 913 - 868 1228 - _ 7401961 800/913 913 - 912 1193 - - 7441962 800/913 913 - 893 1170 1625 - 7491963 800/913 913 - 915 1300 857 - 7401964 800/913 913 - 936 1286 776 1439 7951965 800/913 840- 944 1419 760 1367 7261966 800 913 - 882 1331 1033 2187 7761967 800 913 849 1338 741 - 7711968 800 913 - 857 1423 1246 - 7301969 800 913 - 849 1592 598 - 7021970 800 913 _ 842 1503 949 1102 7121971 800 913 - 860 1315 1073 843 4/ 7761972 800 913 - 850 1614 2157 925 4/ 8641973 870 913 - 890 2041 2159 1346 4/ 17101974 1200 1200 1300 1340 1860 3100 2389 4/ 22251975 - 1750 1720 2186 4114 2130 41 17301976 - 2050 1900 2617 E 3682 2459 ---
E FAO estimate
Sources:
1/ 1960-65 $SM 800 for white and red wheat, $. MN 913 tor "Saltigdz" wheat.All support prices after 1965 from Secretar~a de Agricultura y Ganaderia, "Precios de Garantia"
2/ After 1972 from I.B.R.D., 1976
3/ Wholesa a price at Mexico city from FAO and D'G.E.A.E - estimate, F.A.0
./ Secretara de Agricultura y Ganaderia, Direcci6n General del Sector Agropecuario.

Table No.,3: MEXICO: BEANS--PRODUCTION, TRADE AND DOMESTIC USE
AREA YIELD PRODUCTION EXPORTS IMPORTS PRODUCTION DOMESTIC USE
Year Total Volume Value Volume Value Per Capita Total Per Capita
('000 ha) (kg/ha) (tons) (tons) ('000 pesos) (tons) (kg) ('000 tons) (kg)
1960 1,326 398 528,175 197 ... 24,851 52,393 15.1 552.8 15.8
1961 1,555 465 723,340 - 9,749 20,513 20.0 733.0 20.3
1962 1,674 392 655,608 2,402 . 3,253 6,472 17.6 656.4 17.6
1963 1,711 396 677,280 31,621 65,626 8,656 17.6 654.3 17.0
1964 2,091 426. 891,526 20,079 42,175 8,202 22.4 879.6 22.11965 2,117 406 859,584 16,491 33,568 496 1,712 20.9 843.6 20.5
1966 2,240 452 1,013,169 102,041 195,299 323 1,525 23.9 911.4 21.5
1967 1,930 508 980,170 65,823 124,400 274 1,587 22.1 914.6 20.61968 1,791 479 856,940 79,825 142,664 282 1,544 18.7 777.4 16.9
1969 1,655 504 834,599 53,504 61,974 367 2,023 17.6 781.5 16.5
1970 1,747 530 925,041 11,303 10,818 8,632 26,869 18.8 922.4 18.8i971 1,932 477 921,059 - - 454 2,775 18.1 921.5 18.1
1972 1,687 515 869,359 36,978 117,894 2,652 9,698 16.8 835.0 16.1
1973 1,870 539 1,008,596 28,183 74,171 18,066 56,043 18.8 998.5 18.61974 1,329 674 895,627 350 2,450 42,000 400,470 16.1 895.3 16.11975 1,880* 546 1,027,000 185 575 75,000 630,825 1i.9 1,026.8 17.9
1976 1,830* 628 1,149,000 42,197 280,644 ..- 19.3 1,106.8 18.6
* Lnofficial Figures, FAO.
Sources: Production data from: Secretarfa de Agricultura y Canaderta and F.A.O..Trade data from Secrctarta de Industria y Comerelo
Banco de Mexico and Banco Nacional de Comercio Exterior, Comercio Exterior de Mexico, (1961, 1966).
oe
X%cH

Annex iPage 7
Table 3a: MEXICO: BEANS - PRICE DATA(pesos per ton)
AverageGuaranj7ed Rural Wholesa ie Export Import
Year Price-- Pric2/ Price-! Price Price
1960 1.500 1,342 2,400 - 2,1081961 1,750 1,564 2,220 - 2,1041962 1,750 1,647 2,050 - 1,9891963 1,750 1,693 2,220 2,075 n.a.1964 1,750 1,726 2,530 2,100 n.a.1965 1,750 1,743 2,570 2,035 3,4521966 1,750 1,790 2,440 1,914 4,7211967 1,750 1,755 2,720 1,870 5,7921968 1,750 1,758 2.310 1,787 5,4751969 1,750 1,800 2,510 1,158 5,5121970 1,750 1,848 3,070 957 3,1131971 1,750 1,980 2,350 - 6,1121972 1,750 2,030 2,270 3,188 3,6571973 2,150 2,990 3,700 2,632 3,1024/1974 6,000 5,600 5,820 7,000 9,535-1975 .4,500 5,260 6,590 3,1001976 5,250 5,100 6,010 6,650
Sources:1/ Figures for 1961-65 from IBRD, 1969. Other years from CONASUPO:
"'GACETA CONASUPO", June 1975 and IMF, SM/76/200.
2/ Secretarfa de Agricultura y Ganaderfa, Consumos Aparentes 1925-1971, andBoletin Interno.
3 Measured at Mexico City, from FAO.
4/ Comision Coordinadora del Sector Agropecuario

Table No. 4 : MEXICO. RICE--PRODDCT ION, TRADE AND DO:ISTIC USE
AREA YIELD ?-,CUCTIIGN EXPORTS IMPORTS- PODUCTiON _ DOYSTIC USE
Y.-;A R ta - Volume Valua Volune Value Per Capita Total -- Pe('CC0 ha) (kg/ha) (';. torns) (tons) ('000 pesos) (tons) ('000 pesos) (kg) ('CGO tons) (kg)
1960 1&3 2,297 328 2,000 2,000 22,30C 32,375 9.4 348.3 10.01961 146 2,275 333 3,000 2,375 200 625 9.2 330.2 9.11962 134 2,158 209 63,000 111,375 100 250 7.7 226.1 6.11963 135 2,199 296 200 500 1,900 2,125 7.7 297.7 7.71964 133 2,070 274 - - - 6.9 274.0 6.91965 138 2,734 378 - 17,833 26,928 9.2 395.8 7.21966 153 2,439 372 - - 12,432 21,420 8.8 384.4 6.71967 168 2,482 41;8 - 33 88 9.4 418.0 9.41968 139 2,503 347 45,729 46,787 106 350 7.5 301.4 6.61969 153 2,329 395 - - 4,945 10,113 8.3 403.9 8.51970 150 2,682 435 - 16,301 23,832 8.2 421.3 8.61971 166 2,642 440 Q - 801 1,900 8.7 440.8 8.71972 165 2,452 4W5 11,785 8,437 662 1,800 7.8 392.9 7.61973 150 2,996 451 12,002 11,562 37,916 140,425 8.4 476.9 8.91974 173 2,707 469 4,150 11,000 71,247 334,787 8.4 537.1 9.71975 196 2,602 1 - 6 24 8.2 510.6 8.81975 1SSf 2,903 450C 277 1,958 19 154 7.5 449.7 7.5
1/ Figures for 1965-1973 from F.A.O., Trade Yearbook.-- Unofficial figures, F.A.0.
Sources: -.- _:t_on data: a:re: arfaa a .ricultura y Garaderta ard 7.tA..-.Trade data: Secretarfa de Industria y Comercio, Banco de Mexico and F.A.0.
OD. . - - -- , - _ _ _~~~~~~~~~~*
X

Table 4a: MEXICO: RICE - PRICE DATA(pesos per ton)
Guaranteed Pricesl/ AverageArrozblanco Palay Palay Palay Palay (Rest. Rural Wholesa;e Export Import Med. No. 2Year (Sinaloa) (Sonora) (Sinaloa) (Morelos) of Countrv) Price Price2/ Price Price US (Texas)
1960 ... ... ..- 891 2,434 1,000 1,452 2,2721961 ... .. * - 928- 2,596 792 3,125 2,5901962 ... ... 1,008 2,555 1,768 2,500 2,5621963 ... ... ... 1,056 2,577 2,500 1,118 2,425;964 ...- 1,077' 2,642 - - 2,3011965 1,900 _ 900 1,100 - 1,137 2,779 _ 1,510 2,2461966 1,900 Z 900 1,100 - 1,125 2,949 _ 1,723 2,3011967 1,900 £,o 900 1,100 - 1,098 2,899 - 2,651 2,3841968 1,900 900 1,100 - 1,145 2,928 1,022 3,271 2,3421909 1,900 . 900 1,100 - 1,187 2,940 - 2,045 2,3841973 1,900 900 1,100 - 1,190 3,048 - 1,452.2/ 2,4521971 1,900 E-2 900 1,100 - 1,230 3,120 - 2,372 2,5211972 1,900 i 3 900 1,100 - 1,127 - 716 2,719 3,7341973 1,900 ; 900 1,100 - 1,608 - 964 3,615/ '7,5511974 6,000 - - - 3,000 2,690 - 2,650 5,0452/ 5,4841975 6,000 - 2,500 2,500 2,500 2,820 - - 4,166' 4,7811976 - - 2,750 - 3,000 2,900 _ 7,068 4,865
Sources:1/ DG.A (SAG), "Preci.os de Ga-antia".2/ Waholesale price at 1exico Sity from Direccion General de EstaL(stlca, Anuario Estadistico Compendiado.1 Secretarla de Agricu1:-:a y Gazat2aria, Comisio6n Coordinadora daz Sector Agropecuario.
OQ
0-._

Table No. 5 : MEXICO: SORGHUM--PRODUCTION, TRADE AND DOMESTIC USE
AREA YIELD PRODUCTION EXPORTS- IF RODUCTION _ DOESTIC USE
YEAR Total Volume Value Volume Value Per Capita Total Per Capita('000 ha) (kg/ha) ('000 tons) (tons) ('000 pesos) (tons) ('000 pesos) (kg) ('000 tons) (kg)
1960 116 1,797 209 9,700 14,750 6.0 218.4 6.21961 117 2,491 291 - - 31,500 27,125 8.1 322.4 8.91962 118 2,516 296 1,100 2,750 60,900 43,625 7.9 355.8 9.51963 198 2,036 402 . _ _ _ 137,900 95,125 10.4 539.8 14.01964 276 1,901 526 400 1,375 21,400 26,750 13.2 547.0 13.71965 314 2,376 747 2,334 8,762 34,661 21,500 18.2 779.3 19.01966 576 2,450 1,411 34,612 21,737 22,940 26,025 33.3 1,399.3 33.01967 673 2,475 1,666 392,658 244,871 4,521 10,287 37.6 1,277.8 28.81968 830 2,570 2,133 166,062 88,378 60,608 57,912 46.5 2,027.5 44.21969 883 2,781 2,456 45,402 34,262 11,718 22,562 51.8 2,422.3 51.01970 971 2,829 2,747 43,767 29,300 25,890 31,700 56.0 2,729.1 55.61971 949 2,686 2,549 57,720 36,475 17,108 34,050 50.2 2,508.4 49.41972 1,094 2,367 2,590 155 562 246,541 218,812 50.0 2,836.4 54.81973 1,185 2,686 3,182 618 950 13,625 49,412 59.4 3,195.0 59.61974 1,153 2,760 3,183 - - 426,717 801,161 57.3 3,609.7 65.11975 1,116 2,549 2,843 724 4,100 846,310 1,453,250 49.5 3,688.6 64.21976 1,180* 2,834 3,350* 2,574 18,442 44,033 72,318 56.3 3,391.4 57.0
1/ Data for "cereals n.e.e." for several years, FAO
* Unofficial figures, FAO
Sources: Production data: Secretar(a de Agricultura -r Ganaderfa and FAO.
Trade data: Secreteria de Industria y Comercio, Banco de Hexico and Banco Nacional de Comercio Exteri6r.
Qm
x

Annex 1Page 11
Table 5a: MEXICO: SORCHUM - PRICE DATA(pesos. pler ton)
Guaranteed Prices AverageTamaulipas, Rest of Rural Export Import US
Year Sonora the Country PriceYt Price Price (FOR Gulf)
1960 * . - 636 - 1,521 4711961 565 - 564 - 861 5321962 . 565 - 558 2,500 716 5701963 565 - 584 - 689 6071964 625 - 601 3,437 1,250 6021965 - 625 632 3,754 765 5901966 - 625 639 628 1,134 6461967 - 625 620 624 2,275 6301968 - 625 .622 532 955 5811969 - 625 639 755 1,925 6261970 - 625 646 669 1,225 6471971 - 625 680 631 1,987 6961972 675 725 735 3,625 79QaI. 7001973 775 775 850 1,537 3,625 1,1621974 '.. 959 1,270 - 1,7972/ 1,5121975 1,600 1,420 1,580 5,662 1,4492/ 1,4121976 - 1,760 1,900 7,165 - 1,622
Sources:1/ Prices after 1972 from IBRD, 1976. -2/ Secretarfa de Agricultura of Ganaderia, Comision Coordinadora del Sector Agropecuario

Table No.6 : MEXICO: SOYBEANS--PRODUCTION, TRADE AND DOMESTIC USE
AREA YIELD PRODUCTION IMORTS PRODUCTION DOMESTIC USE
Total Volume Value Per Capita Total Per CapitaYEAR (t000 ha) (kg/ha) (tons) (tons) ('000 pesos) (kg) ('000 tons) (kg)
1960 4 1,230 4,970 120 187 0.1 5,090 0.11961 10 1,985 19,737 440 912 0.5 20,649 0.61962 27 2,076 56,721 2,370 4,125 1.5 59,091 1.61963 27 2,051 56,258 900 1,650 1.6 57,158 1.51964 31 1,968 60,267 1,940 3,887 1.5 62,207 1.61965 27 2,107 57,875 2,870 5,900 1.4 60,745 1.51966 54 1,749 94,848 5,030 10,225 2.2 99,878 2.31967 70 1,875 131,023 5,338 11,800 2.9 136,361 3.11968 133 2,069 275,159 12,144 24,825 6.0 287,303 6.31969 163 k,757 286,708 15,576 32,312 6.U 302,284 6.41970 112 1,920 214,603 101,595 148,937 4.4 316,198 6.41971 128 1,988 255,000 68,261 123,687 5.0 323,261 .6.41972 222 1,700 376,833 10,707 28,225 7.3 387,540 7.51973 312 1,877 585,488 42,443 159,137 10.9 627,931 11.71974 315 1,636 491,000 434,772 1,234,550 8.8 925,772 16.71975 344 2,029 699,000 21,758 92,562 12.2 720,758 12.51976 150* 1,733 260,000F 316,000* 1,464,895 4.4 576,000 9.7
F FAO estimate
* Unofficial figures FAO
Sources: Production data: Secretar(a de Agriculture y.Ganaderta and F.A.0.
Trade data: Secreterta de Industria y Comercio and FAO.
Oa oo mfD 0x
I.H

Annex 1Page 13
Table 6a: MEXICO: SOYBEANS - PRICE DATA(pesos per ton)
Guaranteed Prices-/ Average'South of Rura)1, Import US No. 2
Year Tamaulipas Country Pric;s. Price (Rotterdami)
1960 - 1,300 1,210 1,558 1,1501961 - 1,300 1,272 2,073 1,3871962 - *.. 1,302 1,740 1,2501963 - ... 1,371 1,833 1,375
1964 - 1,392 2,004 1,3751965 - ... 1,409 2,050 1,4621966 - 1,600 1,427 2,037 1,5751967 - 1,600 1,601 2,212 1,4001968 - 1,600 1,599 2,050 1,3251969 - 1,450 1,599 2,075 1,2871970 - 1,300 1,635 1,462 1,4621971 - 1,600 1,680 1,812 1,5751972 - 1,600 1,790 2,637 1,7501973 1,750 1,800 3,250 3,750 3,6251974 2,700 3,000 ... 2,837 3,4621975 3,500 3,300 * 4,750 2,7501976 - 4,000 ... 4,636 3,562
Sources:1/ Selling prices by CONASUPO.2/ ERS, USDA.

'Ojt; p ozi::Z p*ur .2;-P,X r;::snpu: 7?r p e: :r-,T *--
~~~~~~~~~~~~~~~~~~~~~~sJr;* s:r- o *rr ':o 'T^:i ":. -:'.'.'.
56 C ; . I: -L' C -.:
-L'S 6 -!|W Z- IE> !29 Zl: i 916 f;4;_16ZS'f
S-C L,9tT Z )9 SZi 'T Z ;. qi t 1ts X , t5$ ¢ ;, 5; S::'9:.5 t 6 6'- S -.; :;S _ '.
1-; S-i6s Z-zl !.!;4£ 94t 9';.-;/f' Ot, -gS4 '-.
6 S6 Ct U ( 5 sO :; Zi1. S: S!St;4'G' C5§-' wtS 91'S
6-Z 9 C.l O19 6(.5 , r;f6q S *; S,, *; .:
(}-f x O'; ~~~~~~~5S-; USLJi !'':_l t:e.e:C5 ,t.;
;- -;:' 'sz;t.'~e -l..-lf. -* -- *:
t Sa ) ; .n -; ( *s'I'tb) _ Lt'sd rc',) _.; '- ( C.
lSn 1sS3Koa aNy 3aVU 'NOIlnaoid - *NoO3O :OoIXZH :L '°N alqvl

Table 7a: MEXICO: COTTON - PRICE DATA
(pesos per ton)
Guaranteed Prices /Valle de Average Mexican
Valle de Apatzingan Rural Wholesie WholesWe Export Mexican SM 1-1/16"Year Mexicali (Michoacan) Country Price Price- Price- Price (Brownsville) (No. EuroPe)
1960 - - 6,056 6,301 n.a. 4,721 7,129 8,1841961 - - - 6,434 6,287 6,775 4,736 7,150 8,4021962 - - - 6,272 6,107 6,404 4,729, 6,900 8,1151963 - - - 6,310 6,574 6,611 4,715 7,037 8,0711964 - - - 6,363 6,173 6,660 4,706 7,137 801291965 - - - 6,369 6,219 6,225 4,696 6,787 7,9471966 800 900 - 6,403 6,750 6,200 4,673 6,500 8,0461967 800 900 - 6,378 7,205 6,375 4,702 7,150 8,4571968 800 900 - 6,382 6,918 6,475 4,743 7,062 8,5561969 800 900 - 6,287 6,504 6,355 4,727 6,337 7,8371970 800 900 - 6,579 7,853 6,950 4,786 -6,972 8,4551971 800 900 - 7,540 8,803 8,500 4,760 7,983 9,7771972 800 900 - 8,358 10,000 8,705 9,064 8,284 10,3311973 800 900 - 13,929 18,060 ... 11,613 14,423 17,3961974 - - 2,200 13,030 11,184 ... 13,655 15,863 18,2351975 _ _ 2,200 ... 15,699 ... 13,800 15,4151976 - - 2,650 ... 26,812 ... 26,029 26,943
Sources:1/ Direccion General de Economla Agr(cola (SAG) "Precios de Garantta".2/ Strict Middling 15/16" TORREON, FAO.3/ IMF, International Financial Statistics (from country statistics).
Qn


ANNEX 2Page 1
METHODOLOGY
a) Nominal Protection Coefficients. The price data for the calculation
of these coefficients were the following: average farm gate prices for the
country as reported by the Direccion General de Economia Agricola and implicit
export or import prices derived from trade data on volume and value in pesos
and dollars were used. Peso values were taken mainly from the Anuario de Comercio
Exterior published by the Direccion General de Estadistica and dollar values
mainly from Banco de Mexico, "Indicadores Economicos". Both sources report the
same figures for trade volume.
Because data on major markets, transportation and marketing margins
was not available the prices used do not reflect any adjustment for these
factors. Thus the NPCs would tend to over and under state protection when the
commodity is imported and exported respectively.
b) Effective Protection Coefficients. Data on production costs from
the CHAC model were used to calculate these coefficients. Since these data are
available for 19 districts, different zones within districts, and different levels
of mechanization, the data from a sample of districts, where the crops are
produced, was chosen as representative for the country as a whole. The selection
of districts was based on the solution producing districts from Yakir Plessner,
"Mexico: Case Study of Agricultural Prices and Subsidies"-/ and on production by
district data for irrigated districts. Additional districts were selected rand-
omly when the sample was too small. The district sample chosen for each crop
represents roughly 70 percent of all districts where the commodity is grown.
1/ AGRER, working paper. See solution production levels for experiment three.
ANNEX 2Page 2
For the calculation of EPCs, the traded inputs considered were,
chemicals, seeds, interest charges on machinery and costs associated with
the operation of machinery (depreciation, maintenance and gasoline and oil
consumption). Data on these inputs are reported on a per hectare basis.
Chemicals and seeds are reported in value terms. Machinery time is reported
in month units, costs are costs per month. The subsidized annual interest
chargel/ of 12 percent was used for the calculation of value added at domestic
prices.
Value added at world prices is simply value added at domestic prices, with
input prices inflated by the proportion of the subsidy. An assumed subsidy
of 10 percent was applied to chemicals. Recently, some evidence was, however,
found that government subsidy to fertilizer is in the order of 20-25 percent.
No evidence of governemental subsidies to seeds was found and therefore the value
of this input remains unchanged at world prices. The market interest rate of
20 percent was used as interest cost on machinery capital.
1. Value added for Cotton. Value added for unprocessed raw cotton contains
by weight, 35 percent,fiber, 60 percent seed, and 5 percent waste, the implied
value of raw cotton was calculated as the sum of 60 percent of the price of
fiber and 35 percent of the price (from CHAC) of cotton seed. This price was
decreased by the value added obtained by comparison of a similarly deduced
price done with slightly different fiber prices from CHAC with the price of
unprocessed raw cotton. The prices obtained were assumed to be the domestic
unprocessed raw cotton price. Border prices were obtained by dividing by the cotton
fiber NPCs for each year.
1/ This was the interest rate for agriculture credit charged by the national creditbanks in 1968. The market rate was 20 percent.

ANNEX 2Page 3
c) Producer Retention Coefficients. The same criterion as for
the calculation of EPCs was followed except that non-traded inputs,
water and draft animals were added. Evidence of subsidies to draft
animals was not found. Subsidies on gravity water are, however,
quite large ranging from 74 to 85 percent in irrigated districts.
Most irrigated districts use gravity water. In those where
both pump and gravity water is used an average charge per cubic
meter was derived using the solution water levels as weights.
Unsubsidized water charges were the same weighted average without
the subsidy to gravity water. Border product prices for these cal-
culations are assumed to be the same as those used for the calculation
of NPCs. Due to the roughness of these prices it was believed that
adjustment by the marketing margin (wholesale price/farm gate price)
would not result in more realistic prices.


ANNEX 3Page 1
Two sets of EPCs (for 1968) using CHAC solution results are
reported below. One uses in the numerator, endogenous CHAC prices
per district and the other, international prices corrected for tariffs.
District EPCs are simply the sum of weighted EPCs by technology, where the
weights are the proportion of hectares of production of a crop using a
given technology. Inputs include chemicals, seeds, credit and machinery.
For comparison with those in the text, EPCs for irrigated, rainfed
and tropical districts were calculated (see Table 1).
The results are quite similar in all three cases except
for some negative and very large EPCs due to the fact that value added
at world prices is nearly zero or negative. The two new EPCs, however
show that corn is the most protected crop, followed by wheat and rice.
The text EPCs show that corn is the second most highly protected crop
after rice. However, as explained before, this result is not very
reliable because of the inaccuracy of the price data on rice.
It is worth noting that corn, wheat and rice ranked low (among
31 crops) in Mexico's comparative advantage, whereas sesame and cotton
ranked relatively high1 (see Table 2), which indicates that high rates of
protection have been directed to crops inefficiently produced.
See J. Duloy and R. Norton, "CHAC Results: Economic Alternativesfor Mexican Agriculture", Chapter III in L. Gereux and A. Manne (eds.),Multilevel Planning: Case Studies in Mexico, North Holland, 1973.

TABLE 1
MEXICO: Eight Crops -- Comparison of EPCs UsingDistrict Prices and International Prices Correctedfor Tariffs, in the Numerator, with EPCs UsingRaw Data. 1968.
CROP IRRIGATED RAINFED TROPICAL
District International Text District International Text District International TextPrices Prices EPC Prices Prices EPC Prices Prices EPC
CORN 2.15 17.72 2.95 - 1.40 - 0.20 4.0 1.56 1.65 1.45
WHEAT 1.83 1.19 1.72
BEANS 1.05 1.08 1.06 0.99 1.07 1.05 1.02 1.03 0.98
SORGHUM 1.04 1.08 1.80 1.12 1.72 1.69
RICE 2.21 1.88 3.99 1.80 1.74 1.96
SOYBEANS 0.70 0.71 0.73 0.77 0.77 0.75
SESAME 0.51 0.52
COTTON 0.85 0.89 0.89
OQ
xM..

Annex 3Page 3
TABLE 2
MEXICO: Eight Crops - Ranking of Crops byComparative Advantage in International Trade.1968.
CROP RANK EXCHANGE COST OF CROP
Sesame 9 5.59
Cotton - Fiber 18 11.05
Beans 19 11.82
Grain Sorghum 20 13.60
Rice 25 21.93
Wheat 26 22.08
Corn 27 22.13
Soybeans- 28 22.97


