
Copyright © 2015, 2016 MoCA Alliance Page 1 of 40
MoCA 2.0/2.5 Specification for Device RF Characteristics
20160808
Copyright © 2012, 2014, 2016 Multimedia Over Coax Alliance. All Rights Reserved. MoCA is a trademark or registered
trademark of the Multimedia Over Coax Alliance in the United States and other countries.
Copyright © 2015, 2016 MoCA Alliance Page 2 of 40
IMPORTANT NOTICE. THIS DOCUMENT AND THE INFORMATION CONTAINED HEREIN ARE PROVIDED
"AS IS" AND “WITH ALL FAULTS”. NEITHER MOCA NOR ANY MEMBER OF MOCA MAKES ANY
REPRESENTATIONS OR WARRANTIES OF ANY KIND WHATSOEVER WITH RESPECT TO (A) THIS
DOCUMENT, (B) ANY PRODUCT THAT IS DEVELOPED OR MANUFACTURED IN ACCORDANCE WITH THE
SPECIFICATIONS IN THIS DOCUMENT OR (C) THE INTEROPERABILITY OF ANY SUCH PRODUCT WITH ANY
OTHER PRODUCT. MOCA AND MOCA MEMBERS DISCLAIM ALL IMPLIED WARRANTIES, INCLUDING
WITHOUT LIMITATION THE IMPLIED WARRANTIES OF MERCHANTABILITY, FITNESS FOR A PARTICULAR
PURPOSE, ACCURACY, NON-INFRINGEMENT AND TITLE. NEITHER MOCA NOR ANY MEMBER OF MOCA
MAKES ANY REPRESENTATIONS OR WARRANTIES THAT THE CONTENTS OF THE DOCUMENT ARE
COMPLETE, ACCURATE OR SUITABLE FOR ANY PURPOSE OR THAT ANY PRODUCT OR OTHER
IMPLEMENTATION OF SUCH CONTENTS WILL NOT INFRINGE ANY PATENTS, COPYRIGHTS OR OTHER
RIGHTS. IN NO EVENT WILL MOCA OR ANY MOCA MEMBER BE LIABLE FOR ANY LOSSES, INVESTMENTS
MADE, LIABILITIES, LOSS OF PROFITS, LOSS OF BUSINESS, LOSS OF USE OF DATA, INTERRUPTION OF
BUSINESS, OR FOR ANY DIRECT, INDIRECT, SPECIAL OR EXEMPLARY, INCIDENTIAL, PUNITIVE OR
CONSEQUENTIAL DAMAGES OF ANY KIND, IN CONTRACT, TORT, NEGLIGENCE OR OTHER LEGAL
THEORY, INCLUDING WITHOUT LIMITATION IN CONNECTION WITH THE USE OF THIS DOCUMENT, THE
INFORMATION CONTAINED HEREIN OR ANY PRODUCT OR IMPLEMENTATION, EVEN IF ADVISED OF THE
POSSIBILITY THEREOF. USE OF THIS DOCUMENT IS AT YOUR SOLE RISK. From time to time MoCA may issue
improvements, enhancements and other changes to the specification described in this document.
Copyright © 2015, 2016 MoCA Alliance Page 3 of 40
Table of Contents 1 MoCA 2.0/2.5 Specification - Introduction and Scope ..................................................................................6
1.1 Scope ..........................................................................................................................................................6
1.2 Introduction ................................................................................................................................................6
1.3 Abbreviations .............................................................................................................................................6
1.4 Definitions ..................................................................................................................................................6
1.5 Physical Network Model ............................................................................................................................7
2 MoCA 2.0 and MoCA 2.5 Reference Specification ........................................................................................8
2.1 MoCA Frequency Plan ...............................................................................................................................8
2.1.1 MoCA 2.0 Extended Band D Frequency Plan ......................................................................................8 2.1.2 MoCA 2.0 Band E Frequency Plan .................................................................................................... 10 2.1.3 MoCA 2.0 Band F Frequency Plan ..................................................................................................... 11 2.1.4 MoCA 2.5 Extended Band D Frequency Plan .................................................................................... 12 2.1.5 MoCA 2.5 Band E Frequency Plan .................................................................................................... 14
2.2 Connector and Return Loss ...................................................................................................................... 14
2.3 Maximum Total Output Power ................................................................................................................. 14
2.4 MoCA Transmitter Spectral Mask ........................................................................................................... 15
2.4.1 MoCA 2.5 PHY Transmit Spectral Mask and Spurious ..................................................................... 15 2.4.2 MoCA 2.0 PHY Transmit Spectral Mask and Spurious ..................................................................... 18 2.4.3 Bonded-PHY Transmit Spectral Mask ............................................................................................... 19 2.4.4 MoCA 1 PHY Transmit Spectral Mask .............................................................................................. 20
2.5 MoCA 2.0 RF Mode Transmitter Spurious Output .................................................................................. 24
2.5.1 Extended Band D Transmit Spurious Emissions ................................................................................ 24 2.5.2 Band E Transmit Spurious Emissions ................................................................................................ 25 2.5.3 Band F Transmit Spurious Emissions ................................................................................................. 26
2.6 MoCA 2.5 Band Specific Transmit Spurious and Noise Emissions ......................................................... 28
2.6.1 Band ExD Transmit Spurious and Noise Emissions........................................................................... 28 2.6.2 Band E Transmit Spurious Emissions ................................................................................................ 29 2.6.3 Band F Transmit Spurious and Noise Emissions ................................................................................ 29
2.7 Receiver Minimum Sensitivity ................................................................................................................. 30
2.7.1 MoCA 2.0 Receiver Minimum Sensitivity ......................................................................................... 30 2.7.2 MoCA 2.5 Receiver Minimum Sensitivity ......................................................................................... 32
2.8 Coexistence with Other Signals ................................................................................................................ 33
2.8.1 CATV and DOCSIS Susceptibility..................................................................................................... 33 2.8.2 Satellite Susceptibility ........................................................................................................................ 34 2.8.3 Receiver Sensitivity to Gated Noise in Bands E and F ....................................................................... 36
2.9 Sensitivity to ATSC Interference ............................................................................................................. 37
2.10 Non-Transmit Spurious and Noise Emissions .......................................................................................... 38
2.10.1 Extended Band D Non-Transmit Emissions ..................................................................................... 38 2.10.2 Band E Non-Transmit Emissions ..................................................................................................... 39 2.10.3 Band F Non-Transmit Emissions ..................................................................................................... 40
Copyright © 2015, 2016 MoCA Alliance Page 4 of 40
Figures Figure 1-1: A Typical In-home MoCA Network ........................................................................................................7 Figure 2-1. MoCA 2.0 Extended Band D Frequency Plan .........................................................................................9 Figure 2-2. MoCA 2.0 Extended Band D Frequency Plan – Independent Networks .................................................9 Figure 2-3. MoCA 2.0 Band E Frequency Plan with Single or Bonded-Pair Channels Example ............................ 11 Figure 2-4. MoCA 2.0 Band FSAT Frequency Plan with Bonded-Pair Channels Example .................................... 12 Figure 2-5. MoCA 2.0 Band FCBL Frequency Plan with Bonded-Pair Channels Example .................................... 12 Figure 2-6. MoCA 2.5 Extended Band D Frequency Plan ....................................................................................... 13 Figure 2-7. MoCA 2.5 Extended Band D With DOCSIS 3.1 Note .......................................................................... 13 Figure 2-8. MoCA 2.5 Band E Frequency Plan ....................................................................................................... 14 Figure 2-9. MoCA 2.5 Transmit Spectral Mask with the same TPC each channel, (for TPC Settings of 0 to 20) .. 17 Figure 2-10. MoCA 2 –Transmit Spectral Mask (for TPC Settings of -12 to 20) ................................................... 19 Figure 2-11. MoCA 2 – Bonded-Pair Channels – Tx Transmit Spectral Mask ........................................................ 20 Figure 2-12. MoCA 1 PHY Transmitter Spectral Mask - Signal at Lower Half of MoCA 2.0 Channel ................. 21 Figure 2-13. MoCA 1 PHY Transmitter Spectral Mask - Signal at Center of MoCA 2.0 Channel ......................... 22 Figure 2-14. MoCA 1 PHY Transmitter Spectral Mask - Signal at Higher Half of MoCA 2.0 Channel ................. 23 Figure 2-15. Minimum Receiver Sensitivity in Band ExD ...................................................................................... 31 Figure 2-16. Minimum Receiver Sensitivity in Bands E and F ................................................................................ 32 Figure 2-17. MoCA 2.5 Minimum Receiver Sensitivity .......................................................................................... 33

Copyright © 2015, 2016 MoCA Alliance Page 5 of 40
Tables Table 1-1. Table of Abbreviations ............................................................................................................................................... 6 Table 2-1. Extended Band D Channel Frequencies ................................................................................................................... 10 Table 2-2. Band E Channel Frequencies .................................................................................................................................... 11 Table 2-3. Band F Channel Frequencies .................................................................................................................................... 12 Table 2-4. MoCA 2.5 Extended Band D Channel Frequencies ................................................................................................. 13 Table 2-5. Band E Channel Frequencies .................................................................................................................................... 14 Table 2-6. Maximum Total Output ............................................................................................................................................ 15 Table 2-7. Transmitter Spectral Mask Frequency Ranges ......................................................................................................... 15 Table 2-8. MoCA 2.5 MFloor Values ........................................................................................................................................... 16 Table 2-9. Transmitter Spectral Mask for TPC Settings of 0 to 30 ........................................................................................... 17 Table 2-10. Transmitter Spectral Mask with the same TPC on each channel ............................................................................ 17 Table 2-11. Allowed Spurious when Transmitting .................................................................................................................... 18 Table 2-12. Transmitter Spectral Mask for TPC Settings of -12 to 45 ...................................................................................... 18 Table 2-13. MoCA 1.0 PHY Transmitter Spectral Mask - Signal at Lower Half of MoCA 2.0 Channel ................................ 21 Table 2-14. MoCA 1 PHY Transmitter Spectral Mask - Signal at Center of MoCA 2.0 Channel ............................................ 22 Table 2-15. MoCA 1 PHY Transmitter Spectral Mask - Signal at Higher Half of MoCA 2.0 Channel .................................... 22 Table 2-16. MoCA 1 PHY Transmitter Spectral Mask for Probe Signals - Signal at Lower Half of MoCA 2.0 Channel ........ 24 Table 2-17. MoCA 1 PHY Transmitter Spectral Mask for Probe Signals - Signal at Center of MoCA 2.0 Channel ................ 24 Table 2-18. MoCA 1 PHY Transmitter Spectral Mask for Probe Signals - Signal at Higher Half of MoCA 2.0 Channel ....... 24 Table 2-19. Extended Band D Transmitter Spurious Output ..................................................................................................... 25 Table 2-20. Band E Transmitter Spurious Output ..................................................................................................................... 26 Table 2-21. Band FSAT Transmitter Spurious Output .............................................................................................................. 27 Table 2-22. Band FCBL Transmitter Spurious Output .............................................................................................................. 28 Table 2-23. Extended Band D Transmitter Spurious Output ..................................................................................................... 29 Table 2-24. Band E Transmitter Spurious Output ..................................................................................................................... 29 Table 2-25. Band FSAT Transmitter Spurious Output ................................................................................................................. 29 Table 2-26. Band FCBL Transmitter Spurious Output ................................................................................................................. 30 Table 2-27. Minimum PHY Rate vs. Receive Power Level in Band ExD ................................................................................. 30 Table 2-28. Minimum PHY Rate vs. Receive Power Level in Bands E and F .......................................................................... 30 Table 2-29. Minimum PHY Rate vs. Receive Power Level for Turbo Mode in Band ExD ...................................................... 30 Table 2-30. Minimum PHY Rate vs. Receive Power Level for Turbo Mode in Bands E and F ............................................... 31 Table 2-31. MoCA 2.5 Minimum PHY Rate vs. Receive Power Level .................................................................................... 32 Table 2-32. CATV Signals Coexisting with Band ExD ............................................................................................................ 33 Table 2-33. CATV Signals Coexisting with Band FCBL .......................................................................................................... 34 Table 2-34. OSP Satellite Transponder Signal Level for Band E Devices ................................................................................ 34 Table 2-35. FSK Control Signal ................................................................................................................................................ 34 Table 2-36. Maximum Intermittent Power Levels at the Input to the Node .............................................................................. 35 Table 2-37. OSP Satellite Transponder Signal Level for Band FSAT Devices ......................................................................... 35 Table 2-38. DiSEqC™ Control Signal ...................................................................................................................................... 35 Table 2-39. Maximum Intermittent Power Levels at the Input to the Node .............................................................................. 36 Table 2-40. UHF Analog Video Signal ..................................................................................................................................... 36 Table 2-41. Bands E and F Minimum PHY Rate vs. Receive Power Level with Gated Noise ................................................. 36 Table 2-42. ATSC Interference Maximum Time to Reform a Network .................................................................................... 38 Table 2-43. ATSC Interference Maximum Time to Rejoin a Network ..................................................................................... 38 Table 2-44. Extended Band D Non-Transmit Emissions Limits ............................................................................................... 38 Table 2-45. Band E Non-Transmit Emissions Limits ................................................................................................................ 39 Table 2-46. Band FSAT Non-Transmit Emissions Limits ......................................................................................................... 40 Table 2-47. Band FCBL Non-Transmit Emissions Limits ........................................................................................................ 40
Copyright © 2015, 2016 MoCA Alliance Page 6 of 40
1 MoCA 2.0/2.5 Specification - Introduction and Scope
1.1 Scope
This document summarizes several technical specifications for operation of Multimedia Over Coax Alliance
(MoCA) 2.0 and 2.5 devices (“nodes”) using in-home coaxial wiring for transport of multimedia content: MoCA
Frequency Plan, Connector and Return Loss, Maximum Total Output Power, MoCA Transmitter Spectral Mask,
MoCA 2.0 RF Mode Transmitter Spurious Output, Receiver Minimum Sensitivity, Coexistence with Other
Signals, Sensitivity to ATSC Interference, and Non-Transmit Spurious and Noise Emissions.
1.2 Introduction
The MoCA system network model creates a coax network which supports communications between a
convergence layer in one MoCA node to the corresponding convergence layer in another MoCA node. All MoCA
2.0 and 2.5 devices also comply with all of the specifications for MoCA 1.0 and 1.1 devices. When MoCA 1.0 or
1.1 devices are present in the same network as MoCA 2.0 and 2.5 devices, all communication between MoCA 1
devices and MoCA 2.0 and 2.5 devices uses MoCA 1 protocols. In the same network MoCA 2.0 and 2.5 devices
communicate with other MoCA 2 devices using MoCA 2 protocols.
MoCA 2 MAC supersedes MoCA 1.1 with a set of new features. The new features improve MAC efficiency for
higher throughput and overall system performance. MoCA 2 offers seamless interoperability with MoCA 1 legacy
nodes. MoCA 2.5 adds new management features and PHY rates to MoCA 2.0.
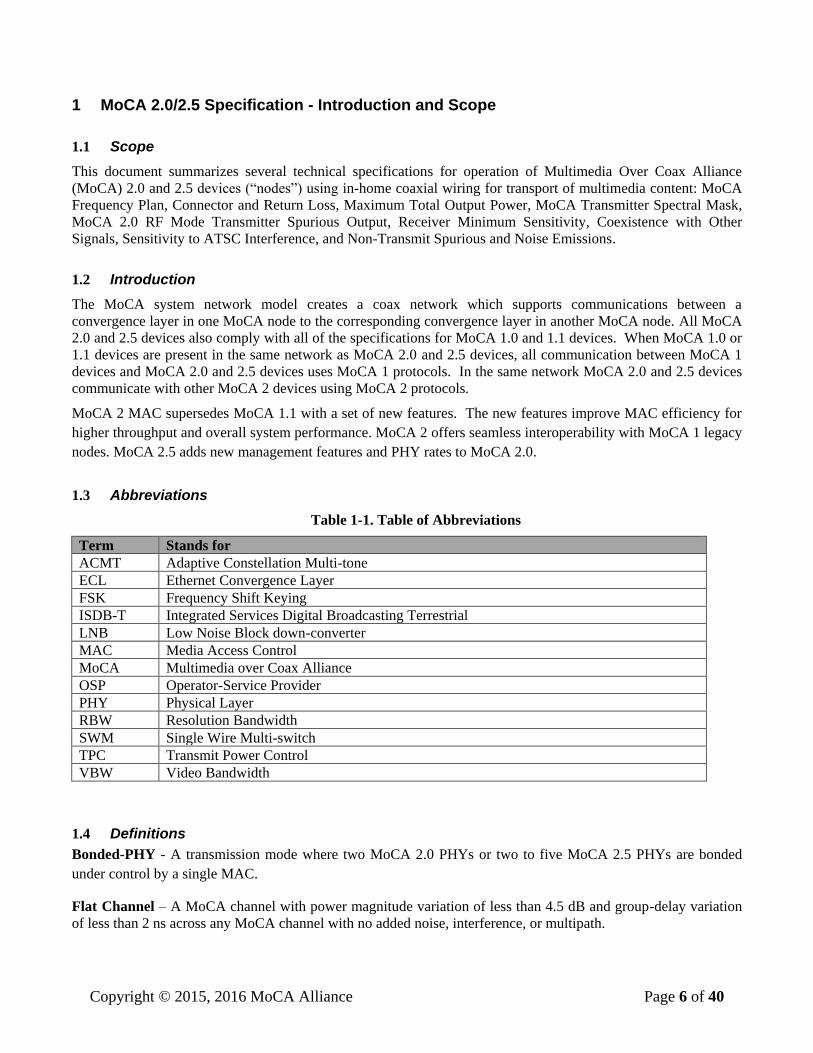
1.3 Abbreviations
Table 1-1. Table of Abbreviations
Term Stands for
ACMT Adaptive Constellation Multi-tone
ECL Ethernet Convergence Layer
FSK Frequency Shift Keying
ISDB-T Integrated Services Digital Broadcasting Terrestrial
LNB Low Noise Block down-converter
MAC Media Access Control
MoCA Multimedia over Coax Alliance
OSP Operator-Service Provider
PHY Physical Layer
RBW Resolution Bandwidth
SWM Single Wire Multi-switch
TPC Transmit Power Control
VBW Video Bandwidth
1.4 Definitions Bonded-PHY - A transmission mode where two MoCA 2.0 PHYs or two to five MoCA 2.5 PHYs are bonded
under control by a single MAC.
Flat Channel – A MoCA channel with power magnitude variation of less than 4.5 dB and group-delay variation
of less than 2 ns across any MoCA channel with no added noise, interference, or multipath.
Copyright © 2015, 2016 MoCA Alliance Page 7 of 40
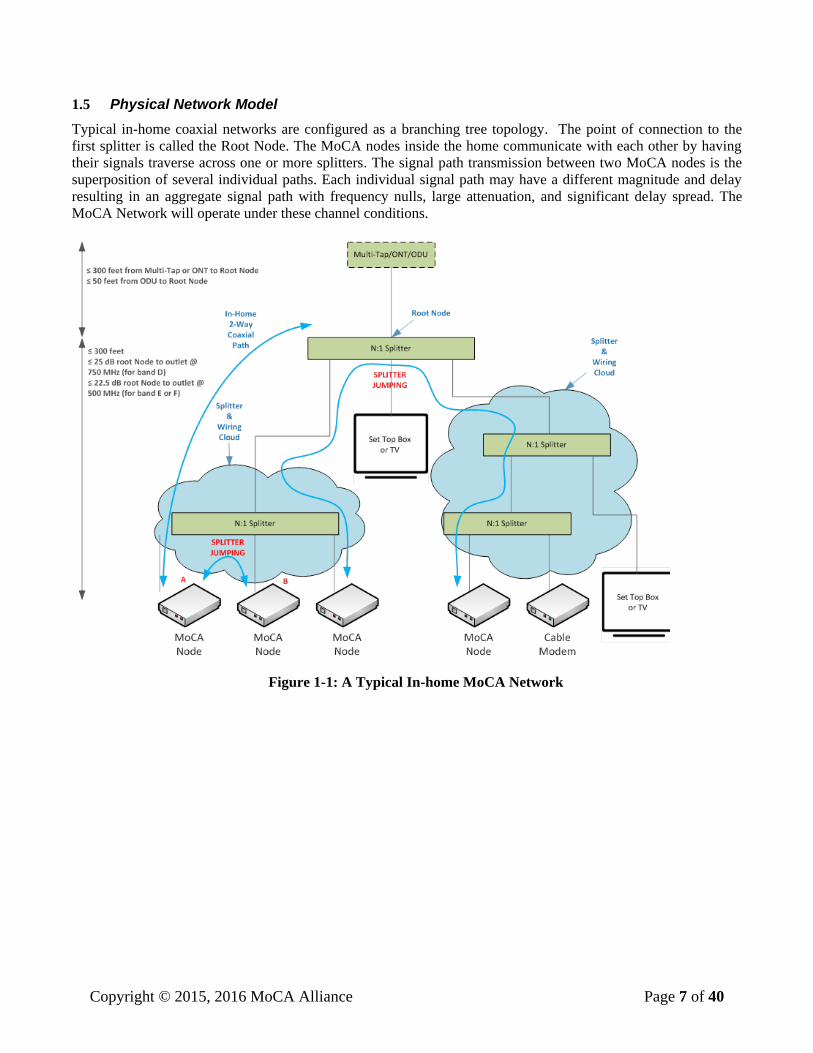
1.5 Physical Network Model
Typical in-home coaxial networks are configured as a branching tree topology. The point of connection to the
first splitter is called the Root Node. The MoCA nodes inside the home communicate with each other by having
their signals traverse across one or more splitters. The signal path transmission between two MoCA nodes is the
superposition of several individual paths. Each individual signal path may have a different magnitude and delay
resulting in an aggregate signal path with frequency nulls, large attenuation, and significant delay spread. The
MoCA Network will operate under these channel conditions.
Figure 1-1: A Typical In-home MoCA Network
Copyright © 2015, 2016 MoCA Alliance Page 8 of 40
2 MoCA 2.0 and MoCA 2.5 Reference Specification
2.1 MoCA Frequency Plan
The following subsections define the bands of operation supported by the MoCA specification.
The specified requirements are referenced at the F-connector at the output of any filter required by the device for
proper operation. A minimum network isolation of 9 dB (5 dB minimum splitter isolation + 4 dB minimum cable
loss, representing a worst case condition) is assumed between the F-connector of MoCA 2.0 device and any other
device on the network.
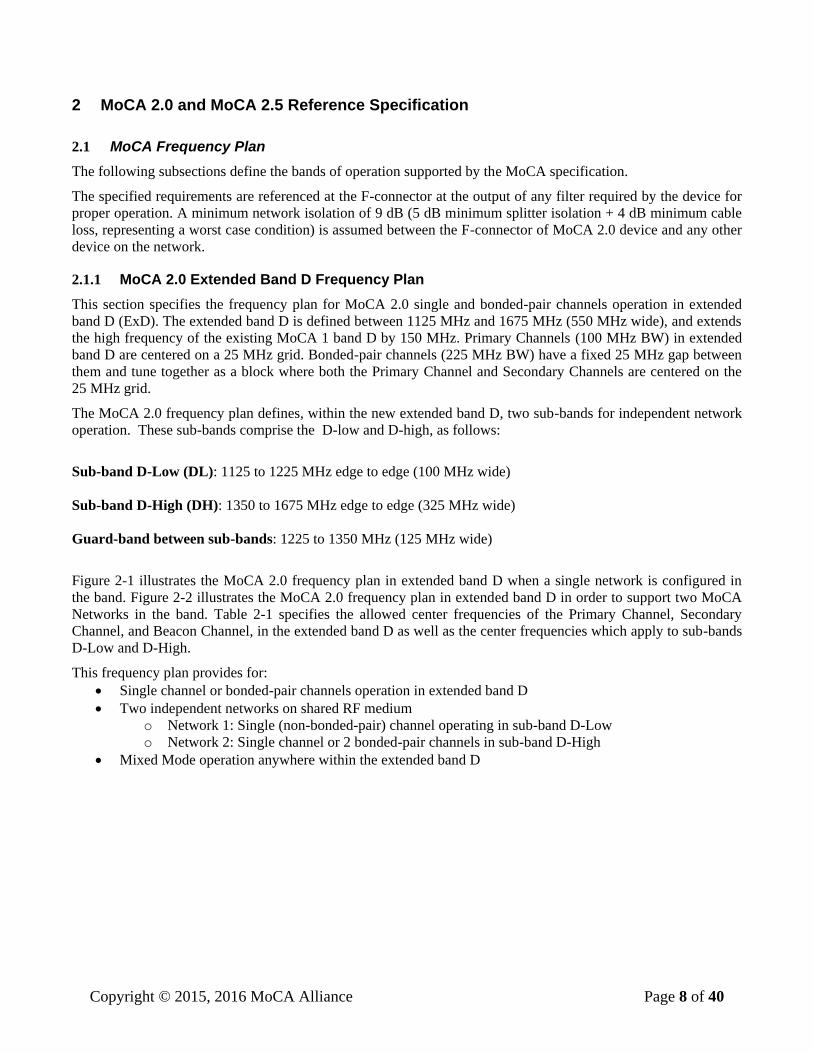
2.1.1 MoCA 2.0 Extended Band D Frequency Plan
This section specifies the frequency plan for MoCA 2.0 single and bonded-pair channels operation in extended
band D (ExD). The extended band D is defined between 1125 MHz and 1675 MHz (550 MHz wide), and extends
the high frequency of the existing MoCA 1 band D by 150 MHz. Primary Channels (100 MHz BW) in extended
band D are centered on a 25 MHz grid. Bonded-pair channels (225 MHz BW) have a fixed 25 MHz gap between
them and tune together as a block where both the Primary Channel and Secondary Channels are centered on the
25 MHz grid.
The MoCA 2.0 frequency plan defines, within the new extended band D, two sub-bands for independent network
operation. These sub-bands comprise the D-low and D-high, as follows:
Sub-band D-Low (DL): 1125 to 1225 MHz edge to edge (100 MHz wide)
Sub-band D-High (DH): 1350 to 1675 MHz edge to edge (325 MHz wide)
Guard-band between sub-bands: 1225 to 1350 MHz (125 MHz wide)
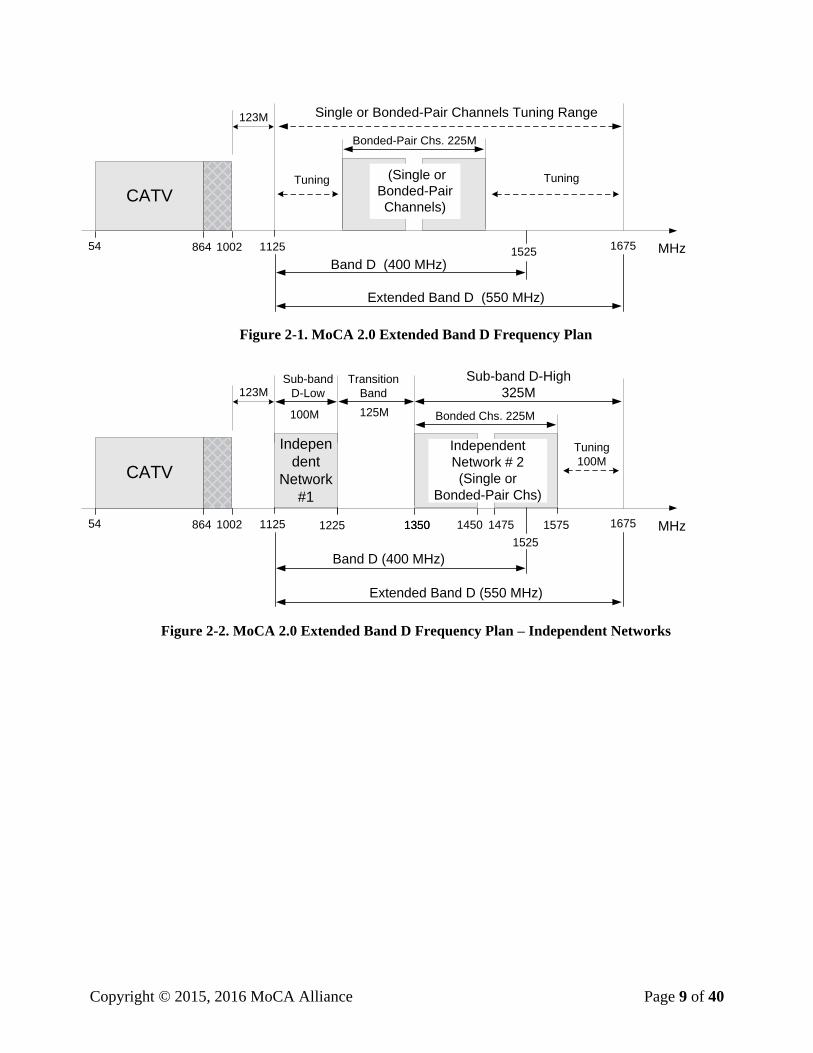
Figure 2-1 illustrates the MoCA 2.0 frequency plan in extended band D when a single network is configured in
the band. Figure 2-2 illustrates the MoCA 2.0 frequency plan in extended band D in order to support two MoCA
Networks in the band. Table 2-1 specifies the allowed center frequencies of the Primary Channel, Secondary
Channel, and Beacon Channel, in the extended band D as well as the center frequencies which apply to sub-bands
D-Low and D-High.
This frequency plan provides for:
Single channel or bonded-pair channels operation in extended band D
Two independent networks on shared RF medium
o Network 1: Single (non-bonded-pair) channel operating in sub-band D-Low
o Network 2: Single channel or 2 bonded-pair channels in sub-band D-High
Mixed Mode operation anywhere within the extended band D
Copyright © 2015, 2016 MoCA Alliance Page 9 of 40
MHz54 1002 1125
123M
CATV
864
Band D (400 MHz)1525
Extended Band D (550 MHz)
Bonded-Pair Chs. 225M
1675
Tuning (Single or
Bonded-Pair
Channels)
Single or Bonded-Pair Channels Tuning Range
Tuning
Figure 2-1. MoCA 2.0 Extended Band D Frequency Plan
MHz54 1002 1125
123M
CATV
864 1225 15751475
Band D (400 MHz)
1525
Extended Band D (550 MHz)
1350 14501350
Sub-band D-High
325M
Indepen
dent
Network
#1
100M Bonded Chs. 225M125M
Sub-band
D-Low
Transition
Band
1675
Tuning
100M
Independent
Network # 2
(Single or
Bonded-Pair Chs)
Figure 2-2. MoCA 2.0 Extended Band D Frequency Plan – Independent Networks
Copyright © 2015, 2016 MoCA Alliance Page 10 of 40
Table 2-1. Extended Band D Channel Frequencies
Frequency
[MHz]
Channel
#
MoCA 1.1
Channels
MoCA 2.0
Primary
Channels
MoCA 2.0
Secondary
Channels
Beacon
Channels
D-Low /
D-High
1150 D1 D-Low
1175 D1a D-Low
1200 D2 D-Low
1225 D2a
1250 D3
1275 D3a
1300 D4
1325 D4a
1350 D5
1375 D5a
1400 D6 D-High
1425 D6a D-High
1450 D7 D-High
1475 D7a D-High
1500 D8 D-High
1525 D8a D-High
1550 D9 D-High
1575 D9a D-High
1600 D10 D-High
1625 D10a D-High
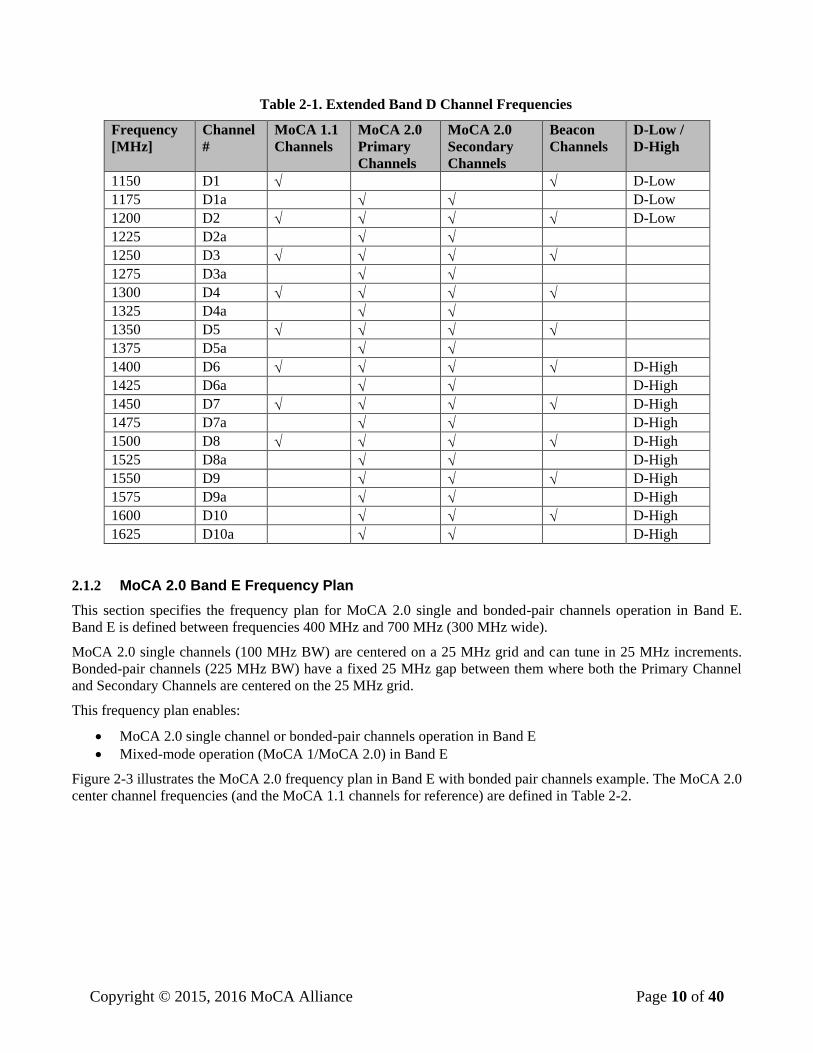
2.1.2 MoCA 2.0 Band E Frequency Plan
This section specifies the frequency plan for MoCA 2.0 single and bonded-pair channels operation in Band E.
Band E is defined between frequencies 400 MHz and 700 MHz (300 MHz wide).
MoCA 2.0 single channels (100 MHz BW) are centered on a 25 MHz grid and can tune in 25 MHz increments.
Bonded-pair channels (225 MHz BW) have a fixed 25 MHz gap between them where both the Primary Channel
and Secondary Channels are centered on the 25 MHz grid.
This frequency plan enables:
MoCA 2.0 single channel or bonded-pair channels operation in Band E
Mixed-mode operation (MoCA 1/MoCA 2.0) in Band E
Figure 2-3 illustrates the MoCA 2.0 frequency plan in Band E with bonded pair channels example. The MoCA 2.0
center channel frequencies (and the MoCA 1.1 channels for reference) are defined in Table 2-2.

Copyright © 2015, 2016 MoCA Alliance Page 11 of 40
MHz
400
Satellite Band
2150700 950
Band E (300 MHz wide)
(Single ch or
Bonded pair)Tuning Tuning
Figure 2-3. MoCA 2.0 Band E Frequency Plan with Single or Bonded-Pair Channels Example
Table 2-2. Band E Channel Frequencies
Center
Frequency
[MHz]
Channel
#
MoCA 1.1
Channels
MoCA 2.0
Primary
Channels
MoCA 2.0
Secondary
Channels
Beacon
Channels
450 EE1
475 EE2
500 E1
525 E2
550 E3
575 E4
600 E5
625 EE3
650 EE4
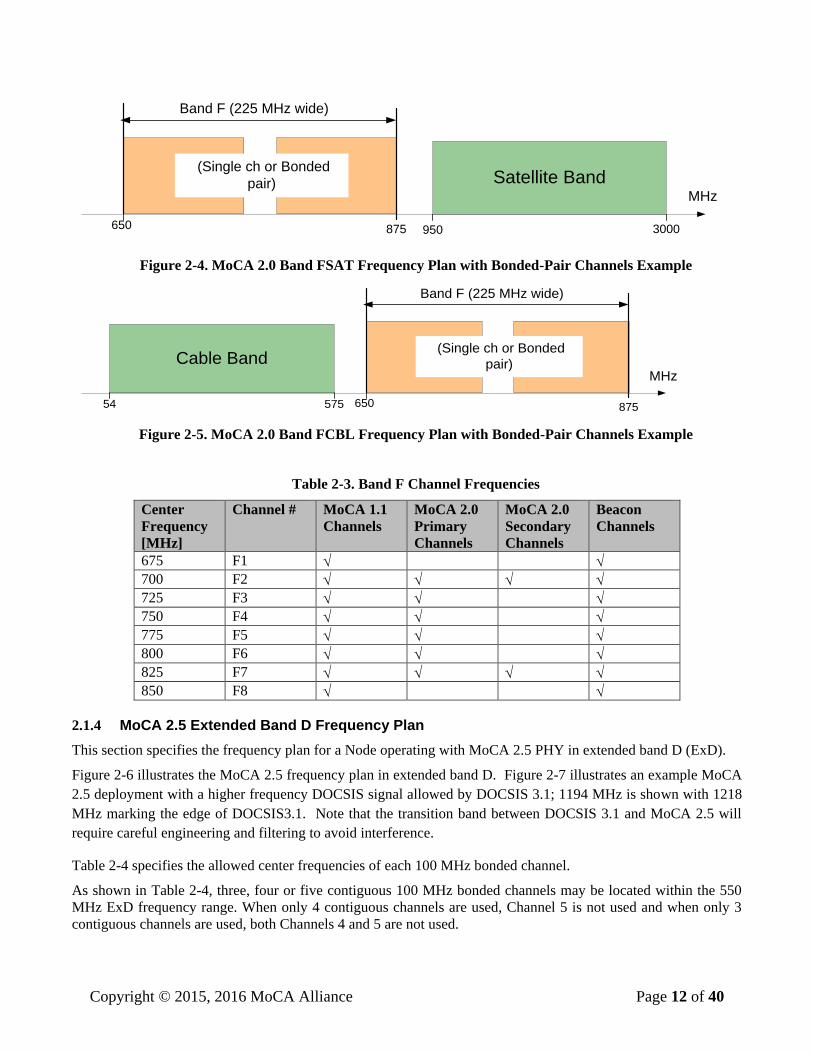
2.1.3 MoCA 2.0 Band F Frequency Plan
This section specifies the frequency plan for MoCA 2.0 single and bonded-pair channels operation in Band F. The
Band F is defined between frequencies 650 MHz and 875 MHz (225 MHz wide). This band comprises of two
bands FSAT and FCBL, both having the same channel plan but differ in some of the other requirements. For the
purpose of this specification, whenever a requirement refers to band F the requirement applies to both FSAT and
FCBL. All requirements which are specific to one of the two bands will indicate the specific band to which they
apply.
MoCA 2.0 single channels (100 MHz BW) are centered on a 25 MHz grid and can tune in 25 MHz increments.
Bonded-pair channels (225 MHz BW) have a fixed 25 MHz gap between them where both the primary channel
and secondary channels are centered on the 25 MHz grid.
This frequency plan enables:
MoCA 2.0 single channel or bonded-pair channels operation in Band F
Mixed-mode operation (MoCA 1/MoCA 2.0) in Band F
Figure 2-4 and Figure 2-5 illustrate the MoCA 2.0 frequency plan in bands FSAT and FCBL respectfully with
bonded pair channels example. The band F MoCA 2.0 center channel frequencies (and the MoCA 1.1 channels
for reference) are defined in Table 2-3.
Copyright © 2015, 2016 MoCA Alliance Page 12 of 40
MHz
650
Satellite Band
3000875 950
Band F (225 MHz wide)
(Single ch or Bonded
pair)
Figure 2-4. MoCA 2.0 Band FSAT Frequency Plan with Bonded-Pair Channels Example
MHz
650
Cable Band
575 87554
Band F (225 MHz wide)
(Single ch or Bonded
pair)
Figure 2-5. MoCA 2.0 Band FCBL Frequency Plan with Bonded-Pair Channels Example
Table 2-3. Band F Channel Frequencies
Center
Frequency
[MHz]
Channel # MoCA 1.1
Channels MoCA 2.0
Primary
Channels
MoCA 2.0
Secondary
Channels
Beacon
Channels
675 F1
700 F2
725 F3
750 F4
775 F5
800 F6
825 F7
850 F8
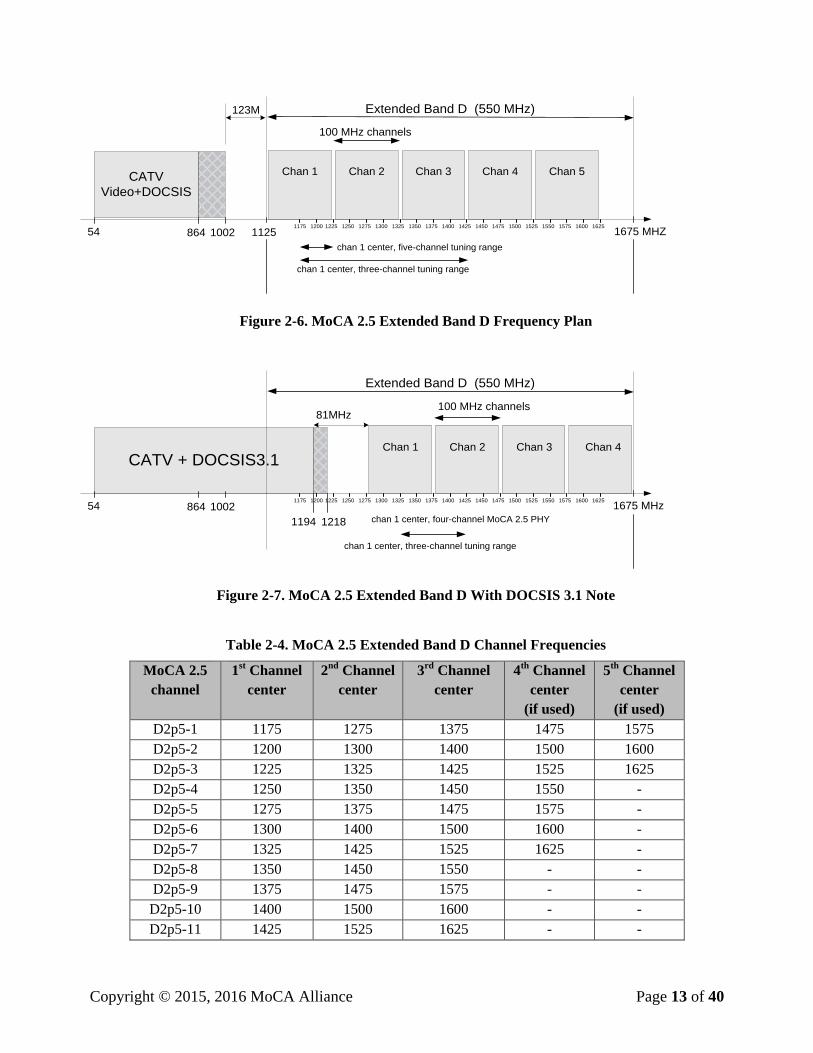
2.1.4 MoCA 2.5 Extended Band D Frequency Plan
This section specifies the frequency plan for a Node operating with MoCA 2.5 PHY in extended band D (ExD).
Figure 2-6 illustrates the MoCA 2.5 frequency plan in extended band D. Figure 2-7 illustrates an example MoCA
2.5 deployment with a higher frequency DOCSIS signal allowed by DOCSIS 3.1; 1194 MHz is shown with 1218
MHz marking the edge of DOCSIS3.1. Note that the transition band between DOCSIS 3.1 and MoCA 2.5 will
require careful engineering and filtering to avoid interference.
Table 2-4 specifies the allowed center frequencies of each 100 MHz bonded channel.
As shown in Table 2-4, three, four or five contiguous 100 MHz bonded channels may be located within the 550
MHz ExD frequency range. When only 4 contiguous channels are used, Channel 5 is not used and when only 3
contiguous channels are used, both Channels 4 and 5 are not used.
Copyright © 2015, 2016 MoCA Alliance Page 13 of 40
54 1002 1125
123M
CATV
Video+DOCSIS
864
Extended Band D (550 MHz)
100 MHz channels
1675 MHZ
Chan 1 Chan 2 Chan 3 Chan 4 Chan 5
1200 1225 1250 1275 1300 1325 1350 1375 1400 1425 1450 1475 1500 1525 1550 1575 1600 16251175
chan 1 center, five-channel tuning range
chan 1 center, three-channel tuning range
Figure 2-6. MoCA 2.5 Extended Band D Frequency Plan
54 1002
1218
81MHz
CATV + DOCSIS3.1
864
Extended Band D (550 MHz)
100 MHz channels
1675 MHz
Chan 1 Chan 2 Chan 3 Chan 4
1200 1225 1250 1275 1300 1325 1350 1375 1400 1425 1450 1475 1500 1525 1550 1575 1600 16251175
chan 1 center, four-channel MoCA 2.5 PHY
chan 1 center, three-channel tuning range
1194
Figure 2-7. MoCA 2.5 Extended Band D With DOCSIS 3.1 Note
Table 2-4. MoCA 2.5 Extended Band D Channel Frequencies
MoCA 2.5
channel
1st Channel
center
2nd
Channel
center
3rd
Channel
center
4th
Channel
center
(if used)
5th
Channel
center
(if used)
D2p5-1 1175 1275 1375 1475 1575
D2p5-2 1200 1300 1400 1500 1600
D2p5-3 1225 1325 1425 1525 1625
D2p5-4 1250 1350 1450 1550 -
D2p5-5 1275 1375 1475 1575 -
D2p5-6 1300 1400 1500 1600 -
D2p5-7 1325 1425 1525 1625 -
D2p5-8 1350 1450 1550 - -
D2p5-9 1375 1475 1575 - -
D2p5-10 1400 1500 1600 - -
D2p5-11 1425 1525 1625 - -
Copyright © 2015, 2016 MoCA Alliance Page 14 of 40
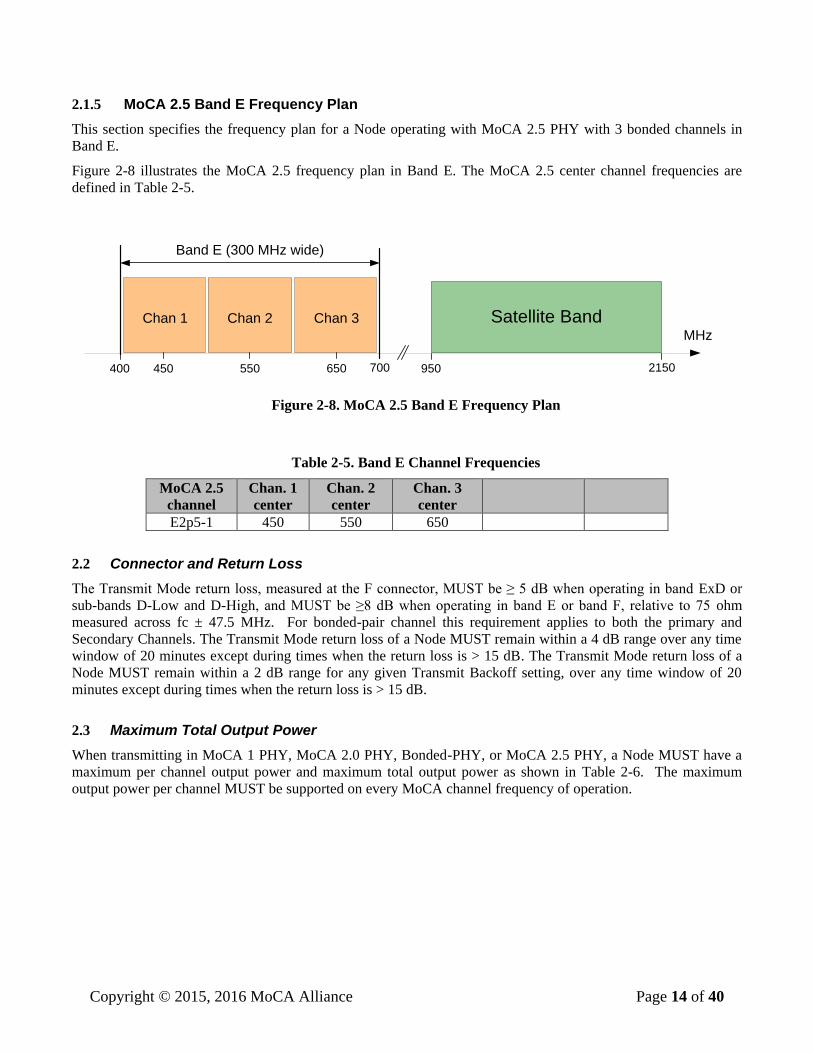
2.1.5 MoCA 2.5 Band E Frequency Plan
This section specifies the frequency plan for a Node operating with MoCA 2.5 PHY with 3 bonded channels in
Band E.
Figure 2-8 illustrates the MoCA 2.5 frequency plan in Band E. The MoCA 2.5 center channel frequencies are
defined in Table 2-5.
MHz
400
Satellite Band
2150700 950
Band E (300 MHz wide)
450 550 650
Chan 1 Chan 2 Chan 3
Figure 2-8. MoCA 2.5 Band E Frequency Plan
Table 2-5. Band E Channel Frequencies
MoCA 2.5
channel
Chan. 1
center
Chan. 2
center
Chan. 3
center
E2p5-1 450 550 650
2.2 Connector and Return Loss
The Transmit Mode return loss, measured at the F connector, MUST be ≥ 5 dB when operating in band ExD or
sub-bands D-Low and D-High, and MUST be ≥8 dB when operating in band E or band F, relative to 75 ohm
measured across fc ± 47.5 MHz. For bonded-pair channel this requirement applies to both the primary and
Secondary Channels. The Transmit Mode return loss of a Node MUST remain within a 4 dB range over any time
window of 20 minutes except during times when the return loss is > 15 dB. The Transmit Mode return loss of a
Node MUST remain within a 2 dB range for any given Transmit Backoff setting, over any time window of 20
minutes except during times when the return loss is > 15 dB.
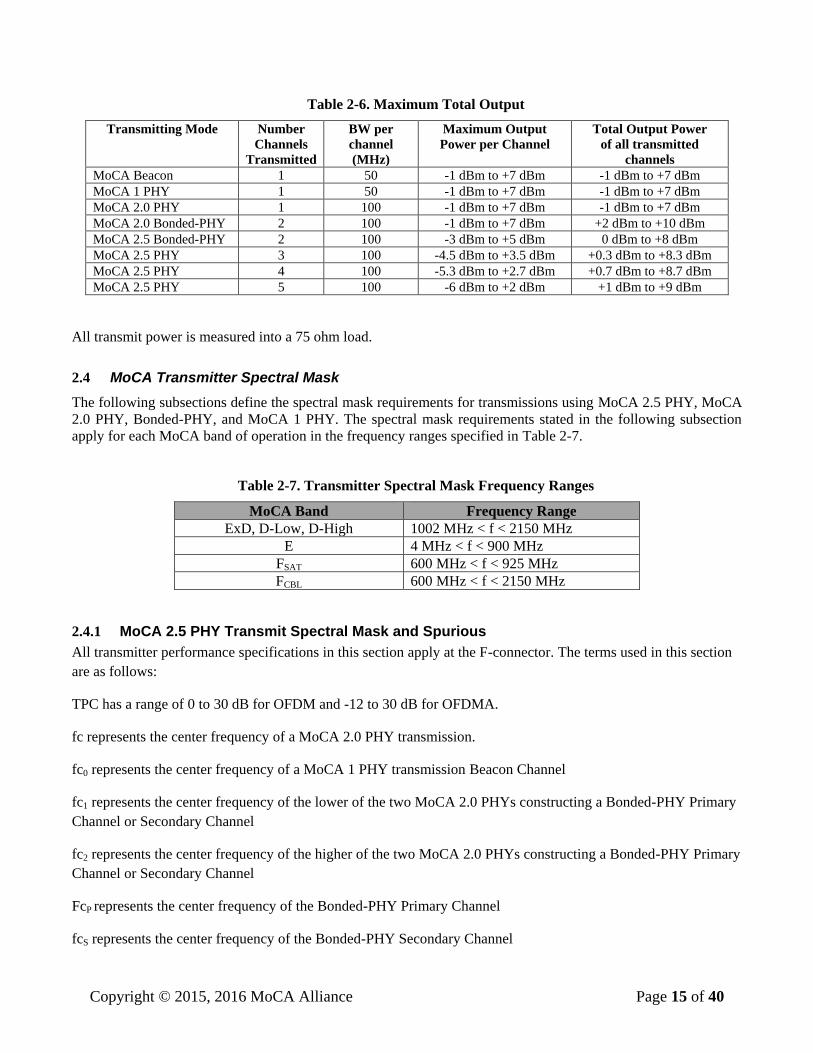
2.3 Maximum Total Output Power
When transmitting in MoCA 1 PHY, MoCA 2.0 PHY, Bonded-PHY, or MoCA 2.5 PHY, a Node MUST have a
maximum per channel output power and maximum total output power as shown in Table 2-6. The maximum
output power per channel MUST be supported on every MoCA channel frequency of operation.
Copyright © 2015, 2016 MoCA Alliance Page 15 of 40
Table 2-6. Maximum Total Output
Transmitting Mode Number
Channels
Transmitted
BW per
channel
(MHz)
Maximum Output
Power per Channel
Total Output Power
of all transmitted
channels
MoCA Beacon 1 50 -1 dBm to +7 dBm -1 dBm to +7 dBm
MoCA 1 PHY 1 50 -1 dBm to +7 dBm -1 dBm to +7 dBm
MoCA 2.0 PHY 1 100 -1 dBm to +7 dBm -1 dBm to +7 dBm
MoCA 2.0 Bonded-PHY 2 100 -1 dBm to +7 dBm +2 dBm to +10 dBm
MoCA 2.5 Bonded-PHY 2 100 -3 dBm to +5 dBm 0 dBm to +8 dBm
MoCA 2.5 PHY 3 100 -4.5 dBm to +3.5 dBm +0.3 dBm to +8.3 dBm
MoCA 2.5 PHY 4 100 -5.3 dBm to +2.7 dBm +0.7 dBm to +8.7 dBm
MoCA 2.5 PHY 5 100 -6 dBm to +2 dBm +1 dBm to +9 dBm
All transmit power is measured into a 75 ohm load.
2.4 MoCA Transmitter Spectral Mask
The following subsections define the spectral mask requirements for transmissions using MoCA 2.5 PHY, MoCA
2.0 PHY, Bonded-PHY, and MoCA 1 PHY. The spectral mask requirements stated in the following subsection
apply for each MoCA band of operation in the frequency ranges specified in Table 2-7.
Table 2-7. Transmitter Spectral Mask Frequency Ranges
MoCA Band Frequency Range
ExD, D-Low, D-High 1002 MHz < f < 2150 MHz
E 4 MHz < f < 900 MHz
FSAT 600 MHz < f < 925 MHz
FCBL 600 MHz < f < 2150 MHz
2.4.1 MoCA 2.5 PHY Transmit Spectral Mask and Spurious
All transmitter performance specifications in this section apply at the F-connector. The terms used in this section
are as follows:
TPC has a range of 0 to 30 dB for OFDM and -12 to 30 dB for OFDMA.
fc represents the center frequency of a MoCA 2.0 PHY transmission.
fc0 represents the center frequency of a MoCA 1 PHY transmission Beacon Channel
fc1 represents the center frequency of the lower of the two MoCA 2.0 PHYs constructing a Bonded-PHY Primary
Channel or Secondary Channel
fc2 represents the center frequency of the higher of the two MoCA 2.0 PHYs constructing a Bonded-PHY Primary
Channel or Secondary Channel
FcP represents the center frequency of the Bonded-PHY Primary Channel
fcS represents the center frequency of the Bonded-PHY Secondary Channel
Copyright © 2015, 2016 MoCA Alliance Page 16 of 40
fcmin and fcmax are defined as follows:
If MoCA 2.5 PHY transmissions are used between any nodes in the MoCA network:
fcmin = center frequency of the First Channel
fcmax = center frequency of the highest used channel, either Third Channel, Fourth Channel, or Fifth
Channel
If MoCA 2.5 PHY transmissions are not used between any nodes and Bonded_PHY transmissions are used
between any nodes in the MoCA network:
fcmin = fc1
fcmax = fc2
If MoCA 2.5 PHY and Bonded_PHY transmissions are not used between any nodes in the network and MoCA
2.0 PHY is used between any nodes in the MoCA network:
fcmin = fcmax = fc
If only MoCA 1 PHY is used between all nodes in the MoCA network:
fcmin = fc0 + 20 MHz
fcmax = fc0 – 20 MHz
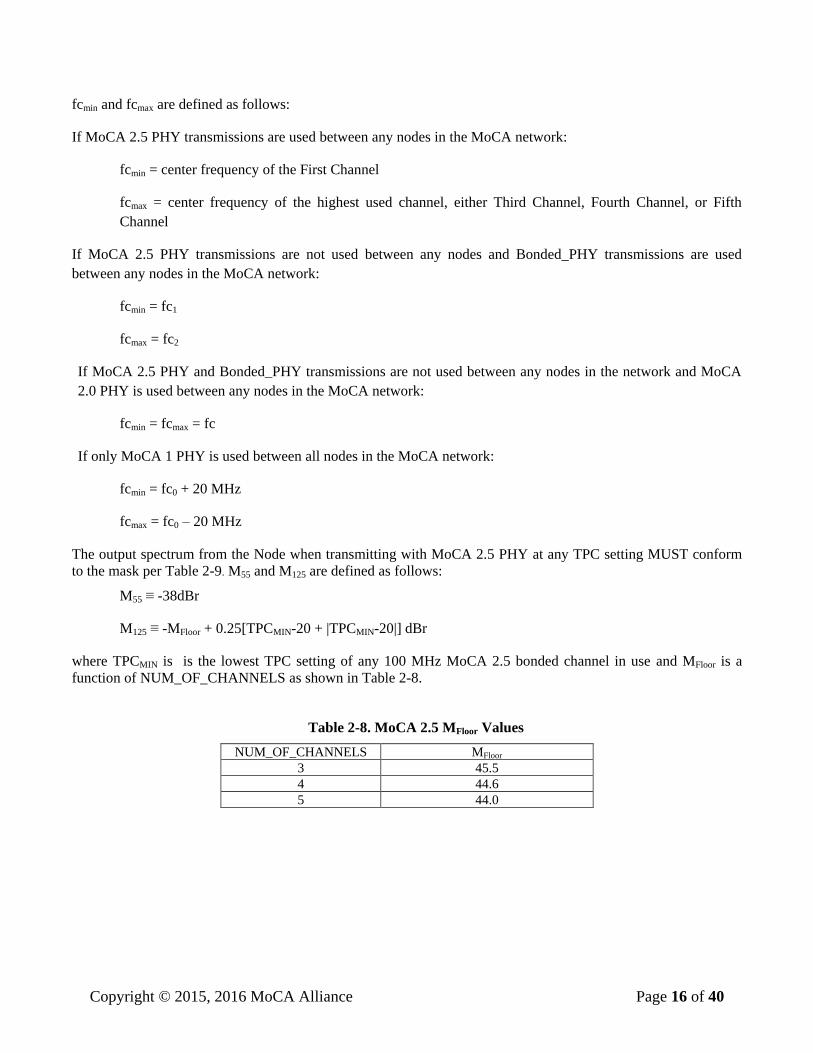
The output spectrum from the Node when transmitting with MoCA 2.5 PHY at any TPC setting MUST conform
to the mask per Table 2-9. M55 and M125 are defined as follows:
M55 ≡ -38dBr
M125 ≡ -MFloor + 0.25[TPCMIN-20 + |TPCMIN-20|] dBr
where TPCMIN is is the lowest TPC setting of any 100 MHz MoCA 2.5 bonded channel in use and MFloor is a
function of NUM_OF_CHANNELS as shown in Table 2-8.
Table 2-8. MoCA 2.5 MFloor Values
NUM_OF_CHANNELS MFloor
3 45.5
4 44.6
5 44.0

Copyright © 2015, 2016 MoCA Alliance Page 17 of 40
Table 2-9. Transmitter Spectral Mask for TPC Settings of 0 to 30
Frequency Range Output
fcmin 50 MHz ≤ f ≤ fcmax + 50 MHz < 0 dBr
fcmin 55 MHz ≤ f ≤ fcmin 50 MHz Linear slope from M55to -20 dBr
fcmax + 50 MHz ≤ f ≤ fcmax + 55 MHz Linear slope from -20 dBr to M55
fcmin 125 MHz ≤ f ≤ fcmin 55 MHz Linear slope from M125 to M55
fcmax + 55 MHz ≤ f ≤ fcmax + 125 MHz Linear slope from M55 to M125
f< fcmin 125 MHz ≤ M125
f>fcmax + 125 MHz ≤ M125
In addition to the requirements in Table 2-9, the output spectrum from the Node when TPC is the same on each
channel MUST conform to the mask in Table 2-10.
Table 2-10. Transmitter Spectral Mask with the same TPC on each channel
Frequency Range Output
fcmin 47 MHz ≤ f ≤ fcmax + 47 MHz 5 dBr to 0 dBr *
* For any unused subcarrier, the lower bound is not applicable and the output MUST be ≤ 0 dBr.
Figure 2-9 illustrates the required spectrum when the same TPC is set on each channel, for TPC settings of 0 to
20.
fcmin fcmin+100 fcmax
-50
-20 dBr
-55-125
0 dBr
M55 dBrM125 dBr
+55+50
0+125
-5 dBr
-47 +47fcmin+200 fcmin+300
Figure 2-9. MoCA 2.5 Transmit Spectral Mask with the same TPC each channel, (for TPC Settings of 0 to 20)
When a transmitter is turned on for transmission in MoCA 2.5 PHY mode and PHY-frames are not yet being
transmitted, in each of the 100 MHz bonded channels the transmitted output power MUST be less than -39 dBc
relative to the transmitted power when the ACMT carriers are turned-on except for the allowed spurious in Table
2-11.
When a transmitter is turned on for transmission in MoCA 2.5 PHY mode and PHY-frames are being transmitted
the transmitter output MUST not have any spurious output except for the allowed spurious in Table 2-11.
Copyright © 2015, 2016 MoCA Alliance Page 18 of 40
Table 2-11. Allowed Spurious when Transmitting
Frequency Range Maximum Value Notes
At all f = k×50MHz
Where k is any integer > 1
-80 dBm Spurious allowed at every
frequency
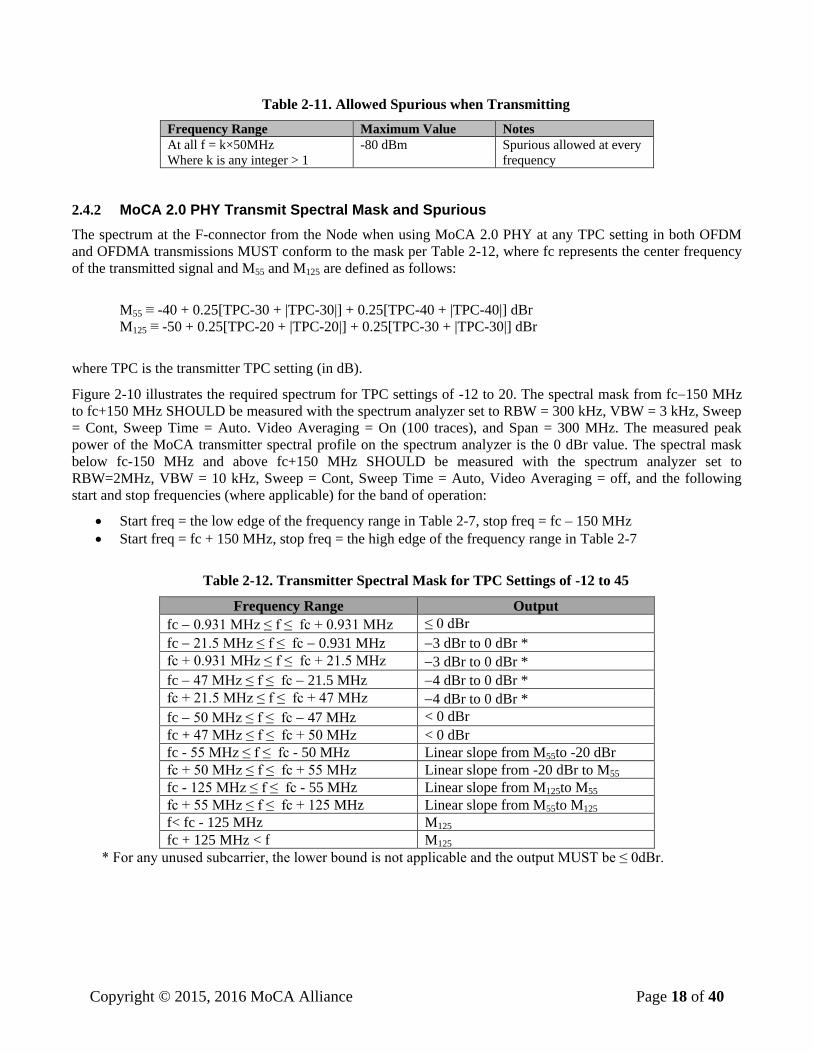
2.4.2 MoCA 2.0 PHY Transmit Spectral Mask and Spurious
The spectrum at the F-connector from the Node when using MoCA 2.0 PHY at any TPC setting in both OFDM
and OFDMA transmissions MUST conform to the mask per Table 2-12, where fc represents the center frequency
of the transmitted signal and M55 and M125 are defined as follows:
M55 ≡ -40 + 0.25[TPC-30 + |TPC-30|] + 0.25[TPC-40 + |TPC-40|] dBr
M125 ≡ -50 + 0.25[TPC-20 + |TPC-20|] + 0.25[TPC-30 + |TPC-30|] dBr
where TPC is the transmitter TPC setting (in dB).
Figure 2-10 illustrates the required spectrum for TPC settings of -12 to 20. The spectral mask from fc150 MHz
to fc+150 MHz SHOULD be measured with the spectrum analyzer set to RBW = 300 kHz, VBW = 3 kHz, Sweep
= Cont, Sweep Time = Auto. Video Averaging = On (100 traces), and Span = 300 MHz. The measured peak
power of the MoCA transmitter spectral profile on the spectrum analyzer is the 0 dBr value. The spectral mask
below fc-150 MHz and above fc+150 MHz SHOULD be measured with the spectrum analyzer set to
RBW=2MHz, VBW = 10 kHz, Sweep = Cont, Sweep Time = Auto, Video Averaging = off, and the following
start and stop frequencies (where applicable) for the band of operation:
Start freq = the low edge of the frequency range in Table 2-7, stop freq = fc – 150 MHz
Start freq = fc + 150 MHz, stop freq = the high edge of the frequency range in Table 2-7
Table 2-12. Transmitter Spectral Mask for TPC Settings of -12 to 45
Frequency Range Output
fc 0.931 MHz ≤ f ≤ fc + 0.931 MHz ≤ 0 dBr
fc 21.5 MHz ≤ f ≤ fc 0.931 MHz 3 dBr to 0 dBr *
fc + 0.931 MHz ≤ f ≤ fc + 21.5 MHz 3 dBr to 0 dBr *
fc 47 MHz ≤ f ≤ fc 21.5 MHz 4 dBr to 0 dBr *
fc + 21.5 MHz ≤ f ≤ fc + 47 MHz 4 dBr to 0 dBr *
fc 50 MHz ≤ f ≤ fc 47 MHz < 0 dBr
fc + 47 MHz ≤ f ≤ fc + 50 MHz < 0 dBr
fc - 55 MHz ≤ f ≤ fc - 50 MHz Linear slope from M55to -20 dBr
fc + 50 MHz ≤ f ≤ fc + 55 MHz Linear slope from -20 dBr to M55
fc - 125 MHz ≤ f ≤ fc - 55 MHz Linear slope from M125to M55
fc + 55 MHz ≤ f ≤ fc + 125 MHz Linear slope from M55to M125
f< fc - 125 MHz M125
fc + 125 MHz < f M125
* For any unused subcarrier, the lower bound is not applicable and the output MUST be ≤ 0dBr.

Copyright © 2015, 2016 MoCA Alliance Page 19 of 40
fc
0 dBr
- 40 dBr
50MHz
47-55 -47 21.5-21.5
- 50 dBr
55
-50
- 20 dBr
- 3 dBr
- 4 dBr
125-125
Figure 2-10. MoCA 2 –Transmit Spectral Mask (for TPC Settings of -12 to 20)
At 75 MHz offset from center (i.e. 25 MHz from the edge of the channel), the skirts of the mask are at
approximately -43 dBr, sufficiently low to allow the placement of the bonded-pair channel edge at that frequency,
as shown in Figure 2-11.
When a transmitter is turned on for transmission in MoCA 2.0 PHY mode and PHY-frames are not yet being
transmitted, the transmitted output power MUST be less than -39 dBc relative to the transmitted power when the
ACMT carriers are turned-on, excluding one of the following two spurious conditions:
A spurious at fc with relative power of less than -23 dBc relative to the transmitted power when the
ACMT carriers are turned-on
When SECONDARY_CHANNEL_OFFSET ≠ 0b00: A spurious at fc1+62.5 MHz with relative power of
less than -23 dBc relative to the transmitted power when the ACMT carriers are turned-on
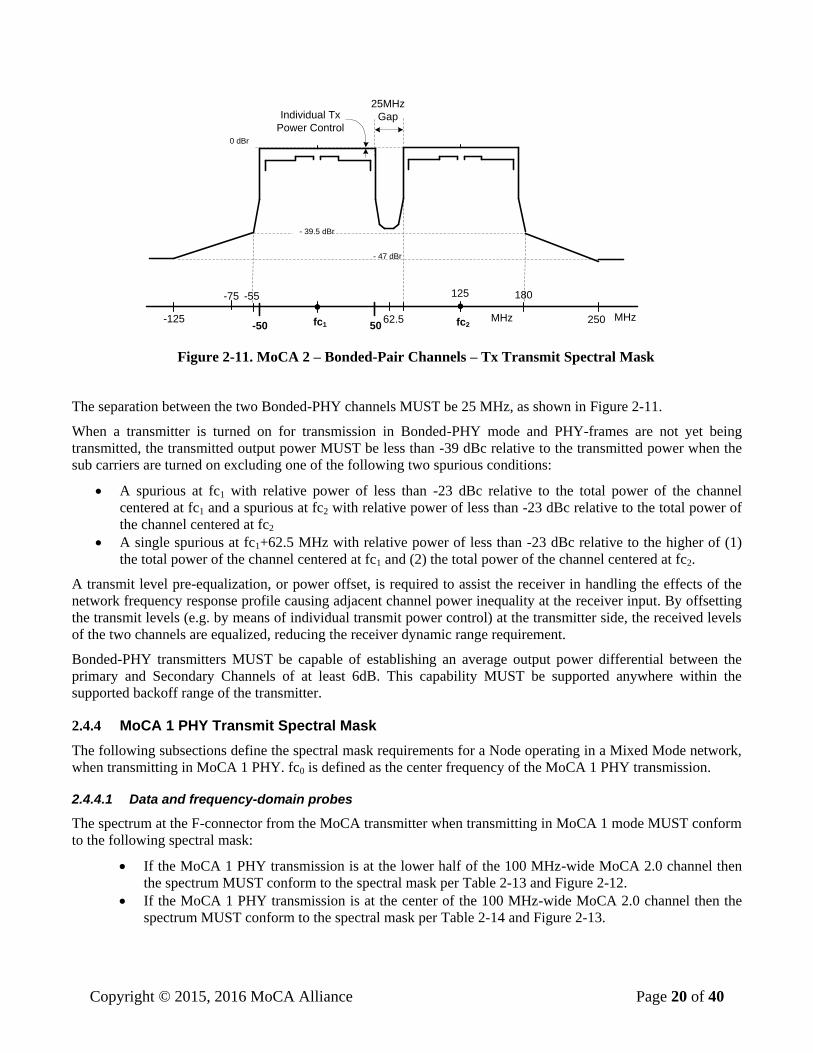
2.4.3 Bonded-PHY Transmit Spectral Mask
The spectrum at the F-connector from the Node when transmitting in Bonded-PHY MUST conform to the
specification in Section 2.4.2 as shown in Figure 2-10 for both the Primary Channel and Secondary Channel. The
combination of the spectral masks of the two Bonded-PHY channels when transmitting with the same TPC setting
is shown in Figure 2-11:
Copyright © 2015, 2016 MoCA Alliance Page 20 of 40
Individual Tx
Power Control
MHz
125
25MHz
Gap
0 dBr
fc2fc1
- 39.5 dBr
50MHz
-55
- 47 dBr
-50-125 62.5
-75
250
180
Figure 2-11. MoCA 2 – Bonded-Pair Channels – Tx Transmit Spectral Mask
The separation between the two Bonded-PHY channels MUST be 25 MHz, as shown in Figure 2-11.
When a transmitter is turned on for transmission in Bonded-PHY mode and PHY-frames are not yet being
transmitted, the transmitted output power MUST be less than -39 dBc relative to the transmitted power when the
sub carriers are turned on excluding one of the following two spurious conditions:
A spurious at fc1 with relative power of less than -23 dBc relative to the total power of the channel
centered at fc1 and a spurious at fc2 with relative power of less than -23 dBc relative to the total power of
the channel centered at fc2
A single spurious at fc1+62.5 MHz with relative power of less than -23 dBc relative to the higher of (1)
the total power of the channel centered at fc1 and (2) the total power of the channel centered at fc2.
A transmit level pre-equalization, or power offset, is required to assist the receiver in handling the effects of the
network frequency response profile causing adjacent channel power inequality at the receiver input. By offsetting
the transmit levels (e.g. by means of individual transmit power control) at the transmitter side, the received levels
of the two channels are equalized, reducing the receiver dynamic range requirement.
Bonded-PHY transmitters MUST be capable of establishing an average output power differential between the
primary and Secondary Channels of at least 6dB. This capability MUST be supported anywhere within the
supported backoff range of the transmitter.
2.4.4 MoCA 1 PHY Transmit Spectral Mask
The following subsections define the spectral mask requirements for a Node operating in a Mixed Mode network,
when transmitting in MoCA 1 PHY. fc0 is defined as the center frequency of the MoCA 1 PHY transmission.
2.4.4.1 Data and frequency-domain probes
The spectrum at the F-connector from the MoCA transmitter when transmitting in MoCA 1 mode MUST conform
to the following spectral mask:
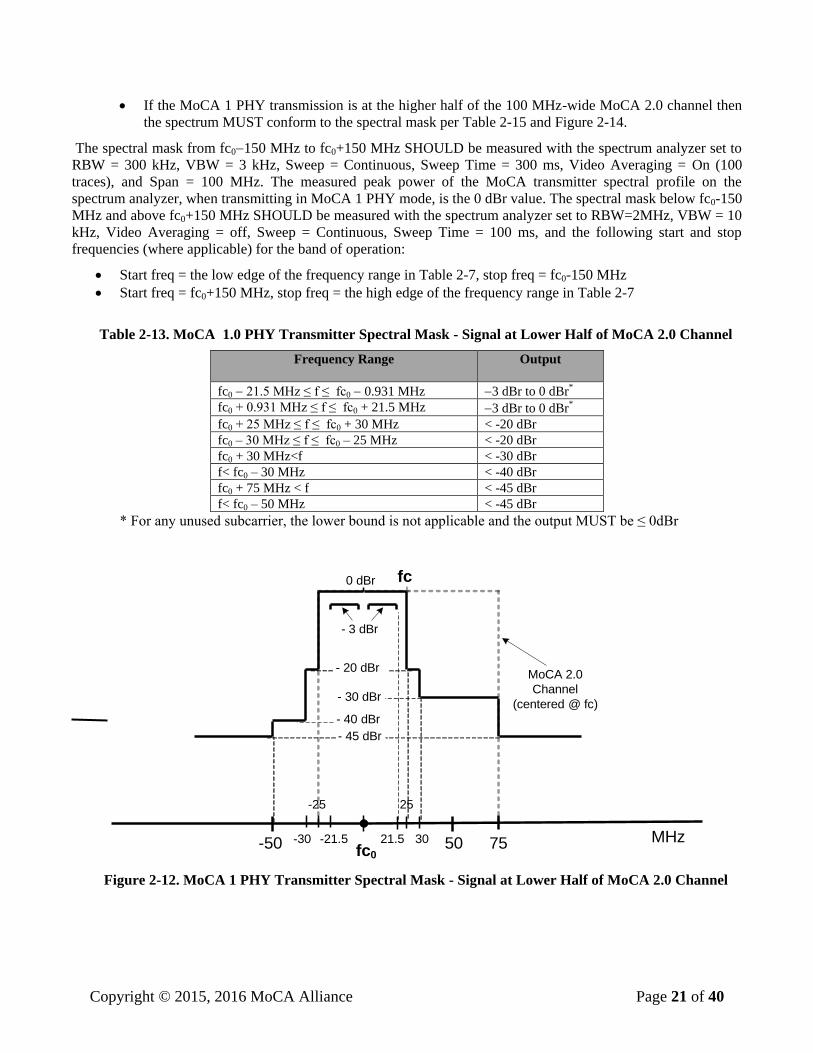
If the MoCA 1 PHY transmission is at the lower half of the 100 MHz-wide MoCA 2.0 channel then
the spectrum MUST conform to the spectral mask per Table 2-13 and Figure 2-12.
If the MoCA 1 PHY transmission is at the center of the 100 MHz-wide MoCA 2.0 channel then the
spectrum MUST conform to the spectral mask per Table 2-14 and Figure 2-13.
Copyright © 2015, 2016 MoCA Alliance Page 21 of 40
If the MoCA 1 PHY transmission is at the higher half of the 100 MHz-wide MoCA 2.0 channel then
the spectrum MUST conform to the spectral mask per Table 2-15 and Figure 2-14.
The spectral mask from fc0150 MHz to fc0+150 MHz SHOULD be measured with the spectrum analyzer set to
RBW = 300 kHz, VBW = 3 kHz, Sweep = Continuous, Sweep Time = 300 ms, Video Averaging = On (100
traces), and Span = 100 MHz. The measured peak power of the MoCA transmitter spectral profile on the
spectrum analyzer, when transmitting in MoCA 1 PHY mode, is the 0 dBr value. The spectral mask below fc0-150
MHz and above fc0+150 MHz SHOULD be measured with the spectrum analyzer set to RBW=2MHz, VBW = 10
kHz, Video Averaging = off, Sweep = Continuous, Sweep Time = 100 ms, and the following start and stop
frequencies (where applicable) for the band of operation:
Start freq = the low edge of the frequency range in Table 2-7, stop freq = fc0-150 MHz
Start freq = fc0+150 MHz, stop freq = the high edge of the frequency range in Table 2-7
Table 2-13. MoCA 1.0 PHY Transmitter Spectral Mask - Signal at Lower Half of MoCA 2.0 Channel
Frequency Range
Output
fc0 21.5 MHz ≤ f ≤ fc0 0.931 MHz 3 dBr to 0 dBr*
fc0 + 0.931 MHz ≤ f ≤ fc0 + 21.5 MHz 3 dBr to 0 dBr*
fc0 + 25 MHz ≤ f ≤ fc0 + 30 MHz < -20 dBr
fc0 – 30 MHz ≤ f ≤ fc0 – 25 MHz < -20 dBr
fc0 + 30 MHz<f < -30 dBr
f< fc0 – 30 MHz < -40 dBr
fc0 + 75 MHz < f < -45 dBr
f< fc0 – 50 MHz < -45 dBr
* For any unused subcarrier, the lower bound is not applicable and the output MUST be ≤ 0dBr
Figure 2-12. MoCA 1 PHY Transmitter Spectral Mask - Signal at Lower Half of MoCA 2.0 Channel
fc0
0 dBr
- 40 dBr
50 MHz21.5
- 45 dBr
25
- 20 dBr
- 3 dBr
30-30
-25
-21.5-50
fc
75
- 30 dBr
MoCA 2.0
Channel
(centered @ fc)
Copyright © 2015, 2016 MoCA Alliance Page 22 of 40
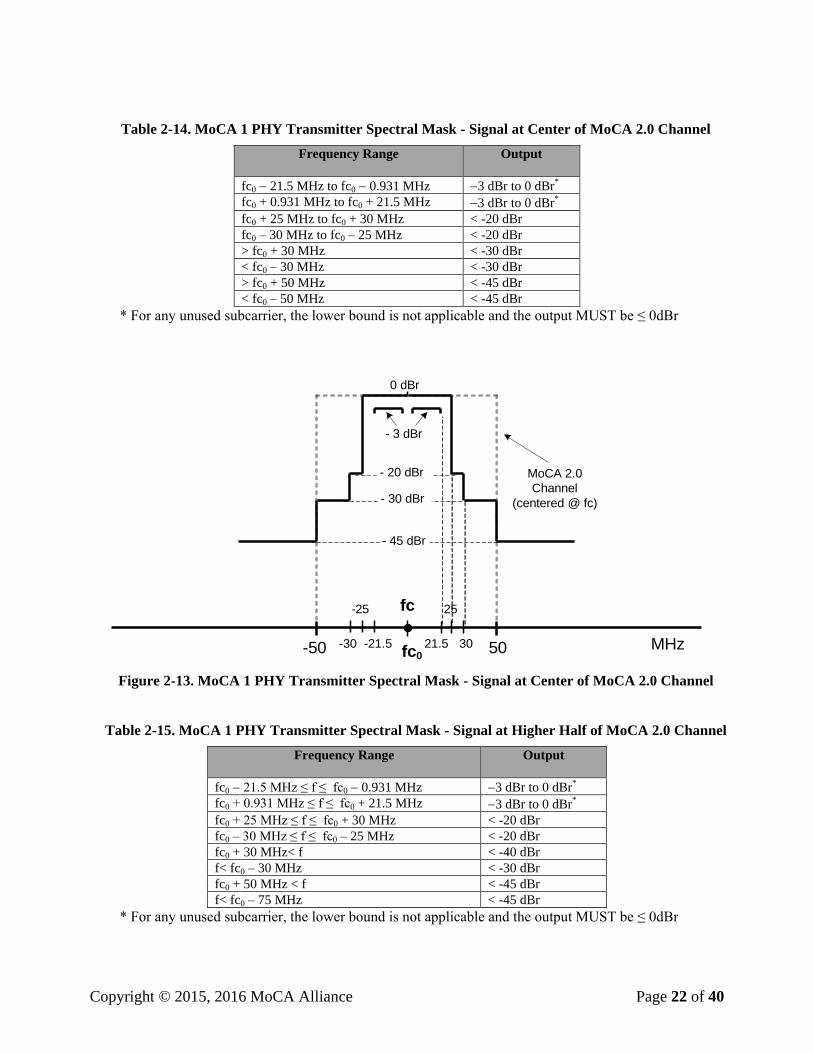
Table 2-14. MoCA 1 PHY Transmitter Spectral Mask - Signal at Center of MoCA 2.0 Channel
Frequency Range
Output
fc0 21.5 MHz to fc0 0.931 MHz 3 dBr to 0 dBr*
fc0 + 0.931 MHz to fc0 + 21.5 MHz 3 dBr to 0 dBr*
fc0 + 25 MHz to fc0 + 30 MHz < -20 dBr
fc0 – 30 MHz to fc0 – 25 MHz < -20 dBr
> fc0 + 30 MHz < -30 dBr
< fc0 – 30 MHz < -30 dBr
> fc0 + 50 MHz < -45 dBr
< fc0 – 50 MHz < -45 dBr
* For any unused subcarrier, the lower bound is not applicable and the output MUST be ≤ 0dBr
Figure 2-13. MoCA 1 PHY Transmitter Spectral Mask - Signal at Center of MoCA 2.0 Channel
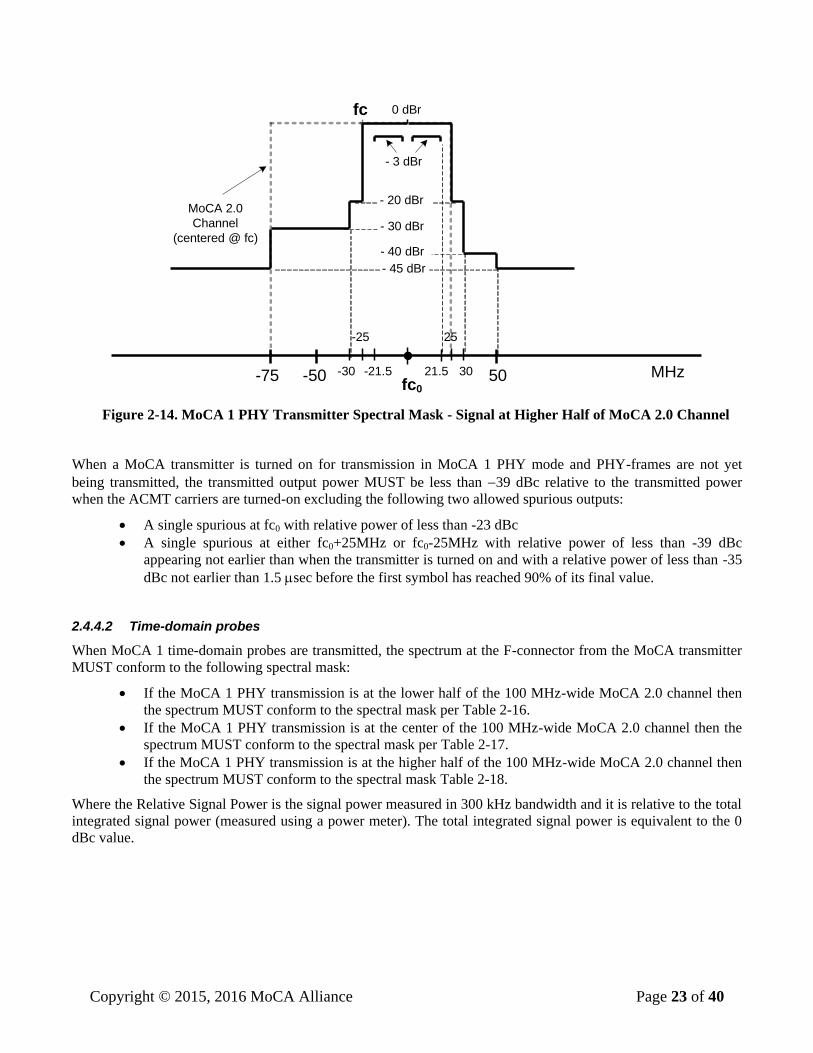
Table 2-15. MoCA 1 PHY Transmitter Spectral Mask - Signal at Higher Half of MoCA 2.0 Channel
Frequency Range
Output
fc0 21.5 MHz ≤ f ≤ fc0 0.931 MHz 3 dBr to 0 dBr*
fc0 + 0.931 MHz ≤ f ≤ fc0 + 21.5 MHz 3 dBr to 0 dBr*
fc0 + 25 MHz ≤ f ≤ fc0 + 30 MHz < -20 dBr
fc0 – 30 MHz ≤ f ≤ fc0 – 25 MHz < -20 dBr
fc0 + 30 MHz< f < -40 dBr
f< fc0 – 30 MHz < -30 dBr
fc0 + 50 MHz < f < -45 dBr
f< fc0 – 75 MHz < -45 dBr
* For any unused subcarrier, the lower bound is not applicable and the output MUST be ≤ 0dBr
fc0
0 dBr
- 30 dBr
50 MHz21.5
- 45 dBr
25
- 20 dBr
- 3 dBr
30-30
-25
-21.5-50
fc
MoCA 2.0
Channel
(centered @ fc)
Copyright © 2015, 2016 MoCA Alliance Page 23 of 40
Figure 2-14. MoCA 1 PHY Transmitter Spectral Mask - Signal at Higher Half of MoCA 2.0 Channel
When a MoCA transmitter is turned on for transmission in MoCA 1 PHY mode and PHY-frames are not yet
being transmitted, the transmitted output power MUST be less than 39 dBc relative to the transmitted power
when the ACMT carriers are turned-on excluding the following two allowed spurious outputs:
A single spurious at fc0 with relative power of less than -23 dBc
A single spurious at either fc0+25MHz or fc0-25MHz with relative power of less than -39 dBc
appearing not earlier than when the transmitter is turned on and with a relative power of less than -35
dBc not earlier than 1.5 sec before the first symbol has reached 90% of its final value.
2.4.4.2 Time-domain probes
When MoCA 1 time-domain probes are transmitted, the spectrum at the F-connector from the MoCA transmitter
MUST conform to the following spectral mask:
If the MoCA 1 PHY transmission is at the lower half of the 100 MHz-wide MoCA 2.0 channel then
the spectrum MUST conform to the spectral mask per Table 2-16.
If the MoCA 1 PHY transmission is at the center of the 100 MHz-wide MoCA 2.0 channel then the
spectrum MUST conform to the spectral mask per Table 2-17.
If the MoCA 1 PHY transmission is at the higher half of the 100 MHz-wide MoCA 2.0 channel then
the spectrum MUST conform to the spectral mask Table 2-18.
Where the Relative Signal Power is the signal power measured in 300 kHz bandwidth and it is relative to the total
integrated signal power (measured using a power meter). The total integrated signal power is equivalent to the 0
dBc value.
fc0
0 dBr
- 40 dBr
50 MHz21.5
- 45 dBr
25
- 20 dBr
- 3 dBr
30-30
-25
-21.5-50
fc
-75
- 30 dBr
MoCA 2.0
Channel
(centered @ fc)

Copyright © 2015, 2016 MoCA Alliance Page 24 of 40
Table 2-16. MoCA 1 PHY Transmitter Spectral Mask for Probe Signals - Signal at Lower Half of MoCA 2.0
Channel
Frequency Range Relative Signal Power
fc0 + 27 MHz< f < 43.8 dBc
f< fc0 27 MHz < 43.8 dBc
fc0 + 28 MHz< f < 51.8 dBc
f< fc0 28 MHz < 61.8 dBc
fc0 + 75 MHz< f < 66.8 dBc
f< fc0 50 MHz < 66.8 dBc
Table 2-17. MoCA 1 PHY Transmitter Spectral Mask for Probe Signals - Signal at Center of MoCA 2.0
Channel
Frequency Range Relative Signal Power
fc0 + 27 MHz< f < 43.8 dBc
f< fc0 27 MHz < 43.8 dBc
fc0 + 28 MHz< f < 51.8 dBc
f< fc0 28 MHz < 51.8 dBc
fc0 + 50 MHz< f < 66.8 dBc
f< fc0 50 MHz < 66.8 dBc
Table 2-18. MoCA 1 PHY Transmitter Spectral Mask for Probe Signals - Signal at Higher Half of MoCA 2.0
Channel
Frequency Range Relative Signal Power
fc0 + 27 MHz< f < 43.8 dBc
f< fc0 27 MHz < 43.8 dBc
fc0 + 28 MHz< f < 61.8 dBc
f< fc0 28 MHz < 51.8 dBc
fc0 + 50 MHz< f < 68.8 dBc
f< fc0 75 MHz < 68.8 dBc
2.5 MoCA 2.0 RF Mode Transmitter Spurious Output
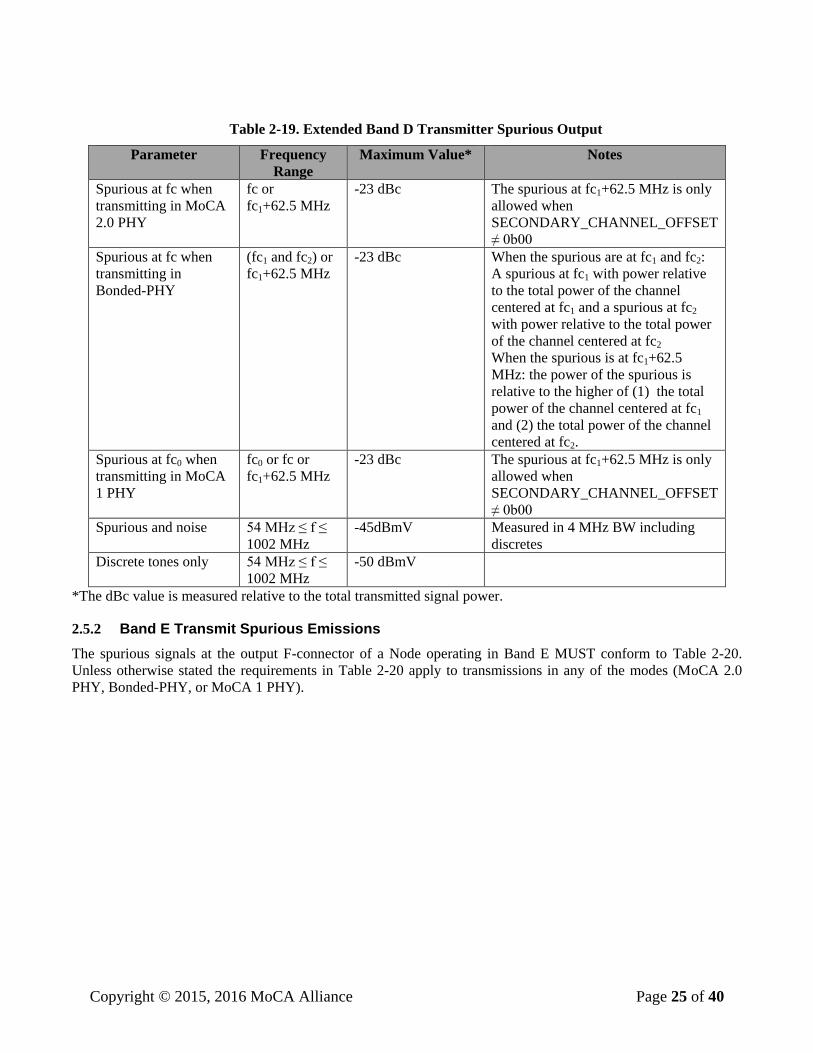
2.5.1 Extended Band D Transmit Spurious Emissions
The spurious signals at the output F-connector of a Node operating in extended band D (ExD, D-Low, or D-High)
MUST conform to Table 2-19. Unless otherwise stated the requirements in Table 2-16 apply to transmissions in
any of the modes (MoCA 2.0 PHY, Bonded-PHY, or MoCA 1 PHY).
Copyright © 2015, 2016 MoCA Alliance Page 25 of 40
Table 2-19. Extended Band D Transmitter Spurious Output
Parameter Frequency
Range
Maximum Value* Notes
Spurious at fc when
transmitting in MoCA
2.0 PHY
fc or
fc1+62.5 MHz
-23 dBc The spurious at fc1+62.5 MHz is only
allowed when
SECONDARY_CHANNEL_OFFSET
≠ 0b00
Spurious at fc when
transmitting in
Bonded-PHY
(fc1 and fc2) or
fc1+62.5 MHz
-23 dBc When the spurious are at fc1 and fc2:
A spurious at fc1 with power relative
to the total power of the channel
centered at fc1 and a spurious at fc2
with power relative to the total power
of the channel centered at fc2
When the spurious is at fc1+62.5
MHz: the power of the spurious is
relative to the higher of (1) the total
power of the channel centered at fc1
and (2) the total power of the channel
centered at fc2.
Spurious at fc0 when
transmitting in MoCA
1 PHY
fc0 or fc or
fc1+62.5 MHz
-23 dBc The spurious at fc1+62.5 MHz is only
allowed when
SECONDARY_CHANNEL_OFFSET
≠ 0b00
Spurious and noise 54 MHz ≤ f ≤
1002 MHz
-45dBmV Measured in 4 MHz BW including
discretes
Discrete tones only 54 MHz ≤ f ≤
1002 MHz
-50 dBmV
*The dBc value is measured relative to the total transmitted signal power.
2.5.2 Band E Transmit Spurious Emissions
The spurious signals at the output F-connector of a Node operating in Band E MUST conform to Table 2-20.
Unless otherwise stated the requirements in Table 2-20 apply to transmissions in any of the modes (MoCA 2.0
PHY, Bonded-PHY, or MoCA 1 PHY).

Copyright © 2015, 2016 MoCA Alliance Page 26 of 40
Table 2-20. Band E Transmitter Spurious Output
Parameter Frequency
Range
Maximum Value* Notes
Spurious at fc when
transmitting in MoCA
2.0 PHY
fc or
fc1+62.5 MHz
-23 dBc The spurious at fc1+62.5 MHz is only
allowed when
SECONDARY_CHANNEL_OFFSET
≠ 0b00
Spurious at fc when
transmitting in
Bonded-PHY
(fc1 and fc2) or
fc1+62.5 MHz
-23 dBc When the spurious are at fc1 and fc2:
A spurious at fc1 with power relative
to the total power of the channel
centered at fc1 and a spurious at fc2
with power relative to the total power
of the channel centered at fc2
When the spurious is at fc1+62.5
MHz: the power of the spurious is
relative to the higher of (1) the total
power of the channel centered at fc1
and (2) the total power of the channel
centered at fc2.
Spurious at fc0 when
transmitting in MoCA
1 PHY
fc0 or fc or
fc1+62.5 MHz
-23 dBc The spurious at fc1+62.5 MHz is only
allowed when
SECONDARY_CHANNEL_OFFSET
≠ 0b00
Spurious and Noise 0.5 MHz < f ≤
2.1 MHz
-50 dBm / 152 kHz
Spurious and Noise 2.1 MHz < f ≤
2.5 MHz
-78 dBm / 152 kHz
Spurious and Noise 2.5 MHz < f ≤
3 MHz
-40 dBm Integrated power over the frequency
range
Spurious and Noise 3 MHz < f ≤ 4
MHz
-20 dBm Integrated power over the frequency
range
Spurious and Noise 900 MHz < f <
950 MHz
-55 dBm / 20 MHz
Spurious and Noise 950 MHz ≤ f ≤
2500 MHz
-94 dBm / 20 MHz
Spurious and Noise 2500 < f <
3000 MHz
-80 dBm / 20 MHz
* The dBc value is measured relative to the total transmitted signal power.
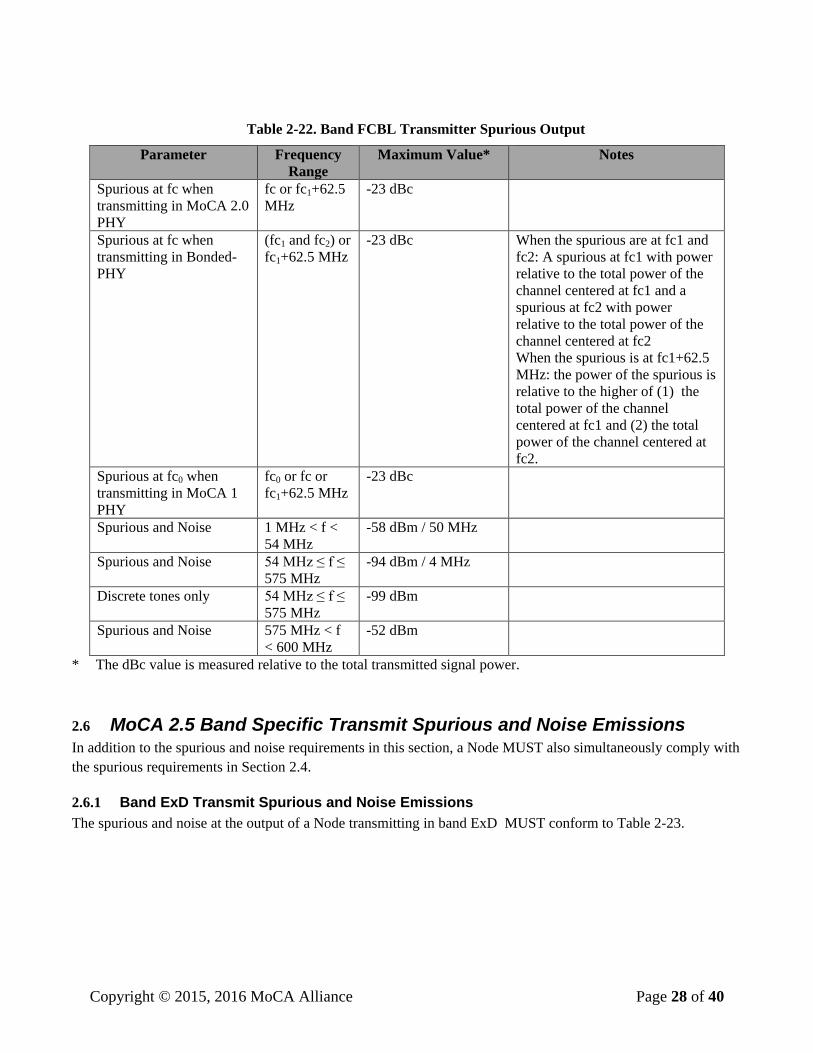
2.5.3 Band F Transmit Spurious Emissions
The spurious signals at the output F-connector of a Node MUST conform to Table 2-21 when operating in band
FSAT and MUST conform to Table 2-22 when operating in band FCBL. Unless otherwise stated the requirements in
both Table 2-21 and Table 2-22 apply to transmissions in any of the modes (MoCA 2.0 PHY, Bonded-PHY, or
MoCA 1 PHY).

Copyright © 2015, 2016 MoCA Alliance Page 27 of 40
Table 2-21. Band FSAT Transmitter Spurious Output
Parameter Frequency
Range
Maximum Value* Notes
Spurious at fc when
transmitting in MoCA 2.0
PHY
fc or fc1+62.5
MHz
-23 dBc
Spurious at fc when
transmitting in Bonded-
PHY
(fc1 and fc2) or
fc1+62.5 MHz
-23 dBc When the spurious are at fc1 and
fc2: A spurious at fc1 with power
relative to the total power of the
channel centered at fc1 and a
spurious at fc2 with power
relative to the total power of the
channel centered at fc2
When the spurious is at fc1+62.5
MHz: the power of the spurious is
relative to the higher of (1) the
total power of the channel
centered at fc1 and (2) the total
power of the channel centered at
fc2.
Spurious at fc0 when
transmitting in MoCA 1
PHY
fc0 or fc or
fc1+62.5 MHz
-23 dBc
Spurious and Noise 10 kHz < f ≤ 1
MHz
25 mV p-p at 12 ohm
Spurious and Noise 1 MHz < f <
500 MHz
-58 dBm / 50 MHz
Spurious and Noise 500 MHz ≤ f
≤ 575 MHz
-83 dBm / 50 MHz
Spurious and Noise 575 MHz < f
< 600 MHz
-52 dBm
Spurious and Noise 925 MHz < f
< 950MHz
-52 dBm
Spurious and Noise 950 MHz ≤ f
< 3000 MHz
-94 dBm / 27 MHz
* The dBc value is measured relative to the total transmitted signal power.
Copyright © 2015, 2016 MoCA Alliance Page 28 of 40
Table 2-22. Band FCBL Transmitter Spurious Output
Parameter Frequency
Range
Maximum Value* Notes
Spurious at fc when
transmitting in MoCA 2.0
PHY
fc or fc1+62.5
MHz
-23 dBc
Spurious at fc when
transmitting in Bonded-
PHY
(fc1 and fc2) or
fc1+62.5 MHz
-23 dBc When the spurious are at fc1 and
fc2: A spurious at fc1 with power
relative to the total power of the
channel centered at fc1 and a
spurious at fc2 with power
relative to the total power of the
channel centered at fc2
When the spurious is at fc1+62.5
MHz: the power of the spurious is
relative to the higher of (1) the
total power of the channel
centered at fc1 and (2) the total
power of the channel centered at
fc2.
Spurious at fc0 when
transmitting in MoCA 1
PHY
fc0 or fc or
fc1+62.5 MHz
-23 dBc
Spurious and Noise 1 MHz < f <
54 MHz
-58 dBm / 50 MHz
Spurious and Noise 54 MHz ≤ f ≤
575 MHz
-94 dBm / 4 MHz
Discrete tones only 54 MHz ≤ f ≤
575 MHz
-99 dBm
Spurious and Noise 575 MHz < f
< 600 MHz
-52 dBm
* The dBc value is measured relative to the total transmitted signal power.
2.6 MoCA 2.5 Band Specific Transmit Spurious and Noise Emissions In addition to the spurious and noise requirements in this section, a Node MUST also simultaneously comply with
the spurious requirements in Section 2.4.
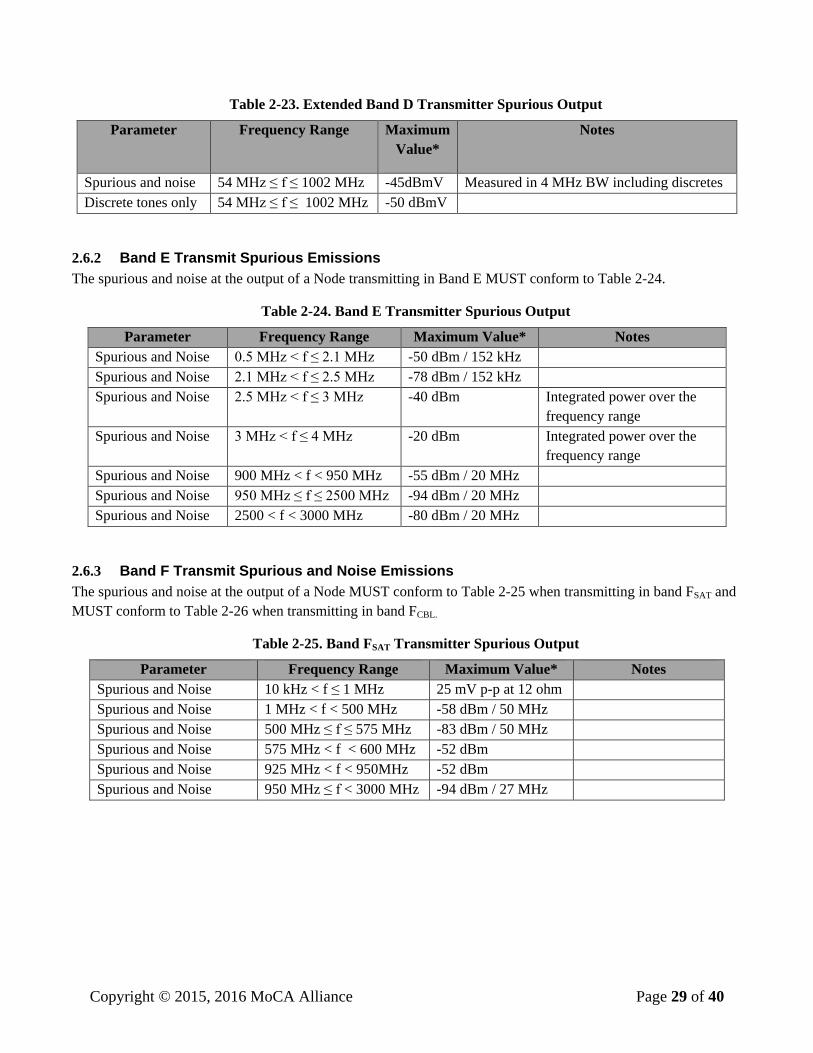
2.6.1 Band ExD Transmit Spurious and Noise Emissions
The spurious and noise at the output of a Node transmitting in band ExD MUST conform to Table 2-23.
Copyright © 2015, 2016 MoCA Alliance Page 29 of 40
Table 2-23. Extended Band D Transmitter Spurious Output
Parameter Frequency Range Maximum
Value*
Notes
Spurious and noise 54 MHz ≤ f ≤ 1002 MHz -45dBmV Measured in 4 MHz BW including discretes
Discrete tones only 54 MHz ≤ f ≤ 1002 MHz -50 dBmV
2.6.2 Band E Transmit Spurious Emissions
The spurious and noise at the output of a Node transmitting in Band E MUST conform to Table 2-24.
Table 2-24. Band E Transmitter Spurious Output
Parameter Frequency Range Maximum Value* Notes
Spurious and Noise 0.5 MHz < f ≤ 2.1 MHz -50 dBm / 152 kHz
Spurious and Noise 2.1 MHz < f ≤ 2.5 MHz -78 dBm / 152 kHz
Spurious and Noise 2.5 MHz < f ≤ 3 MHz -40 dBm Integrated power over the
frequency range
Spurious and Noise 3 MHz < f ≤ 4 MHz -20 dBm Integrated power over the
frequency range
Spurious and Noise 900 MHz < f < 950 MHz -55 dBm / 20 MHz
Spurious and Noise 950 MHz ≤ f ≤ 2500 MHz -94 dBm / 20 MHz
Spurious and Noise 2500 < f < 3000 MHz -80 dBm / 20 MHz
2.6.3 Band F Transmit Spurious and Noise Emissions
The spurious and noise at the output of a Node MUST conform to Table 2-25 when transmitting in band FSAT and
MUST conform to Table 2-26 when transmitting in band FCBL.
Table 2-25. Band FSAT Transmitter Spurious Output
Parameter Frequency Range Maximum Value* Notes
Spurious and Noise 10 kHz < f ≤ 1 MHz 25 mV p-p at 12 ohm
Spurious and Noise 1 MHz < f < 500 MHz -58 dBm / 50 MHz
Spurious and Noise 500 MHz ≤ f ≤ 575 MHz -83 dBm / 50 MHz
Spurious and Noise 575 MHz < f < 600 MHz -52 dBm
Spurious and Noise 925 MHz < f < 950MHz -52 dBm
Spurious and Noise 950 MHz ≤ f < 3000 MHz -94 dBm / 27 MHz
Copyright © 2015, 2016 MoCA Alliance Page 30 of 40
Table 2-26. Band FCBL Transmitter Spurious Output
Parameter Frequency Range Maximum Value* Notes
Spurious and Noise 1 MHz < f < 54 MHz -58 dBm / 50 MHz
Spurious and Noise 54 MHz ≤ f ≤ 575 MHz -94 dBm / 4 MHz
Discrete tones only 54 MHz ≤ f ≤ 575 MHz -99 dBm
Spurious and Noise 575 MHz < f < 600 MHz -52 dBm
2.7 Receiver Minimum Sensitivity
2.7.1 MoCA 2.0 Receiver Minimum Sensitivity
A receiving Node in a MoCA Network operating in MoCA 2.0 Mode MUST achieve on its Primary Channel a
minimum PHY Rate per received power level as specified in Table 2-27 when operating in band ExD and as
specified in Table 2-28 when operating in bands E or F and under the following conditions:
The in-home cable plant response is Flat Channel
A receiving Node in a MoCA Network operating in Turbo Mode MUST achieve on its Primary Channel a
minimum PHY Rate per received power level as specified in Table 2-29 when operating in band ExD and as
specified in Table 2-30 when operating in bands E or F and under the following conditions:
The in-home cable plant response is Flat Channel
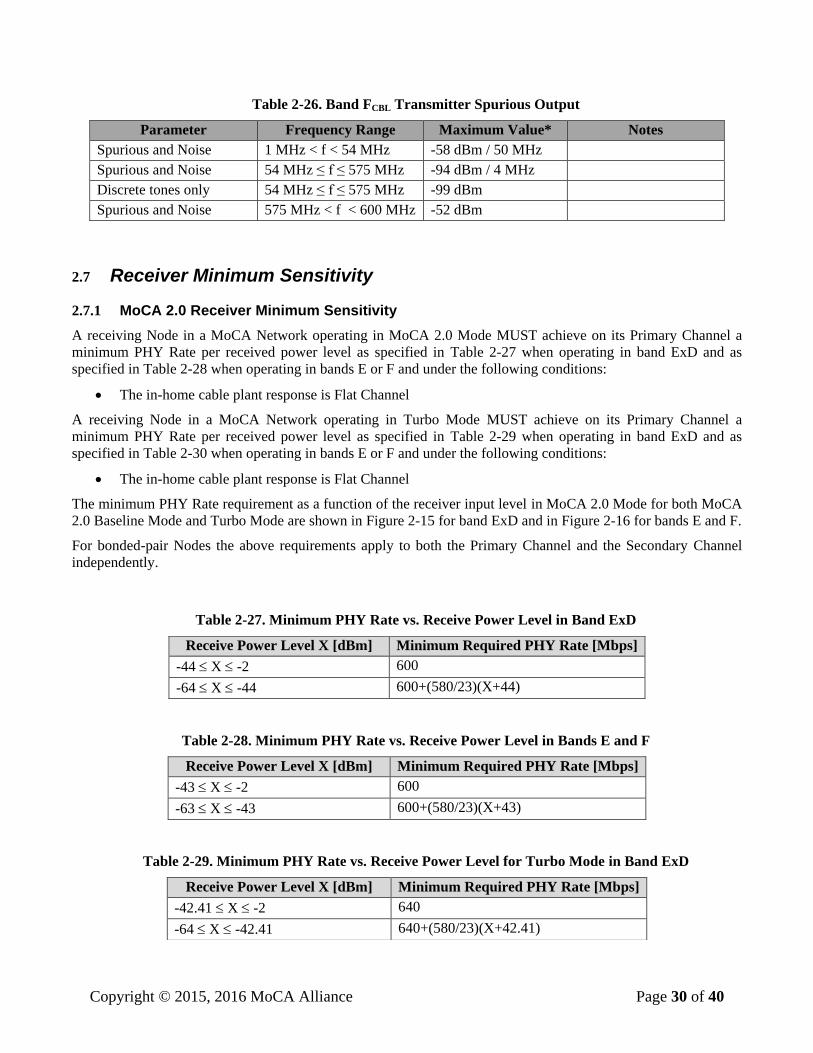
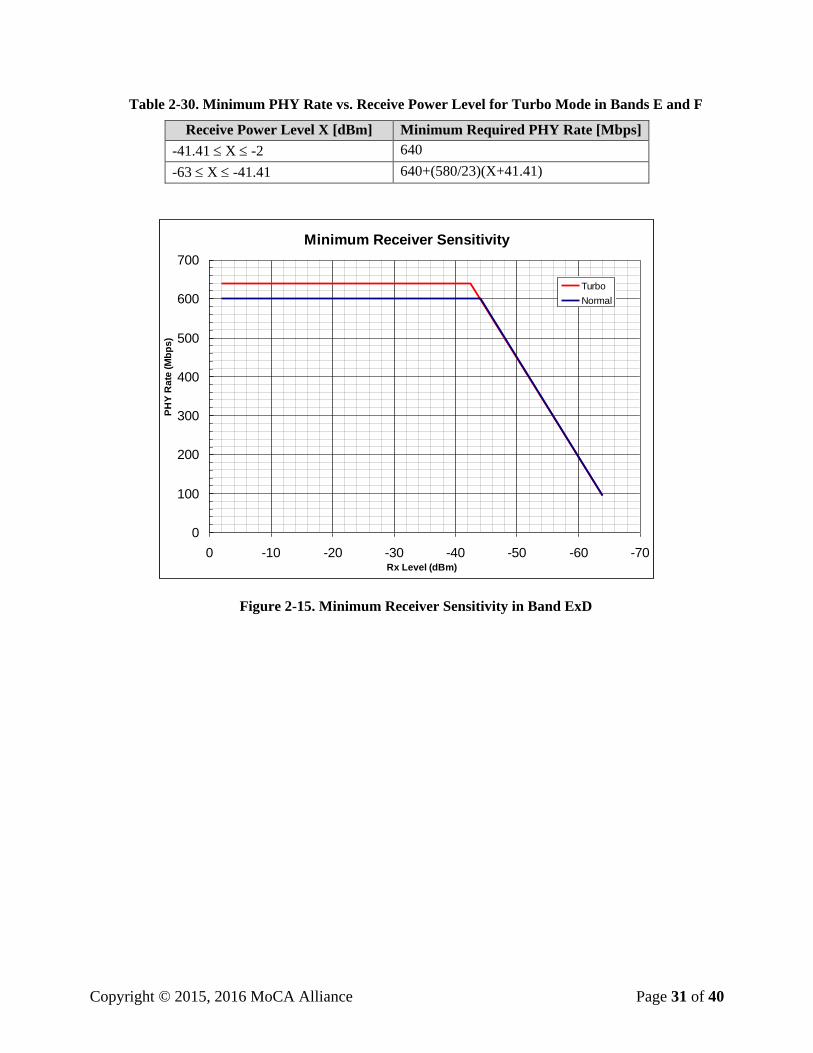
The minimum PHY Rate requirement as a function of the receiver input level in MoCA 2.0 Mode for both MoCA
2.0 Baseline Mode and Turbo Mode are shown in Figure 2-15 for band ExD and in Figure 2-16 for bands E and F.
For bonded-pair Nodes the above requirements apply to both the Primary Channel and the Secondary Channel
independently.
Table 2-27. Minimum PHY Rate vs. Receive Power Level in Band ExD
Table 2-28. Minimum PHY Rate vs. Receive Power Level in Bands E and F
Receive Power Level X [dBm] Minimum Required PHY Rate [Mbps]
-43 X -2 600
-63 X -43 600+(580/23)(X+43)
Table 2-29. Minimum PHY Rate vs. Receive Power Level for Turbo Mode in Band ExD
Receive Power Level X [dBm] Minimum Required PHY Rate [Mbps]
-44 X -2 600
-64 X -44 600+(580/23)(X+44)
Receive Power Level X [dBm] Minimum Required PHY Rate [Mbps]
-42.41 X -2 640
-64 X -42.41 640+(580/23)(X+42.41)
Copyright © 2015, 2016 MoCA Alliance Page 31 of 40
Table 2-30. Minimum PHY Rate vs. Receive Power Level for Turbo Mode in Bands E and F
Receive Power Level X [dBm] Minimum Required PHY Rate [Mbps]
-41.41 X -2 640
-63 X -41.41 640+(580/23)(X+41.41)
Figure 2-15. Minimum Receiver Sensitivity in Band ExD
Minimum Receiver Sensitivity
0
100
200
300
400
500
600
700
-70-60-50-40-30-20-100Rx Level (dBm)
PH
Y R
ate
(M
bp
s)
Turbo
Normal
Copyright © 2015, 2016 MoCA Alliance Page 32 of 40
Figure 2-16. Minimum Receiver Sensitivity in Bands E and F
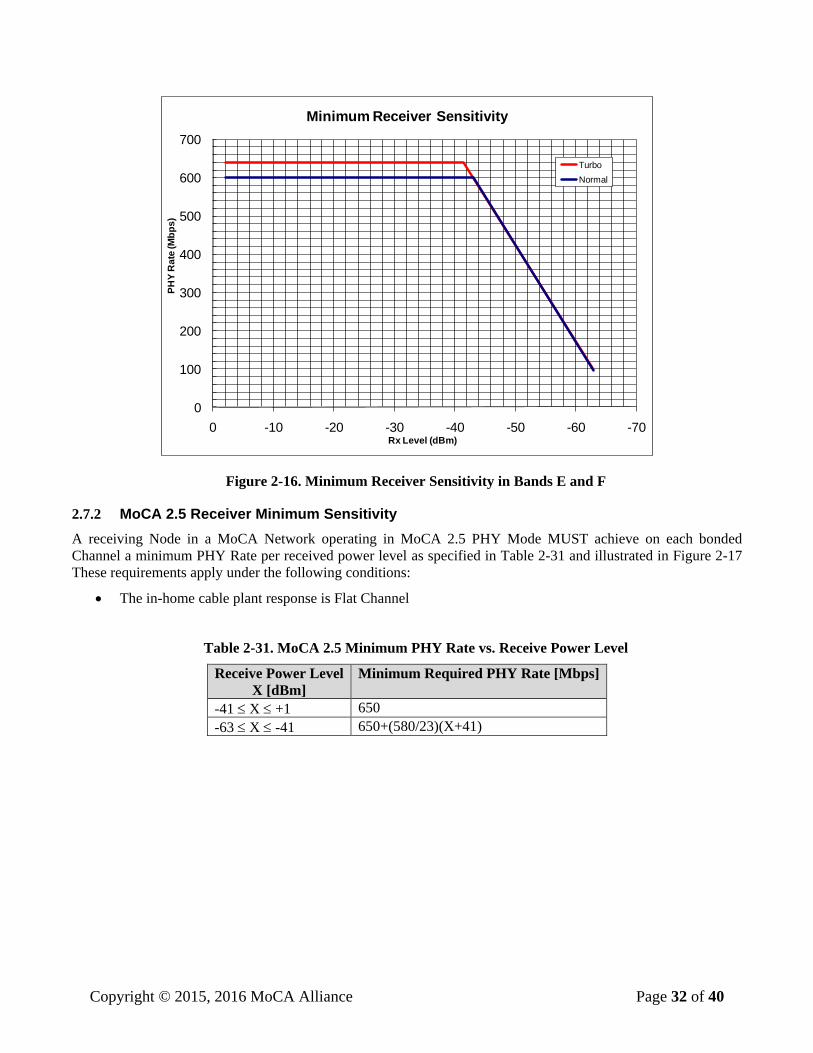
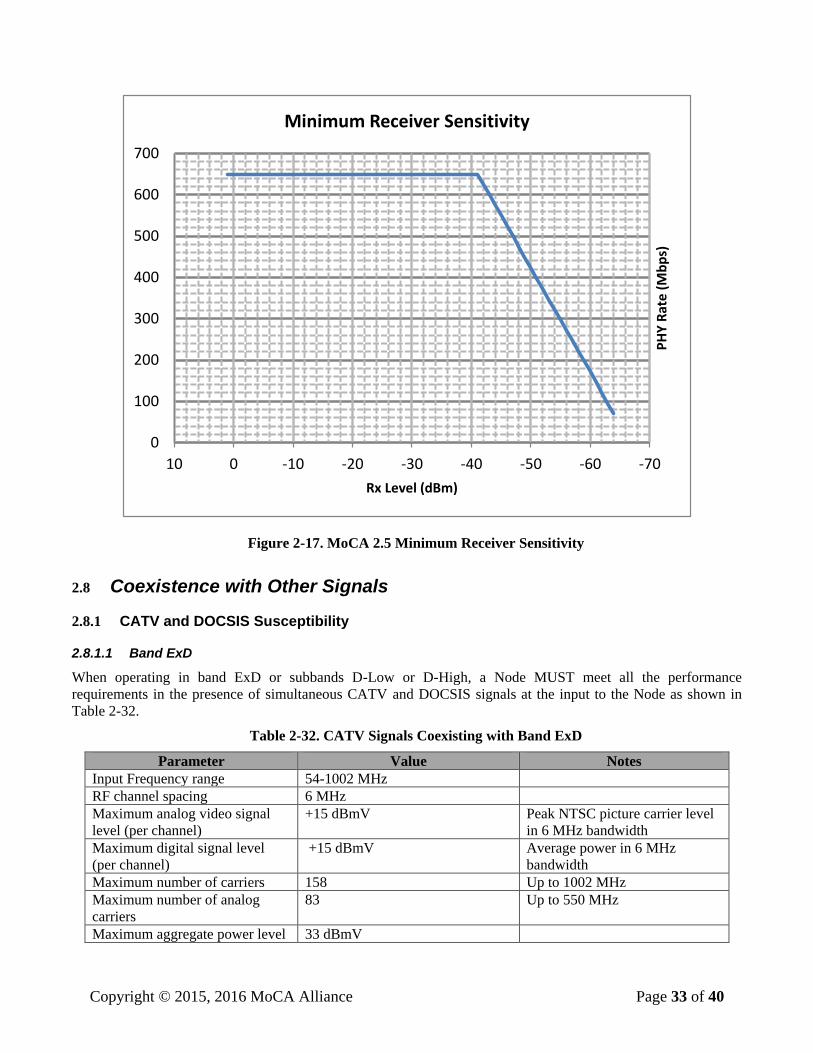
2.7.2 MoCA 2.5 Receiver Minimum Sensitivity
A receiving Node in a MoCA Network operating in MoCA 2.5 PHY Mode MUST achieve on each bonded
Channel a minimum PHY Rate per received power level as specified in Table 2-31 and illustrated in Figure 2-17
These requirements apply under the following conditions:
The in-home cable plant response is Flat Channel
Table 2-31. MoCA 2.5 Minimum PHY Rate vs. Receive Power Level
Receive Power Level
X [dBm]
Minimum Required PHY Rate [Mbps]
-41 X +1 650
-63 X -41 650+(580/23)(X+41)
0
100
200
300
400
500
600
700
-70-60-50-40-30-20-100
PH
Y R
ate
(M
bp
s)
Rx Level (dBm)
Minimum Receiver Sensitivity
Turbo
Normal
Copyright © 2015, 2016 MoCA Alliance Page 33 of 40
Figure 2-17. MoCA 2.5 Minimum Receiver Sensitivity
2.8 Coexistence with Other Signals
2.8.1 CATV and DOCSIS Susceptibility
2.8.1.1 Band ExD
When operating in band ExD or subbands D-Low or D-High, a Node MUST meet all the performance
requirements in the presence of simultaneous CATV and DOCSIS signals at the input to the Node as shown in
Table 2-32.
Table 2-32. CATV Signals Coexisting with Band ExD
Parameter Value Notes
Input Frequency range 54-1002 MHz
RF channel spacing 6 MHz
Maximum analog video signal
level (per channel)
+15 dBmV Peak NTSC picture carrier level
in 6 MHz bandwidth
Maximum digital signal level
(per channel)
+15 dBmV Average power in 6 MHz
bandwidth
Maximum number of carriers 158 Up to 1002 MHz
Maximum number of analog
carriers
83 Up to 550 MHz
Maximum aggregate power level 33 dBmV
0
100
200
300
400
500
600
700
-70-60-50-40-30-20-10010
PH
Y R
ate
(M
bp
s)
Rx Level (dBm)
Minimum Receiver Sensitivity
Copyright © 2015, 2016 MoCA Alliance Page 34 of 40
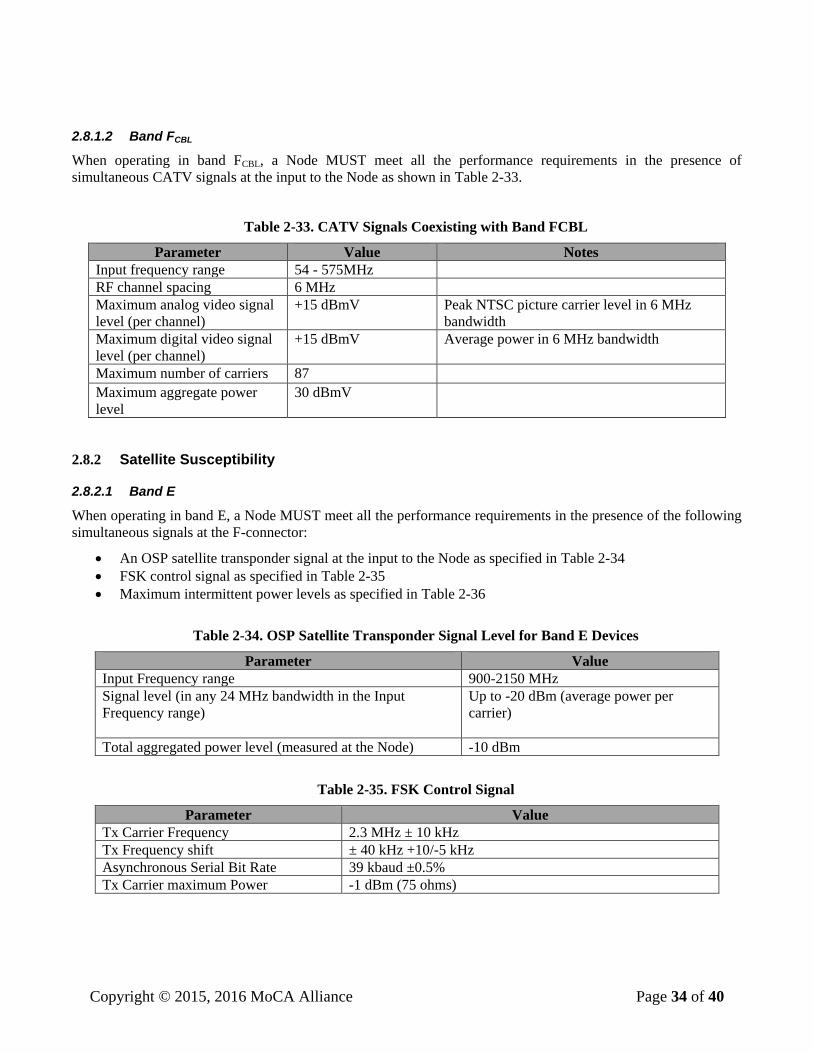
2.8.1.2 Band FCBL
When operating in band FCBL, a Node MUST meet all the performance requirements in the presence of
simultaneous CATV signals at the input to the Node as shown in Table 2-33.
Table 2-33. CATV Signals Coexisting with Band FCBL
Parameter Value Notes
Input frequency range 54 - 575MHz
RF channel spacing 6 MHz
Maximum analog video signal
level (per channel)
+15 dBmV Peak NTSC picture carrier level in 6 MHz
bandwidth
Maximum digital video signal
level (per channel)
+15 dBmV Average power in 6 MHz bandwidth
Maximum number of carriers 87 Maximum aggregate power
level
30 dBmV
2.8.2 Satellite Susceptibility
2.8.2.1 Band E
When operating in band E, a Node MUST meet all the performance requirements in the presence of the following
simultaneous signals at the F-connector:
An OSP satellite transponder signal at the input to the Node as specified in Table 2-34
FSK control signal as specified in Table 2-35
Maximum intermittent power levels as specified in Table 2-36
Table 2-34. OSP Satellite Transponder Signal Level for Band E Devices
Parameter Value
Input Frequency range 900-2150 MHz
Signal level (in any 24 MHz bandwidth in the Input
Frequency range)
Up to -20 dBm (average power per
carrier)
Total aggregated power level (measured at the Node) -10 dBm
Table 2-35. FSK Control Signal
Parameter Value
Tx Carrier Frequency 2.3 MHz ± 10 kHz
Tx Frequency shift ± 40 kHz +10/-5 kHz
Asynchronous Serial Bit Rate 39 kbaud ±0.5%
Tx Carrier maximum Power -1 dBm (75 ohms)

Copyright © 2015, 2016 MoCA Alliance Page 35 of 40
Table 2-36. Maximum Intermittent Power Levels at the Input to the Node
Frequency Power Level*
0.2 MHz to 0.6 MHz Increasing linearly from -31dBm/200kHz to -28dBm/200kHz
> 0.6 MHz to 1 MHz Increasing linearly from -28dBm/200kHz to -25dBm/200kHz
> 1 MHz to 1.8 MHz Increasing linearly from -25dBm/200kHz to -16dBm/200kHz
> 1.8 MHz to 2 MHz Increasing linearly from -16dBm/200kHz to -9dBm/200kHz
> 2.0 MHz to 2.1 MHz Increasing linearly from -9dBm/200kHz to -1dBm/200kHz
> 2.1 MHz to 2.5 MHz -1 dBm/200 kHz
> 2.5 MHz to 50 MHz Decreasing linearly from -1 dBm to -30 dBm/200 kHz
> 50 MHz to100 MHz -35 dBm/200 kHz; -30 dBm Aggregate
> 100 MHz to 200 MHz -45 dBm/200 kHz; -40 dBm Aggregate
> 200 MHz to 375 MHz -55 dBm/200 kHz; -50 dBm Aggregate
> 375 MHz to 395 MHz -65 dBm/200 kHz; -60 dBm Aggregate
> 395 MHz to 400 MHz -96 dBm/200 kHz
> 400 MHz to 700 MHz -116 dBm/200 kHz
> 700 MHz to 705 MHz -96 dBm/200 kHz
> 705 MHz to 725 MHz -65 dBm/200 kHz; -60 dBm Aggregate
> 725 MHz to 900 MHz -55 dBm/200 kHz; -50 dBm Aggregate
* The power level is the measured peak power level over any 5 s time interval.
2.8.2.2 Band FSAT
When operating in band FSAT, a Node MUST meet all the performance requirements in the presence of the
following simultaneous signals at the F-connector:
OSP satellite transponder signal level as shown in Table 2-37
DiSEqC™ signal as show in Table 2-38
Maximum intermittent power levels as specified in Table 2-39
UHF analog video signal as shown in Table 2-40
Table 2-37. OSP Satellite Transponder Signal Level for Band FSAT Devices
Parameter Value Notes
Input frequency range 950 - 3000 MHz
Maximum signal power level -25 dBm Per 27MHz transponder
Maximum total aggregated power level -7 dBm
Table 2-38. DiSEqC™ Control Signal
Parameter Value Notes
Tx carrier frequency 17.6 kHz - 26.4 kHz
Signal level 200 mVp-p – 1Vp-p
DiSEqC™ impedance 12 – 18 ohm Rx mode
Copyright © 2015, 2016 MoCA Alliance Page 36 of 40
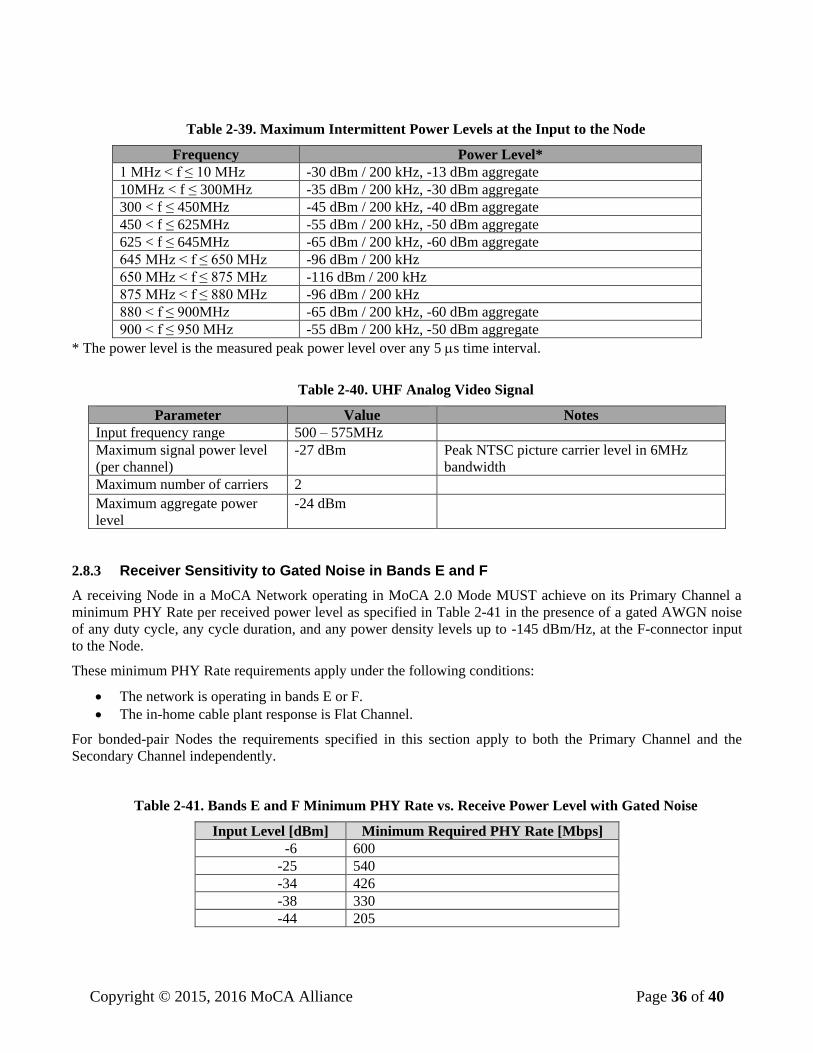
Table 2-39. Maximum Intermittent Power Levels at the Input to the Node
Frequency Power Level*
1 MHz < f ≤ 10 MHz -30 dBm / 200 kHz, -13 dBm aggregate
10MHz < f ≤ 300MHz -35 dBm / 200 kHz, -30 dBm aggregate
300 < f ≤ 450MHz -45 dBm / 200 kHz, -40 dBm aggregate
450 < f ≤ 625MHz -55 dBm / 200 kHz, -50 dBm aggregate
625 < f ≤ 645MHz -65 dBm / 200 kHz, -60 dBm aggregate
645 MHz < f ≤ 650 MHz -96 dBm / 200 kHz
650 MHz < f ≤ 875 MHz -116 dBm / 200 kHz
875 MHz < f ≤ 880 MHz -96 dBm / 200 kHz
880 < f ≤ 900MHz -65 dBm / 200 kHz, -60 dBm aggregate
900 < f ≤ 950 MHz -55 dBm / 200 kHz, -50 dBm aggregate
* The power level is the measured peak power level over any 5 s time interval.
Table 2-40. UHF Analog Video Signal
Parameter Value Notes
Input frequency range 500 – 575MHz
Maximum signal power level
(per channel)
-27 dBm Peak NTSC picture carrier level in 6MHz
bandwidth
Maximum number of carriers 2 Maximum aggregate power
level
-24 dBm
2.8.3 Receiver Sensitivity to Gated Noise in Bands E and F
A receiving Node in a MoCA Network operating in MoCA 2.0 Mode MUST achieve on its Primary Channel a
minimum PHY Rate per received power level as specified in Table 2-41 in the presence of a gated AWGN noise
of any duty cycle, any cycle duration, and any power density levels up to -145 dBm/Hz, at the F-connector input
to the Node.
These minimum PHY Rate requirements apply under the following conditions:
The network is operating in bands E or F.
The in-home cable plant response is Flat Channel.
For bonded-pair Nodes the requirements specified in this section apply to both the Primary Channel and the
Secondary Channel independently.
Table 2-41. Bands E and F Minimum PHY Rate vs. Receive Power Level with Gated Noise
Input Level [dBm] Minimum Required PHY Rate [Mbps]
-6 600
-25 540
-34 426
-38 330
-44 205
Copyright © 2015, 2016 MoCA Alliance Page 37 of 40
2.9 Sensitivity to ATSC Interference
The requirements in this section apply only when a Node is operating in band E or band F.
A receiving Node in a MoCA Network operating in MoCA 2.0 Mode MUST achieve on its Primary Channel a
minimum PHY Rate as follows:
When operating in band E:
o 190 Mbps with four to six co-channel ATSC signals
o 330 Mbps with three or less co-channel ATSC signals
When operating in band F:
o 330 Mbps with three or less co-channel ATSC signals
The above minimum PHY Rate requirements apply under the following conditions:
The in-home cable plant response is Flat Channel with the addition of the co-channel ATSC signals
meeting the following additional restriction:
When operating in band E: Each of the ATSC signals is of power level up to -65 dBm each at the F
connector occurring anywhere within band E and:
i. When there are four to six co-channel ATSC signals, their center frequencies are no more
than 12 MHz apart.
ii. When there are three or less co-channel ATSC signals, their center frequencies are no
more than 18 MHz apart
When operating in band F: Each of the ATSC signals is of power level up to -65 dBm each at the F
connector occurring anywhere within band F up to 698 MHz (upper edge of the ATSC signal), and
the center frequencies of the ATSC signals are no more than 18 MHz apart.
All the Nodes in the network have recovered from the appearance of the co-channel ATSC signals
(including if necessary rejoining or reforming the network as specified below).
A receiving Node in a MoCA Network operating in band E or band F in MoCA 2.0 Mode MUST achieve on its
Primary Channel a minimum PHY Rate of 600 Mbps under the following conditions:
Three or less adjacent ATSC signals of power up to -65 dBm each at the F connector present:
o When operating in band E: anywhere in band E outside the MoCA Network channel of operation
o When operating in band F: anywhere in band F up to 698 MHz (upper edge of ATSC signal)
outside the MoCA Network channel of operation
A Node in a MoCA Network MUST be able to reform the existing MoCA Network within the time TATSC_RFRM, as
specified in Table 2-42, following the appearance of the following signals at the input to the Node:
When operating in band E: up to six ATSC signals each at -65 dBm, appearing anywhere within band E
but with no more than 3 ATSC signals in any 50 MHz band.
When operating in band F: up to three ATSC signals each at -65 dBm, appearing anywhere within band F
up to 698 MHz (upper edge of the ATSC signal).
A Node in a MoCA Network MUST be able to rejoin the existing MoCA Network within TATSC_RJOIN, as specified
in Table 2-43, following the appearance of the following signals at the input to the Node:
When operating in band E: up to six ATSC signals each at -65 dBm, appearing anywhere within band E
but with no more than 3 ATSC signals in any 50 MHz band.
When operating in band F: up to three ATSC signals each at -65 dBm, appearing anywhere within band F
up to 698 MHz (upper edge of the ATSC signal).
Copyright © 2015, 2016 MoCA Alliance Page 38 of 40
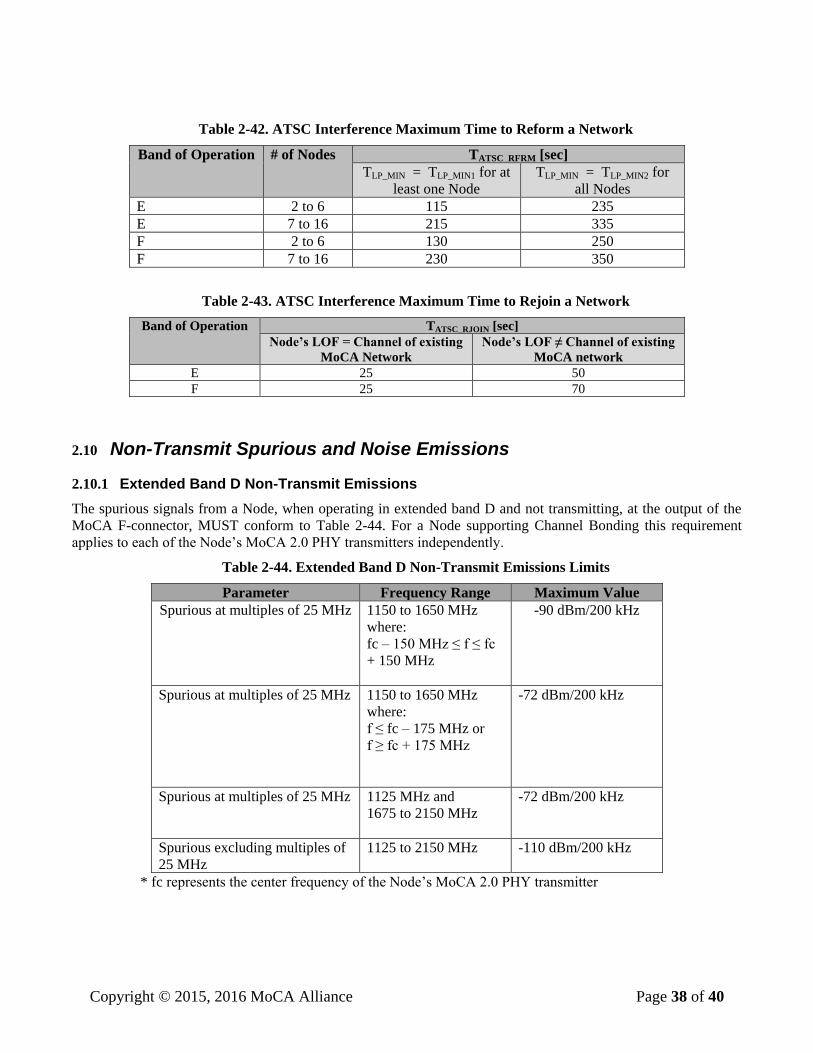
Table 2-42. ATSC Interference Maximum Time to Reform a Network
Band of Operation # of Nodes TATSC_RFRM [sec]
TLP_MIN = TLP_MIN1 for at
least one Node
TLP_MIN = TLP_MIN2 for
all Nodes
E 2 to 6 115 235
E 7 to 16 215 335
F 2 to 6 130 250
F 7 to 16 230 350
Table 2-43. ATSC Interference Maximum Time to Rejoin a Network
Band of Operation TATSC_RJOIN [sec]
Node’s LOF = Channel of existing
MoCA Network
Node’s LOF ≠ Channel of existing
MoCA network
E 25 50
F 25 70
2.10 Non-Transmit Spurious and Noise Emissions
2.10.1 Extended Band D Non-Transmit Emissions
The spurious signals from a Node, when operating in extended band D and not transmitting, at the output of the
MoCA F-connector, MUST conform to Table 2-44. For a Node supporting Channel Bonding this requirement
applies to each of the Node’s MoCA 2.0 PHY transmitters independently.
Table 2-44. Extended Band D Non-Transmit Emissions Limits
Parameter Frequency Range Maximum Value
Spurious at multiples of 25 MHz 1150 to 1650 MHz
where:
fc – 150 MHz ≤ f ≤ fc
+ 150 MHz
-90 dBm/200 kHz
Spurious at multiples of 25 MHz 1150 to 1650 MHz
where:
f ≤ fc – 175 MHz or
f ≥ fc + 175 MHz
-72 dBm/200 kHz
Spurious at multiples of 25 MHz 1125 MHz and
1675 to 2150 MHz
-72 dBm/200 kHz
Spurious excluding multiples of
25 MHz
1125 to 2150 MHz
-110 dBm/200 kHz
* fc represents the center frequency of the Node’s MoCA 2.0 PHY transmitter
Copyright © 2015, 2016 MoCA Alliance Page 39 of 40
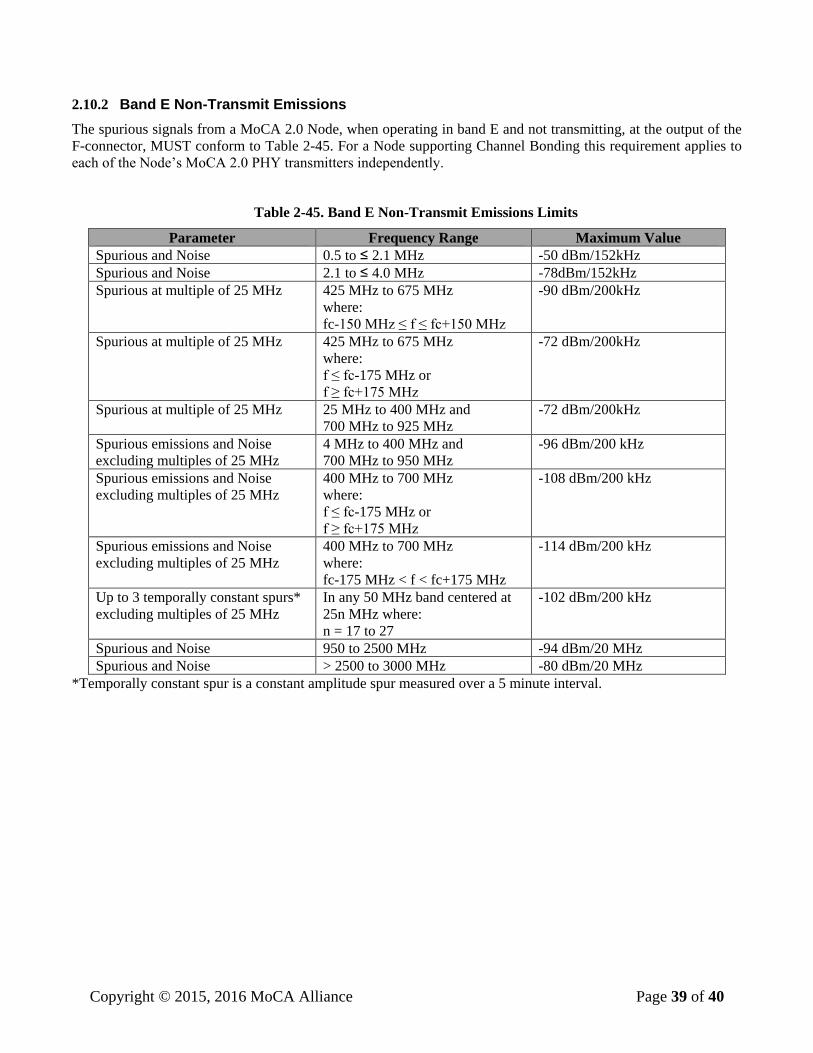
2.10.2 Band E Non-Transmit Emissions
The spurious signals from a MoCA 2.0 Node, when operating in band E and not transmitting, at the output of the
F-connector, MUST conform to Table 2-45. For a Node supporting Channel Bonding this requirement applies to
each of the Node’s MoCA 2.0 PHY transmitters independently.
Table 2-45. Band E Non-Transmit Emissions Limits
Parameter Frequency Range Maximum Value
Spurious and Noise 0.5 to ≤ 2.1 MHz -50 dBm/152kHz
Spurious and Noise 2.1 to ≤ 4.0 MHz -78dBm/152kHz
Spurious at multiple of 25 MHz 425 MHz to 675 MHz
where:
fc-150 MHz ≤ f ≤ fc+150 MHz
-90 dBm/200kHz
Spurious at multiple of 25 MHz 425 MHz to 675 MHz
where:
f ≤ fc-175 MHz or
f ≥ fc+175 MHz
-72 dBm/200kHz
Spurious at multiple of 25 MHz 25 MHz to 400 MHz and
700 MHz to 925 MHz
-72 dBm/200kHz
Spurious emissions and Noise
excluding multiples of 25 MHz
4 MHz to 400 MHz and
700 MHz to 950 MHz
-96 dBm/200 kHz
Spurious emissions and Noise
excluding multiples of 25 MHz
400 MHz to 700 MHz
where:
f ≤ fc-175 MHz or
f ≥ fc+175 MHz
-108 dBm/200 kHz
Spurious emissions and Noise
excluding multiples of 25 MHz
400 MHz to 700 MHz
where:
fc-175 MHz < f < fc+175 MHz
-114 dBm/200 kHz
Up to 3 temporally constant spurs*
excluding multiples of 25 MHz
In any 50 MHz band centered at
25n MHz where:
n = 17 to 27
-102 dBm/200 kHz
Spurious and Noise 950 to 2500 MHz -94 dBm/20 MHz
Spurious and Noise > 2500 to 3000 MHz -80 dBm/20 MHz
*Temporally constant spur is a constant amplitude spur measured over a 5 minute interval.
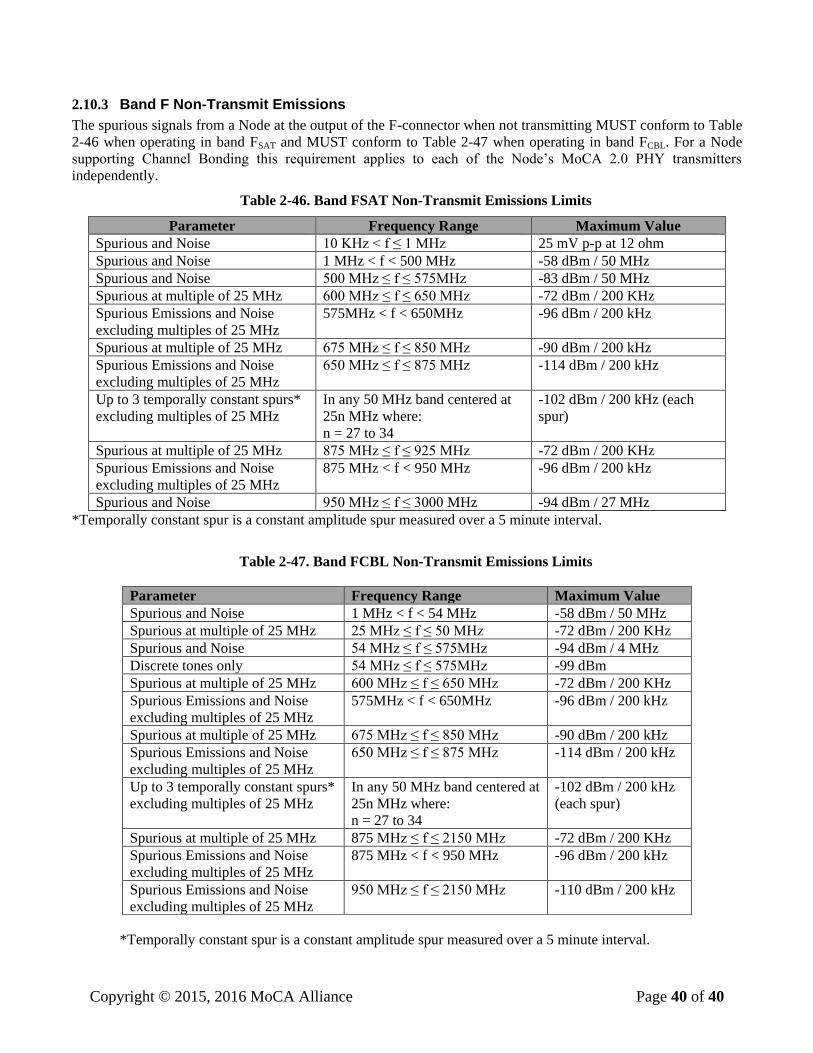
Copyright © 2015, 2016 MoCA Alliance Page 40 of 40
2.10.3 Band F Non-Transmit Emissions
The spurious signals from a Node at the output of the F-connector when not transmitting MUST conform to Table
2-46 when operating in band FSAT and MUST conform to Table 2-47 when operating in band FCBL. For a Node
supporting Channel Bonding this requirement applies to each of the Node’s MoCA 2.0 PHY transmitters
independently.
Table 2-46. Band FSAT Non-Transmit Emissions Limits
Parameter Frequency Range Maximum Value
Spurious and Noise 10 KHz < f ≤ 1 MHz 25 mV p-p at 12 ohm
Spurious and Noise 1 MHz < f < 500 MHz -58 dBm / 50 MHz
Spurious and Noise 500 MHz ≤ f ≤ 575MHz -83 dBm / 50 MHz
Spurious at multiple of 25 MHz 600 MHz ≤ f ≤ 650 MHz -72 dBm / 200 KHz
Spurious Emissions and Noise
excluding multiples of 25 MHz
575MHz < f < 650MHz -96 dBm / 200 kHz
Spurious at multiple of 25 MHz 675 MHz ≤ f ≤ 850 MHz -90 dBm / 200 kHz
Spurious Emissions and Noise
excluding multiples of 25 MHz
650 MHz ≤ f ≤ 875 MHz -114 dBm / 200 kHz
Up to 3 temporally constant spurs*
excluding multiples of 25 MHz
In any 50 MHz band centered at
25n MHz where:
n = 27 to 34
-102 dBm / 200 kHz (each
spur)
Spurious at multiple of 25 MHz 875 MHz ≤ f ≤ 925 MHz -72 dBm / 200 KHz
Spurious Emissions and Noise
excluding multiples of 25 MHz
875 MHz < f < 950 MHz -96 dBm / 200 kHz
Spurious and Noise 950 MHz ≤ f ≤ 3000 MHz -94 dBm / 27 MHz
*Temporally constant spur is a constant amplitude spur measured over a 5 minute interval.
Table 2-47. Band FCBL Non-Transmit Emissions Limits
*Temporally constant spur is a constant amplitude spur measured over a 5 minute interval.
Parameter Frequency Range Maximum Value
Spurious and Noise 1 MHz < f < 54 MHz -58 dBm / 50 MHz
Spurious at multiple of 25 MHz 25 MHz ≤ f ≤ 50 MHz -72 dBm / 200 KHz
Spurious and Noise 54 MHz ≤ f ≤ 575MHz -94 dBm / 4 MHz
Discrete tones only 54 MHz ≤ f ≤ 575MHz -99 dBm
Spurious at multiple of 25 MHz 600 MHz ≤ f ≤ 650 MHz -72 dBm / 200 KHz
Spurious Emissions and Noise
excluding multiples of 25 MHz
575MHz < f < 650MHz -96 dBm / 200 kHz
Spurious at multiple of 25 MHz 675 MHz ≤ f ≤ 850 MHz -90 dBm / 200 kHz
Spurious Emissions and Noise
excluding multiples of 25 MHz
650 MHz ≤ f ≤ 875 MHz -114 dBm / 200 kHz
Up to 3 temporally constant spurs*
excluding multiples of 25 MHz
In any 50 MHz band centered at
25n MHz where:
n = 27 to 34
-102 dBm / 200 kHz
(each spur)
Spurious at multiple of 25 MHz 875 MHz ≤ f ≤ 2150 MHz -72 dBm / 200 KHz
Spurious Emissions and Noise
excluding multiples of 25 MHz
875 MHz < f < 950 MHz -96 dBm / 200 kHz
Spurious Emissions and Noise
excluding multiples of 25 MHz
950 MHz ≤ f ≤ 2150 MHz -110 dBm / 200 kHz


![MoCA 2.0 Specification for Device RF Characteristics · PDF fileMoCA 2.0 Specification for Device RF Characteristics 20150406 ... Extended Band D Channel Frequencies Frequency [MHz]](https://cdn.vdocuments.net/doc/165x107/5a7895597f8b9a8c428d9d0c/moca-20-specification-for-device-rf-characteristics-20-specification-for-device.jpg)


