
MONITORING THE HABITAT AND SPATIAL ASSOCIATIONS OF TWO
THREATENED PRIMATES ALONG A CONSERVATION AREA
IN WESTERN ECUADOR
by
Jacquelyn Marie Tleimat, B.S.
A thesis submitted to the Graduate Council of
Texas State University in partial fulfillment
of the requirements for the degree of
Master of Science
with a Major in Wildlife Ecology
August 2021
Committee Members:
Sarah R. Fritts, Chair
Shawn F. McCracken
Joseph A. Veech
Ivan Castro-Arellano

COPYRIGHT
by
Jacquelyn Marie Tleimat
2021

FAIR USE AND AUTHOR’S PERMISSION STATEMENT
Fair Use
This work is protected by the Copyright Laws of the United States (Public Law 94-553,
section 107). Consistent with fair use as defined in the Copyright Laws, brief quotations
from this material are allowed with proper acknowledgement. Use of this material for
financial gain without the author’s express written permission is not allowed.
Duplication Permission
As the copyright holder of this work I, Jacquelyn Marie Tleimat, authorize duplication of
this work, in whole or in part, for educational or scholarly purposes only.

iv
ACKNOWLEDGEMENTS
I would like to thank Dr. Fritts for her endless patience advising me throughout
the winding journey this thesis has been, Dr. McCracken for teaching me to climb trees,
extending the opportunity to work in Ecuador again, and overall guidance throughout this
process. Thanks to Dr. Veech for all his statistical advice and feedback, and Dr. Castro
for his guidance and suggestions along the way. I will forever be grateful to those
individuals that provided aid and endless laughs during this fieldwork: Rebecca Davis,
Moises Tenorio, Matthew Parker, Nicolas Betancourt, Ryan Lynch and Sixto Lopez.
Those that aided in photo ID: Victoria Vega and Charles Bintliff, and the team that aided
in confirming capuchin call ID: Silvy Van Kujik and Kimberly Negrette, thank you
kindly for your time. I am forever grateful to the team at TMA: Dany Murillo, Edilberto
Marquez, Jerry Toth for granting our team permission to place canopy stations on their
properties and providing us with housing and logistical support in the field. A special
thank you to Dr. Rodriguez for his aid in acquiring funding. A huge thank you to the
funders that made this project a possibility: The Explorer’s Club, Texas State University,
Rufford Small Grants, The Van Tiehoven Foundation, IUCN – Netherlands, and Saving
Nature. This would not have been possible without the support and edits of Rebekah
Rylander, Charlotte Wilson, Rob Tyler, Emma Guest, Brittany Stamps, and Eli Lee, my
dear friends Becca Brunner, Mar Morretta, Mel Villatoro, Kate Jurek, Molly Brown, and
River Hudgins, and my family (Patty, Joe, and Alex Tleimat). Lastly, thank you to my
dear cats Momo and Collette who provided me emotional support until their last breaths.

v
TABLE OF CONTENTS
Page
ACKNOWLEDGEMENTS................................................................................................iv
LIST OF TABLES..............................................................................................................vi
LIST OF FIGURES ..........................................................................................................viii
LIST OF ABBREVIATIONS..............................................................................................x
ABSTRACT .......................................................................................................................xi
CHAPTER
I. INTRODUCTION .............................................................................................1
II. METHODS ........................................................................................................7
III. RESULTS ........................................................................................................15
IV. DISCUSSION ..................................................................................................19
V. TABLES AND FIGURES ...............................................................................26
REFERENCES ..................................................................................................................47

vi
LIST OF TABLES
Table Page
1. Length of data acquisition by AudioMoths (AM Rec.), trail cameras (Cam. Rec.), and
Kestrels (Kestrel Rec.), as well as days not recording (NR) between January and
October of 2020 by site throughout the TFCA (n = 20). Length was recorded in
days.............................................................................................................................. 26
2. Code used for observation-level and site-level covariates to build occupancy and local
presence models for the Ecuadorian mantled howler (Alouatta palliata aequatorialis)
and Ecuadorian capuchin (Cebus aequatorialis) throughout the TFCA .....................27
3. The minimum (Min.), maximum (Max.), mean, and standard deviation (SD) of the
site-level covariates estimated to assess occupancy and local presence of Ecuadorian
mantled howlers (Alouatta palliata aequatorialis) and Ecuadorian capuchins (Cebus
aequatorialis) throughout the TFCA (n = 20) .............................................................28
4. The most supported single species detection models for the Ecuadorian mantled
howler (Alouatta palliata aequatorialis) throughout the TFCA (n = 19) in the dry
season (Oct - Nov), where Ψ indicates covariates influencing occupancy probability,
p indicates covariates influencing detection probability, K is the number of
parameters on the model, AIC is Akaike’s Information Criterion, ∆AIC is the
difference in reported AIC, and wi is the AIC weight .................................................29
5. The most supported single species detection models for the Ecuadorian mantled
howler (Alouatta palliata aequatorialis) and the Ecuadorian capuchin (Cebus
aequatorialis) throughout the TFCA (n = 20) in the rainy season (Jan. – Mar.), where
Ψ indicates covariates influencing occupancy probability, θ indicates local presence
probability, p indicates covariates influencing detection probability, K is the number
of parameters on the model, AIC is Akaike’s Information Criterion, ∆AIC is the
difference in reported AIC, and wi is the AIC weight ………………………......…...30
6. The most supported single species models for the Ecuadorian mantled howler
(Alouatta palliata aequatorialis) and the Ecuadorian capuchin (Cebus aequatorialis)
throughout the TFCA (n = 20), where Ψ indicates covariates influencing occupancy
probability, θ indicates covariates influencing local presence probability, p indicates
covariates influencing detection probability, K is the number of parameters on the
model, AIC is Akaike’s Information Criterion, ∆AIC is the difference in reported
AIC, and wi is the AIC weight .....................................................................................31

vii
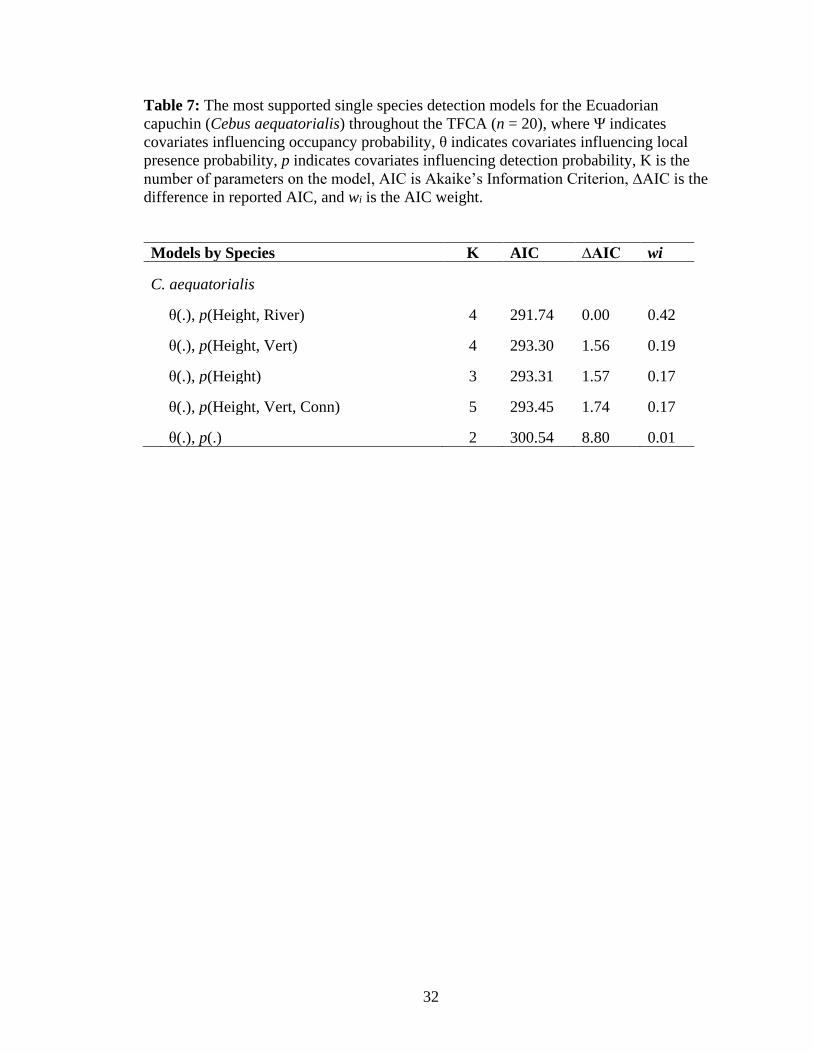
7. The most supported single species detection models for the Ecuadorian capuchin
(Cebus aequatorialis) throughout the TFCA (n = 20), where Ψ indicates covariates
influencing occupancy probability, θ indicates covariates influencing local presence
probability, p indicates covariates influencing detection probability, K is the number
of parameters on the model, AIC is Akaike’s Information Criterion, ∆AIC is the
difference in reported AIC, and wi is the AIC weight .................................................32
8. The coefficient values (coeff.), standard errors (SE) and 95% lower and upper
confidence interval (LCI and UCI, respectively) for the weekly binned data for the
best single season models for the Ecuadorian mantled howler (Alouatta palliata
aequatorialis) and the Ecuadorian capuchin (Cebus aequatorialis) throughout the
TFCA (n = 20) .............................................................................................................33
9. The coefficient values (coeff.), standard errors (SE) and 95% lower and upper
confidence interval (LCI and UCI, respectively) for the best detection model of the
Ecuadorian capuchin (Cebus aequatorialis) throughout the TFCA (n = 20) ..............34
10. The coefficient values (coeff.), standard errors (SE) and 95% lower and upper
confidence interval (LCI and UCI, respectively) for the best detection models in the
rainy season (Jan – Mar) for the Ecuadorian mantled howler (Alouatta palliata
aequatorialis) and the Ecuadorian capuchin (Cebus aequatorialis) throughout the
TFCA (n = 20) .............................................................................................................35
11. The coefficient values (coeff.), standard errors (SE) and 95% lower and upper
confidence interval (LCI and UCI, respectively) for the best detection models in the
dry season (Oct – Nov) for the Ecuadorian mantled howler (Alouatta palliata
aequatorialis) throughout the TFCA (n = 19) .............................................................36

viii
LIST OF FIGURES
Figure Page
1. Map of the three forests conservation area. Each green star represents a canopy
station in the corridor that was systematically generated. Colors represent different
habitat types: light blue is cloud forest, light brown is agriculture, purple is wet forest,
and pink is dry forest. The red outline indicates the boundaries of the TFCC and the
property boundaries of the two reserves (BSLL and JCR) are outlined. The
boundaries of the TFCA represent areas with access to place canopy stations. The
green star in the inset maps displays the location of the TFCA within Ecuador.........37
2. Canopy station – the AudioMoth is positioned slightly under the tree to decrease
chance of water buildup and in a weatherproof case that has a membrane to allow
sound to pass and a silica packet in the event moisture enters. The camera is mounted
on an arm and positioned so it will not interfere with wildlife movement and is facing
the main branch. Not photographed is the kestrel........................................................38
3. Canopy station tree with large buttress roots. Dashed red line indicates where the
DBH was measured......................................................................................................39
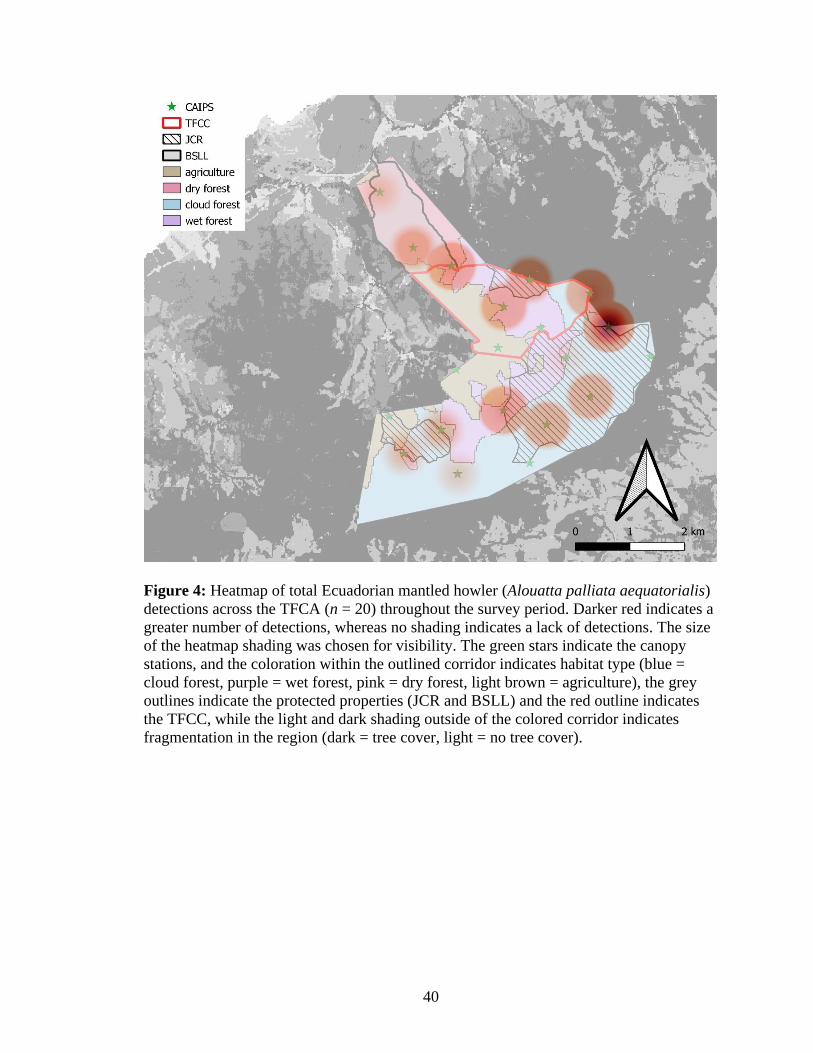
4. Heatmap of total Ecuadorian mantled howler (Alouatta palliata aequatorialis)
detections across the TFCA (n = 20) throughout the survey period. Darker red
indicates a greater number of detections, whereas no shading indicates a lack of
detections. The size of the heatmap shading was chosen for visibility. The green stars
indicate the canopy stations, and the coloration within the outlined corridor indicates
habitat type (blue = cloud forest, purple = wet forest, pink = dry forest, light brown =
agriculture), the grey outlines indicate the protected properties (JCR and BSLL) and
the red outline indicates the TFCC, while the light and dark shading outside of the
colored corridor indicates fragmentation in the region (dark = tree cover, light = no
tree cover) ....................................................................................................................40
5. Heatmap of total Ecuadorian capuchin (Cebus aequatorialis) detections across the
TFCA (n = 20) throughout the survey period. Darker red indicates a greater number
of detections, whereas no shading indicates a lack of detections. The size of the
heatmap shading was chosen for visibility. The green stars indicate the canopy
stations, and the coloration within the outlined corridor indicates habitat type (blue =
cloud forest, purple = wet forest, pink = dry forest, light brown = agriculture), the
grey outlines indicate the protected properties (JCR and BSLL) and the red outline
indicates the TFCC, while the light and dark shading outside of the colored corridor
indicates fragmentation in the region (dark = tree cover, light = no tree cover) .. .......41

ix
6. Occupancy probability of Ecuadorian mantled howler (Alouatta palliata
aequatorialis) across the TFCA (n = 20) based on canopy station height measured in
meters, with 95% confidence envelope .......................................................................42
7. Local presence probability of Ecuadorian capuchin (Cebus aequatorialis) throughout
the TFCA (n = 20) based on the distance to an artificial edge measured in kilometers
with 95% confidence envelope ....................................................................................43
8. Ecuadorian mantled howler (Alouatta palliata aequatorialis) consuming the seedpod
of Inga edulis at Jama-Coaque Reserve. Photo credit: Euan Ferguson .......................44
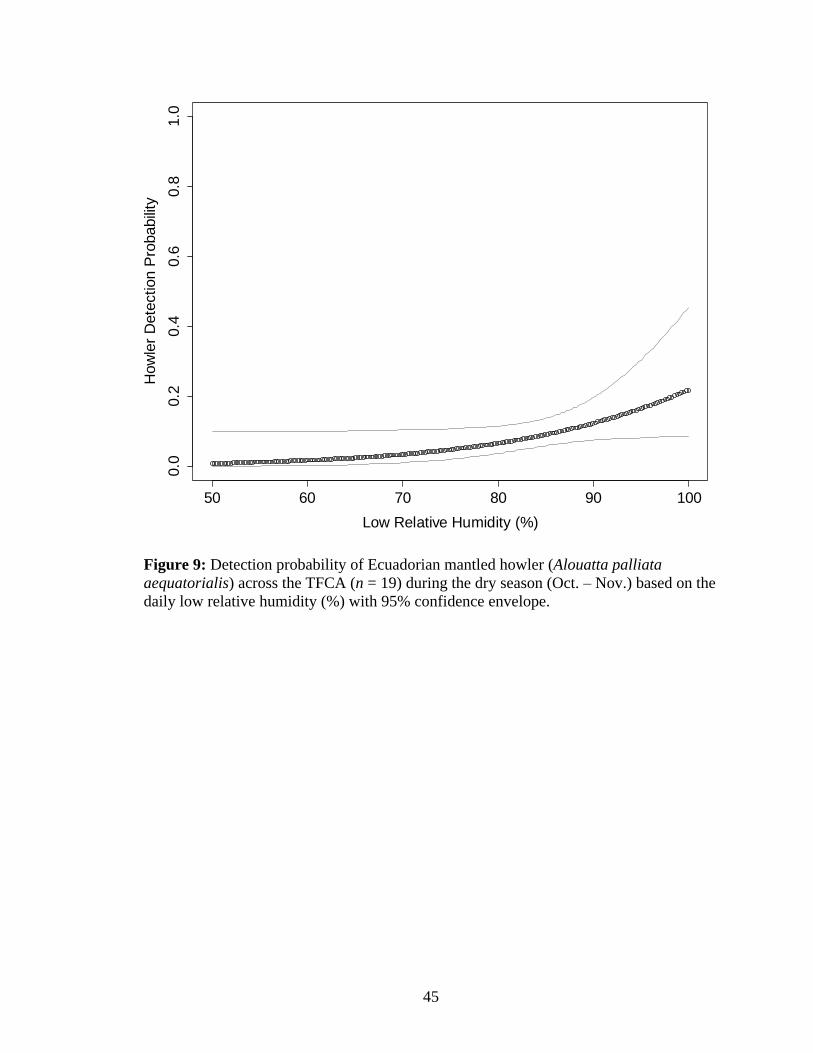
9. Detection probability of Ecuadorian mantled howler (Alouatta palliata aequatorialis)
across the TFCA (n = 19) during the dry season (Oct. – Nov.) based on the daily low
relative humidity (%) with 95% confidence envelope.................................................45
10. Detection probability of Ecuadorian mantled howler (Alouatta palliata aequatorialis)
across the TFCA (n = 20) during the rainy season (Jan. – Mar.) based on the daily
high temperature (°C) with 95% confidence envelope................................................46

x
LIST OF ABBREVIATIONS
Abbreviation Description
BSLL Bosque Seco Lalo Loor
JCR Jama-Coaque Reserve
TFCC Three Forests Conservation Corridor
TFCA Three Forests Conservation Area
TMA Third Millennium Alliance
IUCN International Union for Conservation of Nature

xi
ABSTRACT
The Chocó rainforest in coastal Ecuador is an internationally recognized
biodiversity hotspot that has been more than 95% deforested for logging and agricultural
purposes, which has reduced wildlife habitat and isolated remaining habitat patches. In
response to rapid deforestation, the Three Forest Conservation Corridor (TFCC) was
established to promote connectivity among local reserves and create the Three Forests
Conservation Area (TFCA). As managers from these reserves plan to acquire land to
expand the protected area, a better understanding of threatened species’ habitat
associations, such as two threatened primates: the Ecuadorian capuchin (Cebus
aequatorialis) and the Ecuadorian mantled howler (Alouatta palliata aequatorialis), is
required to inform management and acquisition decisions. I recorded activity and
distribution of both primate species using twenty acoustic monitoring devices and trail
cameras deployed in the forest canopy at stations spread across the TFCA. I assessed the
influence of habitat type (agriculture and three forest types [cloud, dry, and wet]),
vegetation structure, and landscape composition on occupancy and local presence using
single-season occupancy models. I also mapped total detections of both primate species
to identify areas of frequent use. Models that included covariates were compared to null
models using AICc, and goodness-of-fit-tests. Although the 90% confidence interval of
regression coefficients overlapped ‘0’, the model that included a positive relationship
with station height was the best model for Ecuadorian mantled howlers and the model
that included a negative relationship with distance to edge was the best model for

xii
Ecuadorian capuchins. The lack of significance likely was due to the limited number of
canopy stations as well as a low detection probability, a common issue when studying
rare species. Maps indicated that cloud forest on the northeastern edge of the TFCA were
frequently used by both species. I suggest preserving the remaining intact forests with tall
trees to aid in both species’ conservation. Additionally, results will guide future areas for
protection and corridor expansion.

1
I. INTRODUCTION
Global biodiversity is in decline largely due to high rates of habitat loss via land
conversion and fragmentation (Heywood 1995; Butchart et al. 2010; Hansen et al. 2013).
Fragmentation is a process in which an expanse of habitat is transformed into smaller
patches separated and isolated by a different matrix of habitats (Wilcove et al. 1986). For
many species, fragmentation leads to restrictions on movement and dispersal (Kindlmann
and Burel 2008). Small-scale movement restrictions (i.e., daily movement disruptions)
lead to poor condition of individuals due to increased energy expenditure to obtain
resources (Smith et al. 2013), whereas large-scale dispersal movement restrictions (i.e.,
preventing long-distance dispersal) caused by severe habitat isolation can lead to
inbreeding depression due to the lack of gene flow (Kenney et al. 2014). Fragmentation
can be especially detrimental to large mammals, such as primates, given their large home
ranges and the increased exposure to poaching while navigating fragmented landscapes
(Bicca-Marques 2003).
Promoting habitat connectivity among habitat patches has proved to be a
successful strategy to mitigate the impacts of fragmentation in tropical systems (Campos
and Jack 2013). One way to increase habitat connectivity is through the establishment of
conservation corridors (Beier and Noss 1998) that link forest patches occurring in
otherwise ‘uncrossable’ landscapes. Such connectivity can be accomplished by
strategically planting trees or encouraging farmers to retain various vegetation patches
intact. Despite the recognized importance of corridors for increasing connectivity, there is
little research on the effectiveness of conservation corridors in the tropics (Caro et al.
2009; Yaap 2018). Given the high degree of ecological specialization in the tropics

2
(Laurance and Bierregaard 1997), species may be especially sensitive to edge-effects
(Laurance and Laurance 1999) and more research is necessary to understand the spatial
requirements of tropical species to use a conservation corridor.
Fragmentation in western Ecuador is extensive due to the extreme deforestation in
this region (Haro-Carrión and Southworth 2018; Dodson and Gentry 1991). It is
estimated that as much as 98% of the primary forest of western Ecuador has been lost
(Haro-Carrión and Southworth 2018), and much of the remaining forest exists in discrete
isolated patches surrounded by agriculture (Dodson and Gentry 1991). This deforestation
has caused conservation issues for many native and endemic species. Approximately 15%
of native mammalian species are threatened with extinction, including three of the four
primates existing in western Ecuador (IUCN 2020).
Primates are often advocated as ‘umbrella species’, meaning that conserving
forest swaths large enough to maintain healthy primate populations inherently protects
many species in their range that rely on the microhabitats within the primate territories
(McCann et al. 2003; Lambert 2011; Campos and Jack 2013; Freire Filho and Palmeirim
2019). In addition, many primates provide ecosystem services in the form of seed
dispersal for tree species crucial to forest health and structure (Terborgh 1992).
Commonly, primates also function as ‘flagship’ species, or those that engage public
support for conservation action due to their positive perception as charismatic species
(Caro and O’Doherty 1999). Unfortunately, many neotropical primate populations are in
decline due to habitat fragmentation and hunting (Peterson and Heemskerk 2001; Hilário
et al. 2017). It is estimated that 38.2% of neotropical primates currently are threatened
with extinction (IUCN 2020). Within the neotropics, Ecuador is listed as the fifth most

3
speciose country for primates with 22 species, 11 of which are listed as threatened or
endangered, and four of which reside in western Ecuador (Tirira 2017).
Two of the four primate species that occur in western Ecuador, the Ecuadorian
capuchin (Cebus aequatorialis) and the Ecuadorian mantled howler (Alouatta palliata
aequatorialis), are patchily distributed throughout the entirety of western Ecuador
(Cervera et al. 2018). Both primate species are experiencing population declines due to
extensive habitat fragmentation and conversion (Tirira 2011; Campos and Jack 2013;
Cervera et al. 2015). Although there is evidence that Ecuadorian capuchins and
Ecuadorian mantled howlers utilize regenerating forest (Campos and Jack 2013;
Papworth and Mejia 2015), the extent of usage of this habitat remains unknown.
The Ecuadorian mantled howler is currently listed as “Vulnerable” by the
International Union for Conservation of Nature (IUCN) (Cuarón et al. 2008) but listed as
endangered in Ecuador (Tirira 2011). Population decline of Ecuadorian mantled howlers
is attributed to habitat loss and poaching (Cuarón et al. 2008). These primates form troops
of 5-12 individuals (Cervera et al. 2015) and have a relatively small troop home range
(estimated as 1.3 – 60 hectares [ha]; Neville et al. 1988; Bicca-Marques 2003; Cristóbal‐
Azkarate and Arroyo‐Rodríguez 2007; Arroyo‐Rodríguez and Dias 2010). This species is
strictly herbivorous, primarily consuming leaves with fruits as a supplement, and several
of their food sources are absent from fragmented forests (Arroyo-Rodriguez and
Mandujano 2006). Therefore, highly fragmented forests likely cannot indefinitely sustain
populations. As Ecuadorian mantled howlers act as seed dispersers and are noted to
utilize regenerated and replanted areas (Papworth and Mejia 2015), it is vital to
understand proper habitat management to support this species.

4
The Ecuadorian capuchin is listed by the IUCN as “Critically Endangered”,
predominantly due to intense deforestation throughout its range as well as poaching.
Ecuadorian capuchins appear on a list of the ‘25 most threatened primates in the world’
(Schwitzer et al. 2019), and the authors state that research on how landscape disturbances
affect this species is needed. A predictive model estimated that Ecuadorian capuchin
distribution may be driven by greater canopy cover, low human population density, mild
seasonality, and annual precipitation less than 2 m (Campos and Jack 2013). The model
estimated 5028 km2 of suitable habitat remains for the Ecuadorian capuchin; however,
this estimate includes unprotected forest patches that may be subjected to further
fragmentation where the species may undergo local extinction (Campos and Jack 2013).
By some estimates, in a few decades the range of this species has been reduced to ~1% of
its original distribution (Albuja and Arcos 2007). Further, there is limited information on
the habitat features driving the local presence of Ecuadorian capuchins. These primates
have a varied diet, largely consuming fruits, as well as small vertebrates and invertebrates
(Albuja and Arcos 2007). However, despite Ecuadorian capuchins exploiting a wide
variety of food sources, the larger troop home range requirements exhibited by this
species (500 - 560 ha) showcase that habitat connectivity is crucial to fulfill their
energetic requirements and allow the persistence of this species (Jack and Campos 2012).
To improve local habitat connectivity, the Jama-Coaque Reserve (JCR) in western
Ecuador—a protected area that works with local community members to preserve the last
remaining patches of the coastal Chocó rainforest—established the Three Forest
Conservation Corridor (TFCC) in collaboration with the local towns of Camarones and
Tabuga, the neighboring Bosque Seco Lalo Loor (BSLL), and the IUCN-Netherlands.

5
The TFCC is important because it forms a contiguous 1500-ha protected area known as
the Three Forests Conservation Area (TFCA) that spans three ecologically distinct forest
types: dry forest, moist forest, and cloud forest. These forests are located along an
elevational gradient, which facilitates seasonal movement of wildlife across the landscape
and protects clean water resources for local communities. This initiative is currently
underway and requires a better understanding of the two threatened primate species’
habitat and spatial requirements to inform management decisions regarding future land
acquisition and management of properties immediately buffering the corridor.
Previous efforts to assess the habitat and spatial associations of the Ecuadorian
capuchin and the Ecuadorian mantled howler have been limited due to methodology
employed (i.e., visual surveys: Campos and Jack 2013; Cervera et al. 2015).
Recommendations have been made by neotropical primatologists to use passive
methodologies (such as trail cameras) to monitor these primates and increase detectability
(Campos and Jack 2013). Although terrestrial trail cameras have been utilized to
successfully monitor the Ecuadorian capuchin (Guerrero-Casado et al. 2020), my study is
the first to utilize trail cameras in the canopy paired with acoustic recorders to monitor
these two species.
Objectives of the Study
The objectives of this study were to: 1) assess the spatial distribution of the
Ecuadorian capuchin and the Ecuadorian mantled howler across the TFCA; and 2)
examine the influence of habitat and spatial features at two spatial scales (micro- and
macro-) on the use of various areas within the corridor. I hypothesized that habitat usage

6
of these species will vary across the conservation area and predicted that the primates
would use the forested areas more frequently than agricultural areas. I further predicted a
positive relationship between canopy cover and intensity of usage for the Ecuadorian
capuchin and the Ecuadorian mantled howler due to their primarily arboreal locomotion
(Campos and Jack 2013; Cervera et al. 2015).
Significance of Research
For the TFCC to be successful, the habitat and spatial requirements of these
species must be identified; thus, the results of this research will directly inform
management efforts in the areas immediately adjacent to the TFCC and TFCA. Areas that
are identified as potential movement barriers for these primates will be prioritized for
restoration (if currently farmland) through sustainable agroforestry or for preservation (if
currently forested and locally owned). Third Millennium Alliance (TMA, the NGO that
owns and manages JCR) is working collaboratively with communities to incentivize
sustainable agriculture through improved economic opportunity and inform local farmers
on how to create a more ‘wildlife-friendly’ landscape based on the data gathered.
Additionally, these results might fill a knowledge gap concerning habitat use of the two
primate species within recently created corridors, which are especially crucial for
maintaining habitat of the “Critically Endangered” Ecuadorian capuchin (Campos and
Jack 2013).

7
II. METHODS
Study Site – The Three Forests Conservation Area
This study was conducted along the western coast of Ecuador within the TFCA
(Figure 1), located approximately 11 km south of the equator in the Manabí province.
The TFCA covers 1,500 ha and includes BSLL, JCR, and the TFCC which encompasses
350 ha of forested ridgeline between the two ecological reserves. The three forest types
the TFCA spans are defined by annual precipitation received or elevation. Dry forest is
described by average annual precipitation of 100 – 200 cm, wet forest is characterized by
> 200 cm of precipitation, and cloud forest is defined by an elevation of > 450 meters
above sea level. Agriculture in the TFCA is largely characterized by current and
abandoned pastureland. The TFCC exists along an elevational gradient from sea level to
~650 meters above sea level. The climate is defined by a marked dry season from June
through December and an intense rainy season from January through May (Vera
Barahoma 1993). Some of the pasturelands bordering the TFCA were included for this
study.
Canopy Station Placement
I monitored the use of the TFCA by the Ecuadorian capuchin and the Ecuadorian
mantled howler with twenty AudioMoth (version 1.1, Open Acoustic Devices, United
Kingdom) acoustic recorders (hereafter AudioMoths) and twenty Browning Trail
Cameras (Browning Dark Ops Pro XD, Browning Trail Cameras, Birmingham, Alabama)
(hereafter ‘trail cameras’). Prior to placement of canopy stations, I created a map in QGIS
(version 3.14, QGIS Development Team) to systematically space survey points that

8
would represent canopy station locations. I laid a grid over the sampling extent with cells
spaced 1 ha2 (totaling 1764 cells) and placed a point in the center of a randomly selected
cell. Following this process, I created a 75-ha buffer around each point and excluded all
cells (from further selection) within that buffer. A 75-ha buffer area was specified given
that it is intermediate in size between the home range of the Ecuadorian capuchin and
Ecuadorian mantled howler. I repeated this process until twenty points were placed
(Figure 1).
On the ground, I visited the generated GPS points and identified target trees for
climbing (within 100 m of the generated GPS coordinates, and physically connected to
the surrounding canopy). Once I identified qualifying trees, I determined placement of
the canopy station based on perceived suitability of movement for primates (i.e.,
connecting to other trees, without several small branches to obstruct movement, and wide
enough to support larger animals) and set the climbing line with a Big Shot (Bartlett
Arborist Supply, Marlette, MI, U.S.A.). I then climbed into the canopy and mounted one
AudioMoth and one trail camera (Figure 2), which I will refer to as a canopy station. I
mounted the trail cameras to the tree facing a branch that was suitable for wildlife
movement, and the AudioMoth slightly below to prevent water buildup on the device. I
angled both devices to prevent disturbance to the natural movement of arboreal species. I
removed some vegetation to reduce the instances of non-target stimuli photos (i.e., wind-
blown movement of leaves) and set the trail cameras to collect 3 photos in rapid
succession with a 10 second delay and installed 64 GB SD cards. I set the AudioMoths to
record 10 minutes every hour between 0600 – 1900 hrs and installed 128 GB SD cards.
Due to limited supply, I only placed one Kestrel (D2 DROP) (Nielsen-Kellerman

9
Company, Boothwyn, PA) microclimate sensor (hereafter Kestrel) in each of the four
habitat types at a canopy station. I set the Kestrels to record hourly temperature, relative
humidity, dew point, and heat severity index. Initial establishment of the canopy stations
was completed on 5 January 2020, prior to the start of the rainy season.
To ensure equipment function, I conducted maintenance (replacing batteries and
SD cards, removing any non-target stimuli, and adjusting camera angles) every 12-38
weeks. I conducted the first round of maintenance on 6 January 2020 and started with
stations placed earliest. Delays due to the Covid-19 pandemic prevented me from
returning to Ecuador to complete the second round of maintenance until 9 October 2020.
During this period, I moved three of my canopy stations due to anthropogenic disturbance
compromising the safety of the canopy stations (i.e., chainsaw scars). Additionally, I
acquired more kestrels and placed one in each of the remaining sixteen trees.
To assess potential habitat and spatial associations, I recorded the following
covariates: elevation, canopy cover, vertical obstruction, number of trees connecting to
the canopy station tree, height of the canopy station, and DBH (diameter at breast height)
of the tree (Neam and Lacher 2015) at each canopy station. I recorded canopy cover from
the height of the canopy station using a convex spherical densiometer in each cardinal
direction, then averaged the four measures and converted the canopy cover measures to
be on a scale of 100, instead of 96. I also recorded vertical obstruction, the percentage of
cover from nearby surrounding vegetation, from the level of the canopy station using
light contrast in Canopeo (Oklahoma State University Department of Plant and Soil
Sciences, Stillwater, OK) in each cardinal direction and averaged the four measures.
From the level of the canopy station, I also counted the number of trees connected to the

10
canopy station tree. I used a laser range finder to measure height of the canopy station to
the ground, and I recorded 3 measures to ensure an accurate reading. As many of the trees
had large buttress roots, I measured DBH at the point where the roots no longer extended
beyond the trunk (Figure 3). Additionally, I used satellite imagery from 2020 to estimate
proximity to an artificial edge (e.g., habitat edge created by slash-and-burn techniques for
cattle grazing), human dwellings, and a river (Neam and Lacher 2015). I considered the
variables that were measured at the tree as the micro-level variables, this includes canopy
cover, vertical obstruction, connecting trees, height of the canopy station, and DBH. I
considered the variables that were measured with satellite imagery as the macro-level
variables, this includes distance to artificial edge, human dwellings, river, and elevation.
Acoustic Analysis
I identified the Ecuadorian capuchin and Ecuadorian mantled howler
vocalizations utilizing Kaleidoscope Pro (version 5.19, Wildlife Acoustics). For
Ecuadorian mantled howlers, I used the following parameters: 100 – 750 Hz frequency
range, 0.5 – 5 s vocalization length, and 0.5 maximum inter-syllable gap (Bergman et al.
2016). I then manually identified vocalizations that populated within the given
parameters. As Ecuadorian mantled howlers can be heard at a distance > 1 km, I
conducted a decibel analysis to only include vocalizations that occurred close to the
canopy station (<5 m). Given mantled howler vocalizations have been noted to be 90 dB
from 5 m (Whitehead 1989), I filtered detected calls through Raven (Cornell Lab of
Ornithology) and Equation 1 from Merchant et al. (2015) to determine the decibel level
of vocalizations:

11
SPL = M + G + (20 ∗ log10 [1
Vpp]) + (20 ∗ log10[2Nbit−1])
Where SPL is sound pressure length (dB), M is the sensitivity of the microphone
(-18), G is the gain set for the recorders (-30.6dB), Nbit is the sampling depth (24), and
Vpp is the peak-to-peak voltage. I collected the peak voltage (Vp) in Raven and calculated
the units based on a max kU of 32.77 on Raven and maximum microphone voltage of
3.6.
Vp = Peak/32.77 ∗ 3.6
I then converted the peak voltage (Vp) to the root-mean-square voltage (Vrms).
Vrms = Vp ∗ 1/√2
Finally, I converted the root-mean-square voltage to peak-to-peak voltage (Vpp)
for the decibel analysis.
Vpp = Vrms ∗ 2(√2)
Based off these equations, I only included calls that had a Vp of 30 or greater as
that would convert to a dB of 90, which would suggest that only calls from 5 m or closer
were included in later analyses.
I used the following parameters to populate vocalizations of Ecuadorian white-
fronted capuchins: 1500 – 3000 Hz frequency range, 0.5 – 5 detection length (Gros-
Louis, 2006). I identified the vocalizations of Ecuadorian capuchins using a cluster
analysis with vocalizations from an online database and vocalizations collected during
analysis. I examined the files that clustered with identified vocalizations as the frequency
range of these primates overlaps with several native bird species. Given that Ecuadorian
capuchin calls are not known to travel as far as those of Ecuadorian mantled howlers, I
did not conduct a dB analysis for this species. I collaborated with experts at the

12
University of Texas - Austin to confirm identification of different Ecuadorian capuchin
vocalization types (e.g., contact, aggression) prior to including the vocalization in the
analyses. Although I noted the time of calling, for statistical purposes, acoustic detections
were collapsed into a daily event.
Statistics
I developed a suite of hierarchical, single species, single season occupancy
models in package ‘unmarked’ (Fiske and Chandler 2011) using RStudio (version 4.04, R
Core Team 2021). For these models I used canopy station as the spatial unit and week as
the temporal unit, species detection/non-detection status when the station was active as
the response variable, micro- and macrolevel environmental variables as predictors of
wildlife occupancy and activity, and weather variables as predictors of wildlife detection
and activity. I pooled detections by trail camera and Audiomoths. I elected to conduct
occupancy models given their ability to account for imperfect detections and use of
‘detection’ and ‘non-detection’ data (Mackenzie et al. 2002; Tobler et al. 2015; Rich et
al. 2016; Dertien et al. 2017). For both primates, I considered a week to be my unit of
temporal replication for the occupancy calculation of Ecuadorian mantled howlers and
local presence for the Ecuadorian capuchins where occupancy and local presence differ in
whether canopy stations are considered spatially independent. A week as a unit of
temporal replication was decided to relax the assumption of constant availability.
One of the assumptions of occupancy (Ψ) estimation is that sites are independent
meaning that the detection of a species at one canopy station should not depend on if it
was detected at another at the same sampling occasion (Mackenzie et al. 2002), which is

13
met for the Ecuadorian mantled howler. Due to the large home range of Ecuadorian
capuchins relative to spatial positioning of canopy stations, I could not assume that the
canopy stations were independent. To account for the violation of this assumption, I
estimated local presence (θ) which does not assume the canopy stations are independent
and instead considers each to be a subunit (herein used to indicate a non-spatially
independent part of the unit [the TFCA]), meaning that the local availability is not static
and may vary over time or subunits given the area is occupied (Hines et al. 2010; Bailey
et al. 2014). For the Ecuadorian capuchin, I conducted local presence and detection
models separately given the instability of models conducted with both variables present. I
defined the model parameters according to Bailey et al. (2014): Ψ is the probability the
sampling unit is occupied, θ is the probability the subunit is occupied, p is the probability
of detecting the species. Given the limited data available for weather variables, I created
separate models where day (24-hour period) was considered the temporal unit to compare
the impacts of minimum daily relative humidity, high daily temperature, and the standard
deviation of each on the detection probability of these primates in the dry season and in
the rainy season. I elected to focus on minimum daily relative humidity and maximum
daily temperature given that the Mexican black howler (Alouatta pigra) spends more time
resting on warmer and drier days (Aristizabal et al. 2018), and the standard deviation of
both variables to understand if greater fluctuation of these variables effects detection
probability (Janmaat et al. 2006; Aristizabal et al. 2018).
I conducted a pairwise correlation test and eliminated any variables that had a
coefficient of >0.7 as well as a ‘corvif’ correlation test to determine if any variables were
multicollinear (variation inflation factors were > 3) (Zuur et al. 2010). None of the

14
variables were collinear. I then standardized all variables to have a mean value of 0 and a
standard deviation of 1 (Schielzeth 2010) and eliminated nonsignificant (P > 0.05)
variables in a backwards stepwise manner for detection and occupancy models (Kéry et
al. 2013). Given the number of canopy stations (n=20), global models would not
converge, so I built one ‘starting’ model with the microlevel covariates, and another with
the macrolevel covariates. Once I built the models, I used the model selection procedure
with the ‘modSel’ function and selected the model with the lowest AIC value. If models
were considered competing (ΔAIC < 3), I selected the model with the fewest variables,
favoring parsimony. I then used the ‘fitStats’ function to ensure the best model properly
fit the data. If the model violated the assumptions of ‘fitStats’ (i.e., χ2 p-value < 0.05), I
checked the next competing model for proper fit.
To visualize the distribution of both primate species across the conservation
corridor, I created a separate table of total detections (detections here considered daily)
by canopy station. I loaded these data with coordinates in to QGIS and used the
‘heatmap’ option to create these maps. I also used these heatmaps to visually assess
which of the habitat types both primates were detected in.

15
III. RESULTS
From December 2019 – January 2021, I monitored primates with trail cameras
and acoustic recorders for periods between 64 – 397 nights for a total of 5,980 trap nights
and 204,688 images. I collected a total of 49,337 files from the AudioMoths for a total
8,223 recorded hours. A gap exists in the data due to the Covid-19 pandemic (Table 1). I
coded the observation and site-level covariates as displayed in Table 2.
Detections throughout the TFCA
Detection probability of the Ecuadorian mantled howler throughout the entire
survey period and TFCA was 0.05. Ecuadorian mantled howlers were detected most
frequently in forested areas with detections only occurring at one agricultural site (Figure
4). On a site level basis, the greatest number of Ecuadorian mantled howler detections
were at CF04 (89 of the 241 total detections; Figure 4), a cloud forest site at the
northeastern corner of the TFCA.
Detection probability of the Ecuadorian capuchin throughout the survey period
and TFCA was 0.01. Ecuadorian capuchins were largely detected in cloud and wet forest
with only 1 detection in dry forest and no detections in agriculture (Figure 5). Throughout
the corridor, Ecuadorian capuchins were most frequently detected at CF04 (10 out of 43
detections) a canopy station in the northeastern corner of the TFCA (Figure 5).
Habitat and spatial covariates
The mean elevation was 395.25 m.a.s.l. + 152.58 (standard deviation). The mean
canopy cover was 70.59% + 15.57% (SD), meanwhile the mean vertical obstruction was
16
32.51% + 14.43% (SD). The number of connecting trees averaged 8 trees with a range of
1 to 36 trees. The mean height of the canopy station was 17.02 m + 7.13 m, meanwhile
the mean DBH was 81.42 cm + 35.63 cm. The mean distance to river was 0.17 km + 0.13
km, mean distance to human dwellings was 1.59 km + 0.69 km and the mean distance to
artificial edge was 0.49 km + 0.32 km (Table 3).
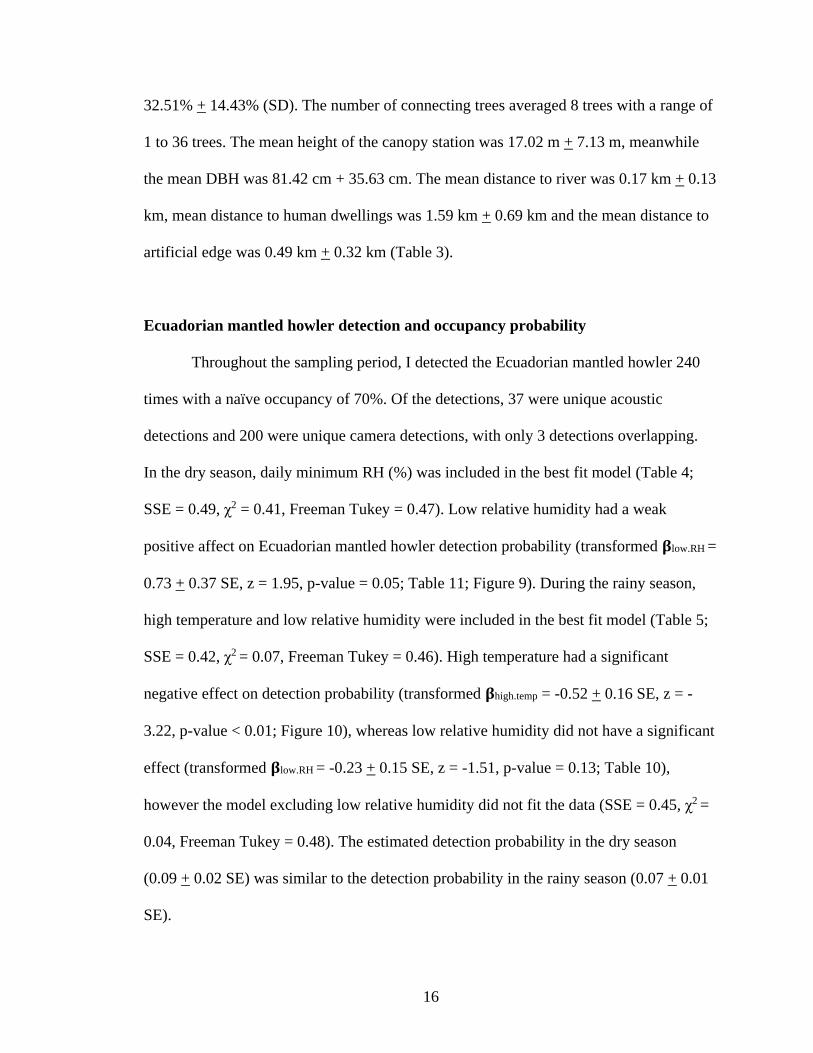
Ecuadorian mantled howler detection and occupancy probability
Throughout the sampling period, I detected the Ecuadorian mantled howler 240
times with a naïve occupancy of 70%. Of the detections, 37 were unique acoustic
detections and 200 were unique camera detections, with only 3 detections overlapping.
In the dry season, daily minimum RH (%) was included in the best fit model (Table 4;
SSE = 0.49, χ2 = 0.41, Freeman Tukey = 0.47). Low relative humidity had a weak
positive affect on Ecuadorian mantled howler detection probability (transformed 𝛃low.RH =
0.73 + 0.37 SE, z = 1.95, p-value = 0.05; Table 11; Figure 9). During the rainy season,
high temperature and low relative humidity were included in the best fit model (Table 5;
SSE = 0.42, χ2 = 0.07, Freeman Tukey = 0.46). High temperature had a significant
negative effect on detection probability (transformed 𝛃high.temp = -0.52 + 0.16 SE, z = -
3.22, p-value < 0.01; Figure 10), whereas low relative humidity did not have a significant
effect (transformed 𝛃low.RH = -0.23 + 0.15 SE, z = -1.51, p-value = 0.13; Table 10),
however the model excluding low relative humidity did not fit the data (SSE = 0.45, χ2 =
0.04, Freeman Tukey = 0.48). The estimated detection probability in the dry season
(0.09 + 0.02 SE) was similar to the detection probability in the rainy season (0.07 + 0.01
SE).

17
The best fit occupancy model for the Ecuadorian mantled howler based on the
binned data included canopy station height on detection and occupancy (Table 6; SSE =
0.52, χ2 = 0.15, Freeman Tukey = 0.46). Although canopy station height was included in
the best fit model for occupancy (transformed 𝛃height = 6.35 + 4.24 SE, z = 1.50, p-value
= 0.13), the 95% confidence interval overlap ‘0’ (CI: -1.90, 14.6; Table 8). However, the
best fit model had a 55x better fit than the null model (Table 6). Predictive plots indicated
that Ecuadorian mantled howler occupancy probability increased from 0.10 to 0.85 as
canopy station height increased from 12 m to 16 m (Figure 6). The estimated proportion
of area occupied by Ecuadorian mantled howlers is 0.71 (95% CI: [0.70 – 0.80]).
Ecuadorian capuchin detection and local presence probability
Ecuadorian capuchins were detected 42 times, with a naïve occupancy of 50%.
There were 3 unique acoustic detections, and 39 unique camera detections. For detection
probability during the rainy season, the best model included minimum RH as a predictor
(Table 5). Although the best model fit the data (SSE = 0.49, Χ2 = 0.75, Freeman Tukey =
0.51), this model is not significantly different from the null, given that the confidence
interval overlapped ‘0’ (Table 10). In the dry season, there were too few Ecuadorian
capuchin detections to conduct any reliable models. For Ecuadorian capuchin detection
based on the binned data, the best fit model included distance to river and height of
canopy station (Table 7; SSE = 0.50, Χ2 = 0.81, Freeman Tukey = 0.49). Distance to
river had a significant negative affect on Ecuadorian capuchin detection (transformed
𝛃river = --0.75 + 0.32 SE, z = -2.40, p-value = 0.02), whereas canopy station height had a
significant positive affect on detection (transformed 𝛃height = 0.78 + 0.24 SE, z = 3.16, p-

18
value < 0.01; Table 9).
The best fit model for Ecuadorian capuchin local presence included distance to
artificial edge as a predictor (Table 6; SSE = 0.42, Χ2 = 0.20, Freeman Tukey = 0.44).
Although distance to artificial edge was included on the top model for Ecuadorian
capuchin local presence (transformed 𝛃edge = 0.84 + 0.58 SE, z = 1.45, p-value = 0.15),
the 95% confidence interval overlapped ‘0’ (CI: -0.30, 2.00; Table 8), likely due to a
small sample size. Predictive plots indicate that Ecuadorian capuchin local presence
increased from 0.1 to 0.8 as distance to artificial edge increased from 0.1 km to 1.2 km
(Figure 7). The estimated proportion of area used by Ecuadorian capuchins is 0.54 (95%
CI: [0.50 – 0.75]).

19
IV. DISCUSSION
Detections from the monitoring efforts affirm that both primate species are using
the TFCC, however, there were some areas that appear unused by both species.
Ecuadorian capuchins were not detected in any agriculture sites whereas Ecuadorian
mantled howlers were only detected at one agricultural site that bordered forest (Figure 5,
Figure 4). While both primate species had a greater number of detections in the cloud
forest than other forest types, I was unable to test whether these differences were
significant. Ecuadorian capuchins were only detected once in the dry forest of the TFCA,
but another trail camera study solely detected Ecuadorian capuchins in the dry forest
(Guerrero et al. 2020), which suggests that the distribution of the cameras may have been
limited given there were only three canopy stations in this habitat type. It is interesting
that the Ecuadorian mantled howlers were only spotted in the edge agriculture site, given
that studies on habitat use have indicated they utilize replanted and regenerating areas
(Papworth and Mejia 2015; Fedigan et al. 1998). However, the regenerating areas within
one of these studies were largely bordered by forest (Papworth and Mejia 2015). This
distinction may indicate that the locations of the canopy stations in replanted areas of the
‘agriculture’ habitat type may be too far from an edge for the Ecuadorian mantled
howlers to move into.
The evidence from this study did not support my prediction that the Ecuadorian
capuchin and Ecuadorian mantled howler increased usage in areas with high canopy
cover. However, in previous studies that identified canopy cover as a potentially
important habitat variable for these primates, satellite imagery was used, whereas I used a
microscale approach with a spherical densiometer and the minimum cover at any location
20
in this study was 43% compared to 0% in previous studies (Campos and Jack 2013;
Cervera et al. 2015). The limited variability of my approach to canopy cover suggests that
a microscale approach may not be appropriate for these primate species; however, it is
also consistent with the findings in one study that a threshold of habitat suitability is
reached above 25% cover for the Ecuadorian capuchin and occurrence does not increase
once this level of cover is reached (Campos and Jack 2013). Similarly, I measured
connectivity on a microscale approach where a macro-scale approach, such as the use of
LiDAR to classify percent cover, may accurately indicate if connectivity (instead
classified as percent tree cover within a specified buffer versus a limited area) affects
presence of these primates. In this study, some canopy station trees had a few trees in the
immediate vicinity, but there was little to no connectivity beyond a small area to facilitate
movement, which may have influenced the results.
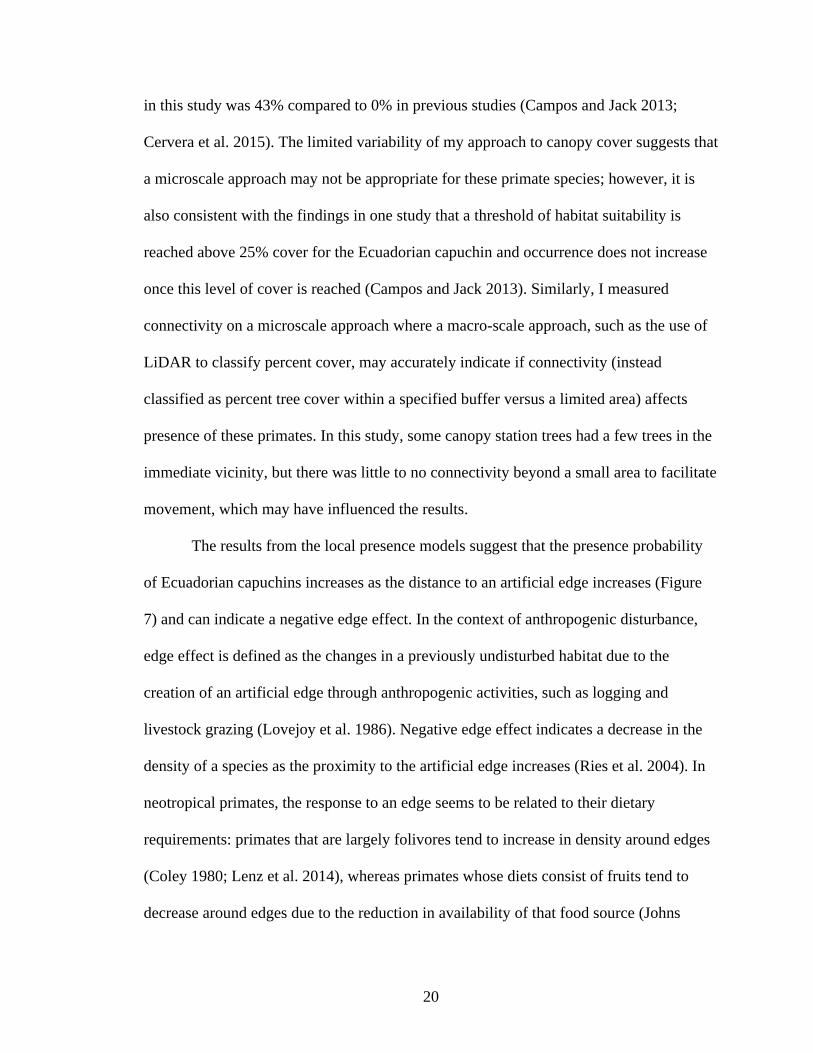
The results from the local presence models suggest that the presence probability
of Ecuadorian capuchins increases as the distance to an artificial edge increases (Figure
7) and can indicate a negative edge effect. In the context of anthropogenic disturbance,
edge effect is defined as the changes in a previously undisturbed habitat due to the
creation of an artificial edge through anthropogenic activities, such as logging and
livestock grazing (Lovejoy et al. 1986). Negative edge effect indicates a decrease in the
density of a species as the proximity to the artificial edge increases (Ries et al. 2004). In
neotropical primates, the response to an edge seems to be related to their dietary
requirements: primates that are largely folivores tend to increase in density around edges
(Coley 1980; Lenz et al. 2014), whereas primates whose diets consist of fruits tend to
decrease around edges due to the reduction in availability of that food source (Johns

21
1997). Ecuadorian capuchins have a varied diet; however, it has been suggested that the
principal component of their diet is fruits and invertebrates (Van Schaik and Noordwijk
1988; Albuja et al. 2018), which may explain the decrease in presence probability with a
decrease in distance to artificial edge.
Greater occupancy probability of Ecuadorian mantled howlers correlated
positively with canopy station height. This result suggests that managers intending to
promote the presence of Ecuadorian mantled howlers could consider planting trees that
reach a maximum height of 15 m or higher (Figure 6). Ecuadorian mantled howlers have
been noted to consume seeds of Inga edulis (Figure 8), a pioneer tree that can grow up to
30 m in height (Lim 2012). Further, previous research indicates that folivorous primates,
like the Ecuadorian mantled howler, consume the leaves of quick growing pioneer
species as their leaves produce weaker chemical defenses to prioritize growth (Coley
1980; Williams-Linera 1990; Lenz et al. 2014). Given my results, I would recommend
that managers in the process of restoring pastureland in western Ecuador focus on
planting tree species such as Inga edulis that are native to western Ecuador and can grow
to a height of >15 m relatively quickly to restore the canopy and promote the activity of
natural seed dispersers such as Ecuadorian mantled howlers. However, given the large
confidence envelope, weak effect size, and the method this covariate was collected
(measuring the height of the canopy station versus the height of the tree) this correlation
should be examined by future researchers.
Few studies have used trail cameras to monitor the Ecuadorian mantled howler
and the Ecuadorian capuchin, and those that have were restricted to ground level cameras
(Guerrero et al. 2020; Lizcano et al. 2015). The study by Guerrero et al. (2020) focused

22
specifically on Ecuadorian capuchins with a similar sample effort (20 cameras with 5,785
trap nights) and resulted in 8 unique detections compared to 39 in this study, whereas
Lizcano et al. (2015) focused on all medium and large mammals with a lower sample
effort (60 cameras with 3,735 trap nights) and had 3 detections for each primate species
compared to 200 unique camera detections for the Ecuadorian mantled howler. These
results likely suggest that canopy trail cameras are more effective compared to ground
cameras for surveys of the Ecuadorian capuchin and Ecuadorian mantled howler, which
reflects their arboreal nature.
Though trail camera surveys are rare, the most used methods to monitor the
Ecuadorian mantled howler and Ecuadorian capuchin are visual encounter surveys or
acoustic triangulation (for the howlers) (Cervera et al. 2018; Karunos et al. 2016; Cervera
et al. 2015; Campos and Jack 2013; Jack and Campos 2012). Studies that use visual
encounter surveys and acoustic triangulation for Ecuadorian mantled howlers have high
success rates and can obtain additional data such as sex ratios, troop size, and age ratios
(Cervera et al. 2018; Cervera et al. 2015) that are not necessarily obtainable with a trail
camera and/or an acoustic recorder. Therefore, I would not recommend passive
monitoring as a reliable alternative to visual encounter surveys and acoustic triangulation
for Ecuadorian mantled howlers. In the case of Ecuadorian capuchins, where visual
encounter surveys often result in fewer than twenty encounters (Cervera et al. 2018;
Karunos et al. 2016; Cervera et al. 2015), except for studies carried out with the intent of
a census (Jack and Campos 2012), I would recommend the use of these passive
monitoring methods to confirm presence in an area.
It is important to note that this study was limited in several aspects. First, many
23
studies utilizing camera traps to monitor species for occupancy do not consider a single
trail camera as the unit of measure, and instead have several trail cameras within each
defined site (Clare et al. 2015; Tobler et al. 2015; Cove et al. 2013). The placement of
twenty canopy stations was determined to balance accommodating the relatively smaller
home range size of the Ecuadorian mantled howlers and the larger home range size of the
Ecuadorian capuchins for the limited area available, and as such I was unable to measure
occupancy for the Ecuadorian capuchins. Detection probabilities for both primates were
also low (<0.1), which may indicate the need for different survey design or methods to
improve this estimation. I was limited in comparing the true effectiveness of acoustic
detections and camera detections given the difference in data acquisition length, the
challenge in identifying Ecuadorian capuchin calls, and the restrictive measures placed in
determining whether an Ecuadorian mantled howler call was to be included in the
analyses. Battery life of the AudioMoths is approximately four months for the
programmed settings and given my inability to check the canopy stations until October of
2020, all AudioMoths had stopped recording by April 2020, whereas most cameras were
still taking photographs. In identifying Ecuadorian capuchin calls, I encountered
problems attempting to create an advanced classifier, and various types of capuchin
vocalizations frequently clustered with bird calls, so it is probable that capuchin
vocalizations from the manual identification process were low-biased leading to an
underestimation of detection probability throughout the TFCA. Additionally, although
Ecuadorian mantled howler monkeys were recorded at every site, only the loudest calls
were included. There is a chance my criteria for inclusion was too stringent, especially
given how differing weather conditions alter how sound travels and may have led to a

24
bias in not including acoustic detections on days that were windy, since wind causes
howler calls to attenuate at quicker rates and creates noise interference on the part of the
detector (Garstang 2004). Lastly, as with the AudioMoths, there were issues with some
cameras running out of battery before others (and, in one case, a camera being stolen),
which caused variability in detection days across canopy stations and may have resulted
in primates not being detected at canopy stations with limited sampling time.
Future Studies
Existing literature on the habitat associations of the Ecuadorian capuchins and
Ecuadorian mantled howler are sparse and lacking in fine-scale resolution. Future studies
should build upon the framework provided in this study and explore the potential impact
tree height has on Ecuadorian howler occupancy, and whether these primates will travel
in shorter trees or if tall trees are a necessity for travel. Further, the impact of distance to
an artificial edge on Ecuadorian capuchins should be examined to potentially determine
at what size a forest patch is uninhabitable for this primate. For this study, agriculture
land use was synonymous with pastureland; however, I have observed Ecuadorian
capuchins and Ecuadorian howlers utilizing land bordering agroforestry properties and I
think it is necessary to further understand the extent to which primates will use these
landcover types. Although I cannot be sure that these relationships conclusively exist, the
large confidence intervals are likely due to small sample sizes and a larger study would
be more telling. I would recommend implementation of these passive survey methods to
further study the Ecuadorian capuchins, and further exploration into how weather patterns
influence the detection probabilities of both species as we were limited by a lack of

25
consistent weather data. Further, I think it would be advantageous to explore the ability of
close-to-ground-level AudioMoths to record Ecuadorian capuchin vocalizations. Given
that Ecuadorian capuchins are known to descend to the ground (Guerrero et al. 2020;
Albuja et al. 2018) and the cost-effectiveness of AudioMoths, this implementation could
provide a means to allow for a simultaneous, coordinated monitoring effort of the
Ecuadorian capuchins across its remaining range.
Conclusion
I would recommend that the TFCA should first prioritize acquiring land in the
northeastern bounds of the corridor for expansion (Figure 4, 5). This area was a hotspot
for both primate species, and it is likely that protecting this area would benefit both
species. While I cannot provide any conclusive remarks about the habitat and spatial
associations of either primate given the limited number of detections, there is potential to
expand on the evidence of microlevel associations of these species. Further, this study
has demonstrated that the use of canopy trail cameras and acoustic recorders is a viable
survey method, although it may serve best in conjunction with visual encounter surveys.

26
V. TABLES AND FIGURES
Table 1: Length of data acquisition by AudioMoths (AM Rec.), trail cameras (Cam.
Rec.), and Kestrels (Kestrel Rec.), as well as days not recording (NR) between January
and October of 2020 by site throughout the TFCA (n = 20). Length was recorded in days.
Site
AM
Rec.
AM NR
2020
Cam.
Rec.
Cam. NR
2020
Kestrel
Rec.
Kestrel NR
2020
AG01 221 170 391 0 251 112
AG02 205 169 374 0 88 -
AG03 64 259 64 259 41 -
AG04 207 167 305 0 89 -
AG05 216 158 305 0 90 -
CF01 139 256 395 0 246 132
CF02 125 205 318 30 88 -
CF03 174 162 166 210 16 -
CF04 181 177 393 0 88 -
CF05 226 165 391 0 89 -
CF06 139 213 131 234 88 -
CF07 177 139 63 219 48 -
CF08 178 138 63 219 48 -
DF01 226 156 326 56 23 -
DF02 219 168 387 0 169 192
DF03 133 254 387 0 89 -
WF01 232 152 232 152 255 123
WF02 239 152 391 0 58 -
WF03 196 181 377 0 92 -
WF04 131 224 289 0 0 -

27
Table 2: Code used for observation-level and site-level covariates to build occupancy
and local presence models for the Ecuadorian mantled howler (Alouatta palliata
aequatorialis) and Ecuadorian capuchin (Cebus aequatorialis) throughout the TFCA.
Covariate Code
Observation-level Covariates
High Daily Temperature (°C) HighTemp
Daily Standard Deviation of Temperature StDevTemp
Minimum Daily Relative Humidity (%) LowRH
Daiy Standard Deviation of Relative Humidity StDevRH
Site-level Covariates
Canopy Cover (%) Canopy
Number of Trees Connected to Monitor Tree (count) Conn
Vertical Cover (%) Vert
DBH (cm) DBH
Distance to River (km) River
Distance to an Artificial Edge (km) Edge
Distance to Human Dwellings (km) Neighbor
Elevation (m.a.s.l.) Elev
Height of the Canopy Station (m) Height

28
Table 3: The minimum (Min.), maximum (Max.), mean, and standard deviation (SD) of
the site-level covariates estimated to assess occupancy and local presence of Ecuadorian
mantled howlers (Alouatta palliata aequatorialis) and Ecuadorian capuchins (Cebus
aequatorialis) throughout the TFCA (n = 20).
Covariate Min. Max. Mean SD
Canopy (%) 43.23 94.01 70.59 15.57
Conn (count) 1.00 36.00 8.05 7.13
Vert (%) 8.71 61.20 32.51 14.43
DBH (cm) 33.00 145.00 81.42 35.63
River (km) 0.00 0.50 0.17 0.13
Edge (km) 0.11 1.15 0.49 0.32
Neighbor (km) 0.45 2.73 1.59 0.69
Elev (m) 130.00 642.00 395.25 152.28
Height (m) 4.40 29.50 17.02 7.13

29
Table 4: The most supported single species detection models for the Ecuadorian mantled
howler (Alouatta palliata aequatorialis) throughout the TFCA (n = 19) in the dry season
(Oct - Nov), where Ψ indicates covariates influencing occupancy probability, p indicates
covariates influencing detection probability, K is the number of parameters on the model,
AIC is Akaike’s Information Criterion, ∆AIC is the difference in reported AIC, and wi is
the AIC weight.
Models by Species K AIC ∆AIC wi
A. p. aequatorialis
Ψ(.), p(LowRH, StDevTemp) 4 171.92 0.00 0.39
Ψ(.), p(LowRH) 3 172.02 0.11 0.37
Ψ(.), p(.) 2 173.92 2.01 0.14
Ψ(.), p(LowRH, HighTemp, StDevTemp, StDevRH) 6 174.90 2.98 0.10

30
Table 5: The most supported single species detection models for the Ecuadorian mantled
howler (Alouatta palliata aequatorialis) and the Ecuadorian capuchin (Cebus
aequatorialis) throughout the TFCA (n = 20) in the rainy season (Jan. – Mar.), where Ψ
indicates covariates influencing occupancy probability, θ indicates local presence
probability, p indicates covariates influencing detection probability, K is the number of
parameters on the model, AIC is Akaike’s Information Criterion, ∆AIC is the difference
in reported AIC, and wi is the AIC weight.
Models by Species K AIC ∆AIC wi
A. p. aequatorialis
Ψ(.), p(LowRH, HighTemp) 4 452.72 0.00 0.47
Ψ(.), p(HighTemp) 3 453.03 0.33 0.40
Ψ(.), p(LowRH, HighTemp, StDevTemp, StDevRH) 6 455.51 2.79 0.12
Ψ(.), p(.) 2 461.55 8.83 0.01
C. aequatorialis
θ(.), p(LowRH) 3 100.05 0.00 0.67
θ(.), p(.) 2 101.50 1.44 0.33

31
Table 6: The most supported single species models for the Ecuadorian mantled howler
(Alouatta palliata aequatorialis) and the Ecuadorian capuchin (Cebus aequatorialis)
throughout the TFCA (n = 20), where Ψ indicates covariates influencing occupancy
probability, θ indicates covariates influencing local presence probability, p indicates
covariates influencing detection probability, K is the number of parameters on the model,
AIC is Akaike’s Information Criterion, ∆AIC is the difference in reported AIC, and wi is
the AIC weight.
Models by Species K AIC ∆AIC wi
A. p. aequatorialis
Ψ(Height), p(Height) 4 684.00 0.00 0.98
Ψ(.), p(.) 2 739.20 55.62 <0.01
C. aequatorialis
θ(Edge), p(.) 3 299.96 0.00 0.26
θ(.), p(.) 2 300.54 0.58 0.20
θ(Height), p(.) 3 300.67 0.71 0.19
θ(River, Edge), p(.) 4 301.72 1.76 0.11
θ(Height, Vert), p(.) 4 302.02 2.06 0.09
32
Table 7: The most supported single species detection models for the Ecuadorian
capuchin (Cebus aequatorialis) throughout the TFCA (n = 20), where Ψ indicates
covariates influencing occupancy probability, θ indicates covariates influencing local
presence probability, p indicates covariates influencing detection probability, K is the
number of parameters on the model, AIC is Akaike’s Information Criterion, ∆AIC is the
difference in reported AIC, and wi is the AIC weight.
Models by Species K AIC ∆AIC wi
C. aequatorialis
θ(.), p(Height, River) 4 291.74 0.00 0.42
θ(.), p(Height, Vert) 4 293.30 1.56 0.19
θ(.), p(Height) 3 293.31 1.57 0.17
θ(.), p(Height, Vert, Conn) 5 293.45 1.74 0.17
θ(.), p(.) 2 300.54 8.80 0.01

33
Table 8: The coefficient values (coeff.), standard errors (SE) and 95% lower and upper
confidence interval (LCI and UCI, respectively) for the weekly binned data for the best
single season models for the Ecuadorian mantled howler (Alouatta palliata aequatorialis)
and the Ecuadorian capuchin (Cebus aequatorialis) throughout the TFCA (n = 20).
Variables by Species Coeff. SE LCI UCI
A. p. aequatorialis
Ψ(Intercept) 3.02 1.83 -0.56 6.60
Ψ(Height) 6.35 4.24 -1.95 14.65
p(Intercept) -1.82 0.14 -2.09 -1.54
p(Height) 0.89 0.14 0.62 1.15
C. aequatorialis
θ(Intercept) 0.22 0.54 -0.83 1.27
θ(Edge) 0.84 0.58 -0.29 1.97
p(Intercept) -2.47 0.18 -2.81 -2.12

34
Table 9: The coefficient values (coeff.), standard errors (SE) and 95% lower and upper
confidence interval (LCI and UCI, respectively) for the best detection model of the
Ecuadorian capuchin (Cebus aequatorialis) throughout the TFCA (n = 20).
Variables by Species Coeff. SE LCI UCI
C. aequatorialis
θ(Intercept) 0.92 0.75 -0.55 2.38
p(Intercept) -3.14 0.28 -3.69 -2.59
p(Height) 0.78 0.24 0.32 1.28
p(River) -0.75 0.32 -1.38 -0.12

35
Table 10: The coefficient values (coeff.), standard errors (SE) and 95% lower and upper
confidence interval (LCI and UCI, respectively) for the best detection models in the rainy
season (Jan – Mar) for the Ecuadorian mantled howler (Alouatta palliata aequatorialis)
and the Ecuadorian capuchin (Cebus aequatorialis) throughout the TFCA (n = 20).
Variables by Species Coeff. SE LCI UCI
A. p. aequatorialis
Ψ(Intercept) 0.28 0.47 -0.63 1.19
p(Intercept) -2.67 0.15 -2.95 -2.39
p(LowRH) -0.23 0.15 -0.53 0.07
p(HighTemp) -0.52 0.16 -0.83 -0.20
C. aequatorialis
θ(Intercept) 7.77 36.9 -64.58 80.12
p(Intercept) -5.37 0.45 -6.26 -4.48
p(LowRH) 0.71 0.41 -0.09 1.51

36
Table 11: The coefficient values (coeff.), standard errors (SE) and 95% lower and upper
confidence interval (LCI and UCI, respectively) for the best detection models in the dry
season (Oct – Nov) for the Ecuadorian mantled howler (Alouatta palliata aequatorialis)
throughout the TFCA (n = 19).
Variables by Species Coeff. SE LCI UCI
A. p. aequatorialis
Ψ(Intercept) -0.53 -0.98 -1.59 0.53
p(Intercept) -2.56 0.28 -3.11 -1.99
p(LowRH) 0.73 0.37 <-0.01 1.46

37
Figure 1: Map of the three forests conservation area. Each green star represents a canopy
station in the corridor that was systematically generated. Colors represent different
habitat types: light blue is cloud forest, light brown is agriculture, purple is wet forest,
and pink is dry forest. The red outline indicates the boundaries of the TFCC and the
property boundaries of the two reserves (BSLL and JCR) are outlined. The boundaries of
the TFCA represent areas with access to place canopy stations. The green star in the inset
maps displays the location of the TFCA within Ecuador.

38
Figure 2: Canopy station – the AudioMoth is positioned slightly under the tree to
decrease chance of water buildup and in a weatherproof case that has a membrane to
allow sound to pass and a silica packet in the event moisture enters. The camera is
mounted on an arm and positioned so it will not interfere with wildlife movement and is
facing the main branch. Not photographed is the kestrel.

39
Figure 3: Canopy station tree with large buttress roots. Dashed red line indicates where
the DBH was measured.
40
Figure 4: Heatmap of total Ecuadorian mantled howler (Alouatta palliata aequatorialis)
detections across the TFCA (n = 20) throughout the survey period. Darker red indicates a
greater number of detections, whereas no shading indicates a lack of detections. The size
of the heatmap shading was chosen for visibility. The green stars indicate the canopy
stations, and the coloration within the outlined corridor indicates habitat type (blue =
cloud forest, purple = wet forest, pink = dry forest, light brown = agriculture), the grey
outlines indicate the protected properties (JCR and BSLL) and the red outline indicates
the TFCC, while the light and dark shading outside of the colored corridor indicates
fragmentation in the region (dark = tree cover, light = no tree cover).

41
Figure 5: Heatmap of total Ecuadorian capuchin (Cebus aequatorialis) detections across
the TFCA (n = 20) throughout the survey period. Darker red indicates a greater number
of detections, whereas no shading indicates a lack of detections. The size of the heatmap
shading was chosen for visibility. The green stars indicate the canopy stations, and the
coloration within the outlined corridor indicates habitat type (blue = cloud forest, purple
= wet forest, pink = dry forest, light brown = agriculture), the grey outlines indicate the
protected properties (JCR and BSLL) and the red outline indicates the TFCC, while the
light and dark shading outside of the colored corridor indicates fragmentation in the
region (dark = tree cover, light = no tree cover).

42
Figure 6: Occupancy probability of Ecuadorian mantled howler (Alouatta palliata
aequatorialis) across the TFCA (n = 20) based on canopy station height measured in
meters, with 95% confidence envelope.
10 12 14 16 18 20
0.0
0.2
0.4
0.6
0.8
1.0
Station Height (m)
How
ler
Occupancy P
robabili
ty

43
Figure 7: Local presence probability of Ecuadorian capuchin (Cebus aequatorialis)
throughout the TFCA (n = 20) based on the distance to an artificial edge measured in
kilometers with 95% confidence envelope.
0.0 0.2 0.4 0.6 0.8 1.0 1.2
0.0
0.2
0.4
0.6
0.8
1.0
Distance to Artificial Edge (km)
Activity P
robabili
ty o
f C
apuchin
s

44
Figure 8: Ecuadorian mantled howler (Alouatta palliata aequatorialis) consuming the
seedpod of Inga edulis at Jama-Coaque Reserve. Photo credit: Euan Ferguson
45
Figure 9: Detection probability of Ecuadorian mantled howler (Alouatta palliata
aequatorialis) across the TFCA (n = 19) during the dry season (Oct. – Nov.) based on the
daily low relative humidity (%) with 95% confidence envelope.
50 60 70 80 90 100
0.0
0.2
0.4
0.6
0.8
1.0
Low Relative Humidity (%)
How
ler
Dete
ction P
robabili
ty

46
Figure 10: Detection probability of Ecuadorian mantled howler (Alouatta palliata
aequatorialis) across the TFCA (n = 20) during the rainy season (Jan. – Mar.) based on
the daily high temperature (°C) with 95% confidence envelope.
25 30 35 40
0.0
0.2
0.4
0.6
0.8
1.0
High Temperature (°C)
How
ler
Dete
ction P
robabili
ty

47
REFERENCES
Albuja, M., P. Moreno, and M. Solorzano. 2018. Aspectos taxonómicos y ecológicos del
capuchino ecuatoriano Cebus albifrons aequatorialis (Primates: Cebidae) en el
Ecuador. Pages 411-426 in B. Urbani, M. Kowalewskl, R. Cunha, et al., editors.
La primatología en Latinoamérica. Ediciones IVIC. Instituto Venezolano de
Investigaciones Científcas, Caracas.
Albuja Viteri, L. H. and R. Arcos. 2007. Evaluación de las poblaciones de Cebus
albifrons cf. aequatorialis en los bosques suroccidentales Ecuatorianos.
Politécnica Biología 27:58-67.
Aristizabal, J. F., L. Lévêque, C. A. Chapman, and J. C. Serio-Silva. 2018. Impacts of
temperature on behaviour of the Mexican endangered black howler monkey
Alouatta pigra Lawrence, 1933 (Primates: Atelidae) in a fragmented landscape.
Acta Zool Bugarica 70:377-382.
Arroyo-Rodríguez, V., and P. A. D. Dias. 2010. Effects of habitat fragmentation and
disturbance on howler monkeys: a review. American Journal of Primatology
72:1–16.
Arroyo-Rodríguez, V., and S. Mandujano. 2006. Forest fragmentation modifies habitat
quality for Alouatta palliata. International Journal of Primatology 27:1079–1096.
Bailey, L. L., D. I. MacKenzie, and J. D. Nichols. 2014. Advances and applications of
occupancy models. Methods in Ecology and Evolution 5:1269-1279.
Beier, P., and R. F. Noss. 1998. Do habitat corridors provide connectivity? Conservation
Biology 12:1241–1252.

48
Bergman, T. J., L. Cortés-Ortiz, P. A. D. Dias, L. Ho, D. Adams, D. Canales-Espinosa,
and D. M. Kitchen. 2016. Striking differences in the loud calls of howler monkey
sister species (Alouatta pigra and A. palliata). American Journal of Primatology
78:755–766.
Bicca-Marques, J. C. 2003. How do howler monkeys cope with habitat fragmentation?
Pages 283-303 in L. Marsh, editor. Primates in fragments. Springer, Boston, MA.
Butchart, S. H., M. Walpole, B. Collen, A. Van Strien, J. P. Scharlemann, R. E. Almond,
J. E. M. Baillie, B. Bomhard, C. Brown, J. Bruno, et al. 2010. Global biodiversity:
indicators of recent declines. Science 328:1164-1168.
Campos, F. A., and K. M. Jack. 2013. A potential distribution model and conservation
plan for the critically endangered Ecuadorian capuchin, Cebus albifrons
aequatorialis. International Journal of Primatology 34:899-916.
Caro, T., T, Jones, and T. R. Davenport. 2009. Realities of documenting wildlife
corridors in tropical countries. Biological Conservation 142:2807-2811.
Caro, T. M., and G. O'Doherty. 1999. On the use of surrogate species in conservation
biology. Conservation Biology 13:805-814.
Cervera, L., D. J. Lizcano, D. G. Tirira, and G. Donati. 2015. Surveying two endangered
primate species (Alouatta palliata aequatorialis and Cebus aequatorialis) in the
Pacoche Marine and Coastal Wildlife Refuge, west Ecuador. International Journal
of Primatology 36:933-947.

49
Cervera, L., S. de la Torre, G. Zapata-Ríos, F. A. Cortés, S. Álvarez Solas, O. Crowe, R.
Cueva, A. de la Torre, I. Dutch-Latorre, M. Fernanda-Solórzano, et al. 2018.
Working together towards one goal: results of the first primate census in western
Ecuador. Primate Conservation 32:1-8.
Clare, J. D., E. M. Anderson, and D. M. Macfarland. 2015. Predicting bobcat abundance
at a landscape scale and evaluating occupancy as a density index in central
Wisconsin. The Journal of Wildlife Management 79:469-480.
Coley, P. D. (1980). Effects of leaf age and plant life history patterns on
herbivory. Nature 284:545-546.
Cove, M., R. M. Spínola, V. L. Jackson, J. C. Sáenz, and O. Chassot. 2013. Integrating
occupancy modeling and camera-trap data to estimate medium and large mammal
detection and richness in a Central American biological corridor. Tropical
Conservation Science 6:781-795.
Cristóbal‐Azkarate, J., and V. Arroyo‐Rodríguez. 2007. Diet and activity pattern of
howler monkeys (Alouatta palliata) in Los Tuxtlas, Mexico: effects of habitat
fragmentation and implications for conservation. American Journal of
Primatology: Official Journal of the American Society of Primatologists 69:1013-
1029.
Cuarón, A. D., A. Shedden, E. Rodríguez-Luna, P. C. de Grammont, and A. Link. 2008.
Alouatta palliata ssp. aequatorialis. In IUCN 2013. IUCN Red List of Threatened
Species. Version 2013.2. http://www.iucnredlist.org.

50
Dertien, J. S., P. F. Doherty Jr, C. F. Bagley, J. A. Haddix, A. R. Brinkman, and E. S.
Neipert. (2017). Evaluating dall's sheep habitat use via camera traps. The Journal
of Wildlife Management 81:1457-1467.
Dodson, C. H., and A. H. Gentry. 1991. Biological extinction in western Ecuador. Annals
of the Missouri Botanical Garden 78:273-295.
Fedigan, L. M., L. M. Rose, and R. M. Avila. 1998. Growth of mantled howler groups in
a regenerating Costa Rican dry forest. International Journal of Primatology 19:
405-432.
Fiske, I., and R. Chandler. 2011. Unmarked: an R package for fitting hierarchical models
of wildlife occurrence and abundance. Journal of Statistical Software 43:1–23.
Freire Filho, R., and J. M. Palmeirim. 2019. Potential distribution of and priority
conservation areas for the Endangered Caatinga howler monkey Alouatta ululata
in north-eastern Brazil. Oryx 54:794-802.
Garstang, M. 2004. Long-distance, low-frequency elephant communication. Journal of
Comparative Physiology 190:791-805.
Goujon, A. 2019. Human population growth. Encyclopedia of Ecology 4:344-351.
Gros-Louis, J. 2006. Acoustic analysis and contextual description of food-associated calls
in white-faced capuchin monkeys (Cebus capucinus). International Journal of
Primatology 27:273-294.
Guerrero-Casado, J., R. I. Cedeño, J. C. Johnston, and M. S. Gunther. 2020. New records
of the critically endangered Ecuadorian white-fronted capuchin (Cebus
aequatorialis) detected by remote cameras. Primates 61:175-179.

51
Hansen, M. C., P. V. Potapov, R. Moore, M. Hancher, S. A. Turubanova, A. Tyukavina,
D. Thau, S. V. Stehman, S. J. Goetz, T. R. Loveland, et al. 2013. High-resolution
global maps of 21st-century forest cover change. Science 342:850-853.
Haro-Carrión, X., and J. Southworth. 2018. Understanding land cover change in a
fragmented forest landscape in a biodiversity hotspot of coastal Ecuador. Remote
Sensing 10:1-21
Heywood, V. H., and R. T. Watson. 1995. Global biodiversity assessment. University
Press for United Nations Environment Programme, Cambridge.
Hilário, R. R., L. Jerusalinsky, S. Santos, R. Beltrão-Mendes, and S. F. Ferrari. 2017. A
primate at risk in Northeast Brazil: local extinctions of Coimbra Filho’s titi
(Callicebus coimbrai). Primates, 58:343-352.
IUCN. 2020. The IUCN Red List of Threatened Species. Version 2020.
https://www.iucnredlist.org. Downloaded on 23 June 2020
Jack, K. M., and F. A. Campos. 2012. Distribution, abundance, and spatial ecology of the
critically endangered Ecuadorian capuchin (Cebus albifrons aequatorialis).
Tropical Conservation Science 5:173-191.
Johns, A. G. 1997. Timber production and biodiversity conservation in tropical rain
forests. Cambridge University Press.
Karunos, C., S. Barney, and M. Ellis. 2017. Habitat preference of two Ecuadorian
primate species. Poster presented at Association of Tropical Biology.
Kenney, J., F. W. Allendorf, C. McDougal, and J. L. Smith. 2014. How much gene flow
is needed to avoid inbreeding depression in wild tiger populations? Proceedings
of the Royal Society B: Biological Sciences 281:20133337.

52
Kéry, M., G. Guillera‐Arroita, and J. J. Lahoz‐Monfort. 2013. Analysing and mapping
species range dynamics using occupancy models. Journal of Biogeography
40:1463-1474.
Kindlmann, P., and F. Burel. 2008. Connectivity measures: a review. Landscape Ecology
23:879-890.
Lambert, J. E. 2011. Primate seed dispersers as umbrella species: a case study from
Kibale National Park, Uganda, with implications for Afrotropical forest
conservation. American Journal of Primatology 73: 9-24.
Laurance, W. F., and R. O. Bierregaard. 1997. Tropical forest remnants: ecology,
management, and conservation of fragmented communities. University of
Chicago Press, Chicago, Illinois.
Laurance, S. G., and W. F. Laurance. 1999. Tropical wildlife corridors: use of linear
rainforest remnants by arboreal mammals. Biological Conservation 91:231-239.
Lenz, B. B., K. M. Jack, and W. R. Spironello. 2014. Edge effects in the primate
community of the biological dynamics of forest fragments project, Amazonas,
Brazil. American Journal of Physical Anthropology 155: 436-446.
Lim, T. K. 2012. Inga edulis. Pages 715-719 in Edible Medicinal and Non-Medicinal
Plants. Springer, Dordrecht.
Lizcano, D. J., L. Cervera, S. Espinoza-Moreira, D. Poaquiza-Alava, V. Parés-Jiménez,
and P. J. Ramírez-Barajas. 2015. Medium and large mammal richness from the
marine and coastal wildlife refuge of Pacoche, Ecuador. Therya 7:135-145.

53
Lovejoy, T. E., R. O. Bierregaard, A. B. Rylands, J. R. Malcolm, C. E. Quintela, L. H.
Harper, K. S. Brown Jr., A. H. Powell, G. V. Powell, H. O. Schubart HO, et al.
1986. Edge and other effects of isolation on Amazon forest fragments.
MacKenzie, D. I., J. D. Nichols, G. B. Lachman, S. Droege, A. J. Royle, and C. A.
Langtimm. 2002. Estimating site occupancy rates when detection probabilities are
less than one. Ecology 83:2248-2255.
Merchant, N. D., K. M. Fristrup, M. P. Johnson, P. L. Tyack, M. J. Witt, P. Blondel, and
S. E. Parks. 2015. Measuring acoustic habitats. Methods in Ecology and
Evolution 6:257-265.
McCann, C., K. Williams-Guillén, F. Koontz, A. A. R. Espinoza, J. C. M. Sánchez, and
C. Koontz. 2003. Shade coffee plantations as wildlife refuge for mantled howler
monkeys (Alouatta palliata) in Nicaragua. Pages 321-341 in Primates in
Fragments. Springer, Boston, MA.
Neam, K. D., and T. E. Lacher Jr. 2018. Multi‐scale effects of habitat structure and
landscape context on a vertebrate with limited dispersal ability (the brown‐
throated sloth, Bradypus variegatus). Biotropica 50: 684-693.
Neville, M. K., K. E. Glander, F. Braza, and A. B. Rylands. 1988, The howling monkeys,
genus Alouatta. Pages 349-453 in Ecology and Behavior of Neotropical Primates.
R. A. Mittermeier, A. B. Rylands, A. F. Coimbra Filho, and G. A. B. Fonseca,
editors. World Wildlife Fund, Washington, D.C.

54
Papworth, S., and M. Mejia. 2015. Population density of Ecuadorian mantled howler
monkeys (Alouatta palliata aequatorialis) in a tropical dry forest, with
information on habitat selection, calling behavior and cluster sizes. Studies on
Neotropical Fauna and Environment 50:65-72.
Peterson, G. D., and M. Heemskerk. 2001. Deforestation and forest regeneration
following small–scale gold mining in the Amazon: the case of Suriname.
Environmental Conservation 28:117-126.
R Core Team. 2021. R: A language and environment for statistical computing. R
Foundation for Statistical Computing, Vienna, Austria. https://www.R-
project.org/.
Rich, L. N., D. A. Miller, H. S. Robinson, J. W. McNutt, and M. J. Kelly. 2016. Using
camera trapping and hierarchical occupancy modelling to evaluate the spatial
ecology of an African mammal community. Journal of Applied Ecology 53:1225-
1235.
Ries, L., R. J. Fletcher Jr, J. Battin, and T. D. Sisk. 2004. Ecological responses to habitat
edges: mechanisms, models, and variability explained. Annual Review of
Ecology, Evolution, and Systematics 35:491-522.
Schwitzer, C., R. A. Mittermeier, A. B. Rylands, F. Chiozza, E. A. Williamson, D. Byler,
S. Wich, T. Humle, C. Johnson, H. Mynott, and G. McCabe. 2019. Primates in
Peril: The World’s 25 Most Endangered Primates 2018–2020. IUCN SSC Primate
Specialist Group, International Primatological Society, Global Wildlife
Conservation and Bristol Zoological Society, Washington, DC.

55
Schielzeth, H. 2010. Simple means to improve the interpretability of regression
coefficients. Methods in Ecology and Evolution 1:103-113.
Smith, A., and G. Seyfang. 2013. Constructing grassroots innovations for sustainability.
Global Environmental Change 23:827-829.
Terborgh, J. 1992. Diversity and the tropical rain forest. Scientific American Library.
Tirira, D. G. 2017. Guía de campo de los mamíferos del Ecuador. Murciélago Blanco,
Quito
Tirira, D. G. 2011. Red Book of the mammals of Ecuador (2nd Edition). Quito, Ecuador:
Mammals and Conservation Foundation, Pontificia Universidad Católica del
Ecuador and Ministry of Abmiente. Special Publication on the Mammals of
Ecuador.
Tobler, M. W., A. Z. Hartley, S. E. Carrillo-Percastegui, and G. V. N. Powell. 2015.
Spatiotemporal hierarchical modelling of species richness and occupancy using
camera trap data. Journal of Applied Ecology 52:413-421.
Van Noordwijk, M. A., and C. P. Van Schaik. 1988. Scramble and contest in feeding
competition among female long-tailed macaques (Macaca
fascicularis). Behaviour 105:77-98.
Vera Barahona, J. 1993. Zonification y ecologia del cultivo. Manual del cultivo de cacao,
2nd edition. Quevedo, Ecuador.
Whitehead, J. M. 1989. The effect of the location of a simulated intruder on responses to
long-distance vocalizations of mantled howling monkeys, Alouatta palliata
palliata. Behaviour 108:73-103.

56
Wilcove, D. S., C. H. McLellan, and A. P. Dobson. 1986. Habitat fragmentation in the
temperate zone. Conservation Biology 6:237-256.
Williams-Linera, G. 1990. Vegetation structure and environmental conditions of forest
edges in Panama. The Journal of Ecology 78:356-373.
Yaap, E. A. 2018. Maintaining connectivity for tropical rainforest mammals in
agricultural landscapes. Dissertation, James Cook University, North Queensland,
Australia.
Zuur, A. F., E. N. Ieno, and C. S. Elphick. 2010. A protocol for data exploration to avoid
common statistical problems. Methods in Ecology and Evolution 1:3-14.


