Morphological Interpretation of
Seamounts in Tutuila, American Samoa:
Inferring Probable Genesis Through Shape and Distribution
Analysis
Morphological Interpretation of
Seamounts in Tutuila, American Samoa:
Inferring Probable Genesis Through Shape and Distribution
AnalysisJed RobertsGEO 580 Project
6/7/2006
Jed RobertsGEO 580 Project
6/7/2006

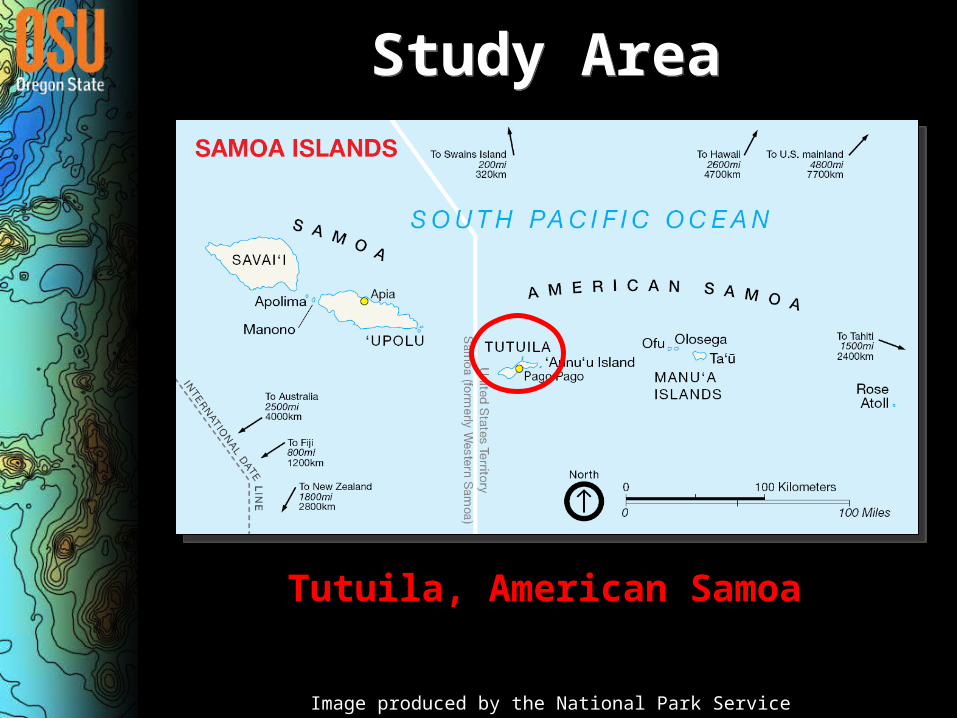
Image produced by the National Park Service
Study AreaStudy Area
Study AreaStudy Area
Tutuila, American Samoa
Image produced by the National Park Service
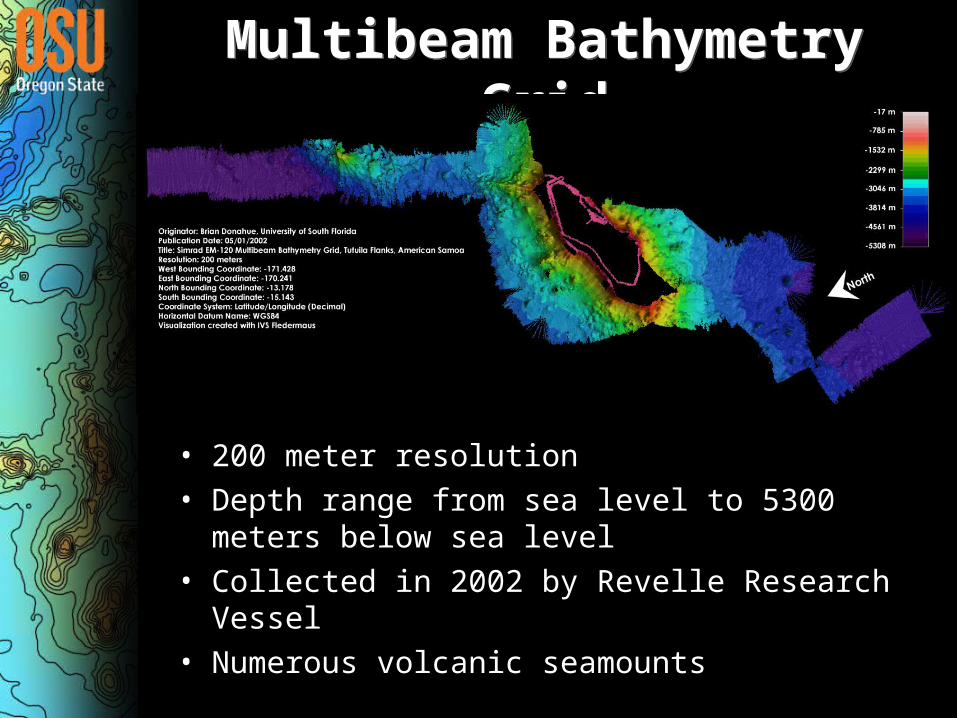
Multibeam Bathymetry Grid
Multibeam Bathymetry Grid
• 200 meter resolution• Depth range from sea level to 5300 meters
below sea level• Collected in 2002 by Revelle Research Vessel• Numerous volcanic seamounts

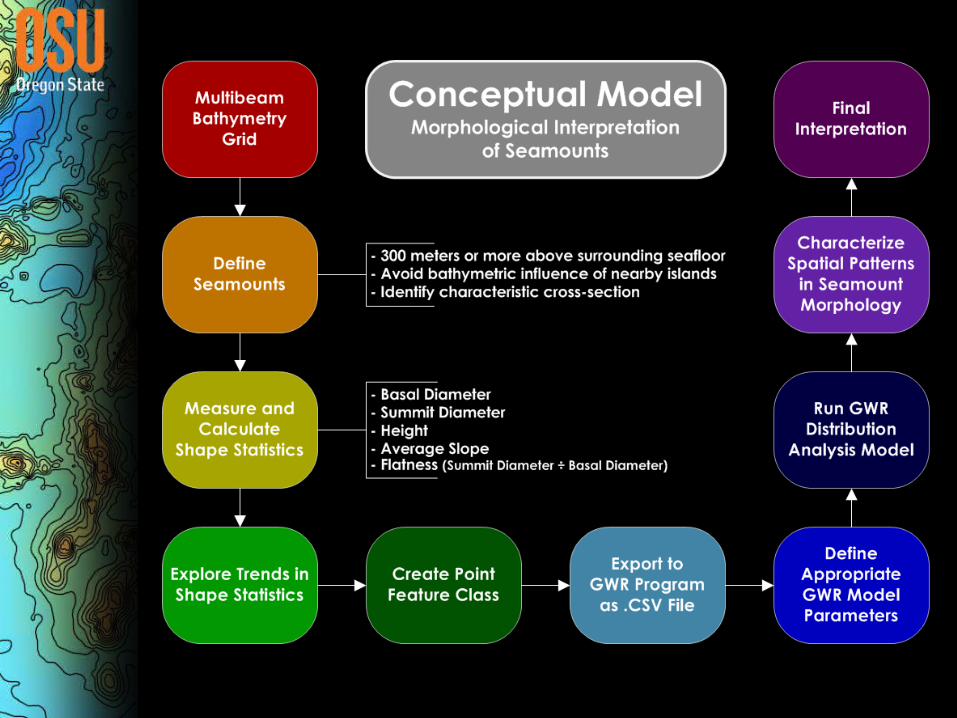
Define SeamountsDefine Seamounts
• 300 meters or more above average baseline• Identify characteristic cross-sections• Avoid bathymetric influence of nearby islands
– Cross-sections typically parallel to bathymetric gradient
• Avoid incomplete cross-sections due to data gaps
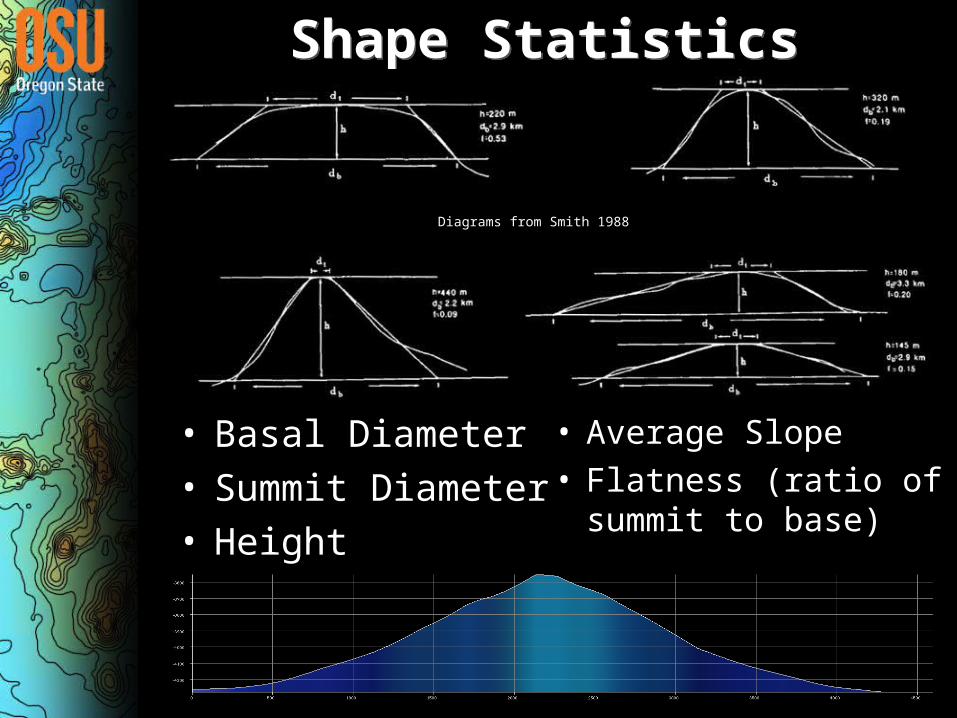
Shape StatisticsShape Statistics
Diagrams from Smith 1988
• Basal Diameter• Summit Diameter• Height
• Average Slope• Flatness (ratio of
summit to base)

Shape Statistic Associations
Shape Statistic Associations
Basal Diameter as control of HeightBasal Diameter as control of Height
Shape Statistic Associations
Shape Statistic Associations
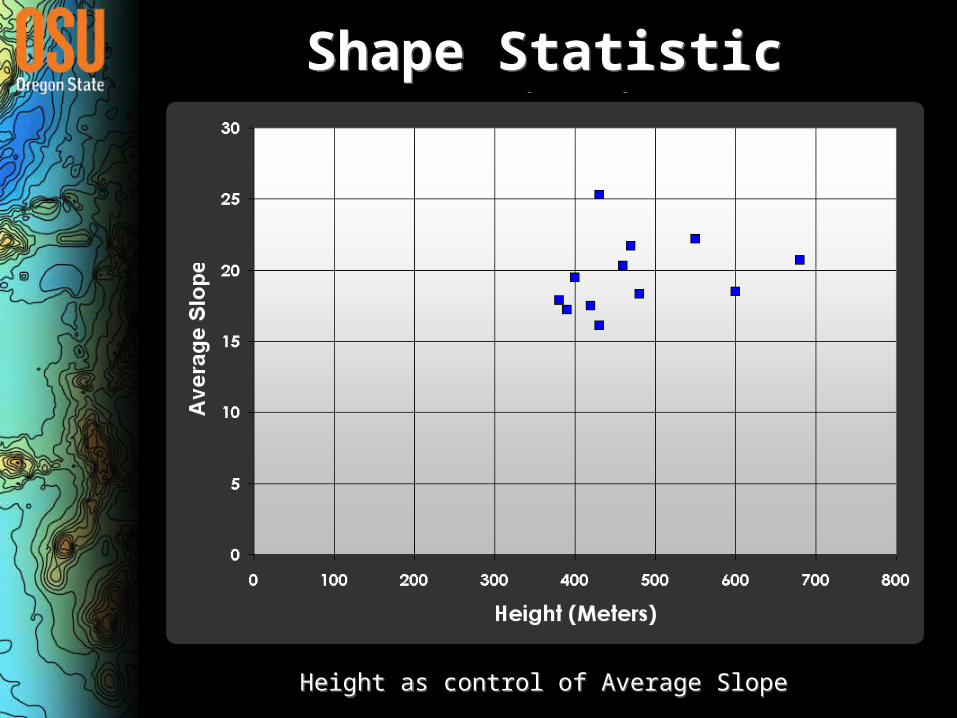
Height as control of Average SlopeHeight as control of Average Slope
Shape Statistic Associations
Shape Statistic Associations
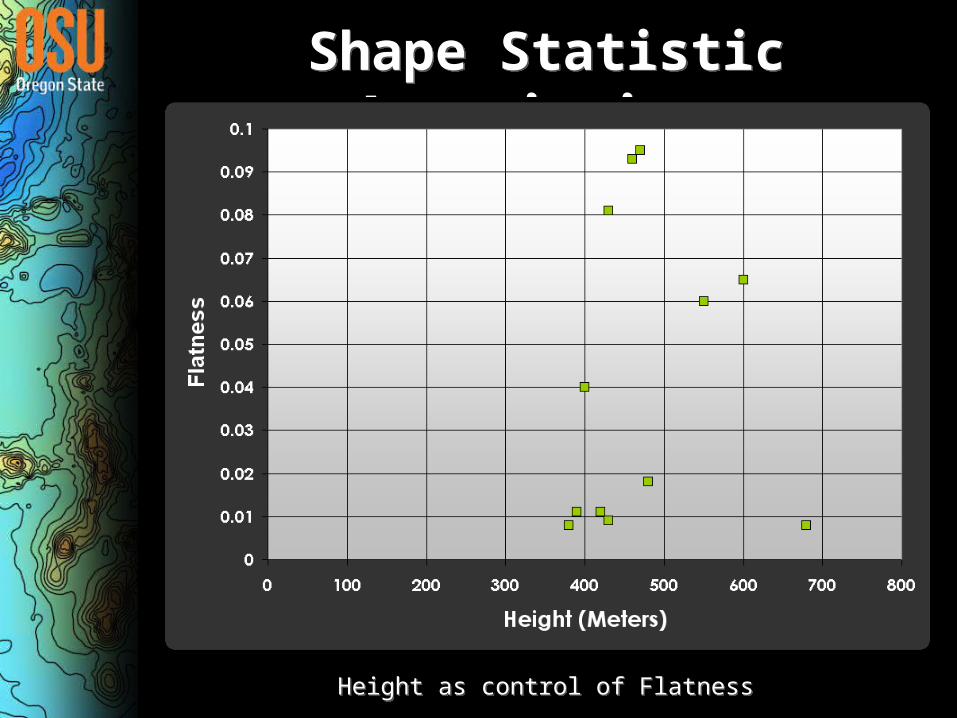
Height as control of FlatnessHeight as control of Flatness

Create Point Feature Class
Create Point Feature Class
• 12 seamounts met criteria• Height range: 380 to 680 meters• Populate feature class with shape
statistics• Export .CSV file for distribution analysis
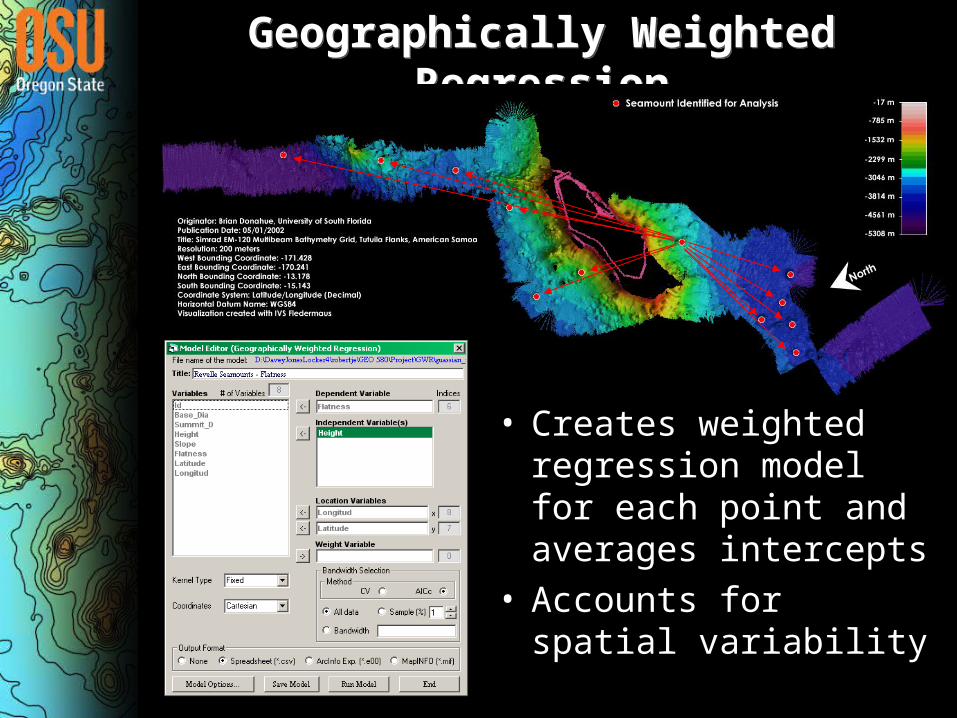
Geographically Weighted Regression
Geographically Weighted Regression
• Creates weighted regression model for each point and averages intercepts
• Accounts for spatial variability

GWR ResultsGWR Results
Basal Diameter as control of HeightBasal Diameter as control of Height
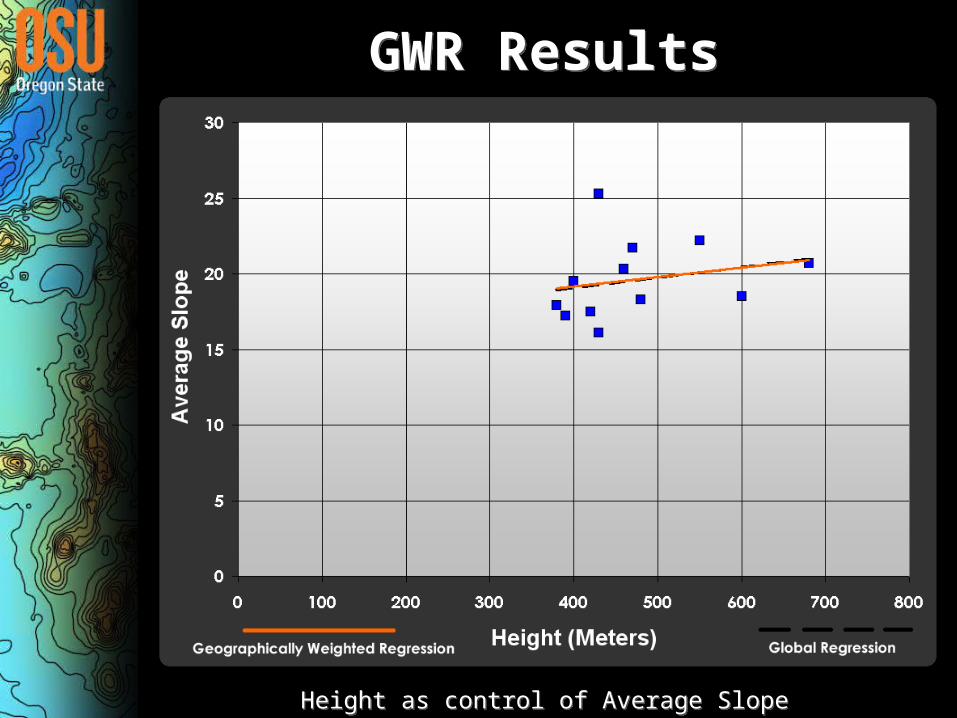
GWR ResultsGWR Results
Height as control of Average SlopeHeight as control of Average Slope
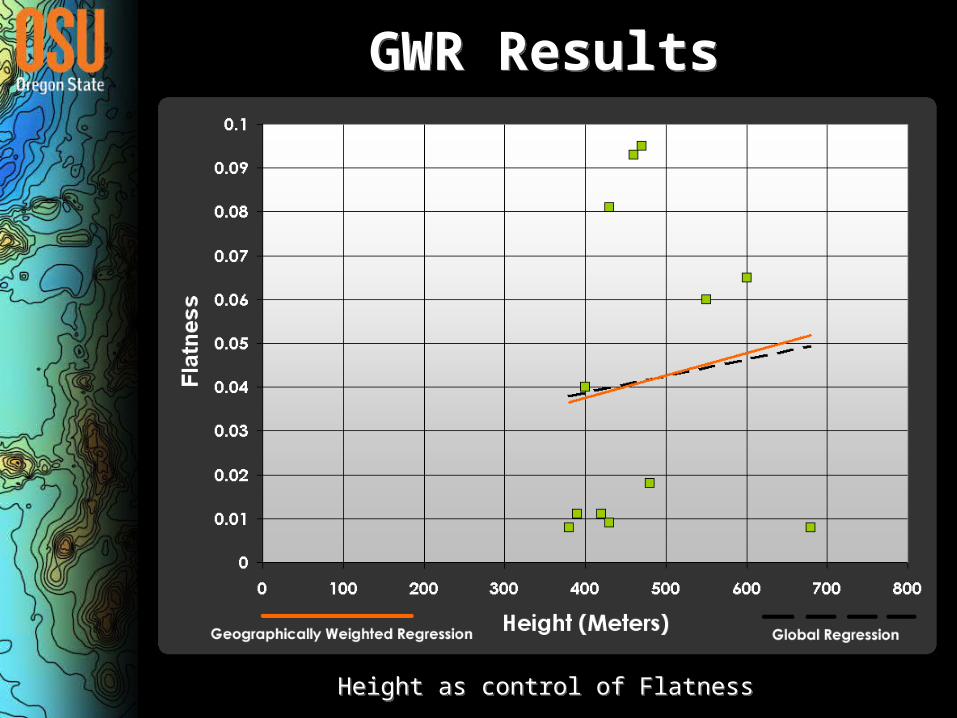
GWR ResultsGWR Results
Height as control of FlatnessHeight as control of Flatness

Identifying Spatial Variability
Identifying Spatial Variability
• Comparison of GWR model to global regression model reveals that spatial variability is a factor in this “association”
• No apparent correlation• Too few observations for statistical significance
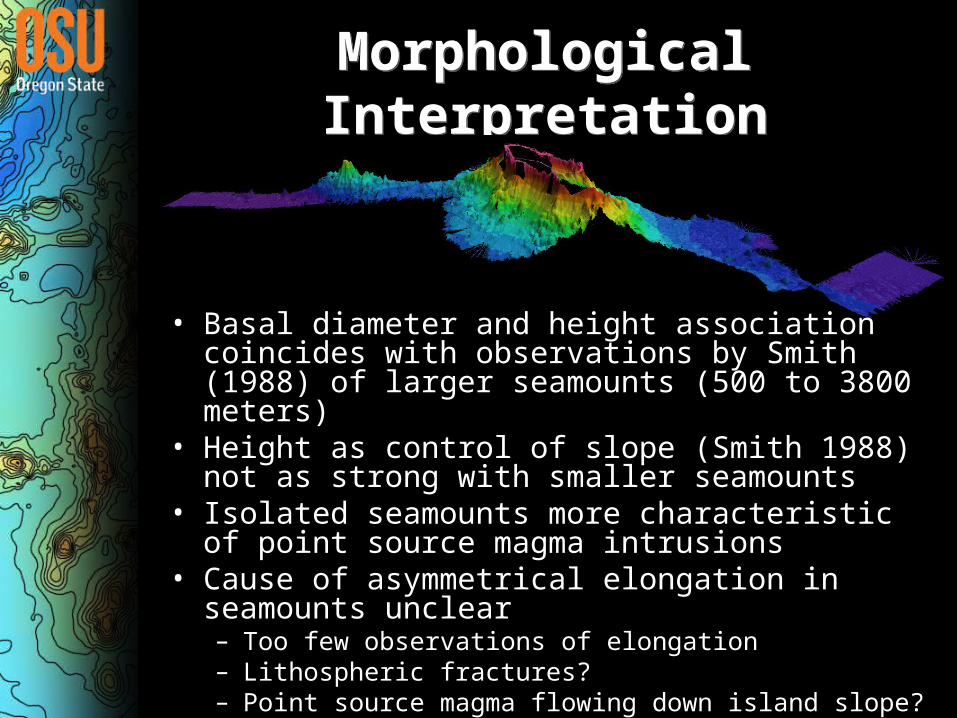
Morphological InterpretationMorphological Interpretation
• Basal diameter and height association coincides with observations by Smith (1988) of larger seamounts (500 to 3800 meters)
• Height as control of slope (Smith 1988) not as strong with smaller seamounts
• Isolated seamounts more characteristic of point source magma intrusions
• Cause of asymmetrical elongation in seamounts unclear– Too few observations of elongation– Lithospheric fractures?– Point source magma flowing down island slope?
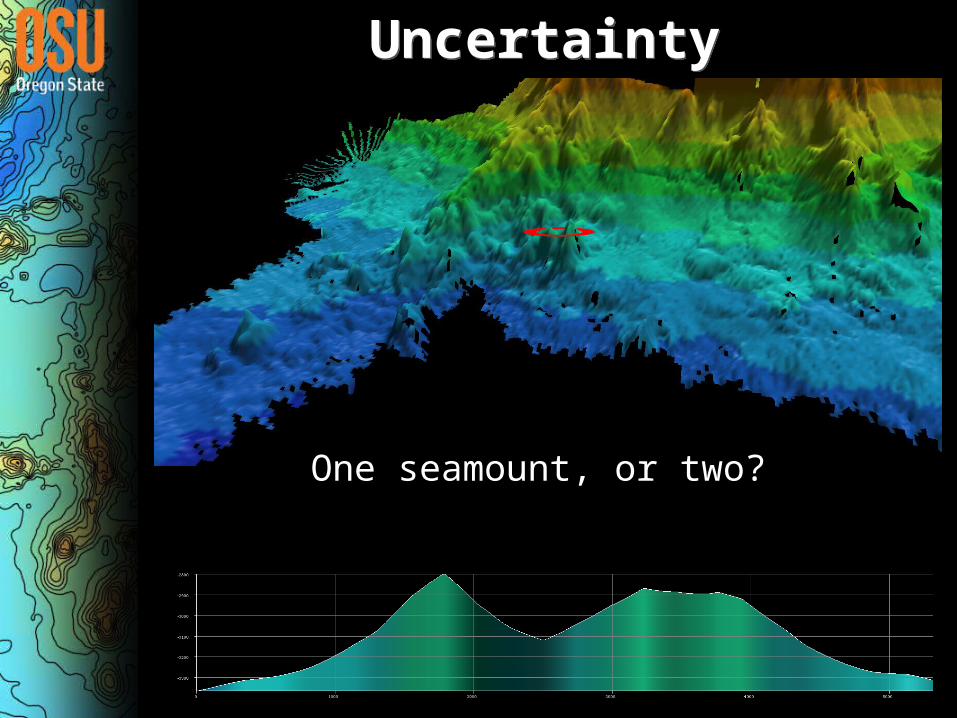
UncertaintyUncertainty
One seamount, or two?
Conclusions and Improvements
Conclusions and Improvements• Need more observations!
– Reduce arbitrary height cut-off– Expand study area (thesis!)
• Use multiple cross-sections for each seamount– Help to account for elongation
• GWR reveals spatial variability, but not significantly with any correlatable variables
• Additional shape statistics– Volume– Maximum slope
ReferencesReferences
Fotheringham, A. S., Charlton, M. E., and Brunsdon C. 1998. Geographically weighted regression: a natural evolution of the expansion method for spatial data analysis. Environment and Planning A. 30: 1905-27.
Smith, D. K. 1988. Shape analysis of Pacific seamounts. Earth and Planetary Science Letters. 90: 457-66.


