
MS-UNIQUE: Multi-model and Sharpness-weighted
Unsupervised Image Quality Estimation
M. Prabhushankar, D.Temel, and G. AlRegib
Center for Signal and Information ProcessingSchool of Electrical and Computer Engineering
Georgia Institute of TechnologyAtlanta, GA
1
Outline
I. Introduction
II. Literature Review
III. UNIQUE: Unsupervised Image Quality Estimation Overview of UNIQUE Unsupervised Learning Mechanism Preprocessing Visualization
IV. MS-UNIQUE: Multi-model and Sharpness-weighted UNIQUE Multi-model Sharpness-weighted Multi-model Visualization
V. Validation
VI. Conclusion
2

Application Average daily shared photos
390 Million
700 Million
70 Million
760 Million
[1]
[1] Adweek, http://www.adweek.com/socialtimes/how-many-photos-are-uploaded-to-snapchat-every-second/621488, Jun 2015[2]LG, “Ultra Clarity, Ultra Scale,” http://www.lg.com/levant_en/Mini-page-ultra/index[3] PetPixel, http://petapixel.com/2015/07/08/instagram-resolution-increase-heres-how-it-affects-image-quality-and-file-size/, July 8, 2015
Smart Capturing
Remote Assistance
[2]
[3]
I. IntroductionImage Quality Assessment : Why?
3
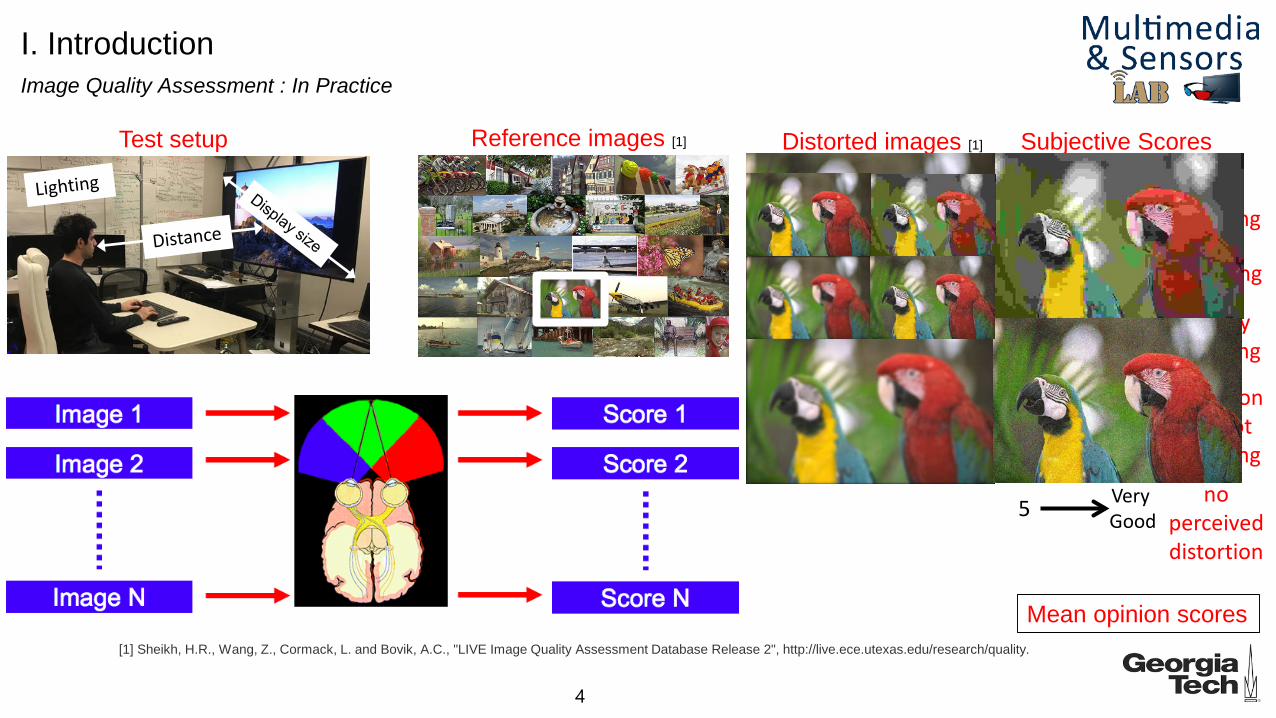
Test setup Reference images [1] Distorted images [1] Subjective Scores
Bad1 veryannoying
Poor2 annoying
Fair3 slightlyannoying
Good4 distortion but not
annoying
VeryGood5 no
perceiveddistortion
[1] Sheikh, H.R., Wang, Z., Cormack, L. and Bovik, A.C., "LIVE Image Quality Assessment Database Release 2", http://live.ece.utexas.edu/research/quality.
Mean opinion scores
I. IntroductionImage Quality Assessment : In Practice
4

Outline
I. Introduction
II. Literature Review
III. UNIQUE: Unsupervised Image Quality Estimation Overview of UNIQUE Unsupervised Learning Mechanism Preprocessing Visualization
IV. MS-UNIQUE: Multi-model and Sharpness-weighted UNIQUE Multi-model Sharpness-weighted Multi-model Visualization
V. Validation
VI. Conclusion
5

II. Literature Review Data-driven Image Quality Estimators
YEAR 2011 2012 2013 2014 2015 2016
QUALITYESTIMATORS LB
IQ
DIIV
INE
CO
RN
IA
BRIS
QU
E
MLI
QM
CB/
SF
QAC
SPAR
Q
Tang
QAF
Kang
IQA-
CN
N++
Li
DLI
QA
Gao
CN
N-S
VR
UN
IQU
E
MS-
UN
IQU
E
Visual system
Color
Do not require
Distortion specific data in the training
Labels in the training
Handcrafting features
Multiple layers/models without handcrafting
6

Outline
I. Introduction
II. Literature Review
III. UNIQUE: Unsupervised Image Quality Estimation Overview of UNIQUE Unsupervised Learning Mechanism Preprocessing Visualization
IV. MS-UNIQUE: Multi-model and Sharpness-weighted UNIQUE Multi-model Sharpness-weighted Multi-model
V. Validation
VI. Conclusion
7
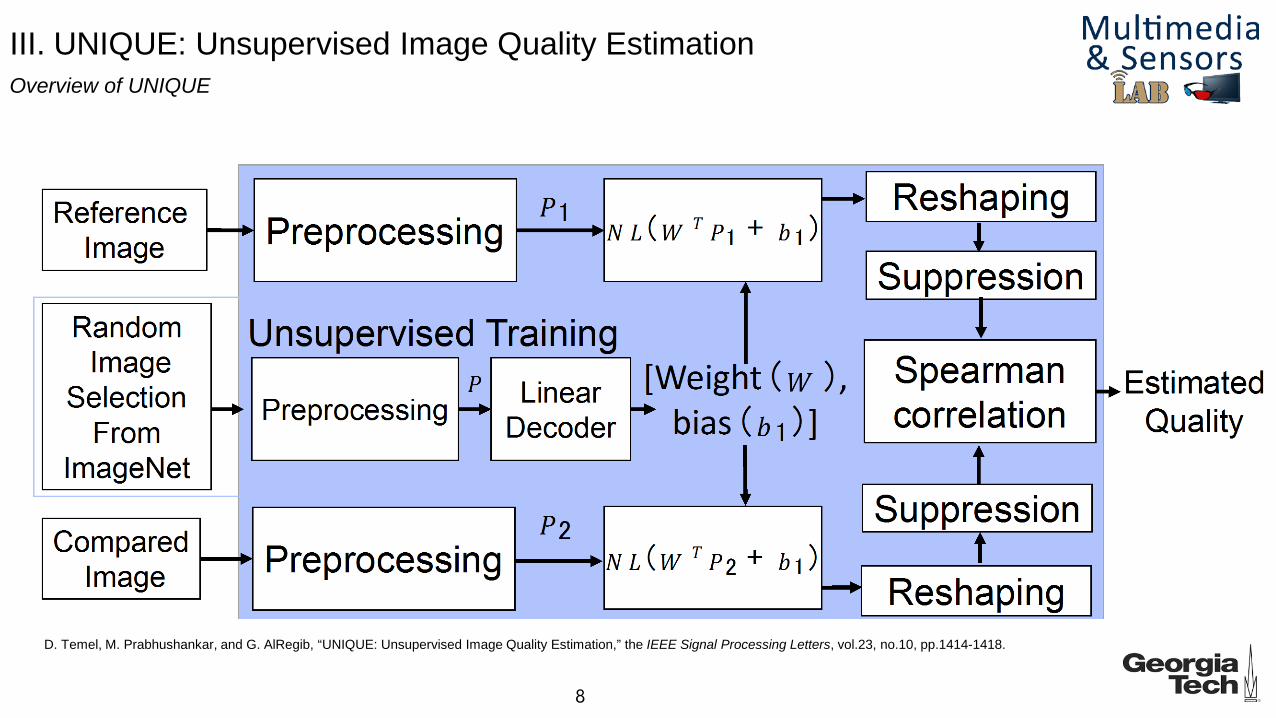
D. Temel, M. Prabhushankar, and G. AlRegib, “UNIQUE: Unsupervised Image Quality Estimation,” the IEEE Signal Processing Letters, vol.23, no.10, pp.1414-1418.
III. UNIQUE: Unsupervised Image Quality EstimationOverview of UNIQUE
8

D. Temel, M. Prabhushankar, and G. AlRegib, “UNIQUE: Unsupervised Image Quality Estimation,” the IEEE Signal Processing Letters, vol.23, no.10, pp.1414-1418.
III. UNIQUE: Unsupervised Image Quality EstimationPreprocessing
9

D. Temel, M. Prabhushankar, and G. AlRegib, “UNIQUE: Unsupervised Image Quality Estimation,” the IEEE Signal Processing Letters, vol.23, no.10, pp.1414-1418.
III. UNIQUE: Unsupervised Image Quality EstimationUnsupervised Learning Mechanism
10
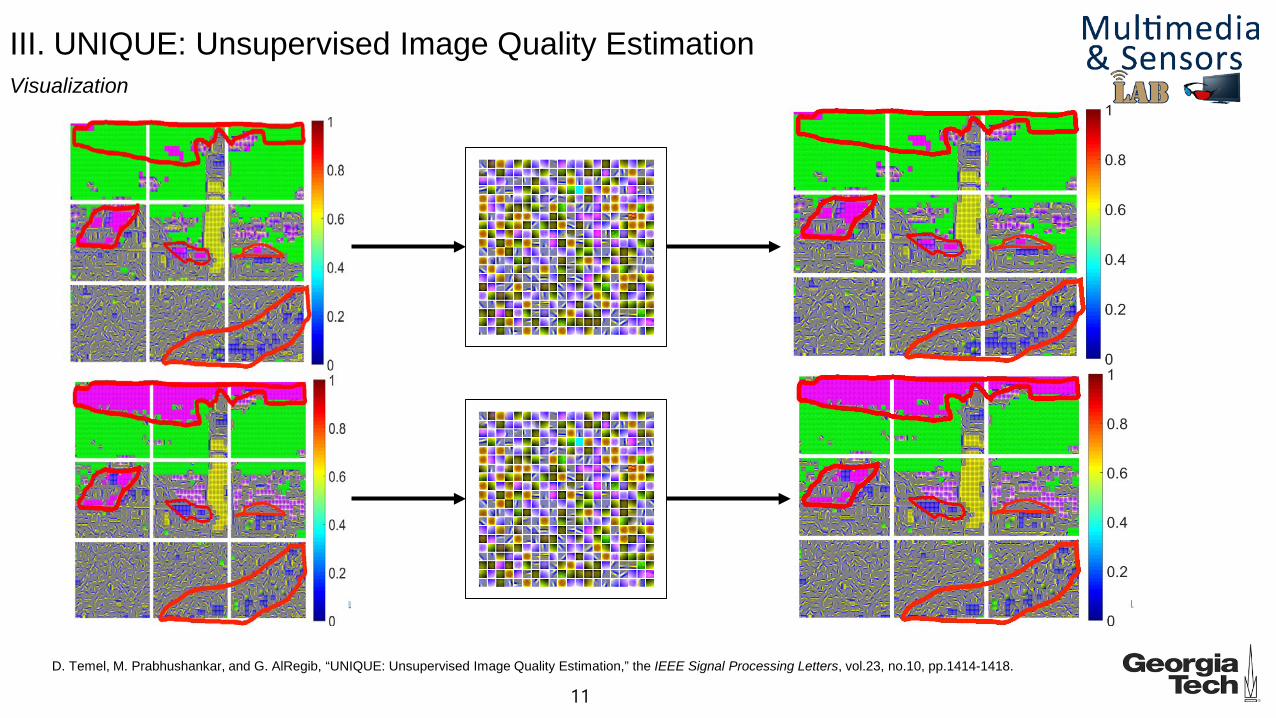
D. Temel, M. Prabhushankar, and G. AlRegib, “UNIQUE: Unsupervised Image Quality Estimation,” the IEEE Signal Processing Letters, vol.23, no.10, pp.1414-1418.
III. UNIQUE: Unsupervised Image Quality EstimationVisualization
11
Outline
I. Introduction
II. Literature Review
III. UNIQUE: Unsupervised Image Quality Estimation Overview of UNIQUE Unsupervised Learning Mechanism Preprocessing Visualization
IV. MS-UNIQUE: Multi-model and Sharpness-weighted UNIQUE Multi-model Sharpness-weighted Multi-model Visualization
V. Validation
VI. Conclusion
12

81 121 169 400 625
IV. MS-UNIQUE: Multi-model and Sharpness-weighted UNIQUEMulti-model
Varying the number of neurons to learn global and local features
13
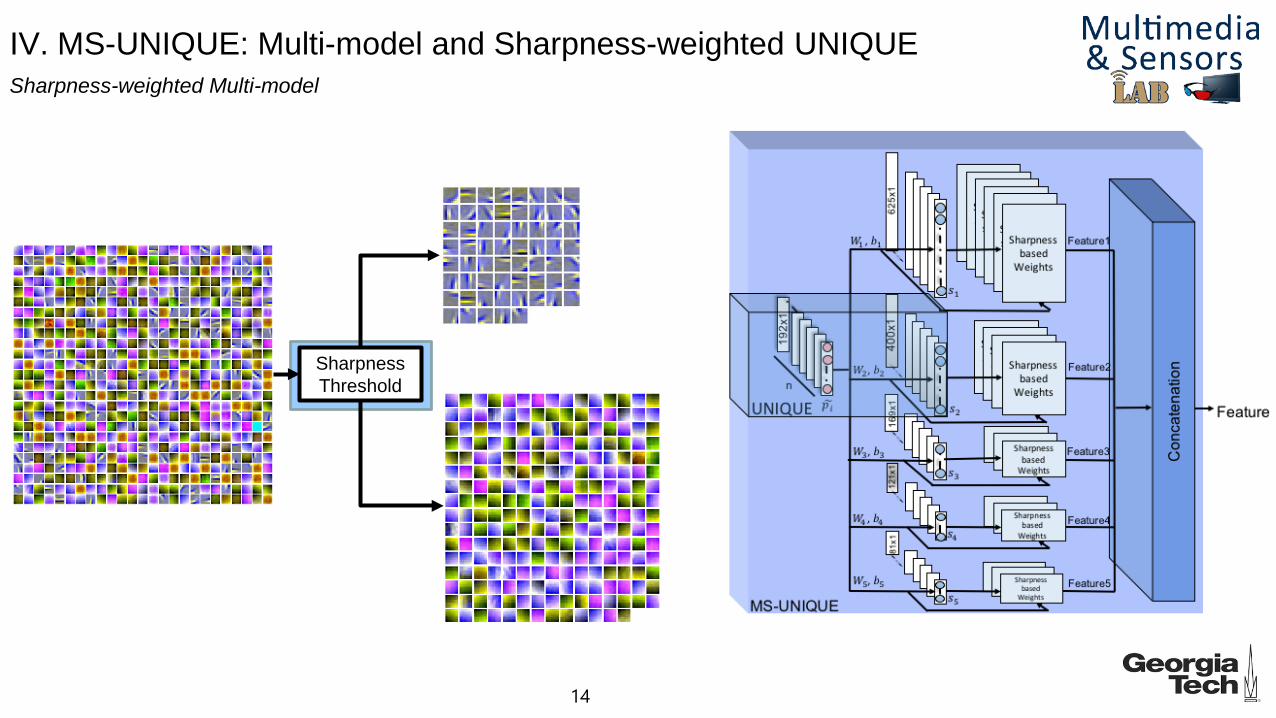
Sharpness Threshold
IV. MS-UNIQUE: Multi-model and Sharpness-weighted UNIQUESharpness-weighted Multi-model
14
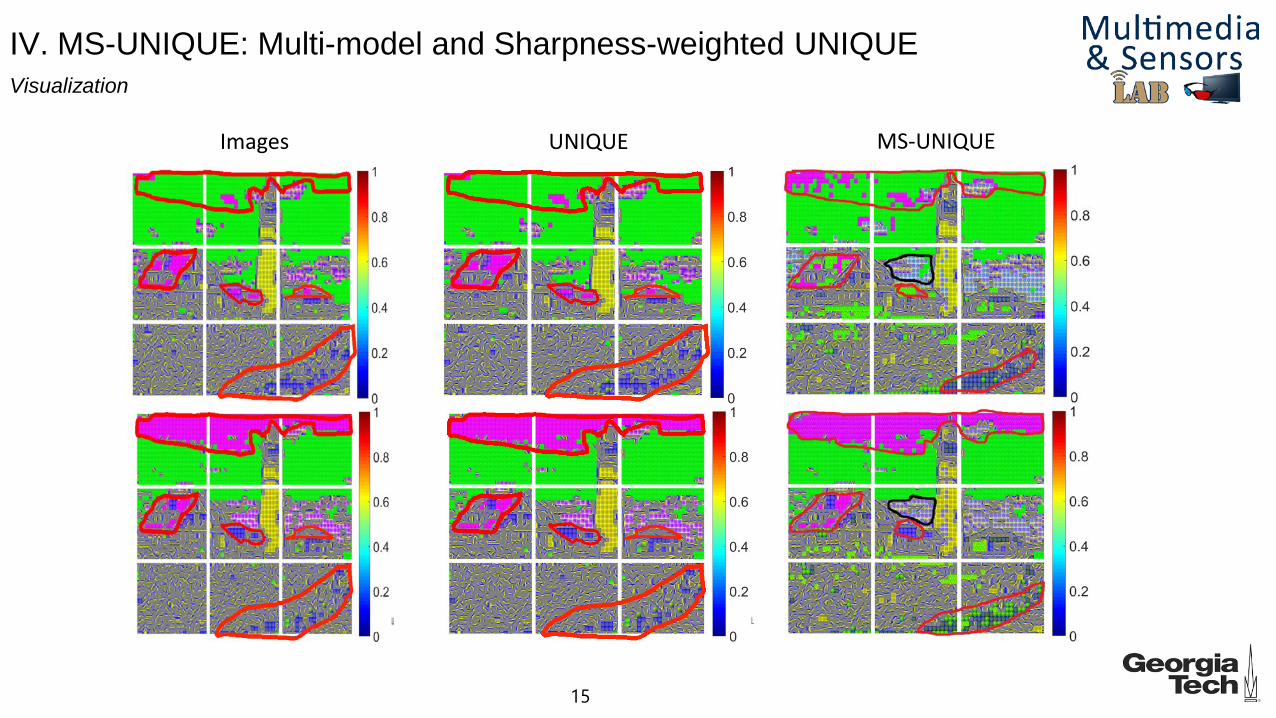
IV. MS-UNIQUE: Multi-model and Sharpness-weighted UNIQUEVisualization
Images UNIQUE MS-UNIQUE
15

Outline
I. Introduction
II. Literature Review
III. UNIQUE: Unsupervised Image Quality Estimation Overview of UNIQUE Unsupervised Learning Mechanism Preprocessing Visualization
IV. MS-UNIQUE: Multi-model and Sharpness-weighted UNIQUE Multi-model Sharpness-weighted Multi-model Visualization
V. Validation
VI. Conclusion
16

LIVE TID Total
Compression 460 375 835
Image Noise 174 1375 1549
Communication 174 250 424
Blur 174 250 424
Color - 375 375
Global - 250 250
Local - 250 250
LIVE database
TID 2013 database
𝐸𝐸[(𝑋𝑋 − 𝜇𝜇𝑋𝑋)(𝑌𝑌 − 𝜇𝜇𝑌𝑌)]𝜎𝜎𝑋𝑋𝜎𝜎𝑌𝑌 1 −
6∑𝑖𝑖=1𝑁𝑁 𝑥𝑥𝑖𝑖 − 𝑦𝑦𝑖𝑖 2
𝑁𝑁(𝑁𝑁2 − 1)
𝑋𝑋𝑖𝑖 ,𝑌𝑌𝑖𝑖 𝑥𝑥𝑖𝑖 ,𝑦𝑦𝑖𝑖𝐸𝐸 𝑋𝑋 − 𝑌𝑌 2
Pearson Linear Correlation Coefficient (PLCC)
Linearity
Root mean square error (RMSE)
Accuracy
Spearman Rank Correlation Coefficient (SRCC)
RankingPerformanceMetrics
Databases
𝑁𝑁𝑜𝑜𝑜𝑜𝑜𝑜𝑜𝑜𝑖𝑖𝑜𝑜𝑜𝑜𝑜𝑜𝑁𝑁𝑜𝑜𝑜𝑜𝑜𝑜𝑡𝑡𝑜𝑜
Outlier Ratio (OR)
Consistency
V. Image Quality Estimators• Validation
17
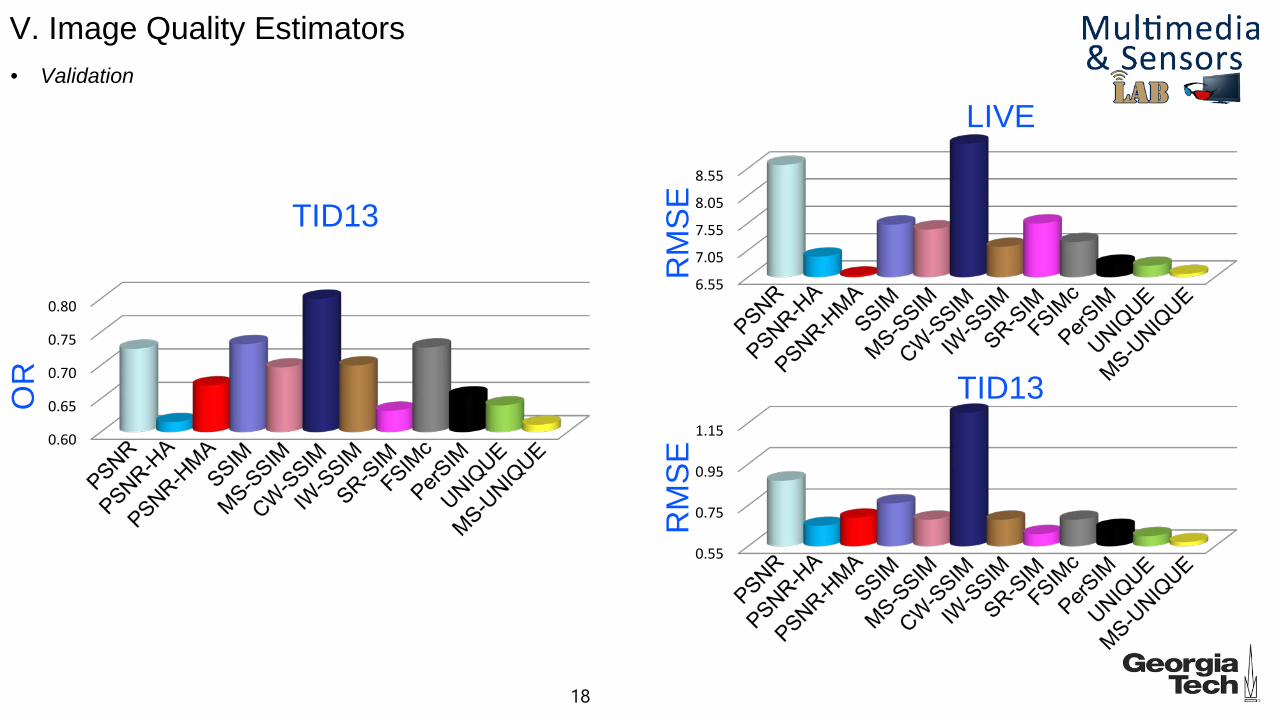
V. Image Quality Estimators
0.60
0.65
0.70
0.75
0.806.55
7.05
7.55
8.05
8.55
0.55
0.75
0.95
1.15
TID13
OR
RM
SER
MSE
LIVE
TID13
• Validation
18
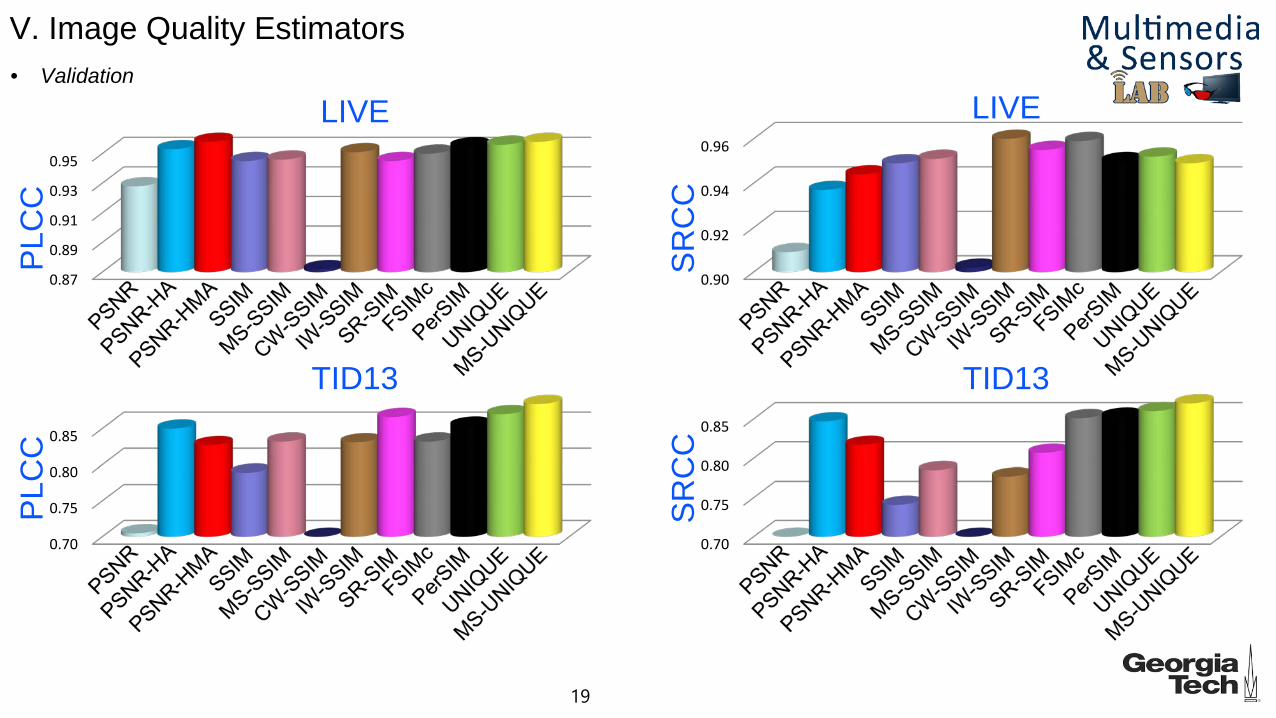
V. Image Quality Estimators
0.90
0.92
0.94
0.96
SRC
C
LIVE
0.70
0.75
0.80
0.85
SRC
C
TID13
0.87
0.89
0.91
0.93
0.95
PLC
C
LIVE
0.70
0.75
0.80
0.85
PLC
C
TID13
• Validation
19

Outline
I. Introduction
II. Literature Review
III. UNIQUE: Unsupervised Image Quality Estimation Overview of UNIQUE Unsupervised Learning Mechanism Preprocessing Visualization
IV. MS-UNIQUE: Multi-model and Sharpness-weighted UNIQUE Multi-model Sharpness-weighted Multi-model Visualization
V. Validation
VI. Conclusion
20

YEAR 2011 2012 2013 2014 2015 2016
QUALITYESTIMATORS LB
IQD
IIVIN
EC
OR
NIA
BRIS
QU
EM
LIQ
MC
B/SF
QAC
SPAR
QTa
ngQ
AFKa
ng
IQA-
CN
N++
Li
DLI
QA
Gao
CN
N-S
VRU
NIQ
UE
MS-
UN
IQU
E
Visual systemColor
Do not require
Distortion specific data in the trainingLabels in the training
HandcraftingMultiple layers/models without handcrafting
VI. ConclusionContributions and Observations
To measure perceived quality Hand-crafting is not sufficient, we should also learn from the data.
Labels are not easy to find, we need to focus more on unsupervised approaches.
Color perception must be included in a comprehensive visual system model.
The best example is our visual system, we should model it as much as we can.21


