ORIGINAL PAPER
Multicriteria versus Cost Benefit Analysis: a comparativeperspective in the assessment of sustainable mobility
Paolo Beria & Ila Maltese & Ilaria Mariotti
Received: 1 May 2011 /Accepted: 11 January 2012 /Published online: 5 February 2012# The Author(s) 2012. This article is published with open access at SpringerLink.com
AbstractBackground and aim The paper focuses on the methodolo-gy for assessing Sustainable Mobility (SM) at the neigh-bourhood scale, and pays attention to two different ex-anteevaluation approaches: the Multicriteria Analysis (MCA)and the Cost-Benefit Analysis (CBA). If MCA is an ac-knowledged technique for the assessment of sustainability atneighbourhood level, CBA is mainly used for infrastructureand large transformation projects. The aim of the paper istwofold: (i) highlight strengths and weaknesses of the twotechniques, especially when assessing SM at the neighbour-hoods scale; (ii) investigate the applicability of MCA andCBA to evaluate some relevant SM strategies and policies atthe neighbourhood scale. To do so, a detailed description ofMCA and CBA is presented and, when it exists, a review oftheir application to assess SM at neighbourhood level is de-scribed. Strengths and weaknesses of the approaches are, there-fore, highlighted and their applicability to some specific SMmeasures are examined.Results and conclusions It results that the joint use of the twomethodologies could overcome their mutual weaknesses, pro-viding a coherent methodology for assessing both efficiencyand effectiveness of SM policies and projects.
Keywords Sustainable mobility . MCA . CBA .
Neighbourhood . Assessment
1 Introduction
Despite sustainability in transport has become a crucial elementin urban planning, it has often received poor attention in devel-oping neighbourhoods [1, 2]. Yet the city is sustainable if itsparts meet sustainability criteria, which appear quite feasible tobe included in neighbourhood design [3, 4]. Moreover, pertain-ing sustainable mobility, a well connected and designed districtlevel does appear as the most effective [5], not only for plan-ning transport and land-use [6], but even for fixing policies andinvestments [7, 8], and for enhancing people participation [9].Moreover, there is some evidence that at the local level, peopleshould mainly concern the common good and have positiveattitude towards collective actions [10].
Evaluation (ex-post and ex-ante) of transportation plansand projects have been carried out in the past, using avariety of methodological frameworks. The methods canbe grouped in two major categories: the single criterionmethod (monetary approach), and the multicrieria methods(non-monetary approach). The Cost Benefit Analysis (here-inafter CBA) belongs to the first category, the MulticriteriaAnalysis (hereinafter MCA) to the second one.
Within this context, the present paper focuses on somemethodological problems in the field of ex-ante assessmentof Sustainable Mobility (“SM” in the following) policies atthe neighbourhood scale. Also in this field the two differentevaluation approaches (MCA and CBA) are considered. IfMCA is a well acknowledged technique for the assessmentof sustainability at neighbourhood level, CBA is mainlyused for infrastructure projects (where public expenses areexpected), and policies.
P. BeriaPolitecnico di Milano – DiAP,Via Bonardi 3,20133 Milan, Italye-mail: [email protected]
I. Maltese : I. Mariotti (*)Politecnico di Milano – DiAP,Piazza L. da Vinci, 32,20133 Milan, Italye-mail: [email protected]
I. Maltesee-mail: [email protected]
Eur. Transp. Res. Rev. (2012) 4:137–152DOI 10.1007/s12544-012-0074-9
Both methodologies present some prickly points. MCA,for instance, is not considering public expense efficiency atall, but only its effectiveness in achieving the SM goal. Onthe other hand, critics often consider CBA not appropriate inmanaging intangible impacts, which are more relevant topolicies and strategies at this scale for achieving SM, andurban quality of life.
The joint use of the two methodologies could, thus,overcome the limitations, providing a coherent methodolo-gy for assessing both efficiency and effectiveness of SMpolicies and projects, and taking coherent and shared deci-sions on policy actions.
Within this context, the aim of the paper is twofold: (i)highlight strenghts and weaknesses of the two techniques -MCA and CBA - especially when assessing SM at the neigh-bourhood scale; (ii) investigate the applicability of MCA andCBA to evaluate some relevant SM strategies and policies atneghbourhood scale.
The paper is structured as follows. After the Introduction,in section 2 a literature review on the MCA and CBAmethodologies is conducted. Section 3 focuses on the appli-cation of the two techniques to assess SM policies, trying toidentify the specificities associated to the scale and to thepeculiar object. A discussion of the strengths and weak-nesses of MCA and CBA is provided in Section 4. Section 5is dedicated to conclusions and future research questions.
2 Multicriteria analysis and Cost Benefit Analysis:definition and literature review
2.1 Multicriteria analysis
Usually, a decision-making problem has more than one goal toreach, and there is always a trade-off between the differentgoals, advocated by different interest groups or stakeholders.Within this context, the MCA is seen by some authors as themost appropriate tool to adopt [11–15]. The MCA is a tool forselecting alternative projects, which have significant social,economic, environmental impact, that allows to take intoaccount several criteria and the stakeholders’ opinions. There-fore, the inclusion of multiple stakeholders in the decisionmaking process is widely acknowledged and it is often acrucial factor for the successful implementation of the mea-sure or project under consideration in the transport sector [15].
Within the MCA, the objectives to reach must be specifiedand corresponding attributes or indicators must be identified.The actual measurement of indicators need not to be in mone-tary terms, but it is often based on scoring, ranking and weight-ing of a wide range of qualitative impact categories and criteria.
The MCA is mainly organised into the following phases:
& Phase 1. Definition of the projects or actions to be judged.
& Phase 2. Definition of judgment criteria.& Phase 3. Analysis of the impacts of the actions.& Phase 4. Judgment of the effects of the actions in terms
of each of the selected criteria.& Phase 5. Aggregation of judgments.
Multi-criteria methods can be classified according to thenature of the decision problem restrictions (implicit or explic-it), and the nature of the results (deterministic or random) [14].
There are several methods that might be applied to trans-port evaluation, the most suitable are: (i) Analytic HierarchyProcess (AHP), (ii) Analytic Network Process (ANP), (iii)REGIME, (iv) ELECTRE family, (v) Multi Attribute Utilityapproach, (vi) ADAM type (for a detailed review, see [16,17]). In the present work particular attention is placed on theAHP, ANP and REGIME, being the AHP and the ANP twoof the most used and well-known multi-criteria techniques,and the REGIME adopted to assess sustainability at theneighbourhood level.
The AHP, developed by Saaty [18, 19], is a three-stagemethod: (i) building the hierarchy; (ii) weighting the indi-cators by a pair-wise comparison, and (iii) calculating thefinal value for the alternatives. The AHP, indeed, consists ofdecomposing a complex decision making process into ahierarchical structure, with the ultimate goal at the top ofthe hierarchy, the primary criteria in the second level, andthe subcriteria in the third level. In the following level theremight be additional subcriteria, while at the bottom level ofthis “probability tree” [14] there are the discrete optionsunder consideration (for a review see, among the others,[20]). The elements of the hierarchy can relate to any aspectof the decision problem—tangible or intangible, carefullymeasured or roughly estimated, well- or poorly-understood—anything at all that applies to the decision at hand.
The stakeholders, public and private, might take part tothe construction of this hierarchy, and “especial care must betaken when building up the hierarchy such that perniciousdouble counting of attributes is avoided” [14]. Once thecriteria and sub-criteria have been settled, a set of weightsis required. These weights represent the relative importanceof the criteria, subcriteria and attributes belonging to aspecific nest in the hierarchy. According to the originalprocedure developed by Saaty, these weights are obtainedfrom pairwise comparison matrices, for each nest in thehierarchy. Once weights are available, the hierarchical struc-ture is collapsed, following a folding back procedure. Foreach option under study, there will be a final weight. Thesefinal weights are used to rank the options.
Another procedure that is widely adopted is the ANP. TheANP provides a general framework to deal with decisionswithout making assumptions about the independence ofhigher level elements from lower level elements and aboutthe independence of the elements within a level. In fact the
138 Eur. Transp. Res. Rev. (2012) 4:137–152
ANP uses a network without the need to specify levels as ina hierarchy. Influence is a central concept in the ANP. TheANP is a useful tool for prediction and for representing avariety of competitors with their surmised interactions andtheir relative strengths to wield influence in making a deci-sion (for a review see, among the others, [21]).
The ANP is a coupling of two parts. The first consists ofa control hierarchy or network of criteria and subcriteria thatcheck the interactions. The second is a network of influen-ces among the elements and clusters. The network variesfrom criterion to criterion and a different supermatrix oflimiting influence is computed for each control criterion.Finally, each of these supermatrices is weighted by thepriority of its control criterion and the results are synthesizedthrough addition for all the control criteria.
With the ANP a problem is often studied through acontrol hierarchy or control system of benefits, a secondfor costs, a third for opportunities, and a fourth for risks, andeach is represented in the controlling system. The synthe-sized results of the four control systems are combined bytaking the quotient of the benefits times the opportunities, tothe costs times the risks for each alternative, then nor-malizing the results over all the alternatives to determinethe best outcome.
The REGIME method uses pairwise comparison (for adetailed review see [22, 23]) on the basis of which a syn-thetic index is calculated. The index defines a rankingamong alternative options: the higher is the index, the mostpreferable is the option. In this case, the synthetic indexexpresses the level of performance of the different selectedindicators as respect to the criterion referring to each ana-lyzed experiences, and make them explicit in the ‘informa-tion matrix’. In the REGIME analysis the main focus is thesign of differences between impacts of alternatives. In gen-eral terms, an evaluation table is given and composed byscores of a number ‘n’ of alternative options with respect to‘m’ criteria. In the case of ordinal information, the weightcan be represented by means of rank orders in a weightvector: the higher the value of the weight, the better thecorrespondent criterion. The alternative options will becompared pairwise for all criteria and for two alternativechoice options, the difference of the criterion scores isassessed.1
2.2 Cost benefit analysis
Cost Benefit Analysis is the most used evaluation tech-nique for assessing infrastructural investments. In the
transport field, it is the basic tool in the majority ofcountries in Europe ([24]; OECD, ECMT [25]) and inthe rest of the world ([26]; EVA TREN [27]), and it isalso widely adopted by all the international bodies ([28,29]).
A number of official guidelines exist.2 They, despitesome differences in how a CBA must be actually performed,always refer to one single common theoretical framework. Itis not the aim of the present paper to go in deep with thewell known CBA theory, however, some key aspects can bepointed out.
Firstly, the CBA is based on monetisation and inter-temporal discount. Money is the measure unit used as acommon numerary to translate all costs and benefits associ-ated to an investment or a policy. Apart direct monetarycosts in perfect markets (e.g. untaxed cost of energy) whosemonetisation is trivial, also non-market goods and goodstraded in an imperfect market are quantified. The first ones(e.g. time or environmental costs) are translated into thecommon numerary by means of the willingness to pay orby deriving prices from substitute markets (hedonic pricesmethod). The second ones are translated into their opportu-nity cost by subtracting taxes (e.g. fuel prices) and bylooking at the direct effect only (e.g. shadow price oflabour cost).
Once all relevant effects of an investment are quantified,the concept of inter-temporal discount is used to translatefuture costs and benefits to present day by means of a socialdiscount rate. In this way, the future can be compared withpresent.
The core of CBA technique is the social surplus, sum ofusers’ surplus, producers’ surplus, and, if the case, non-users’ and Government surplus. Surplus is the differencebetween the willingness to pay/sell of users/producers for agood (which is the combined effect of perceived utility andincome distribution), and the effort needed to obtain suchgood (the monetary cost or any other kind of effort). Ascheme generates a variation of surplus, between the situa-tion “with” and “without” it. Following this concept, CBAessentially compares among trade-offs: total benefits mustexceed the total opportunity cost of consumed resources(labour, time, monetary costs, etc.) to make a project feasible.Otherwise, social cost exceeds social benefits and the schemeshould be rejected.
In order to have a significant result, two hypotheses mustbe fulfilled. The first is represented by the Kaldor-Hickscriterion [30], which states that a resources allocationchange is efficient if the surplus obtained by some actors
1 A problem of the REGIME method is the lack of the relevantcondition of independence from irrelevant alternatives: an irrelevantalternative can change the rank of the relevant ones. This limitation isparticularly severe when assessing public policies.
2 Among the most recent and complete official guidelines, it can bementioned the one used by the European Commission DG Regio ([92,94]). Important are, also, some national guidelines ([(DfT 95] for theUK; Eijgenraam et al [96] for the Netherlands; CEDEX [97] for Spain,etc.) or mode specific guidelines (i.e. the EIB [98] for rail investment).
Eur. Transp. Res. Rev. (2012) 4:137–152 139
exceeds the surplus losses paid by other actors, i.e. if thebenefit for a person can be compared with the cost ofanother one. The second hypothesis assumes that a schemeis marginal, i.e. does not change upstream and downstreammarkets.
From a practical viewpoint, transport CBA usually quan-tifies the investment plus running cost of a scheme andcompare it with direct benefits, that usually are representedby time, running costs and environmental cost savings.Recently, CBA can also include wider benefits, i.e. mac-roeconomic benefits that are not subsumed in the directbenefits (agglomeration effects, labour pooling, efficien-cy; see 3.2).
Moving to the topic of SM policies, several quantitativestudies do exist. For example, Farrell et al. [31] and Beria[32] assess quantitatively the effect of different mobilitypolicies in terms of avoided emissions, but only in termsof policies’ effectiveness. They, however, do not evaluatethe costs associated to such policies, at least in strict micro-economic terms, and thus they do not perform a socio-economic assessment.
In contrast with the importance of CBA for infrastructuralinvestments, in fact, the use of such tool for softer measures,typically those associated with sustainable mobility, is lesscommon. The above cited examples of CBA guidelinesactually refer to infrastructural investments. Motivationsthat lay behind to the less common application of CBA topolicies assessment are clear and will be discussed in awhile. However, some examples of CBA applied to policyanalysis exist in scientific literature, together with someapplications.
From a general perspective, Farrow and Toman [33] statethat CBA can be used to improve environmental regulation.Its limits must be known, but it is a necessary tool to copewith scarcity of resources. They describe an evaluationprocess that reflects the same flow used in physical invest-ments: the definition of a base scenario in which the state ofthe world goes on with already decided actions, the definitionof a complete set of policy alternatives, the identification ofthe changes to the costs and benefits due to the policies, theassessment and finally a sensitivity/risk analysis in order to—to evaluate robustness.
A warm debate is open on the limits the use of CBA inthe environmental field policies. Among many, Heinzerlingand Ackerman [34], Hahn [35], and Turner [36] analyse,from radically different viewpoint, pros and cons of theapproach. While the first heavily criticise the approach,claiming that it is trying to price priceless things, the othertwo conclude that, despite the well-known limitations of thetechnique, it still plays a role also in the environmentalpolicy appraisal. In particular, Turner [36] revises the rele-vant literature on the topic, underlining that CBA usefulnessis particularly true if moving from a prescriptive role to that
of information and decision support and when scarcity ofresources exists. Only in the policies or actions involving“values” (poverty, cultural aspects, beauty, etc.) the role ofCBA must be only partial. In general, CBA is seen as part ofa multiple-criteria policy analysis process.
Another specific field of policy assessment in which thedebate on CBA is particularly active is that of safety intransport. For example, Elvik [37] analyses the conditionsunder which applying CBA in safety policies is justified ornot, showing that it is appropriate if used as a tool to find“the most cost-effective measures to reduce the number ofaccidents and injuries”. Wijnen et al. [38] go more into thepractice and present the method to assess safety effects (bythe estimation of the value of a statistical life).
However, apart from specific ethical and theoreticalreflexions on the applicability of CBA to policy analysis,fewer contributions exist explaining “how” to perform aCBA of a generic policy instead of an infrastructure. In fact,all manuals and theories usually refer to the “physical”projects, involving an investment cost and some futurebenefits. Policies, instead, represent a much broader world,where infrastructures are only one of the possible options,aside to technological investments, education, pricing,etc. to obtain a chosen goal.
One of the policies more studied in literature is road usercharging. Rich and Nielsen [39], Transport for London [40],Eliasson [41], and Rotaris et al. [42] perform a CBA to roaduser charging schemes in Copenhagen, London, Stockholmand Milan, respectively. A similar measure, but applied at acountry scale is described in Glaister and Graham [43]. Inthis kind of policy, however, main benefits and costs aresimilar to those related to infrastructures: investment andfixed running costs, time savings or costs, revenues, reductionof congestion and possibly of pollution.
Another typical sustainable mobility policy is car shar-ing. Fellows and Pitfield [44] use the standard British meth-odology (the so called “COBA”) to analyse a soft measurelike car sharing. Methodologically, however, they perform it“exactly in the same way as new road schemes”, quantifyingbenefits from reduced vehicle kilometres, increased averagespeeds and savings in fuel, accidents and emissions.
Moving to measures less and less dominated by an in-vestment cost, Sælensminde [45] performs a CBA of walk-ing and cycling networks, taking into account all therelevant aspects, some of which are usually not considered:travel time, insecurity, accidents, savings for school buses,health effects, parking costs, environmental external costs.On the same topic - cycling - Börjesson and Eliasson [46]demonstrate that, in a CBA of cycling support policies,health effects on cyclists, which are usually considered asexternal benefits, are actually internalized. In fact, the gen-eralized cost of a cyclist seems to include also the healthbenefit of cycling: he/she accepts a slower mode vs. car or
140 Eur. Transp. Res. Rev. (2012) 4:137–152
public transport also because perceiving a personal benefitin terms of health. For this reason, considering health bene-fits as an external benefit to be added in case of an improve-ment to cycling network, introduces a double counting ifconsumers’ surplus is correctly accounted.
Finally, a practical application for environmental policies isoffered by Massé [47]. The author is calculating the costs andbenefits associated to the compulsory introduction of anti-particulate matter filters on cars and trucks in France. Heobtains a very good B/C ratio, thanks to the large benefits interms of saved human lives. On the same topic of pollution,Bollen et al. [48] perform a CBA to evaluate policies thatreduce jointly or separately local and global pollutants.
2.3 MCA and CBA: integrated approaches
The combination of MCA and CBA has been applied inseveral studies. For instance, CBA has been combinedwith AHP or ANP in order to cope with the CBA’sweakness in reflecting stakeholders’ knowledge in theevaluation process of projects [49]; while a financial CBAplus a MCAmatrix was created for an economic evaluation ofurban transformations [50].
As concerns specifically transport issues, in the EU mem-ber states (for a detailed review see [51]), different evalua-tion techniques are adopted with a great prevalence of CBA.In most of the cases (i.e. in Sweden, Netherlands, UnitedKingdom), CBA is supplemented by a specific appraisal forimpacts that are difficult to be monetized; in some others (i.e. Belgium, Austria and Greece), MCA is used, but itincludes CBA as one of the criteria. Finally, in FranceCBA has recently been considered weak in stimulate stake-holders’ interactions, thus, in order to create a larger publicdebate, MCA tools have also been adopted [51]. Even at theurban scale of transport investment evaluation, as the out-come of CBA did not match with the one selected by MCA,a combination of the two methods was suggested [14].
As regards sustainable development, for instance, in theExternE-Pol project [52] it was possibile to integrate multi-criteria methodology into the wider structure of CBA byusing a specific framework. By doing so, all the stakehold-ers’ preferences could be exploited, thus, deriving indirectmonetary values for environmental goods and impacts .
Besides, as for the specific environmental impacts assess-ment from transportation projects, either for small-scale (lo-cal) or large-scale (regional/national), a combination of CBAand MCA has been developed in the Evaluation Frameworkof Environmental impacts and Costs of Transport (EFECT)[53]. EFECT is a methodological framework, which aims tocover all kinds of transport environmental initiatives, namelypolicies, plans and projects, by using an additive function.
Finally, as concerns the evaluation of SM at neighbourhoodlevel, as it will be described in details in the following
sections, a first attempt to use MCA has been done [54], whileno specific evidence has been provided for the application ofCBA. This is due to the fact that CBAwell fits in the assess-ment of specific infrastructures or policies where monetary ormonetizable costs and benefits prevail (investment, time, en-vironmental benefits, etc.) (see 3.2 for a discussion), thereforewhen it is applied to assess soft policies at the urban scale, itcan be well supplemented by a broader evaluation approachlike MCA. The MCA, indeed, effectively evaluates effectslike social inclusion, change in behavior of citizens, change inthe use of city, quality of life, etc.
3 Assessing sustainable mobility policiesat neighbourhood level
3.1 The case of MCA
Within the application fields of the MCA, transportationplays an important role. Specifically, there has been a flour-ishing literature investigating the assessment of SM, bothex-ante and ex-post at the urban scale3 and the city level,while the literature at the neighbourhood level is still poor.
The literature on the city level presents the indicators tomeasure SM, and adopts the MCA to obtain the indicatorsweighting (see, among the others, [55]). Among the manyworks focusing on the city level, the PROPOLIS Report[56], the TRANSPLUS Report [57] and the PROSPECTReport [58] present some successful good practices connect-ing measures in land use and urban transport, and developspecific strategies and indicators to achieve SM. Specifical-ly, the PROPOLIS Report aims at finding policies thatcould, in an ideal case, simultaneously improve all dimen-sions of sustainability compared with the reference solutionand, if possible, even improve the current level of sustain-ability. Other applications of MCA are found in the work byCampos Gouvêa et al. [55], which proposes a set of mobilityindicators with the objective to integrate transport and landuse planning in order to achieve an efficient sustainableurban development. The case study analyzed by the authorsis Belo Horizonte, the third largest city of Brazil. Besides,Tzeng et al. [59] adopt MCA to evaluate alternative-fuelbuses in Taiwan urban areas; Yedla and Shrestha [60] focuson the selection of alternative options for environmentallysustainable transport system in Delhi.
As stated above, the literature on MCA, carried out atneighbourhood level, is very scanty and usually refers to theex-post perspective. At least to our knowledge, only the worksby Cerreta [61], and Cerreta and Salzano [62] focus on the ex-post assessment of sustainability at neighbourhood level. This
3 One of the first books published on this issue is the one by Voogd[99].
Eur. Transp. Res. Rev. (2012) 4:137–152 141
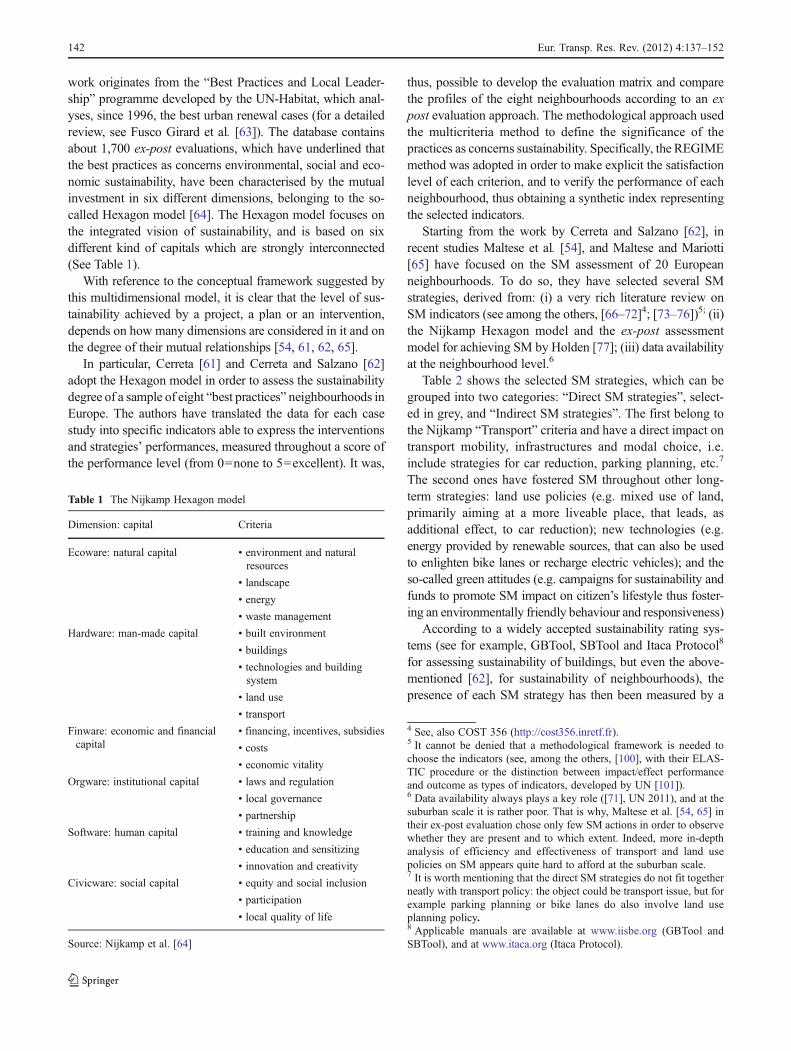
work originates from the “Best Practices and Local Leader-ship” programme developed by the UN-Habitat, which anal-yses, since 1996, the best urban renewal cases (for a detailedreview, see Fusco Girard et al. [63]). The database containsabout 1,700 ex-post evaluations, which have underlined thatthe best practices as concerns environmental, social and eco-nomic sustainability, have been characterised by the mutualinvestment in six different dimensions, belonging to the so-called Hexagon model [64]. The Hexagon model focuses onthe integrated vision of sustainability, and is based on sixdifferent kind of capitals which are strongly interconnected(See Table 1).
With reference to the conceptual framework suggested bythis multidimensional model, it is clear that the level of sus-tainability achieved by a project, a plan or an intervention,depends on how many dimensions are considered in it and onthe degree of their mutual relationships [54, 61, 62, 65].
In particular, Cerreta [61] and Cerreta and Salzano [62]adopt the Hexagon model in order to assess the sustainabilitydegree of a sample of eight “best practices” neighbourhoods inEurope. The authors have translated the data for each casestudy into specific indicators able to express the interventionsand strategies’ performances, measured throughout a score ofthe performance level (from 00none to 50excellent). It was,
thus, possible to develop the evaluation matrix and comparethe profiles of the eight neighbourhoods according to an expost evaluation approach. The methodological approach usedthe multicriteria method to define the significance of thepractices as concerns sustainability. Specifically, the REGIMEmethod was adopted in order to make explicit the satisfactionlevel of each criterion, and to verify the performance of eachneighbourhood, thus obtaining a synthetic index representingthe selected indicators.
Starting from the work by Cerreta and Salzano [62], inrecent studies Maltese et al. [54], and Maltese and Mariotti[65] have focused on the SM assessment of 20 Europeanneighbourhoods. To do so, they have selected several SMstrategies, derived from: (i) a very rich literature review onSM indicators (see among the others, [66–72]4; [73–76])5; (ii)the Nijkamp Hexagon model and the ex-post assessmentmodel for achieving SM by Holden [77]; (iii) data availabilityat the neighbourhood level.6
Table 2 shows the selected SM strategies, which can begrouped into two categories: “Direct SM strategies”, select-ed in grey, and “Indirect SM strategies”. The first belong tothe Nijkamp “Transport” criteria and have a direct impact ontransport mobility, infrastructures and modal choice, i.e.include strategies for car reduction, parking planning, etc.7
The second ones have fostered SM throughout other long-term strategies: land use policies (e.g. mixed use of land,primarily aiming at a more liveable place, that leads, asadditional effect, to car reduction); new technologies (e.g.energy provided by renewable sources, that can also be usedto enlighten bike lanes or recharge electric vehicles); and theso-called green attitudes (e.g. campaigns for sustainability andfunds to promote SM impact on citizen’s lifestyle thus foster-ing an environmentally friendly behaviour and responsiveness)
According to a widely accepted sustainability rating sys-tems (see for example, GBTool, SBTool and Itaca Protocol8
for assessing sustainability of buildings, but even the above-mentioned [62], for sustainability of neighbourhoods), thepresence of each SM strategy has then been measured by a
Table 1 The Nijkamp Hexagon model
Dimension: capital Criteria
Ecoware: natural capital • environment and naturalresources
• landscape
• energy
• waste management
Hardware: man-made capital • built environment
• buildings
• technologies and buildingsystem
• land use
• transport
Finware: economic and financialcapital
• financing, incentives, subsidies
• costs
• economic vitality
Orgware: institutional capital • laws and regulation
• local governance
• partnership
Software: human capital • training and knowledge
• education and sensitizing
• innovation and creativity
Civicware: social capital • equity and social inclusion
• participation
• local quality of life
Source: Nijkamp et al. [64]
4 See, also COST 356 (http://cost356.inretf.fr).5 It cannot be denied that a methodological framework is needed tochoose the indicators (see, among the others, [100], with their ELAS-TIC procedure or the distinction between impact/effect performanceand outcome as types of indicators, developed by UN [101]).6 Data availability always plays a key role ([71], UN 2011), and at thesuburban scale it is rather poor. That is why, Maltese et al. [54, 65] intheir ex-post evaluation chose only few SM actions in order to observewhether they are present and to which extent. Indeed, more in-depthanalysis of efficiency and effectiveness of transport and land usepolicies on SM appears quite hard to afford at the suburban scale.7 It is worth mentioning that the direct SM strategies do not fit togetherneatly with transport policy: the object could be transport issue, but forexample parking planning or bike lanes do also involve land useplanning policy.8 Applicable manuals are available at www.iisbe.org (GBTool andSBTool), and at www.itaca.org (Itaca Protocol).
142 Eur. Transp. Res. Rev. (2012) 4:137–152
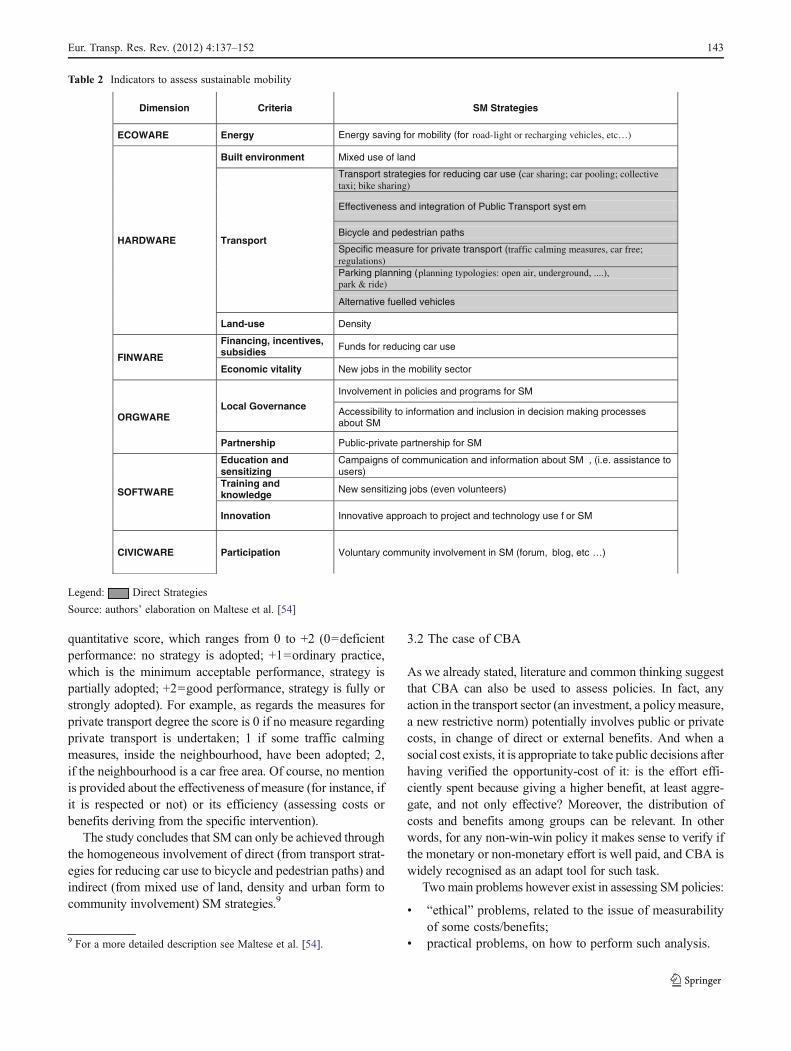
quantitative score, which ranges from 0 to +2 (00deficientperformance: no strategy is adopted; +10ordinary practice,which is the minimum acceptable performance, strategy ispartially adopted; +20good performance, strategy is fully orstrongly adopted). For example, as regards the measures forprivate transport degree the score is 0 if no measure regardingprivate transport is undertaken; 1 if some traffic calmingmeasures, inside the neighbourhood, have been adopted; 2,if the neighbourhood is a car free area. Of course, no mentionis provided about the effectiveness of measure (for instance, ifit is respected or not) or its efficiency (assessing costs orbenefits deriving from the specific intervention).
The study concludes that SM can only be achieved throughthe homogeneous involvement of direct (from transport strat-egies for reducing car use to bicycle and pedestrian paths) andindirect (from mixed use of land, density and urban form tocommunity involvement) SM strategies.9
3.2 The case of CBA
As we already stated, literature and common thinking suggestthat CBA can also be used to assess policies. In fact, anyaction in the transport sector (an investment, a policy measure,a new restrictive norm) potentially involves public or privatecosts, in change of direct or external benefits. And when asocial cost exists, it is appropriate to take public decisions afterhaving verified the opportunity-cost of it: is the effort effi-ciently spent because giving a higher benefit, at least aggre-gate, and not only effective? Moreover, the distribution ofcosts and benefits among groups can be relevant. In otherwords, for any non-win-win policy it makes sense to verify ifthe monetary or non-monetary effort is well paid, and CBA iswidely recognised as an adapt tool for such task.
Twomain problems however exist in assessing SM policies:
& “ethical” problems, related to the issue of measurabilityof some costs/benefits;
& practical problems, on how to perform such analysis.9 For a more detailed description see Maltese et al. [54].
Table 2 Indicators to assess sustainable mobility
Dimension Criteria SM Strategies
ECOWARE Energy Energy saving for mobility (for road-light or recharging vehicles, etc…)
HARDWARE
Built environment Mixed use of land
Transport
Transport strategies for reducing car use (car sharing; car pooling; collective taxi; bike sharing)
Effectiveness and integration of Public Transport syst em
Bicycle and pedestrian paths
Specific measure for private transport (traffic calming measures, car free; regulations)Parking planning (planning typologies: open air, underground, ....), park & ride)
Alternative fuelled vehicles
Land-use Density
FINWARE
Financing, incentives, subsidies Funds for reducing car use
Economic vitality New jobs in the mobility sector
ORGWARELocal Governance
Involvement in policies and programs for SM
Accessibility to information and inclusion in decision making processes about SM
Partnership Public-private partnership for SM
SOFTWARE
Education and sensitizing
Campaigns of communication and information about SM , (i.e. assistance to users)
Training and knowledge New sensitizing jobs (even volunteers)
Innovation Innovative approach to project and technology use f or SM
CIVICWARE Participation Voluntary community involvement in SM (forum, blog, etc …)
Legend: Direct Strategies
Source: authors’ elaboration on Maltese et al. [54]
Eur. Transp. Res. Rev. (2012) 4:137–152 143
Ethical arguments are the most used to criticise the use ofCBA in this field.10 Practical problems, instead, remainunsolved or not sufficiently clarified in CBA for SM policies.This issue is amplified when focusing on the relevantsub-problem of SM at the neighbourhood level.
In fact, it is well known to practitioners that CBA tends tobe more complex, the smaller the scale of the problem.While for an infrastructural problem it is “easy” and obviousto identify and quantify the main costs and benefits, andleaving to qualitative decisions other effects, such task ismore difficult for policy measures, where non-monetarybenefits and costs prevail.
When considering SM policies, and policies in general,the traditional categories of cost and benefit become less andless defined for the following reasons:
& available solutions aremuch broader (not only infrastructures);& the range of impacts is broader11;& direct public investment is relatively less dominant on
other positive and negative effects;& some policies are at zero monetary cost, but determine
other kind of efforts for part of the users (e.g. car freezones introduce a cost for car users).
At the neighbourhood level this is even more evident:nearly no policies involve a relevant public cost to beassessed in term of trade-offs, but this does not mean thatall policies have no social cost.
The main point to understand when and how CBA can beused to assess SM policies is to clarify which are the maincategories of costs and benefits involved. In principle, all ofthem exist, but only some of them are actually relevant in acertain policy. For example, a car free area is nearly costlessfor the public subject. The main negative impact to comparewith positive effects is the extra-costs inflicted to those usersthat are no more allowed to enter in the area and must spendlonger trips with public transport or change their destination.The following Table 3. clarifies which are the main costsand benefits associated to a typical mobility policy.12
Columns divide the type of benefits and costs to beconsidered according to the degree of adherence of mone-tisation to reality. For example, expenditures and time costsare naturally expressed in monetary terms. In this case, CBAuses simply the shadow value of market costs. Other costs
are not monetary, but can be reasonably translated in mon-etary terms (e.g. the environmental costs). This “translation”is not accepted by everybody, but it is commonly used in thelarge majority of guidelines. The third column includes allthe effects that can be judged as positive or negative, but forwhich associating a conventional monetary cost can be toodifficult, unclear or simply a nonsense. For example, it isobvious that a nice bridge is better than an ugly one, buthow to measure “nice” and “ugly”, even if practically pos-sible, will be too undefined (involving personal judgements)and of scarce economic meaning.
Table 3 is very synthetic in some parts, therefore, needssome further specifications:
1) Time is not traded into a market, but its monetisation israther intuitive.
2) A general and important issue is that of double count-ing, i.e. benefits (or costs) that are accounted two timesunder different forms. The largest attention must be paidto it, because biasing the result and very common in SMpolicies, and CBA forces to pay such attention. Examplesare the accessibility (see below), the way taxes areaccounted, the effect on land prices, the way users’benefits are calculated [78] and many more.
3) Accessibility is not listed in the table because alreadyincluded in two separate terms. On one side, it is theinverse function of generalised cost, implicitly calculatedin the users surplus. The other “form” of accessibility isrelated to the positive externality of getting nearer to mar-kets or workforce. This effect is usually treated in CBAs asa “wider benefit”, listed in the last row. The two effects (theinternal, perceived one and the external one) must not beassociated also with a further measure of “accessibility” toavoid double counting in favour of projects. Similarly,“accessibility” must not be confused with the networkeffect, that economics treats as a positive externality [79].
4) That of wider benefits is a complex and importantissue.13 It is widely recognised that under some con-ditions the direct transport benefits (e.g. users’ surplus)do not fully represent all the benefits associated to ascheme or a policy. The main external (or wider) bene-fits are the macroeconomic ones, namely agglomerationeconomies ([80–83]), increased long term productivity[84] and labour pooling [82]. For the conditions rulingthe existence of such benefits, see the same sources. Ingeneral one can say that they are relevant in case of truecapacity constraints/bottlenecks/missing links and/or indeveloping countries. A rule of thumb for Europeaneconomies says that these effects account for 0% to30% of direct benefits, according to the type, placeand size of project.
10 As this is not the focus of the paper, one can refer to the alreadymentioned debate between Heinzerling and Ackerman [34], Hahn [35]and Turner [36] or to the interesting paper by Næss [102].11 To simplify: not only monetary, time and pollution savings in changeof a lump sum investment, but lighter effects such as change in the longterm behaviour of citizens, change in the use of the city, etc.12 In Table 3 rows represent the type of stakeholder according to howbenefits and costs must be calculated and not according to real worlddivisions (that may be more complex). 13 For a recent comment see Vickerman [103] and OECD and ITF [104].
144 Eur. Transp. Res. Rev. (2012) 4:137–152
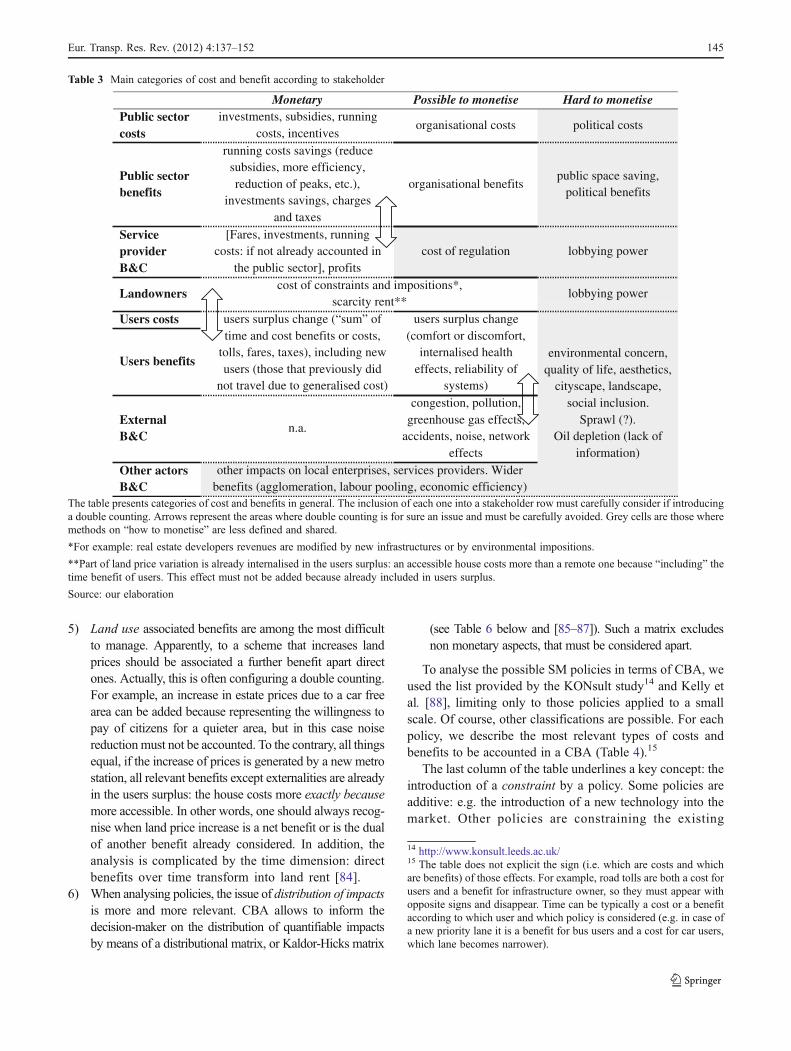
5) Land use associated benefits are among the most difficultto manage. Apparently, to a scheme that increases landprices should be associated a further benefit apart directones. Actually, this is often configuring a double counting.For example, an increase in estate prices due to a car freearea can be added because representing the willingness topay of citizens for a quieter area, but in this case noisereductionmust not be accounted. To the contrary, all thingsequal, if the increase of prices is generated by a new metrostation, all relevant benefits except externalities are alreadyin the users surplus: the house costs more exactly becausemore accessible. In other words, one should always recog-nise when land price increase is a net benefit or is the dualof another benefit already considered. In addition, theanalysis is complicated by the time dimension: directbenefits over time transform into land rent [84].
6) When analysing policies, the issue of distribution of impactsis more and more relevant. CBA allows to inform thedecision-maker on the distribution of quantifiable impactsby means of a distributional matrix, or Kaldor-Hicks matrix
(see Table 6 below and [85–87]). Such a matrix excludesnon monetary aspects, that must be considered apart.
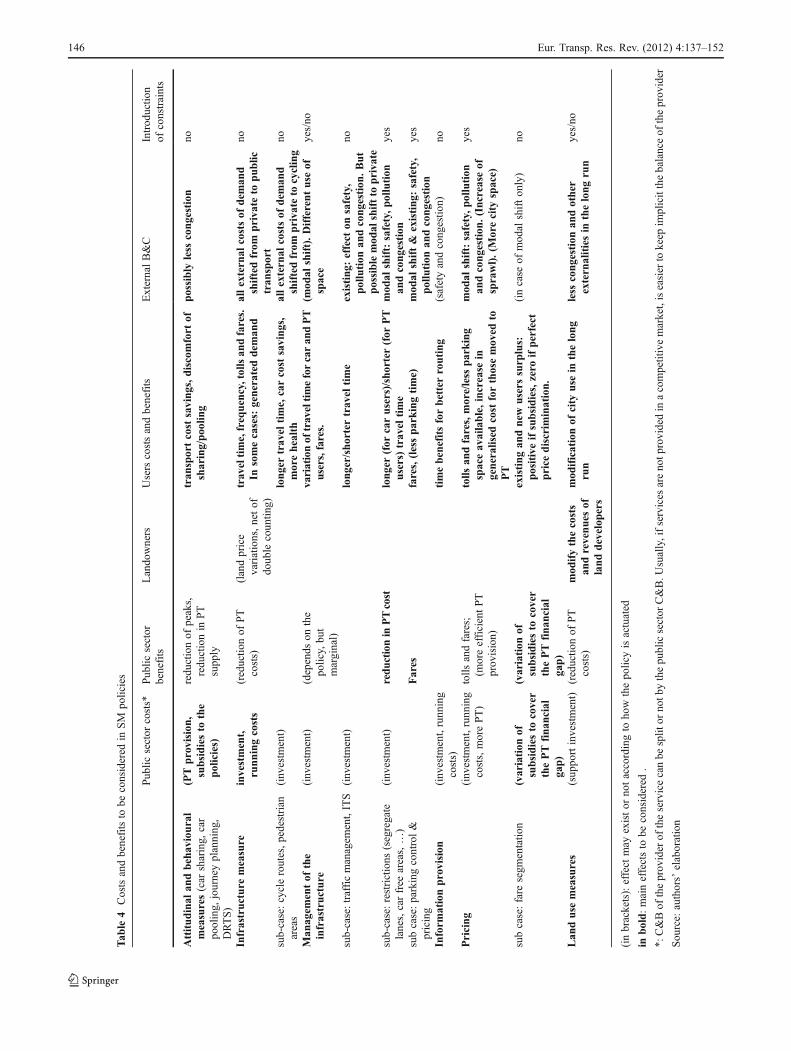
To analyse the possible SM policies in terms of CBA, weused the list provided by the KONsult study14 and Kelly etal. [88], limiting only to those policies applied to a smallscale. Of course, other classifications are possible. For eachpolicy, we describe the most relevant types of costs andbenefits to be accounted in a CBA (Table 4).15
The last column of the table underlines a key concept: theintroduction of a constraint by a policy. Some policies areadditive: e.g. the introduction of a new technology into themarket. Other policies are constraining the existing
14 http://www.konsult.leeds.ac.uk/15 The table does not explicit the sign (i.e. which are costs and whichare benefits) of those effects. For example, road tolls are both a cost forusers and a benefit for infrastructure owner, so they must appear withopposite signs and disappear. Time can be typically a cost or a benefitaccording to which user and which policy is considered (e.g. in case ofa new priority lane it is a benefit for bus users and a cost for car users,which lane becomes narrower).
Table 3 Main categories of cost and benefit according to stakeholder
Monetary Possible to monetise Hard to monetise Public sector costs
investments, subsidies, running costs, incentives
organisational costs political costs
Public sector benefits
running costs savings (reduce subsidies, more efficiency, reduction of peaks, etc.),
investments savings, charges and taxes
organisational benefits public space saving,
political benefits
Service provider B&C
[Fares, investments, running costs: if not already accounted in
the public sector], profits cost of regulation lobbying power
Landowners cost of constraints and impositions*,
scarcity rent** lobbying power
Users costs users surplus change (“sum” of time and cost benefits or costs,
tolls, fares, taxes), including new users (those that previously did
not travel due to generalised cost)
users surplus change (comfort or discomfort,
internalised health effects, reliability of
systems)
environmental concern, quality of life, aesthetics,
cityscape, landscape, social inclusion.
Sprawl (?). Oil depletion (lack of
information)
Users benefits
External B&C
n.a.
congestion, pollution, greenhouse gas effects,
accidents, noise, network effects
Other actors B&C
other impacts on local enterprises, services providers. Wider benefits (agglomeration, labour pooling, economic efficiency)
The table presents categories of cost and benefits in general. The inclusion of each one into a stakeholder row must carefully consider if introducinga double counting. Arrows represent the areas where double counting is for sure an issue and must be carefully avoided. Grey cells are those wheremethods on “how to monetise” are less defined and shared.
*For example: real estate developers revenues are modified by new infrastructures or by environmental impositions.
**Part of land price variation is already internalised in the users surplus: an accessible house costs more than a remote one because “including” thetime benefit of users. This effect must not be added because already included in users surplus.
Source: our elaboration
Eur. Transp. Res. Rev. (2012) 4:137–152 145
Tab
le4
Costsandbenefitsto
beconsidered
inSM
policies
Pub
licsector
costs*
Pub
licsector
benefits
Lando
wners
Users
costsandbenefits
ExternalB&C
Introd
uctio
nof
constraints
Attitudinal
andbehav
ioural
measures(car
sharing,
car
pooling,
journeyplanning
,DRTS)
(PTprovision
,subsidiesto
the
policies)
redu
ctionof
peaks,
redu
ctionin
PT
supp
ly
tran
sportcost
savings,discomfort
ofsharing/poo
ling
possibly
less
congestion
no
Infrastructure
measure
investment,
runningcosts
(reductio
nof
PT
costs)
(landprice
variations,netof
doub
lecoun
ting)
trav
eltime,frequency,tollsan
dfares.
Insomecases:
generated
dem
and
allexternal
costsof
dem
and
shiftedfrom
priva
teto
public
tran
sport
no
sub-case:cycleroutes,pedestrian
areas
(inv
estm
ent)
longertrav
eltime,carcost
savings,
morehealth
allexternal
costsof
dem
and
shiftedfrom
priva
teto
cycling
no
Man
agem
entof
the
infrastructure
(inv
estm
ent)
(depends
onthe
policy,bu
tmarginal)
variationof
traveltimeforcaran
dPT
users,fares.
(mod
alshift).Differentuse
ofspace
yes/no
sub-case:trafficmanagem
ent,ITS
(inv
estm
ent)
longer/shortertrav
eltime
existing:
effect
onsafety,
pollution
andcongestion.But
possiblemod
alshiftto
priva
te
no
sub-case:restrictions
(segregate
lanes,carfree
areas,…)
(inv
estm
ent)
redu
ctionin
PTcost
longer(for
carusers)/shorter(for
PT
users)trav
eltime
mod
alshift:safety,pollution
andcongestion
yes
subcase:parkingcontrol&
pricing
Fares
fares,(lessparkingtime)
mod
alshift&
existing:
safety,
pollution
andcongestion
yes
Inform
ationprovision
(inv
estm
ent,runn
ing
costs)
timebenefitsforbetterrouting
(safetyandcong
estio
n)no
Pricing
(inv
estm
ent,runn
ing
costs,morePT)
tolls
andfares;
(moreefficientPT
prov
ision)
tolls
andfares,more/less
parking
spaceav
ailable,increase
ingeneralised
cost
forthosemov
edto
PT
mod
alshift:safety,pollution
andcongestion.(Increase
ofsprawl).(M
orecity
space)
yes
subcase:fare
segm
entatio
n(variation
ofsubsidiesto
cover
thePTfinan
cial
gap)
(variation
ofsubsidiesto
cover
thePTfinan
cial
gap)
existingan
dnew
users
surplus:
positiveifsubsidies,zero
ifperfect
price
discrim
ination.
(incase
ofmod
alshifton
ly)
no
Lan
duse
measures
(sup
portinvestment)
(reductio
nof
PT
costs)
mod
ifythecosts
andrevenues
oflanddevelop
ers
mod
ificationof
city
use
inthelong
run
less
congestionan
dother
externalitiesin
thelongrun
yes/no
(inbrackets):effect
may
existor
notaccordingto
how
thepo
licyisactuated
inbold:maineffectsto
beconsidered
.
*:C&Bof
theprov
ider
oftheservicecanbe
split
orno
tbythepu
blicsector
C&B.U
sually,ifservices
areno
tprovidedin
acompetitivemarket,iseasier
tokeep
implicitthebalanceof
theprov
ider
Sou
rce:
authors’
elaboration
146 Eur. Transp. Res. Rev. (2012) 4:137–152
conditions: e.g. a new technology becomes compulsory. Inthe first case, the policy must be assessed only by looking athow demand responds to the new situation (more demand,less costs, etc.). The second case also introduces, at least forpart of the users, a constraint that translates into a cost. Forexample, the adoption of a compulsory environmental stan-dard for truck emissions causes enterprises to purchase newvehicles even if the existing ones are not yet amortised.
CBA is then capable not only to assess public expendi-ture, that is its “traditional” use, but also to explicitly takeinto consideration the private costs associated with the in-troduction of new constraints. The same sustainability goalcan be obtained through different public decisions andactions (e.g. emissions reduction can be obtained with newtechnologies, public transport expansion, restrictions to carsor city areas). Some involve a public subsidy, some othersare without subsidy, but involve increasing private costs.CBA can clarify losers and winners and the net balance, butcan also be used to fine tune the policy. For example, carfree areas are more costly in sprawled or public transportdeficient areas than in compact areas already infrastructured.
4 Strengths and weaknesses of MCA and CBAin the assessment of sustainable mobility
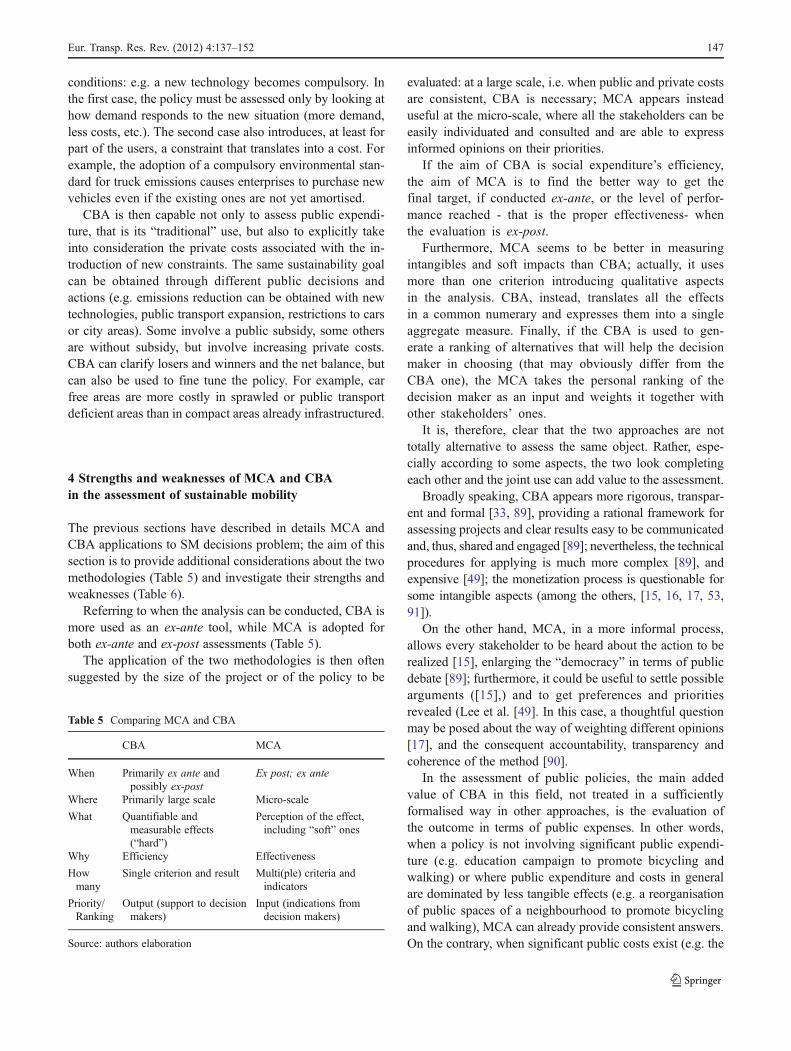
The previous sections have described in details MCA andCBA applications to SM decisions problem; the aim of thissection is to provide additional considerations about the twomethodologies (Table 5) and investigate their strengths andweaknesses (Table 6).
Referring to when the analysis can be conducted, CBA ismore used as an ex-ante tool, while MCA is adopted forboth ex-ante and ex-post assessments (Table 5).
The application of the two methodologies is then oftensuggested by the size of the project or of the policy to be
evaluated: at a large scale, i.e. when public and private costsare consistent, CBA is necessary; MCA appears insteaduseful at the micro-scale, where all the stakeholders can beeasily individuated and consulted and are able to expressinformed opinions on their priorities.
If the aim of CBA is social expenditure’s efficiency,the aim of MCA is to find the better way to get thefinal target, if conducted ex-ante, or the level of perfor-mance reached - that is the proper effectiveness- whenthe evaluation is ex-post.
Furthermore, MCA seems to be better in measuringintangibles and soft impacts than CBA; actually, it usesmore than one criterion introducing qualitative aspectsin the analysis. CBA, instead, translates all the effectsin a common numerary and expresses them into a singleaggregate measure. Finally, if the CBA is used to gen-erate a ranking of alternatives that will help the decisionmaker in choosing (that may obviously differ from theCBA one), the MCA takes the personal ranking of thedecision maker as an input and weights it together withother stakeholders’ ones.
It is, therefore, clear that the two approaches are nottotally alternative to assess the same object. Rather, espe-cially according to some aspects, the two look completingeach other and the joint use can add value to the assessment.
Broadly speaking, CBA appears more rigorous, transpar-ent and formal [33, 89], providing a rational framework forassessing projects and clear results easy to be communicatedand, thus, shared and engaged [89]; nevertheless, the technicalprocedures for applying is much more complex [89], andexpensive [49]; the monetization process is questionable forsome intangible aspects (among the others, [15, 16, 17, 53,91]).
On the other hand, MCA, in a more informal process,allows every stakeholder to be heard about the action to berealized [15], enlarging the “democracy” in terms of publicdebate [89]; furthermore, it could be useful to settle possiblearguments ([15],) and to get preferences and prioritiesrevealed (Lee et al. [49]. In this case, a thoughtful questionmay be posed about the way of weighting different opinions[17], and the consequent accountability, transparency andcoherence of the method [90].
In the assessment of public policies, the main addedvalue of CBA in this field, not treated in a sufficientlyformalised way in other approaches, is the evaluation ofthe outcome in terms of public expenses. In other words,when a policy is not involving significant public expendi-ture (e.g. education campaign to promote bicycling andwalking) or where public expenditure and costs in generalare dominated by less tangible effects (e.g. a reorganisationof public spaces of a neighbourhood to promote bicyclingand walking), MCA can already provide consistent answers.On the contrary, when significant public costs exist (e.g. the
Table 5 Comparing MCA and CBA
CBA MCA
When Primarily ex ante andpossibly ex-post
Ex post; ex ante
Where Primarily large scale Micro-scale
What Quantifiable andmeasurable effects(“hard”)
Perception of the effect,including “soft” ones
Why Efficiency Effectiveness
Howmany
Single criterion and result Multi(ple) criteria andindicators
Priority/Ranking
Output (support to decisionmakers)
Input (indications fromdecision makers)
Source: authors elaboration
Eur. Transp. Res. Rev. (2012) 4:137–152 147
expansion of public transport network) or when a costlesspolicy actually inflicts extra-costs to citizens in the name ofSM (e.g. the introduction of a large car-free area), it isnecessary to evaluate the outcomes not in absolute terms,but in terms of costs or efforts. CBA allows, then, to con-sider the opportunity cost of a policy [33], i.e. the value ofalternatives use of public money spent for a certain policy.To make a simple example, if two policies are both gener-ating a +5% patronage of public transport, but one generatesa cost to the public administration or to the car users and theother obtains the same benefit without generating costs, the
judgement on the two policies must be different and thesecond must be chosen (it is, for example, the case ofconstraints policies or supply-side policies vs. education-based policies).
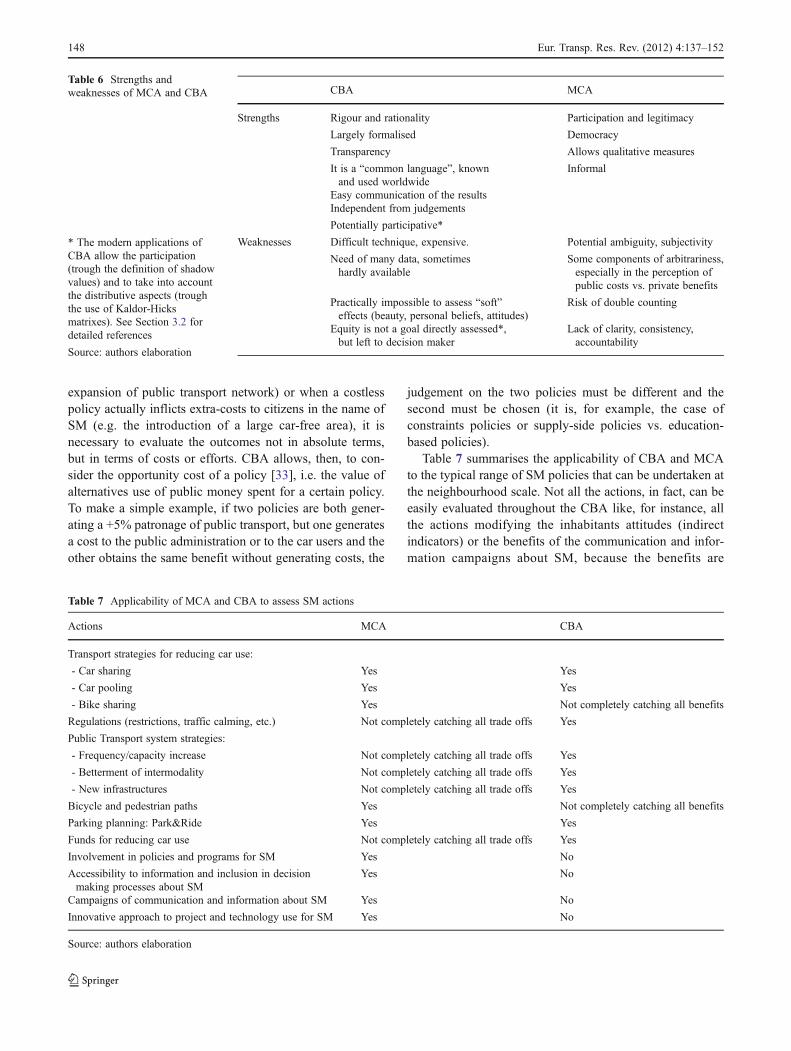
Table 7 summarises the applicability of CBA and MCAto the typical range of SM policies that can be undertaken atthe neighbourhood scale. Not all the actions, in fact, can beeasily evaluated throughout the CBA like, for instance, allthe actions modifying the inhabitants attitudes (indirectindicators) or the benefits of the communication and infor-mation campaigns about SM, because the benefits are
Table 6 Strengths andweaknesses of MCA and CBA
* The modern applications ofCBA allow the participation(trough the definition of shadowvalues) and to take into accountthe distributive aspects (troughthe use of Kaldor-Hicksmatrixes). See Section 3.2 fordetailed references
Source: authors elaboration
CBA MCA
Strengths Rigour and rationality Participation and legitimacy
Largely formalised Democracy
Transparency Allows qualitative measures
It is a “common language”, knownand used worldwide
Informal
Easy communication of the resultsIndependent from judgements
Potentially participative*
Weaknesses Difficult technique, expensive. Potential ambiguity, subjectivity
Need of many data, sometimeshardly available
Some components of arbitrariness,especially in the perception ofpublic costs vs. private benefits
Practically impossible to assess “soft”effects (beauty, personal beliefs, attitudes)
Risk of double counting
Equity is not a goal directly assessed*,but left to decision maker
Lack of clarity, consistency,accountability
Table 7 Applicability of MCA and CBA to assess SM actions
Actions MCA CBA
Transport strategies for reducing car use:
- Car sharing Yes Yes
- Car pooling Yes Yes
- Bike sharing Yes Not completely catching all benefits
Regulations (restrictions, traffic calming, etc.) Not completely catching all trade offs Yes
Public Transport system strategies:
- Frequency/capacity increase Not completely catching all trade offs Yes
- Betterment of intermodality Not completely catching all trade offs Yes
- New infrastructures Not completely catching all trade offs Yes
Bicycle and pedestrian paths Yes Not completely catching all benefits
Parking planning: Park&Ride Yes Yes
Funds for reducing car use Not completely catching all trade offs Yes
Involvement in policies and programs for SM Yes No
Accessibility to information and inclusion in decisionmaking processes about SM
Yes No
Campaigns of communication and information about SM Yes No
Innovative approach to project and technology use for SM Yes No
Source: authors elaboration
148 Eur. Transp. Res. Rev. (2012) 4:137–152
second order effects, and develop in the long term.16 Bycontrast, the MCA does not effectively assess some privateor public costs. As an example, it hardly evaluates the socialcost of the travel time increase due to restrictive regulation(i.e. car free area) in an existing neighbourhood.
A point is however extremely important. The two meth-ods do not provide the same information in terms of deci-sions. MCA “summarises” the stakeholders’ implicitpriorities, possibly weighting stakeholders in terms of im-portance in the decision, while, CBA is the translation into anumber of the social welfare function, measured independent-ly using physical measures, models and literature values. Theoutput is not the decision, but one of the inputs to the publicdecision maker when taking the decision.
5 Conclusions and further research
In this paper we analysed the existing literature on CBA,MCA and investigated the strengths and weaknesses of thetwo techniques, once applied to the SM policies field. We alsodiscussed how such evaluations could be practically devel-oped, and underlined the following aspects:
1) on the micro-scale, MCA is commonly used, ex ante,and ex-post at the urban or suburban scale, while CBAis much more adopted for infrastructure projects at abigger scale, as an ex ante approach;
2) on sustainability, MCA has often been adopted forevaluating ex-post the level of general sustainability[62, 64] and SM [54, 65] at lower scales;
3) on transport and mobility, ex-ante evaluation has beenconducted primarily with CBA methods [51], even ifMCA is used sometimes to evaluate transport projectsex ante (see section 2.1);
4) on SM many difficulties arose when measuring all rele-vant impacts of a transport strategy (either policy orproject) in monetary terms, concerning intangible aspects,thus leading to the expansion of monetary evaluation(unique criterion) to evaluation methods using more thanone criterion, e.g. multi-criteria methods ([93]).
It is clear that a traditional MCA approach has the risk tofail in evaluating the real trade offs generated by the policy.To the contrary, the traditional CBA approach is not catch-ing all the effects involved in SM policies, where intangibleaspects are not secondary, but dominating. This is particu-larly true when the problem is related to the peculiar case ofsmall scale.
It can, therefore, be concluded that as concerns thespecific case of SM assessment at the neighbourhoodscale, MCA and CBA might be integrated to fully con-sider all relevant actions available. Specifically, MCA isa good tool for the indirect actions (where soft andindirect effects prevail) and to be applied at a suburbanscale. CBA, on the contrary, better works for the directstrategies (where monetizable costs and benefits prevail),besides, it better takes into account the external costs,which are very important at the urban dense areas, andcan no longer be neglected.
Therefore, the joint use of the methodologies might bedone in two ways:
1) developing CBA and evaluate the soft effects withMCA;
2) developing a MCA for a broad screening of options andevaluate public expenditures and consumer surplus withCBA.
The joint use of the two methodologies can guarantee adeeper analysis (and knowledge) of priorities and impacts ofan action, always remaining “beyond the market” [52].However, it is worth observing that the concurrent use ofthe two techniques may even drive to contrasting resultsamong the alternatives (see, for example, [14]). On the otherhand, the joint use of the techniques, where the focus ofeach one is clear and well defined, does not lead to distor-tions in the decision, lowering ambiguity and misleading onthe hierarchy/prioritization.
Specifically, at the neighbourhood scale, the joint MCA -CBA can be easily conducted in order to assess the SMlevel; furthermore, it can create a stronger and aware partic-ipation to the decision making process, spreading outknowledge, not only about the goal, but also about thealternative solutions to problems and their costs.
This conjoint assessment procedure allows a neighbour-hood to choose among different SM options by referring toits own (revealed) preferences (MCA), while being aware ofbudget constraints and externalities (CBA). This means that,as an economic subject, the neighbourhood is showing itsown “willingness to pay” to reach the SM goal.
Therefore, further research could, from one side, developmore deeply the methodological framework for selectingindicators and for developing a joint evaluation methodolo-gy; from the other side, focus on the empirical analysis, thatis the implementation of the conjoint methods to scenarios,or real cases.
Open Access This article is distributed under the terms of theCreative Commons Attribution License which permits any use,distribution and reproduction in any medium, provided the originalauthor(s) and source are credited.
16 For example, an action increasing environmental attitude of thecitizens should be monetised by estimating, for example, the effect ofless polluting car purchased in the long term.
Eur. Transp. Res. Rev. (2012) 4:137–152 149
References
1. Codoban N, Kennedy CA (2008) Metabolism of neighbourhood.J Urban Plann Dev 134(1):21–31
2. Geerlings H, Stead D (2003) The integration of land use planning,transport and environment in European policy and research. Trans-port Pol 10:187–196
3. Choguill CL (2008) Developing sustainable neighbourhoods.Habitat International 32(1):41–48
4. ODPM (2006) The Bristol Accord, London5. Wheeler R (2009) Regions, megaregions, and sustainability. Reg
Stud 43(6):863–8766. Marshall S (2000) The potential contribution of land use policies
towards sustainable mobility through activation of travel reductionmechanisms. Innovation 13(1):63–79
7. Hull A (2008) Policy integration: what will it take to achievemore sustainable transport solutions in cities?. Transport Pol(15):94–103
8. Zuindeau B (2006) Spatial approach to sustainable development:challenges of equity and efficacy. Reg Stud 40(5):459–470
9. Loukopoulos P, Scholz RW (2004) Sustainable future urbanmobility: using ‘area development negotiations’ for scenario as-sessment and participatory strategic planning. Environ Plann36:2203–2226
10. Banister D, Berechman J (2000) The economic developmenteffects of transport investments, Paper presented at the TRANS-TALK Workshop, Brussels, November 2000
11. Janic M (2003) Multicriteria evaluation of high-speed Rail,Transrapid maglevand air passenger transport in Europe. TranspPlan Technol 26(6):491–512
12. Macharis C (2004) The importance of stakeholder analysis infreight transport: The MAMCA methodology. Transport Eur 25(26):114–120
13. Macharis C (2007) Multi-criteria Analysis as a tool to includestakeholders in project evaluation: The MAMCA method.In: Haezendonck E (ed) Transport project evaluation. Extending thesocial cost-benefit approach. Edward Elgar, Cheltenham, pp 115–131
14. Tudela A, Akiki N, Cisternas R (2006) Comparing the output ofcost benefit and multi-criteria analysis An application to urbantransport investments. Transport Res Pol Pract 40(2006):414–423
15. Walker WE (2000) Policy Analysis: a systematic approach tosupporting policymaking in the public sector. Journal of Multi-criteria Decision Analysis 9:11–27
16. Tsamboulas D, Yiotis GS, Panou KD (1999) Use of multicriteriamethods for assessment of transport projects. J Transp Eng.September–October, pp.407–414
17. Aldian A, Taylor MAP (2005) A consistent method to determineflexible criteria weights for multicriteria transport project evaluationin developing countries. J East Soc Transp Stud 6:3948–3963
18. Saaty TL (1977) A scaling method for priorities in HierarchicalStructures. J Math Psychol 15:234–281
19. Saaty TL (1990) Multi-Criteria Decision Making: The AnalyticHierarchy ProcessAHP Series, vol 1. RWS Publications,Pittsburgh
20. Roscelli R (2005), (ed) Misurare nell’incertezza, Celid, Torino21. Diappi L, Bolchi P, Concilio G (2010) Assessing sustainability in
urban design: the ANP (Analytic Network Process) approach,Fifth Congress of Italian Association of System Research, 14th–16th October, Fermo
22. Hinloopen E, Nijkamp P (1986) Qualitative multiple criteriachoice analysis. The dominant regime method, Serie ResearchMemoranda, n.45. Free University, Amsterdam
23. Nijkamp P, Blaas E (1993) Impact assessment and evaluation intransportation planning. Kluwier Academic, Dordrecht
24. HEATCO (2005) Developing harmonised European approachesfor transport costing and project assessment. Deliverable 1: currentpractice in project appraisal in Europe
25. OECD, ECMT (2005) National systems of transport infrastructuresplanning. ECMT Round Table 128, Paris, 26–27 February 2004
26. PIARC (2004) Economic evaluation methods for road projects inPIARC member countries. PIARC
27. EVA TREN (2008) Improved decision-aid methods and tools tosupport evaluation of investment for transport and energy net-works in Europe. Deliverable 1. Evaluating the state-of-the-art ininvestment for transport and energy networks. www.eva-tren.org.
28. COM – The European Commission (2007) Greenbook 2007 –Towards a new culture for urban mobility. Commission of theEuropean Communities, Brussels
29. World bank (1996) Sustainable transport: priorities for policyreform. World Bank, Washington DC
30. Persky J (2001) Cost-Benefit Analysis and the Classical Creed. JEcon Perspect 15(4):199–208
31. Farrell S, McNamara D, Caulfield B (2010) Estimating the Po-tential Success of Sustainable Transport Measures for a SmallTown. Transport Res Rec (2163):97–102
32. Beria P (2005) Effectiveness of mobility limitation policiesagainst long term approaches in reduction of emitted pollutants.The Case of Milan Area, AESOP 2005 conference, Wien (Austria).http://aesop2005.scix.net/cgi-bin/papers/Show?_id0247
33. Farrow S, Toman M (1999) Using environmental benefit-cost anal-ysis to improve government performance. Environment 41:12–37
34. Heinzerling L, Ackerman F (2002) Pricing the priceless. Cost-benefit analysis of environmental protection. Georgetown Envi-ronmental Law and Policy Institute, Washington
35. Hahn RW (2005) In defense of the economic analysis of regulation.American Enterprise Institute, Washington
36. Turner K (2007) Limits to CBA in UK and European environ-mental policy: retrospects and future prospects. Environ ResourceEcon (37):253–269
37. Elvik R (2001) Cost–benefit analysis of road safety measures:applicability and controversies. Accid Anal Prev 33:9–17
38. WijnenW,Wesemann P, de Blaeij A (2009) Valuation of road safetyeffects in cost-benefit analysis. Eval Program Plann 32:326–331
39. Rich J, Nielsen OA (2007) A socio-economic assessment ofproposed road user charging schemes in Copenhagen. TransportPol 14(4):330–345
40. Transport for London (2007) Congestion charging. Central Londoncongestion charging scheme: ex-post evaluation of the quantifiedimpacts of the original scheme. Prepared by Reg Evans, for Con-gestion Charging Modelling and Evaluation Team. <http://www.tfl.gov.uk> (29.06.07).
41. Eliasson J (2009) A cost-benefit analysis of the Stockholm con-gestion charging system. Transport Res Pol Pract 43(4):468–480
42. Rotaris L, Danielis R, Marcucci E, Massiani J (2010) The urbanroad pricing scheme to curb pollution in Milan, Italy: Description,impacts and preliminary cost–benefit analysis assessment. TransportRes Pol Pract 44(5):359–375
43. Glaister S, Graham DJ (2005) An evaluation of national road usercharging in England. Transport Res Pol Pract 39(7–9):632–650
44. Fellows NT, Pitfield DE (2000) An economic and operationalevaluation of urban car-sharing. Transport Res Transport Environ5(2000):1–10
45. Sælensminde K (2004) Cost–benefit analyses of walking andcycling track networks taking into account insecurity, healtheffects and external costs of motorized traffic. Transport ResPol Pract 38:593–606
46. Börjesson M, Eliasson J (2010) The value of time and externalbenefits in bicycle cost-benefit analyses. Selected proceedings ofthe 12th WCTR, July 11–15, 2010 – Lisbon, Portugal
150 Eur. Transp. Res. Rev. (2012) 4:137–152
47. Massé E (2005) Analyse économique de la rentabilité des filtres àparticules sur les véhicules diesels neufs. Économie et Prévision(167) 2005-1:13–25
48. Bollen J, van der Zwaan B, Brink C, Eerens H (2009) Local airpollution and global climate change: A combined cost-benefitanalysis. Resource Energ Econ 31(2009):161–181
49. Lee J, Kang S, Kim CK (2009) Software architecture evaluationmethods based on cost benefit analysis and quantitative decisionmaking. Empir Software Eng (14):453–475
50. Pompili T (2005) Valutazione economica di interventi complessidi trasformazione urbana: un metodo operativo, in Valutazioneeconomica di progetti, piani e programmi complessi di trasfor-mazione urbana, IRER, Regione Lombardia, Milan
51. Damart S, Roy B (2009) The uses of cost- benefit analysis inpublic transportation decision-making in France. Transport Pol(16):200–212
52. Diakoulaki D, Grafakos S (2004) Externalities of energy: extensionof accounting framework and policy applications. Final Report onWork Package 4
53. Tsamboulas D, Mikroudis G (2000) EFECT—evaluation frame-work of environmental impacts and costs of transport initiatives.Transport Res Transport Environ 5:283–303
54. Maltese I, Mariotti I, Oppio A (2011) An ex-post assessment ofsustainable mobility: the case of European neighbourhoods,Territorio (59):51–58
55. Campos Gouvêa VB, Rodrigues Ramos RA, de Miranda D,Correia S (2009) Multi-criteria analysis procedure for sustainablemobility evaluation in urban areas. J Adv Transp 43(4):371–390
56. Lautso K, Spiekemann K, Wegener M, Sheppard I, Steadman P,Martino A, Doming R, Gayda S (2004) PROPOLIS – FinalReport, 2nd Edition, Finland
57. TRANSPLUS (2002) Analysis of land use and transport indicators,transport planning land-use and sustainability public deliverablesD2.2 and D3. http://www.transplus.net
58. PROSPECTS – Procedures for Recommending Optimal Sustain-able Planning of European City Transport Systems Results (2004)Cities’ Decision-Making Requirements. http://www-ivv.tuwien.ac.at/projects/prospects.html
59. Tzeng G, Lin C, Opricovic S (2005) Multi-criteria analysis ofalternative-fuel buses for public transportation, Energy Policy, 33,pp. 1373–1383
60. Yedla S, Shrestha R (2003) Multi-criteria approach for the selectionof alternative options for environmentally sustainable transportsystem in Delhi. Transport Res Pol Pract 37:717–729
61. Cerreta M (2004) Strategie integrate di sostenibilità: le valuta-zioni ex-post per la costruzione dell’“alternativa ecologica. In:Fusco Girard L, Nijkamp P (eds) Energia, bellezza partecipa-zione: la sfida della sostenibilità. Valutazioni integrate tra con-servazione e sviluppo. Franco Angeli, Milano, pp 420–459
62. Cerreta M, Salzano I (2009) ‘Green urban catalyst’: An ex-postevaluation of sustainability practices, Proceedings REAL CORP2009 Tagungsband, 22–25 April 2009.
63. Fusco GL, Forte B, Cerreta F, De Toro P, Fabiana F (2003)L’uomo e la città. Franco Angeli, Milano
64. Nijkamp P, Oirschot G, Oosterman A (1993) Regional develop-ment and engeneering creativity: an instrumental comparison ofscience parks in a knowledge society, Research memoranda. FreeUniversity, Amsterdam
65. Maltese I, Mariotti I (2011) Sustainable mobility in Europe: the roleof participation at the neighbourhood scale. TeMA 4(4):35–46
66. Gilbert R, Irwin N, Hollingworth B, Blais P (2002) SustainableTransportation Performance Indicators (STPI) Project, Report forPhase 3. Centre for Sustainable Transportation, Winnipeg
67. Gilbert R, Tanguay H (2000) Sustainable transportation perfor-mance indicators project. Brief review of some relevant
worldwide activity and development of an initial long list ofindicators. The Centre for Sustainable Transportation, Toronto
68. Gudmundsson H (2003) Sustainable mobility and indicator sys-tems in transport policy. UNESCO, Blackwell Publishing Ltd,Malden
69. Litman TA (2003) Measuring transportation. Traffic, mobilityand accessibility. ITE Journal 73(10):28–32
70. Litman T (2007) Well Measured: Developing Indicators for Com-prehensive and Sustainable Transport Planning. Victoria Trans-port Policy Institute (www.vtpi.org; www.vtpi.org/wellmeas.pdf)
71. Litman T (2008) Sustainable Transportation Indicators: A Recom-mended Research Program For Developing Sustainable Transporta-tion Indicators andData, By the Sustainable Transportation IndicatorsSubcommittee of the Transportation Research Board, 10 November
72. Litman T (2011) Developing indicators for comprehensive andsustainable transport planning. Available at www.vtpi.org/sus_tran_ind.pdf
73. Rassafi AA, Vaziri M (2005) Sustainable transport indicators:definition and integation. Int J Environ Sci Tech 2(1):83–96
74. Euromobility (2008) Lo mobilità sostenibile in Italia: indaginesulle principali 50 città, www.euromobility.org
75. Joumard R, Gudmundsson H (eds) (2010) Indicators of environ-mental sustainability in transport: an interdisciplinary approach tomethods, INRETS report, Recherches R282, Bron, France,(http://hal.archives-ouvertes.fr/hal-00492823/fr/)
76. Yigitcanlar T, Dur F (2010) Developing a Sustainability AssessmentModel: The Sustainable Infrastructure, Land-Use, Environment andTransport Model. Sustainability (2):321–340
77. Holden E (2007) Achieving sustainable mobility: everyday andleisure-time travel in the EU. Ashgate, Aldershot
78. Mohring H (1993) Maximizing, measuring, and not doublecounting transport improvement benefits: A primer on closed-and open-economy cost-benefit analysis. Transport Research B27(6):413–424
79. Mohring H (1972) Optimization and scale economies in urbanbus transportation. Am Econ Rev 62(4):591–604
80. Graham DJ (2006) Wider economic benefits of transportimprovements: link between agglomeration and productivity.Imperial College London, London
81. DfT (2006) Transport, Wider Economic Benefits and Impacts onGDP. Department for Transport, London
82. DfT (2009) The Wider Impacts Sub-Objective. TAG Unit 3.5.14.Department for Transport Transport Analysis Guidance (TAG).Department for Transport, London (UK)
83. Venables AJ (2004) Evaluating urban transport improvements:Cost-Benefit Analysis in the presence of agglomeration andincome taxation, CEP Discussion Paper No 651. Centre forEconomic Performance, LSE, London
84. Ponti M, Scopel E (2010) Land Rent, Transport Policies andBuilding Constraints. Selected proceedings of the 12th WCTR,July 11–15, 2010 – Lisbon, Portugal
85. Krutilla K (2005) Using the Kaldor-Hicks Tableau format for theteaching and practice of project appraisal and policy analysis. JPol Anal Manag 24(4):864–875
86. Morisugi H, Ohno E (1995) Proposal of a benefit incidencematrix for urban development projects. Reg Sci Urban Econ(25):431–481, Elsevier
87. Campbell HF, Brown RPC (2003) Benefit-cost analysis. Financialand economic appraisal using spreadsheets. Cambridge UniversityPress, Cambridge
88. Kelly C, May A, Jopson A (2008) The development of an optiongeneration tool to identify potential transport policy packages.Transport Pol 15(6):361–371
89. Damart S, Roy B (2002) L’analyse Coûts-Avantages, outil deconcertation et de légitimation? Metropolis (108/109):7–16
Eur. Transp. Res. Rev. (2012) 4:137–152 151
90. Sayers TM, Jessop AT, Hills PJ (2003) Multi-criteria evaluationof transport options—flexible, transparent and user-friendly?Transport Pol 10:95–105
91. Bristow AL, Nellthorp J (2000) Transport project appraisal in theEuropean Union. Transport Pol (7):51–60
92. DG REGIO (2008) Guide to Cost-Benefit Analysis of investmentprojects. Structural Funds, Cohesion Fund and Instrument forPre-Accession, European Commission, Directorate GeneralRegional Policy
93. Macharis C, De Witte A, Turcksin L (2010) The Mutli-ActorMulti-Criteria Analysis (MAMCA) application in the Flemishlong-term decision making process on mobility and logistics.Transport Pol 17:303–311
94. Mairate A (2010) The rationale for economic evaluation inEurope: the case of EU Regional Policy, Cuadernos Económicosde ICE, No. 80(2010)
95. DfT (2007) The NATA Refresh: Reviewing the New Approach toAppraisal. Department for Transport
96. Eijgenraam CJJ, Koopmans CC, Tang PJG, Verster ACP (2000)Evaluation of infrastructural projects; Guide for cost-benefit anal-ysis. CPB NEI, Rotterdam
97. CEDEX (2010) Guide on economic evaluation of transport projects,Centro de Estudios y Experimentación de Obras Públicas(CEDEX). Ministerio de Fomento, Gobierno de España
98. EIB (2005) RAILPAG - Railways Project Appraisal Guidelines,European Commission and European Investment Bank, availableat: www.railpag.com
99. Voogd H (1983) Multicriteria evaluation for urban and regionalplanning. Pion Ltd., London
100. Castillo H, Pitfield D (2010) ELASTIC – A methodologicalframework for identifying and selectingsustainable transportindicators. Transp Res Part D: Transp Environ 15(4):179–188
101. UN (2011) Sustainable Transport Evaluation, Developing Practi-cal Tools for Evaluation in the Context of the CSD Process, UN -Department of economic and social affairs, background paperNo.10
102. Næss P (2006) Cost-benefit analyses of transportation investments:neither critical nor realistic. Journal of Critical Realism 5(1),London (Great Britain)
103. Vickerman R (2007) Recent evolution of research into thewider economic benefits of transport infrastructure invest-ments, Discussion paper 2007-9, OECD and InternationalTransport Forum
104. OECD and ITF (2008) The wider economic benefits of transport:macro, meso and micro transport planning and investment tools,Discussion paper 2008-06, OECD and International TransportForum
152 Eur. Transp. Res. Rev. (2012) 4:137–152


