
Mutational Analysis of Selected High-
Grade Malignancies in a
Premenopausal Gynecologic Cancer
Population: A Potential for Targeted
Therapies?
Lauren J. Pinckney, MD
OB/GYN Faculty Mentor:
Larry E Puls, MD

Disclosures
I have no meaningful conflicts of interest to
disclose

Background
Incidence (2017)
% Cases < 45 yo(2009-2013)
5 yr survival (2006-2012)
Ovarian ~22K 12.3 46.2
Endometrial ~61K 7 81.7
Cervical ~13 38.3 67.5
Gynecologic Cancer

Background
• Identified mutations in these cancers may
identify novel therapeutics for targetable
mutations to improve outcomes

Objectives
• Identify genetic abnormalities in aggressive
gynecologic cancers in young women (<40
years of age)
• Evaluate mutational patterns that may be
predictive of outcomes
• Identify potential novel treatment options.

Study Design
21 patients
6 poor outcomes 14 good outcomes
20 met inclusion criteria
1 inadequate tissue
Retrospective Cohort

Materials and Methods
Clinicopathologic Data Collection
Gynecologic Pathologist Review
Genomic Sequencing
Mutational Function Evaluation
Targeted Therapy Review

Analysis
• Cohorts compared across clinicopathologic,
demographic, and genetic variables using 1- and 2-tailed
t-tests and ANOVA
• Classification and Regression Tree (CART) analysis
produced a predictive model for outcome (Salford
Systems’ SPM7)
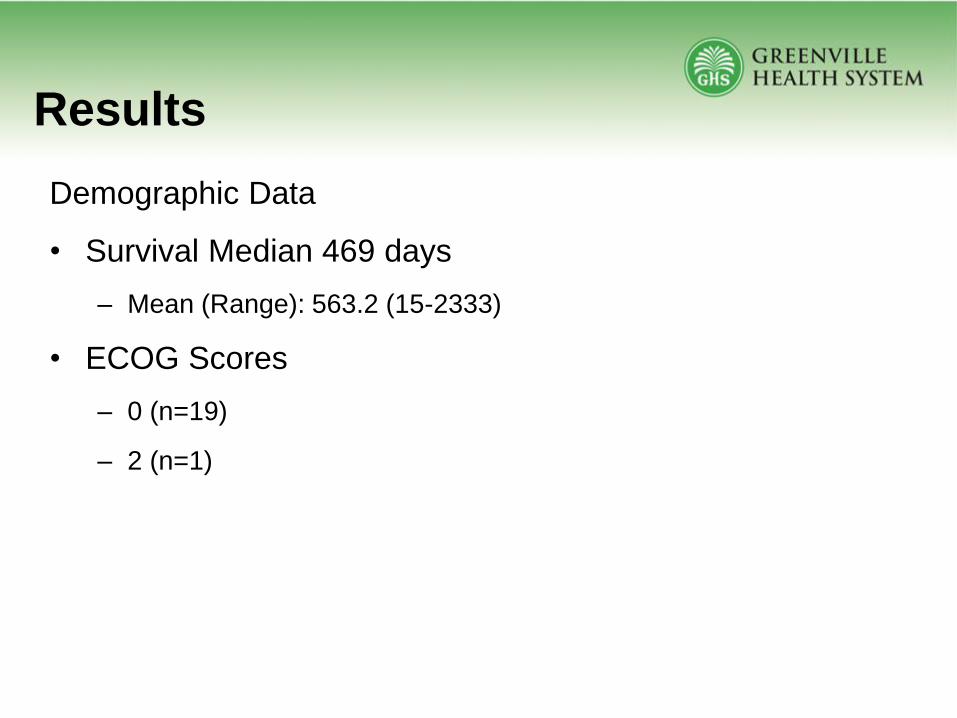
Results
Demographic Data
• Survival Median 469 days
– Mean (Range): 563.2 (15-2333)
• ECOG Scores
– 0 (n=19)
– 2 (n=1)

Results
Primary Tumor Site
n=20 P-value
Ovary/Peritoneal 12 (60%)
0.495Endometrial 5 (25%)
Cervical 3 (15%)
Tumor Data
HistologicGrade
n=20 P-value
Low Grade (Sarcoma)
1 (5%)
n/aII 1 (5%)
III 17 (85%)
IV 1 (5%)Histologic Type n=20 P-value
Epithelial (Serous/Clear Cell/Mucinous)
10 (50%)
0.159
Neuroendocrine 4 (20%)
Sarcoma 3 (15%)
High Grade Sex Cord Stromal
2 (10%)
Endometrioid(Cervix)
1 (5%)
Stage (FIGO/Sarcoma Scale)
n=20 P-value
I 6 (30%)
0.848II 3 (15%)
III 9 (45%)
IV 2 (10%)

Results
400 genes examined
230 code for protein dysfunction
170 no associated dysfunction
218 no significant assoc with outcomes
12 dysfunction-coding genes associated with outcomes
6 with mutation targeted therapy identified
6 no targeted therapy
Mutations for Dysfunction and Therapeutic Targets
ALKASXL
ASXL1EGFR
NTRK1ROS1

Epithelial Profile
Location Chemo Novel Targets (n) Profiles
Ovary 7 (64%)
Carbo/Taxol (7) AKAP9 (3)CMPK (1)MBD1 (1)ASXL1 (1)ERBB3 (2)KMT2D (1)
ERBB3 only (1)*AKAP9 only (3)
CMPK, ASXL1, ERBB3 (1)MBD1, KMT2D (1)
Cervix 2 (18%)
CarboTaxol (1)Plat/Etop (1)
None n/a
Endometrial 2 (18%)
Carbo/Taxol (2) CMPK (1)MBD1 (1)ROS1 (1)
GPR124 (1)
CMPK, MBD1 (1)ROS1, GPR124 (1)

Neuroendocrine Profile
Location Chemo Novel Targets (n) Profiles
Ovary 2(50%)
Plat/Etop (2) AKAP9 (1)ASXL1 (1)MBD1 (1)
ALK (1)GPR124 (1)KMT2D (1)
AKAP9, ASXL1, MBD1 (1)ALK, GPR134, KMT2D (1)*
Cervix 1 (25%)
Plat/Etop (1) AKAP9 (1)ASXL1 (1)
CMPK1 (1)
AKAP9, ASXL1, CMPK1 (1)
Endometrial 1 (25%)
Carbo/Taxol(1)
ROS1 (1)ALK (1)
ERBB3 (1)GPR124 (1)KMT2D (1) NTRK1 (1)
ROS1, ALK, ERBB3, GPR134,KMT2D, NTRK1 (1) *

Sarcoma/Other Profile
Location Chemo Novel Targets (n) Profiles
Ovary 3(60%)
Plat/Etop (1)None (1)Unknown (1)
MBD1 (1)ROS1 (3)EGFR (1)
ERBB3 (1)KMT2D (1)NTRK1 (1)
MBD1, ROS1 (1)ROS1, EGFR (1) *
ROS1, ERBB3, KMT2D, NTRK1 (1)*
Endometrial 2 (20%)
Gemzar/Taxotere(1)None (1)
CMPK1 (1)MBD1 (1)
GPR124 (1)
CMPK, MBD1 (1)GPR124 only (1)*

Mutation Profiles
Cancer Type Location Chemo Mutation ProfileMutation
Load
Epithelial Ovary Carbo/Taxol ERBB3 only (1) 22
NE Ovary Plat/Etoposide ALK, GPR124, KMT2D (1) 27
Endometrial Carbo/TaxolROS1, ALK, ERBB3, GPR124,
KMT2D, NTRK1 (1)111
Unknown ROS1, EGFR (1) 27
Sarcoma/Other Ovary NoneROS1, ERBB3, KMT2D,
NTRK1 (1)29
Endometrial None GPR124 (1) 21
Mutation profiles associated with poor
outcome in our cohort

Genes mutated in our cohort
found to be significant: Targeted
therapiesGene N=20 P-value (1-
tailed)P-value (2-tailed)
Targeted Therapy
ASXL1 3 (15%) 0.120 0.022 Sorafenib
ALK 2 (10%) 0.010 0.022 Crizotinib, Ceritinib
EGFR 1 (5%) 0.065 0.130 Erlotinib, Afatinib, Gefitinib
ERBB3 4 (20%) 0.014 0.028 MM-121, MM-111, U3-1287/AMG-888 (clinical trials)
GPR124 4 (20%) 0.014 0.028 miR-138-5p (cell lines)
KMT2D 4 (20%) 0.014 0.130 None currently
NTRK1 2 (10%) 0.109 0.022 Imatinib
AKAP9 5 (25%) 0.050 0.100 None currently
ASXL 2 (10%) 0.011 0.241 Sorafenib
CMPK1 5 (25%) 0.050 0.100 Deactivation of gemcitabine
MBD1 5 (25%) 0.050 0.100 Drug resistance
ROS1 5 (25%) 0.050 0.100 Crizotinib

ResultsCART Profile for Poor Outcome
n=20
Outcomes: 6 bad, 14 good
AKAP9 (+) n=5 (100% good) AKAP9 (-)
MBD1 (+) n=4 (100% good)
MBD1 (-)
Mutational Load <20.5 n=2 (100% good)
Mutational Load > 20.5
APC (+) n=2
(100% good)APC (-)
APBL2 (+) n=1 (100% good)
APBL2 (-) n=6 (100% bad)

Conclusions
• Go with standard therapy until you find a reason to do otherwise
• Potential value in novel targeted therapies
• Synergy between genotyping and phenotyping
• Established framework (pilot study)
• Could patient who did well with standard therapy have done better with targeted therapy?

Future Studies
• Larger cohorts
• Prospective research protocol
• Development of genetic platform

• Strengths
– Large number of genes
– Looking at multiple variables at once
– CART analysis (unique and novel in this field)
• Weaknesses
– Small cohort
– Variability in patient population
Discussion

Acknowledgements
Thanks to:
• Justin Collins
• Matt Gevaert
• Dr. Christine Schammel
• Dr. David Schammel
• Catherine Davis
• Katie Floyd
• Dr. Jeff Elder
• Dr. Jeff Edenfield

References
• Siegel, R., Miller, K.D., Jemal, A. (2017) Cancer Statistics, 2017. CA Cancer J. Clin., 67: 7-30. 7-30.
• SEER Cancer Stat Fact Sheets. National Cancer Institute. Seercancer.gov/statfacts
• Genetics.bwh.harvard.edu/pph2/dokuwiki/about
• www.drugbank.ca
• Manchana, T., Ittiwut, C., Kavanagh, J. Targeted Therapies for Rare Gynecological Cancers. Lancet
Oncol., 11 (2010), pp. 685-693.
• Jelinic, P., Mueller, J.J., Olvera, N., Dao, F., Scott, S.N., Shah, R., Gao, J., Schultz, N., Gonen, M.,
Soslow, R.A., Berger, M.F., Levine, D.A. Recurrent SMARCA4 Mutations in Small Cell Carcinoma of
the Ovary. Nat. Genet., 46 (2014), pp. 424-428.
• Gerlinger, M., Rowan, A.J., Horswell, S., Larkin, J., Endesfelder, D., Gronroos, E., Martinez, P.,
Matthews, N., Stewart, A., Tarpey, P., Varela, I., Phillimore, B., Begum, S., McDonald, N.Q., Butler,
A., Jones, D., Raine, K., Latimer, C., Santos, C.R., Nohadani, M., Eklund, A.C., Spencer-Dene, B.,
Clark, G., Pickering, L., Stamp, G., Gore, M., Szallasi, Z., Downward, J., Futreal, P.A., Swanton, C.
Intratumor Heterogeneity and Branched Evolution Revealed by Multiregion Sequencing. N. Engl. J.
Med., 366 (2012), pp. 883-892.
• Roychowdhury, S., Iyer, M.K., Robinson, D.R., Lonigro, R.J., Wu, Y.M., Cao, X., Kalyana-Sundaram,
S., Sam, L., Balbin, O.A., Quist, M.J., Barrette, T., Everett, J., Siddiqui, J., Kunju, L.P., Navone, N.,
Araujo, J.C., Troncoso, P., Logothetis, C.J., Innis, J.W., Smith, D.C., Lao, C.D., Kim, S.Y., Roberts,
J.S., Gruber, S.B., Pienta, K.J., Talpaz, M., Chinnaiyan, A.M. Personalized Oncology through
Integrative High-Throughput Sequencing: A Pilot Study. Sci. Transl. Med., 3 (2011), 111ra121.


To come..
• Discussion slides for
– CART
– SIFT/Polyphen
• Genes associated with phenotypes

Demographics (1 of 2)

Demographics (2 of 2)

Genes associated in the literature
Epithelial Neuroendocrine Sarcoma
APCARID1A
BRAFBRCA1BRCA2
CDKN2ACTNNB1 DNMT3A
ERBB2FBXW7FGFR2KRASMLH1MSH6MYCNF1
NRASPIK3CA
PPP2R1APTENRNF43
SMARCA4TP53
APCFHIT
FGFR1KRASMCC
MEN-2MYCLP16
PTENR8
SOXTP53
BRCA2CTNNB1
EGFRFOXL2c-KITP16
TP53


