Mycorrhizal responses under elevated CO2 – combining fungal and plant
perspectives
Odair Alberton
Promotor: Prof. dr. Th.W. Kuyper
Persoonlijk Hoogleraar bij de Sectie Bodemkwaliteit Wageningen Universiteit
Co-promotor: Dr. ir. A. Gorissen IsoLife, Wageningen
Samenstelling promotiecommissie: Prof. dr. J.V. Colpaert, Universiteit Hasselt, Belgium Prof. dr. P. Kabat, Wageningen Universiteit Prof. dr. ir. G.M.J. Mohren, Wageningen Universiteit Prof. dr. M.C. Rillig, Freie Universitaet Berlin, Germany Dit onderzoek is uitgevoerd binnen de C.T. de Wit onderzoekschool ‘Production Ecology and Resource Conservation’.
Mycorrhizal responses under elevated
CO2 – combining fungal and plant perspectives
Odair Alberton
Proefschrift ter verkrijging van de graad van doctor
op gezag van de rector magnificus van Wageningen Universiteit
Prof. dr. M.J. Kropff in het openbaar te verdedigen
op dinsdag 29 april 2008 des namiddags te vier uur in de Aula
Mycorrhizal responses under elevated CO2 – combining fungal and plant perspectives Alberton, O. Ph.D thesis Wageningen University, Wageningen, 2008. – With references. – With summary in English and Dutch. ISBN 978-90-8504-910-4
Abstract Alberton, O. 2008. Mycorrhizal responses under elevated CO2 – combining fungal and plant perspectives. Ph.D. thesis, Wageningen University, Wageningen, the Netherlands, 148 pages. The rising level of atmospheric carbon dioxide (CO2) combined with increased nutrient (especially nitrogen) availability are predicted to have substantial impacts on plant growth and the functioning of ecosystems. Soil micro-organisms, especially mycorrhizal fungi that form mutualistic associations with plant roots, are key factors in the functioning of ecosystems. Studies of plant responses are therefore of limited realism, if the mycorrhizal symbiosis is ignored. It is therefore important to understand the diversity, extent and dynamics of the mycelia of mycorrhizal fungi in soils. This thesis focuses on the interactions between mycorrhizal fungi, mycorrhizal plants, elevated CO2, and nutrient availability.
I consider mycorrhizal fungal and plant responses separately under elevated atmospheric CO2 to test a model that assumes that increased C availability to the fungus will not automatically feed back to enhanced plant growth performance. I use meta-analyses across independent studies and compare the responses of ectomycorrhizal (ECM) and arbuscular mycorrhizal (AM) fungi, and ECM and AM plants. Responses of both mycorrhizal fungi and mycorrhizal plants to elevated CO2 are significantly positive. Fractional colonization is an unsuitable fungal parameter to determine fungal responses to elevated CO2, at least for ECM systems. Fungal identity and plant identity are important parameters that are affected by elevated CO2. For ECM systems the data show the need for a conceptual separation of mycocentric and phytocentric perspectives, while for AM systems the responses of both partners are not significantly different.
I performed an experiment to investigate fungal species-specific responses of ECM Scots pine (Pinus sylvestris) seedling growth and nutrient uptake together with mycelial development under N-limitation and different C availability. I observed that at elevated CO2 shoot-to-root ratio decreased, most strongly so in ECM species with the largest extraradical mycelium. Under elevated CO2, ECM root growth increased more than hyphal growth. Extraradical hyphal length was significantly negatively correlated with shoot biomass, shoot N content and total plant N uptake. Fungal sink strength for N strongly affected plant growth through N immobilization. This mycorrhizal fungal-induced Progressive Nitrogen Limitation (PNL) has the potential to generate negative feedback with plant growth under elevated CO2.
Following these results I investigated fungal species-specific responses of ECM Scots pine seedlings under ambient and elevated CO2 and under low and high N availability. Most plant and fungal parameters were significantly affected by fungal species, CO2 level and N supply. Under N limitation and at elevated CO2, a large part of photoassimilates were rapidly wasted in respiration through a mycorrhizal overflow CO2 tap. Increasing N availability potentially relieved mycorrhiza-induced PNL under elevated CO2.
I also investigated the effects of different Dark Septate root Endophytic fungi (DSE) on growth and nutrient status of Scots pine seedlings because nothing was known about the direction and magnitude of their effects under conditions of N-limitation and elevated CO2. None of the DSE fungi caused mortality in the host. Under elevated CO2 plant biomass increased on average by 17% when inoculated with DSE. Shoot N concentration decreased by
57% under elevated CO2. Even though under elevated CO2 and low N availability the length of extraradical hyphae increased by 53% and no evidence was found for significant N competition with the host. I conclude that the impact of DSE is more through improved nutrient use efficiency by the plant than through enhanced nutrient acquisition. Possibly, DSE react differently to global change than ECM fungi, indicating that there are limits to the degree of similarity in mutualistic function between both groups.
In conclusion, only under conditions where the amount of extraradical mycelium is sub-optimal from the perspective of plant nutrition, will increased mycelial biomass, induced by elevated CO2, be profitable for the plant. If, however, the amount of extraradical mycelium is already supra-optimal from a phytocentric perspective, further increases in C allocation to the fungus will increase fungal fitness but will not be profitable to the plant. Increased fungal fitness could then enhance PNL. The diversity among fungal species and their individual responses to CO2 and nutrient availability will therefore have a major impact on plant performance. My findings have therefore confirmed the need to conceptually separate mycocentric and phytocentric views.
Key words: Carbon and nitrogen allocation, elevated CO2, ectomycorrhizal fungi, mycocentric, phytocentric, meta-analysis, dark septate endophytes, Pinus sylvestris, extraradical hyphae, global change, N immobilization, progressive nitrogen limitation.
Preface About five years ago I came to The Netherlands aiming to do my PhD. During this time I have collected innumerous good memories. It was my first flight and my first time abroad. Now I would like to acknowledge the people who helped me, in one way or another, to finally accomplish this work. I will try not to forget anybody but if I do, please forgive me.
First I would like to especially thank my promoter and friend Prof. Dr. Thom W. Kuyper, who gave me intensive guidance and intellectual stimulation throughout the entire project. I want to emphasize that his door was always open for me and he has been always available to discuss theoretical and practical issues of my work. I also thank Dr. Ton Gorissen for the arrangements to run experiments in the ESPAS growth chambers, for giving me advice about the methodological part of my PhD project and for discussing the results with me.
Thanks to Prof. Dr. Lijbert Brussaard for believing in my capabilities at first sight, and for inviting me to come to The Netherlands for a PhD program. I should also acknowledge him for the support he gave to my wife in searching for her PhD project during the period I would stay in Wageningen. Thanks to Dr. Mariangela Hungria and Dr. George G. Brown for their prompt encouragement to me to take the challenge of this project. Without their support, I doubt if I would have accepted my fate in the world of mycorrhizal responses to global change.
I am grateful to the C. T. de Wit Graduate School for Production Ecology and Resource Conservation (PE&RC) of Wageningen University and Research Centre, The Netherlands for funding my PhD project.
I would like to acknowledge the support from Dr. Greet Blom-Zandstra of Plant Research International to enable the use of the ESPAS growth chambers for my experiments. Also I would like to thank Barbara Drigo for sharing the CO2 flow cabinets and Gregor Disveld (both at NIOO- CTO in Heteren) for helping me to take care of the experiments in that research institute.
Thanks to Winnie van Vark and Esther van den Brug for carefully dealing with visa applications, insurances, financial problems and so many other issues that I would not manage by myself.
Special thanks Eduardo and Isabela, Mario and Ana, and Nicole who helped my wife and me to take the first steps in Wageningen, and instructed us about obligations that a foreigner has to follow when arriving in the Netherlands. Thanks also to Nicole, Debby, Walter, Gijs, Gerard and Erwin for translating several Dutch letters and forms, which I received and had to respond to, into English. With their help I avoided some troubles and could take advantage of some of the good things about Dutch life.
Thanks to my wonderful friends and paranymphs Maria Betânia Gonçalves and Debby Los for accepting the duty of standing next to me and supporting me during my PhD defense. I am also grateful for the friendship and support of a great number of people from the Department of Soil Quality, making my stay in Wageningen more pleasant: Walter, Bert, Erwin, Ellen, Franciska, Dorien, Gerard, Laura, Monika, Gijs, Paul, Petra, Julia, Ellis, Ron, Erwin, Jan-Willem, Liping, Maria, Rasoul, Ram, Winnie, Esther, Riëtte, Tamas, Tjisse, Gerwin, Jaap, Willeke, Willem, Gerda, Arie, Peter, André, Gerlinde, Aliou, Gerson, Pierre, Jaccques, Birang, Makumba, Renske, Bert, Mark, Minke, Steven, Jacintha, Marieke and Fredrick. Thank you all for the enjoyable coffee breaks, for the fun we had in the “We-days” and “days out” trips.
I had a great time with dinners, barbecues, bicycle trips and pubs with many Brazilians friends that I met in Wageningen: Celso and Rita, Marcia (I always remember you for your energy to go out! “vamos lá!” let’s go!), Isabella, Luciana, Anabelle, Manuel and Vania, Simone and Cristiano, Irene, Larissa, Flávia, Paulinho, Ruberto, Tiago, Rubia, Fernando, Anderson, Flávio, Michael, Saulo, Ulisses, Cinara, Vanja, Haissa, Lílian, Sabrina, Milza, Francisco, Tania, Joana, Zé Marcio and many others. These people gave me warm and bright energy to continue working under the gray and cold weather of Netherlands. But I also had the chance to meet many foreigners outside my work and we had good moments. Thanks Patricia, Claudia, Wiebe, Arne, Vasileios, Stefano, Eike, Pim, Taas, Irene, René and all the corridor mates of Bornsesteeg 16A during 2004-2006.
Eu gostaria de agradecer minha família e amigos do Brasil que mesmo longe, ficaram torcendo por mim. Obrigado especial para o meu pai Orlando E. Alberton, minha mãe Maria Salete Alberton e meu irmão Adalcio Alberton por acreditarem em mim e apostarem sempre no meu sucesso!
Last but surely not least, I want to thank my wife Glaciela and my son Valentin for motivating me when things looked too heavy and for reassuring me that the family would support me on any of my decisions. Glaciela and Valentin you are very special to me.
Odair Alberton Wageningen, The Netherlands, April 2008
Contents Chapter 1 General Introduction 11 Chapter 2 Taking mycocentrism seriously: Mycorrhizal fungal and plant
responses to elevated CO2
19
Chapter 3 Competition for nitrogen between Pinus sylvestris and
ectomycorrhizal fungi generates potential for negative feedback under elevated CO2
35
Chapter 4 Ectomycorrhizal fungi associated with seedlings of Pinus
sylvestris respond differently to increased carbon and nitrogen availability – implications for ecosystem responses to global change
55
Chapter 5 Responses of Scots pine growing in association with dark
septate root endophytic fungi under nitrogen limitation and elevated CO2
73
Chapter 6 General Discussion 91 Appendix 111 Summary 117 Samenvatting 121 References 125 List of publications 143 About the author 145 PE&RC PhD Education Statement Form 147

Chapter 1
General Introduction
Odair Alberton
Chapter 1
Relevance The rising level of atmospheric carbon dioxide (CO2) is predicted to have substantial impacts on plant growth and the functioning of ecosystems. The extent to which plant growth is enhanced depends on the balance between the acquisition of the resources above-ground and below-ground. If increased resource availability above-ground (elevated CO2) is not matched with increased resource availability below-ground (nutrients, water), plant photosynthesis will ultimately be down-regulated without long-term beneficial effects. For that reason it is important to understand below-ground responses of plants to global change (elevated atmospheric CO2, also N deposition). A key factor in ecosystem functioning is the role of soil microorganisms, especially mycorrhizal fungi. Studies of plant responses might therefore be of limited realism, if the mycorrhizal symbiosis, a mutually beneficial association between certain root-inhabiting fungi and plant roots, is ignored. It is therefore important to understand the diversity, extent and dynamics of mycelia of mycorrhizal fungi in soils. Plant responses to elevated CO2 have mostly been studied from an exclusive plant perspective, the phytocentric approach, whereas the fungal perspective, the mycocentric approach, has been neglected. In a mycocentric approach, potential competition between plants and fungi for carbon (C) and nutrients, as determined by their relative sink strengths, plays an important role (Fitter et al., 2000; Alberton et al., 2005; Staddon, 2005). Fitter et al. (2000) were the first to explicitly argue that research on mycorrhizas has been too phytocentric. They argued that a better understanding of mycorrhizal plant and fungal responses to global change needs a stronger emphasis on the biology of the fungal partner. In particular, the diversity among fungal species and their individual responses to CO2 and nutrient availability will have a major impact on plant performance. In line with these arguments, Gorissen and Kuyper (2000) showed that the ability of ectomycorrhizal (ECM) Scots pine to respond positively to elevated CO2 depended on the fungal species present on the roots.
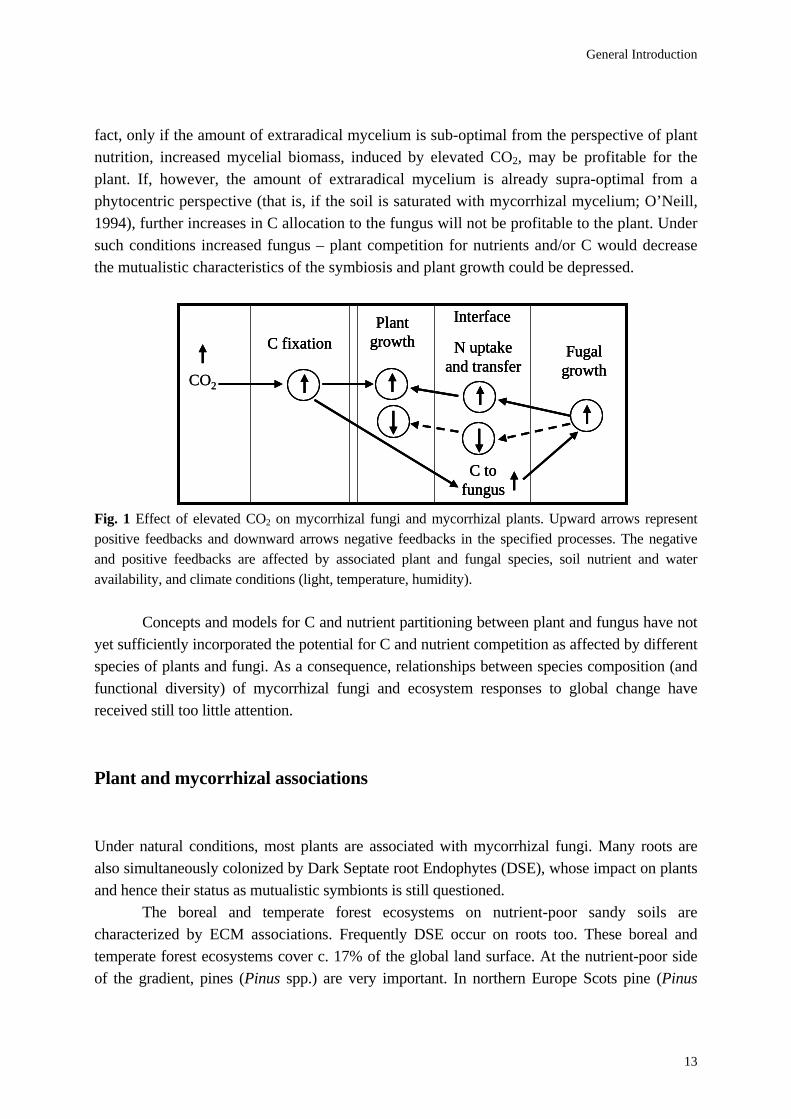
Nutrient demand of different ECM fungi and the subsequent nutrient transfer from fungus to plant, in exchange for reduced C, are crucial factors in determining responses of forests to elevated levels of CO2 for several reasons: (1) especially N limits tree growth in most forest ecosystems, and ECM fungi play a central role in the mobilization and acquisition of N (Read et al., 2004); (2) within ECM fungi there is a tight coupling between C and N nutrition (Fig. 1).
An important question is therefore how both plant and fungus exert control over this additional C, and whether this additional C feeds back through increased nutrient uptake to sustain increased growth and photosynthetic activity by the plant (Fitter et al., 2000) (Fig. 1). While several authors observed an increased production of extraradical mycelium of ECM fungi under elevated CO2 (e.g. Ineichen et al., 1995; Rouhier & Read, 1998), it does not automatically follow that this increase would be beneficial from a phytocentric perspective. In
12
General Introduction
fact, only if the amount of extraradical mycelium is sub-optimal from the perspective of plant nutrition, increased mycelial biomass, induced by elevated CO2, may be profitable for the plant. If, however, the amount of extraradical mycelium is already supra-optimal from a phytocentric perspective (that is, if the soil is saturated with mycorrhizal mycelium; O’Neill, 1994), further increases in C allocation to the fungus will not be profitable to the plant. Under such conditions increased fungus – plant competition for nutrients and/or C would decrease the mutualistic characteristics of the symbiosis and plant growth could be depressed.
CO2
C fixation Plant
growthInterface
N uptake and transfer
C to fungus
Fugal growthCO2
C fixation Plant
growthInterface
N uptake and transfer
C to fungus
Fugal growth
C fixation Plant
growthInterface
N uptake and transfer
C to fungus
Fugal growth
Fig. 1 Effect of elevated CO2 on mycorrhizal fungi and mycorrhizal plants. Upward arrows represent positive feedbacks and downward arrows negative feedbacks in the specified processes. The negative and positive feedbacks are affected by associated plant and fungal species, soil nutrient and water availability, and climate conditions (light, temperature, humidity).
Concepts and models for C and nutrient partitioning between plant and fungus have not
yet sufficiently incorporated the potential for C and nutrient competition as affected by different species of plants and fungi. As a consequence, relationships between species composition (and functional diversity) of mycorrhizal fungi and ecosystem responses to global change have received still too little attention.
Plant and mycorrhizal associations
Under natural conditions, most plants are associated with mycorrhizal fungi. Many roots are also simultaneously colonized by Dark Septate root Endophytes (DSE), whose impact on plants and hence their status as mutualistic symbionts is still questioned.
The boreal and temperate forest ecosystems on nutrient-poor sandy soils are characterized by ECM associations. Frequently DSE occur on roots too. These boreal and temperate forest ecosystems cover c. 17% of the global land surface. At the nutrient-poor side of the gradient, pines (Pinus spp.) are very important. In northern Europe Scots pine (Pinus
13
Chapter 1
sylvestris) is the most important conifer (Lindahl et al., 2002). The fungi forming ECM are predominantly basidiomycetes (Basidiomycota), and in some cases ascomycetes (Ascomycota). In the symbiosis the fungus forms a mantle around the terminal plant roots from which hyphae extend out into the soil for nutrient acquisition. The fungus also extends inward from the mantle, between the plant cortical cells, forming a network of specialized cells called the Hartig net, which is the interface for exchange of C and nutrients between plant and fungus (Smith & Read, 1997).
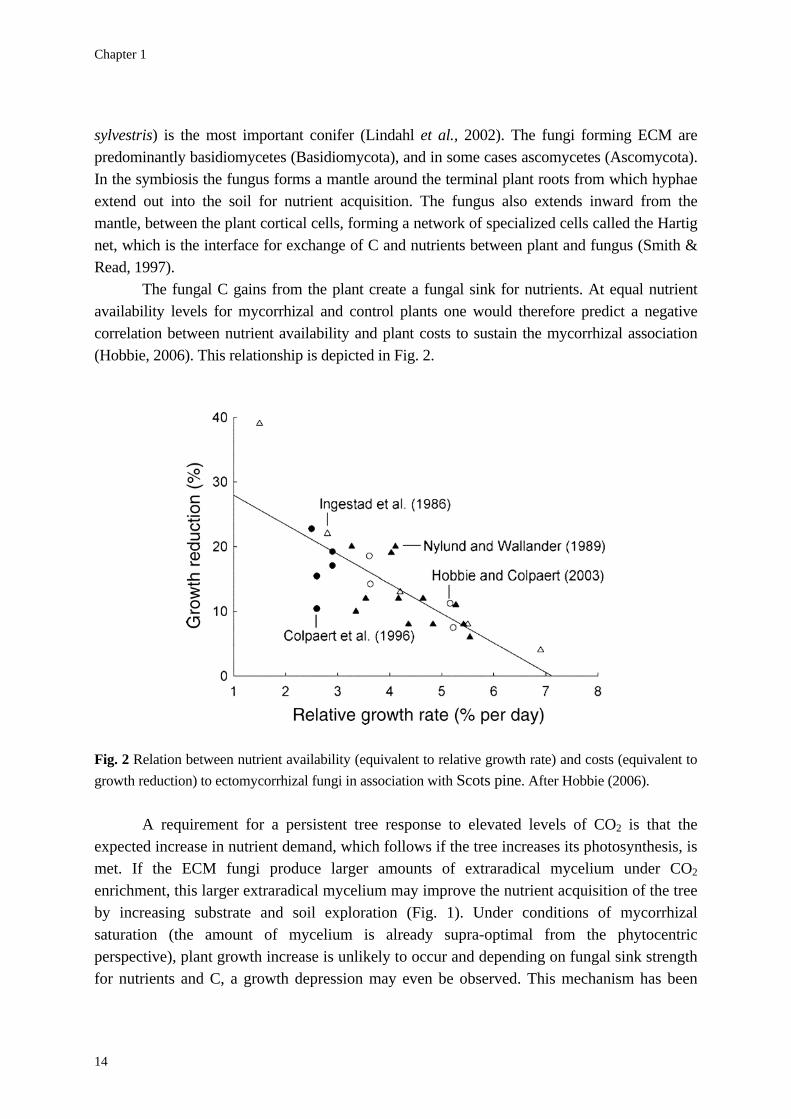
The fungal C gains from the plant create a fungal sink for nutrients. At equal nutrient availability levels for mycorrhizal and control plants one would therefore predict a negative correlation between nutrient availability and plant costs to sustain the mycorrhizal association (Hobbie, 2006). This relationship is depicted in Fig. 2.
Fig. 2 Relation between nutrient availability (equivalent to relative growth rate) and costs (equivalent to growth reduction) to ectomycorrhizal fungi in association with Scots pine. After Hobbie (2006).
A requirement for a persistent tree response to elevated levels of CO2 is that the expected increase in nutrient demand, which follows if the tree increases its photosynthesis, is met. If the ECM fungi produce larger amounts of extraradical mycelium under CO2 enrichment, this larger extraradical mycelium may improve the nutrient acquisition of the tree by increasing substrate and soil exploration (Fig. 1). Under conditions of mycorrhizal saturation (the amount of mycelium is already supra-optimal from the phytocentric perspective), plant growth increase is unlikely to occur and depending on fungal sink strength for nutrients and C, a growth depression may even be observed. This mechanism has been
14
General Introduction
mentioned in the literature as Progressive Nitrogen Limitation (PNL – Luo et al., 2004; Johnson, 2006; Hu et al., 2006; Reich et al., 2006).
It has been estimated that up to 30% of total photoassimilate production by the plant is required for growth and maintenance of the fungus (Ek, 1997; Nehls & Hampp, 2000; Nehls et al., 2001). Ectomycorrhizal fungal C demand will result in a major contribution to soil respiration. Heinemeyer et al. (2007) reported that soil CO2 flux components could be divided into soil heterotrophic (60%), ECM hyphal (25%), and root respiration (15%) from a young lodgepole pine (Pinus contorta) forest. In this study, the extraradical ECM mycelium contributed substantially more to soil CO2 flux than roots. The authors also observed that under conditions of nutrient limitation and elevated CO2, mycorrhizal respiration represented an overflow CO2 tap through which plant C was returned directly to the atmosphere due fungal respiration. This overflow CO2 tap (which indicates plant C wasted in respiration by the fungus) likely caused the lack of plant growth responses. This overflow CO2 tap is apparently fungal-species dependent (Gorissen & Kuyper, 2000). The below-ground 14C use efficiency in their study showed that Laccaria bicolor ‘wasted’ relatively much C under elevated CO2 and nutrient-poor conditions, whereas Suillus bovinus was still able to acquire nutrients and promote plant growth. Root associations with dark septate endophytes Besides mycorrhizal fungi, whose general functions are relatively well known, roots are often colonized by Dark Septate root Endophytic (DSE) fungi. This group, a polyphyletic assemblage of root and soil-inhabiting Ascomycota characterized by melanized hyphae, exhibit a very broad host range (Schadt et al., 2001). A review by Jumpponen & Trappe (1998a) reported that close to 600 plant species from more than 110 families across the world are hosts to DSE fungi. Despite their almost ubiquitous occurrence, the behavior of DSE on plant roots, and consequently their impact on plant performance and fitness are still poorly understood.
In the case of DSE, it is not known to what extent such differences in behavior are context-dependent, being influenced by the availability of plant C on the one hand and external nutrients on the other hand (Jumpponen & Trappe, 1998a,b; Jumpponen, 2001). Different outcomes of experiments with DSE on host plants can also be partly due to differences among various fungal taxa. Sieber & Grünig (2006) proposed that elevated CO2 could affect DSE diversity and function, but noted that nothing was known about the direction and magnitude of effects. For this reason more detailed studies of interactions between different DSE fungi and host plants are necessary to understand the functional basis of this association (Chapter 5).
15
Chapter 1
Aim of the thesis The aim of my studies was to transcend phytocentrism and to provide an additional mycocentric perspective on the functioning of the mycorrhizal symbiosis. I therefore investigated differences in fungal-species specific responses under ambient and elevated CO2 and under low and high N availability to determine the conditions under which global change can result in positive and negative feedbacks between plants (in this case seedlings of Scots pine) and fungi. More specifically, the aims were:
• to analyze separately mycorrhizal fungal and plant responses under elevated atmospheric CO2, and to test the hypothesis that mycocentrism makes sense, which implies that elevated CO2 (increased C availability to the fungus) will not automatically feed back to enhanced plant growth performance (Chapter 2);
• to investigate species-specific responses of Scots pine seedlings inoculated with 7
different ECM fungal species on growth and nutrient acquisition together with mycelial development under ambient and elevated CO2 at low N availability (Chapter 3);
• to investigate fungal species-specific responses of Scots pine seedlings inoculated with
3 different ECM fungal species that range from nitrophobic to nitrophilic or nitrotolerant on C and N gain together with mycelial development under ambient and elevated CO2 and at low and high mineral N availability (Chapter 4);
• to investigate the effects of different DSE on growth and nutrient acquisition by Scots
pine seedlings under conditions of N-limitation and at two levels of C availability (Chapter 5)
• to provide a conceptual framework (through path analysis) for a mycocentric analysis
of plant responses to elevated CO2.
For the first aim, I used an analytical tool called meta-analysis (Chapter 2, Appendix),
which provides a quantitative statistical means of integrating independent results and of identifying aspects of experimental design that might contribute to variation among studies (Gurevitch & Hedges, 1999; 2001). More specifically, in that chapter, I address the following
16
General Introduction
questions: (1) Does elevated CO2 differentially affect mycorrhizal fungal responses for ECM and arbuscular mycorrhizal (AM) systems? (2) Does elevated CO2 differentially affect mycorrhizal plant responses for ECM and AM systems? (3) Are there significant differences between fungal and plant responses in both ECM and AM systems? (4) Is the magnitude of the effect of elevated CO2 comparable between experiments with individual mycorrhizal fungal species and experiments with mixed fungal communities? (5) Is the magnitude of the effect of elevated CO2 comparable between short-term (< 1 yr) and long-term (> 1 yr) studies? (6) Is there a significant difference between laboratory and field experiments?
Continuing with experimental work in Chapter 3, I hypothesized that (1) elevated CO2 will increase C allocation to the fungus; (2) enhanced allocation will increase nutrient immobilization in fungal tissue; (3) larger nutrient immobilization in fungal tissue will show negative feedback to plant nutrient content and ultimately plant biomass due to PNL; (4) under such conditions mycorrhizal associations may constrain plant responses to elevated CO2; (5) these effects will be strongest in species that produce the largest amount of mycelium.
Chapter 4 expands on Chapter 3 by including, for three different species of ECM fungi that range from nitrophobic to nitrophilic or nitrotolerant, two levels of N supply. This study, which replicated the experiment of the previous study that was done under low N supply, tested the same hypotheses. By increasing N supply, additional hypotheses were tested that (1) the competition for N between plant and fungi is alleviated by increasing N availability and (2) this effect is stronger for species with a higher N-demand (hence the species that produce the larger mycelium).
In Chapter 5, I determined C gain and nutrient acquisition by different DSE in association with Scots pine seedlings under low N availability at ambient and elevated CO2. I compared the response of DSE with the 6 species of ECM fungi from Chapter 3 to understand similarities and dissimilarities between both groups of root-inhabiting fungi to contribute to the debate to what extent DSE are functionally equivalent to ECM fungi. I hypothesized that DSE-plant associations become more mutualistic at higher C supply (elevated CO2).
Finally, Chapter 6 provides a general discussion, in which I summarize findings of previous chapters. By utilizing path models, I address the question how important the mycocentric perspective is for an improved understanding of mycorrhizal plant responses to elevated CO2 and, to a lesser extent, to other factors of global change (N deposition). I end this thesis with several key findings on the field of mycorrhizal-plant association in relation to C and N availability.
17

Chapter 2
Taking mycocentrism seriously: Mycorrhizal fungal and plant responses to
elevated CO2
Based on: Odair Alberton, Thomas W. Kuyper and Antonie Gorissen. 2005. New Phytologist 167: 859-868.
Chapter 2
Abstract
The aim here was to separately assess mycorrhizal fungal and plant responses under elevated atmospheric CO2, and to test a mycocentric model that assumes that increased carbon availability to the fungus will not automatically feed back to enhanced plant growth performance. Meta-analyses were applied across independent studies. Responses were compared in ectomycorrhizal (ECM) and arbuscular mycorrhizal (AM) fungi, and ECM and AM plants. Responses of both mycorrhizal fungi and mycorrhizal plants to elevated CO2 were significantly positive. The response ratio for ECM fungi was 1.34 (an increase of 34%) and for AM fungi 1.21 (21%), indicating a significantly different response. The response ratio for ECM plants was 1.26, similar to that of AM plants (1.25). Fractional colonization turned out an unsuitable fungal parameter. Evidence was found for the mycocentric view in ECM, but not in AM systems. Fungal identity and plant identity were important parameters that affected response ratios. The need for better descriptors of fungal and plant responses is emphasized.
Key words: elevated CO2, meta-analysis, mycocentric, mycorrhizal fungi, phytocentric
20
Taking mycocentrism seriously
Introduction
The potential consequences of rising atmospheric carbon dioxide levels for plant growth, crop production, and ecosystem functioning have resulted in a large number of studies to assess plant performance under elevated CO2, both in the greenhouse and under field conditions. To better understand and predict responses, we need to study below-ground dynamics, including both roots and associated micro-organisms. One major association is the mycorrhizal symbiosis, a mutualistic symbiosis with certain soil-inhabiting fungi. It has been estimated that up to 30% of total photoassimilate products can be used in growth and maintenance of the fungus (Ek, 1997; Nehls & Hampp, 2000; Nehls et al., 2001). Bhupinderpal-Singh et al. (2003) reported that respiration by mycorrhizal roots and the mycelia of mycorrhizal fungi can account for more than 50% of total soil respiration.
Research on mycorrhizas has often been plant-centred (Fitter et al., 2000), and many phytocentric models treat mycorrhizal fungi primarily as extensions of the plant’s root system. A mycocentric view on C use by the fungus for its own growth and maintenance was proposed by Fitter et al. (1998). This mycocentric view assumes that carbon is allocated between intraradical and extraradical mycelia according to the fungal carbon demands, not to the demands of their autotrophic hosts (Robinson & Fitter, 1999).
From a mycocentric perspective it is essential to include measurement of the extraradical mycelium because this parameter is less dependent on root growth responses than the intraradical mycelium. It is known that elevated CO2 tends to increase mycorrhizal parameters, such as amount of extraradical hyphae (Tingey et al., 2000; Treseder & Allen, 2000). Ceulemans et al. (1999) suggested that this parameter is important for soil exploration and the potential for subsequent enhanced nutrient translocation to the host. However, Fransson et al. (2005) suggested that a possible increase in fungal biomass production may not necessarily result in increased transfer of N to the host plant, since the fungus can also become a larger sink for nutrients. Evidence for the importance of fungal nutrient immobilisation, leading to the lack of plant responses (or even a negative plant response) have been described by Colpaert et al. (1992), Colpaert & Verstuyft (1999), and Treseder & Allen (2002).
Since global perturbations of the environment are increasing, it is very important to improve the predictive power of models by taking into account the functioning of soil micro-organisms (Lindahl et al., 2002). Moreover, it is imperative to know how the rising atmospheric CO2 concentration influences the mycorrhizal symbiosis. An understanding of mycorrhizal fungal and plant controls over additional carbon may help to improve the predictive power of models of the effects of elevated CO2. As a first step in improving our knowledge of the effects of elevated CO2 on mycorrhizal fungal and plant responses, a meta-
21
Chapter 2
analysis may provide a quantitative statistical means of integrating independent results and of identifying aspects of experimental design that might contribute to variation among studies (Gurevitch & Hedges, 1999; 2001).
To date, meta-analyses of plant responses to elevated CO2 have been published by Curtis & Wang (1998), Poorter & Pérez-Soba (2001), and Jablonski et al. (2002). Treseder (2004) was the first to perform a meta-analysis of mycorrhizal responses to elevated CO2. She noted an increase in colonization by 36%. However, Treseder’s meta-analysis was performed with few data points (14), as she only included field studies. Her work did also not allow to test for differences in measurement types (fungal responses assessed by mycelial measurements compared to changes in colonization). When more than one index of mycorrhizal performance was available, fractional colonization was used in order to facilitate comparisons between studies. In the paper she also did not compare the response of mycorrhizal fungus and mycorrhizal plant over the same range of studies.
This meta-analysis aims to integrate research results from all published studies on effects of elevated CO2, focusing on the contrast of mycocentric and phytocentric views. It contrasts mycorrhizal fungal and plant responses for both ECM and AM systems. It compares differences between ECM and AM systems, both for fungal and plant responses. More specifically we attempted to answer the following questions: (1) Does elevated CO2 differentially affect mycorrhizal fungal responses for ECM and AM systems? (2) Does elevated CO2 differentially affect mycorrhizal plant responses for ECM and AM systems? (3) Are there significant differences between fungal and plant responses in both ECM and AM systems? (4) Is the magnitude of the effect of elevated CO2 comparable between experiments with individual mycorrhizal fungal species and experiments with mixed fungal communities? (5) Is the magnitude of the effect of elevated CO2 comparable between short-term (< 1 year) and long-term (> 1 year) studies? (6) Is there a significant difference between laboratory and field experiments?
Materials and Methods Data Collection One major assumption of meta-analysis is that studies and data points are independent from one another (Gurevitch & Hedges, 1999; 2001). If particular publications reported data from more than one study system (different mycorrhizal fungal species, plant species, nitrogen and phosphorus levels, temperature, soil moisture, light availability and / or ozone), those systems were considered independent data points. Our choice to consider these different data points as providing independent data points is based on the conditionality or context-dependency of
22
Taking mycocentrism seriously
mycorrhizal functioning (Van der Heijden & Kuyper, 2001). Levels of ambient CO2 ranged from 340 to 380 ppm (one study 400 ppm), those of elevated CO2 from 540 to 750 ppm (in one study, 10000 ppm; note that this study did not yield an outlier). In most cases the ratio between elevated and ambient CO2 was close to 2. Four studies contained 3 CO2 levels, (350, 525, and 700 ppm); in those cases we selected the higher and lower level only. Papers that only reported mycorrhizal fungal or mycorrhizal plant responses were not considered. If parameters had been measured several times in the same study, only the last sampling date was used for meta-analysis. Only one parameter for fungal and plant performance was used for every data point. When different measurements were taken, we determined an order of priority (see later).
The data collection consisted of obtaining the means of the two groups: experimental, (elevated CO2) and control (ambient CO2), with standard deviation (SD) and replicate number (n). Papers where SDs or replicate numbers were missing were excluded. If data were presented graphically, values were estimated from figures manually digitized. The units with which measurements were reported were not considered since the calculated response ratio is dimensionless. In case only standard errors (SEs) were given, these were transformed to SD according to the equation: SD = SE x √n. Unidentified error bars were assumed to represent SE. If several values of n were given, the lowest value was taken.
Literature search was performed through ‘Web of Science’ with keywords mycorrhiza(l) and carbon dioxide. In total, 28 papers on ECM systems and 24 papers on AM systems were analyzed. As several papers included either more fungal or plant species, or different experimental conditions, we analyzed 65 data points for ECM systems and 77 data points for AM systems in the end. We further subdivided the data in various subgroups: (1) data on individual fungal species and on mixed communities; (2) data obtained from conifer and broad-leaved ECM systems; (3) data from woody and herbaceous AM systems; (4) data on short-term (< 1 yr) and long-term (> 1 yr) experiments; (5) data on laboratory and on field experiments. Literature search was ended on March 13, 2005. Order of importance for parameter choice Data from the literature contained in most cases more than one measured parameter in each study. However, meta-analysis requires that only one parameter be used, as the use of multiple parameters violates the assumption of independence of the data. It was therefore essential to a priori rank the parameters used to assess plant and fungal responses to arrive at a less biased estimate. Parameter choice was based on the following rationale. Measurements that included the symbiotic interface (root biomass, fractional colonization) were considered to provide a less accurate picture of separate fungal and plant responses than measurements that pertain more or less exclusively to fungus or plant only. Above-ground plant measurements (shoots) were preferred over root measurements, and measurements of the
23
Chapter 2
extraradical mycelium were preferred over measurements of colonization. This choice should allow a maximum separation between phytocentric and mycocentric perspectives. As meta-analysis allows testing of the extent to which the final outcome depends on parameter choice, we also executed separate meta-analyses for every parameter.
After having defined the rank order of parameters, the parameter with the lowest rank was chosen first. If parameter 1 was absent in the study considered, parameter number 2 was used; if parameter 2 was also absent, the next parameter number 3 was used; and so on. In all cases only one parameter was used to assess the response of the mycorrhizal fungus, and one parameter to assess the response of the mycorrhizal plant.
The following rank order for mycorrhizal fungal responses was determined. 1. Dry weight of extraradical mycelium 2. Area or development of extraradical mycelium 3. Hyphal length in root-free compartment 4. Hyphal length in root compartment 5. Specific phospholipid fatty acid (PLFA) content 6. Ergosterol content 7. Glycogen content of hyphae 8. 14C in substrate 9. Below-ground carbon use efficiency 10. 14C respired from the soil 11. 14C distributed in ECM tips 12. ECM biomass 13. Fractional colonization (%) 14. Total number of root tips 15. Nitrogen (N) and phosphorus (P) concentration in ectomycorrhizas. Note that parameters 11-15 could provide a more biased assessment of the
mycocentric view. The following rank order for mycorrhizal plant responses was determined. 1. Leaf or needle biomass or area 2. Stem or stump biomass 3. Shoot biomass 4. 14C in shoots 5. Total plant biomass 6. Total root length 7. Total root biomass 8. 14C in roots 9. Root density 10. Woody or coarse root biomass 11. Fine root biomass
24
Taking mycocentrism seriously
12. Fine root production 13. Carbon transferred to fine roots 14. Root: shoot ratio 15. Standing root biomass 16. Net assimilation rate 17. Measurements of individual sugars 18. Measurements of individual enzymes 19. Nitrogen and P concentration or content in the plant. Note that parameters 5-15 could provide a more biased estimate of the phytocentric
view. Statistics The meta-analysis was performed separately for mycocentric and phytocentric views. A random effect model was used if the value of pooled within-class variance (σ2 pooled) was higher than zero, and a fixed effect model was used if that quantity was equal to or lower than zero (Hedges et al., 1999; Rosenberg et al., 2000). A quantitative index of the effect size in each experiment was calculated by the natural log of the response ratio. The response ratio was calculated by the mean of the experimental group (elevated CO2) divided by the mean of the control group (ambient CO2) (Hedges et al., 1999; Rosenberg et al., 2000; Gurevitch & Hedges, 2001). In our Results section we report the weighted mean response ratio (R), the 95% confidence interval (CI) for R and the number of observations (n). The mean of a response variable was considered significantly positive if the lower limit of the 95% CI was larger than one. The means of two different response variables were tested for significant differences based on the model heterogeneity test (Q-test), which is tested against a χ2 distribution with 1 degree of freedom as implemented in MetaWin (P = 0.05) (Rosenberg et al., 2000).
Calculations were performed using MetaWin 2.0 and in Microsoft Excel worksheets.
Results Data on the responses by fungi and plants in both mycorrhizal symbioses are given in Table 1. Responses of both mycorrhizal fungi and mycorrhizal plants were significantly positive under elevated CO2. The mean response ratio was 1.34 (CI = 1.25─1.43) for ECM fungi, an increase of 34%, and 1.21 (CI = 1.12─1.32) for AM fungi, an increase of 21%. The Q-test indicated a
25
Chapter 2
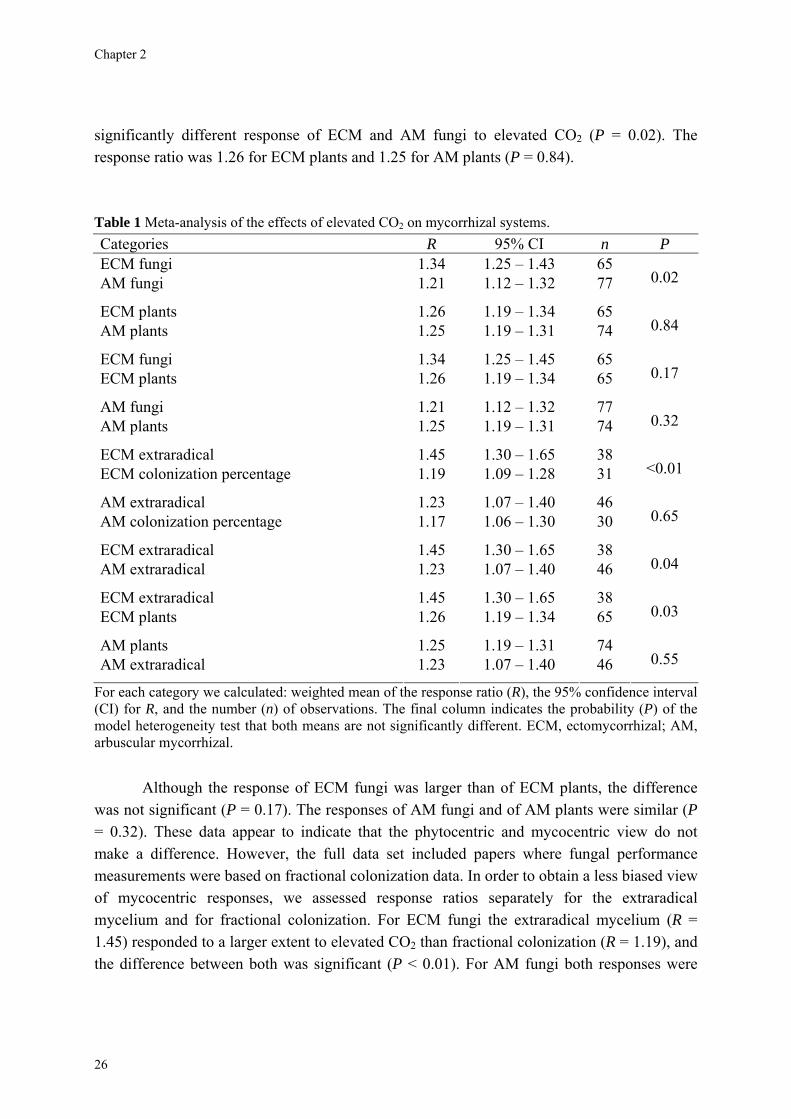
significantly different response of ECM and AM fungi to elevated CO2 (P = 0.02). The response ratio was 1.26 for ECM plants and 1.25 for AM plants (P = 0.84). Table 1 Meta-analysis of the effects of elevated CO2 on mycorrhizal systems. Categories R 95% CI n P
ECM fungi 1.34 1.25 – 1.43 65 AM fungi 1.21 1.12 – 1.32 77 0.02
ECM plants 1.26 1.19 – 1.34 65 AM plants 1.25 1.19 – 1.31 74 0.84
ECM fungi 1.34 1.25 – 1.45 65 ECM plants 1.26 1.19 – 1.34 65 0.17
AM fungi 1.21 1.12 – 1.32 77 AM plants 1.25 1.19 – 1.31 74 0.32
ECM extraradical 1.45 1.30 – 1.65 38 ECM colonization percentage 1.19 1.09 – 1.28 31 <0.01
AM extraradical 1.23 1.07 – 1.40 46 AM colonization percentage 1.17 1.06 – 1.30 30 0.65
ECM extraradical 1.45 1.30 – 1.65 38 AM extraradical 1.23 1.07 – 1.40 46 0.04
ECM extraradical 1.45 1.30 – 1.65 38 ECM plants 1.26 1.19 – 1.34 65 0.03
AM plants 1.25 1.19 – 1.31 74 AM extraradical 1.23 1.07 – 1.40 46 0.55
For each category we calculated: weighted mean of the response ratio (R), the 95% confidence interval (CI) for R, and the number (n) of observations. The final column indicates the probability (P) of the model heterogeneity test that both means are not significantly different. ECM, ectomycorrhizal; AM, arbuscular mycorrhizal.
Although the response of ECM fungi was larger than of ECM plants, the difference was not significant (P = 0.17). The responses of AM fungi and of AM plants were similar (P = 0.32). These data appear to indicate that the phytocentric and mycocentric view do not make a difference. However, the full data set included papers where fungal performance measurements were based on fractional colonization data. In order to obtain a less biased view of mycocentric responses, we assessed response ratios separately for the extraradical mycelium and for fractional colonization. For ECM fungi the extraradical mycelium (R = 1.45) responded to a larger extent to elevated CO2 than fractional colonization (R = 1.19), and the difference between both was significant (P < 0.01). For AM fungi both responses were
26
Taking mycocentrism seriously
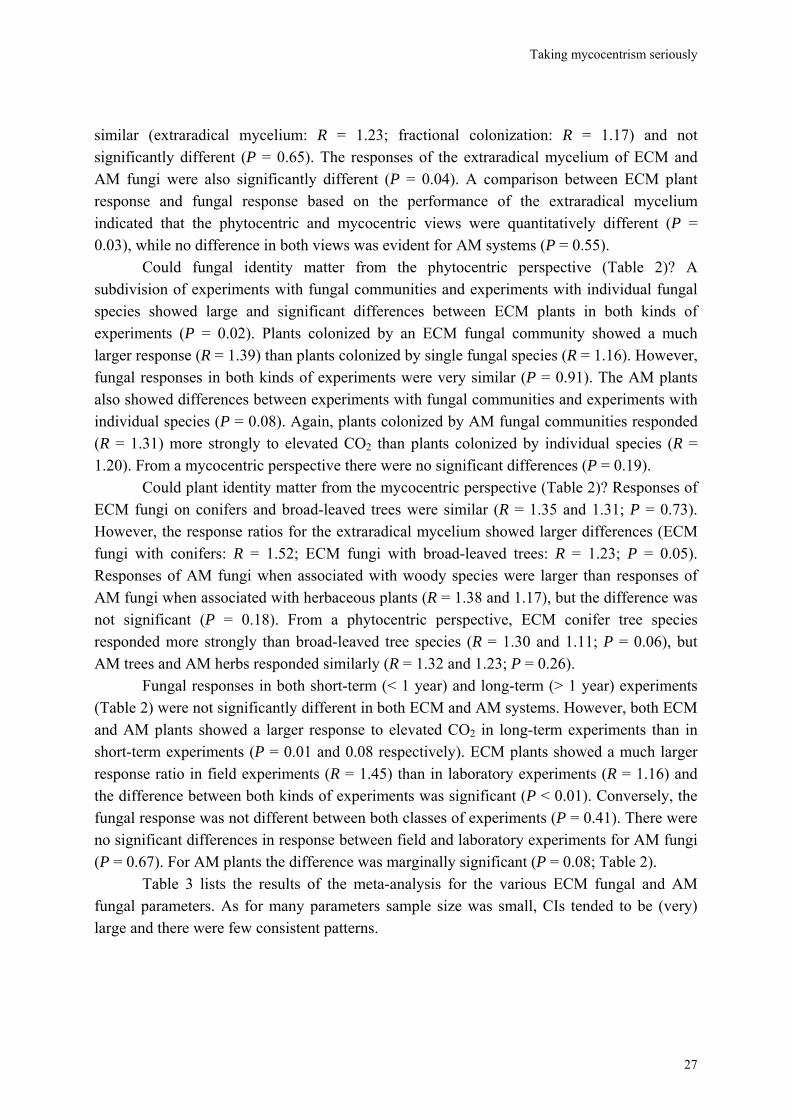
similar (extraradical mycelium: R = 1.23; fractional colonization: R = 1.17) and not significantly different (P = 0.65). The responses of the extraradical mycelium of ECM and AM fungi were also significantly different (P = 0.04). A comparison between ECM plant response and fungal response based on the performance of the extraradical mycelium indicated that the phytocentric and mycocentric views were quantitatively different (P = 0.03), while no difference in both views was evident for AM systems (P = 0.55).
Could fungal identity matter from the phytocentric perspective (Table 2)? A subdivision of experiments with fungal communities and experiments with individual fungal species showed large and significant differences between ECM plants in both kinds of experiments (P = 0.02). Plants colonized by an ECM fungal community showed a much larger response (R = 1.39) than plants colonized by single fungal species (R = 1.16). However, fungal responses in both kinds of experiments were very similar (P = 0.91). The AM plants also showed differences between experiments with fungal communities and experiments with individual species (P = 0.08). Again, plants colonized by AM fungal communities responded (R = 1.31) more strongly to elevated CO2 than plants colonized by individual species (R = 1.20). From a mycocentric perspective there were no significant differences (P = 0.19).
Could plant identity matter from the mycocentric perspective (Table 2)? Responses of ECM fungi on conifers and broad-leaved trees were similar (R = 1.35 and 1.31; P = 0.73). However, the response ratios for the extraradical mycelium showed larger differences (ECM fungi with conifers: R = 1.52; ECM fungi with broad-leaved trees: R = 1.23; P = 0.05). Responses of AM fungi when associated with woody species were larger than responses of AM fungi when associated with herbaceous plants (R = 1.38 and 1.17), but the difference was not significant (P = 0.18). From a phytocentric perspective, ECM conifer tree species responded more strongly than broad-leaved tree species (R = 1.30 and 1.11; P = 0.06), but AM trees and AM herbs responded similarly (R = 1.32 and 1.23; P = 0.26).
Fungal responses in both short-term (< 1 year) and long-term (> 1 year) experiments (Table 2) were not significantly different in both ECM and AM systems. However, both ECM and AM plants showed a larger response to elevated CO2 in long-term experiments than in short-term experiments (P = 0.01 and 0.08 respectively). ECM plants showed a much larger response ratio in field experiments (R = 1.45) than in laboratory experiments (R = 1.16) and the difference between both kinds of experiments was significant (P < 0.01). Conversely, the fungal response was not different between both classes of experiments (P = 0.41). There were no significant differences in response between field and laboratory experiments for AM fungi (P = 0.67). For AM plants the difference was marginally significant (P = 0.08; Table 2).
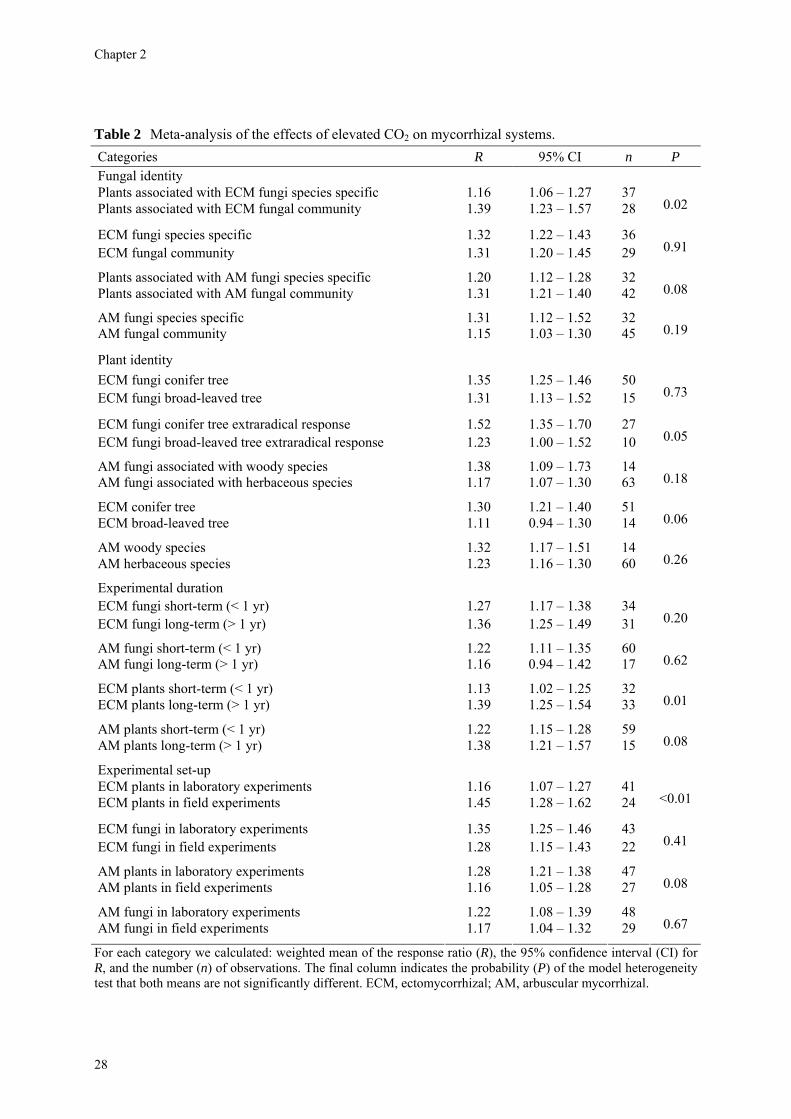
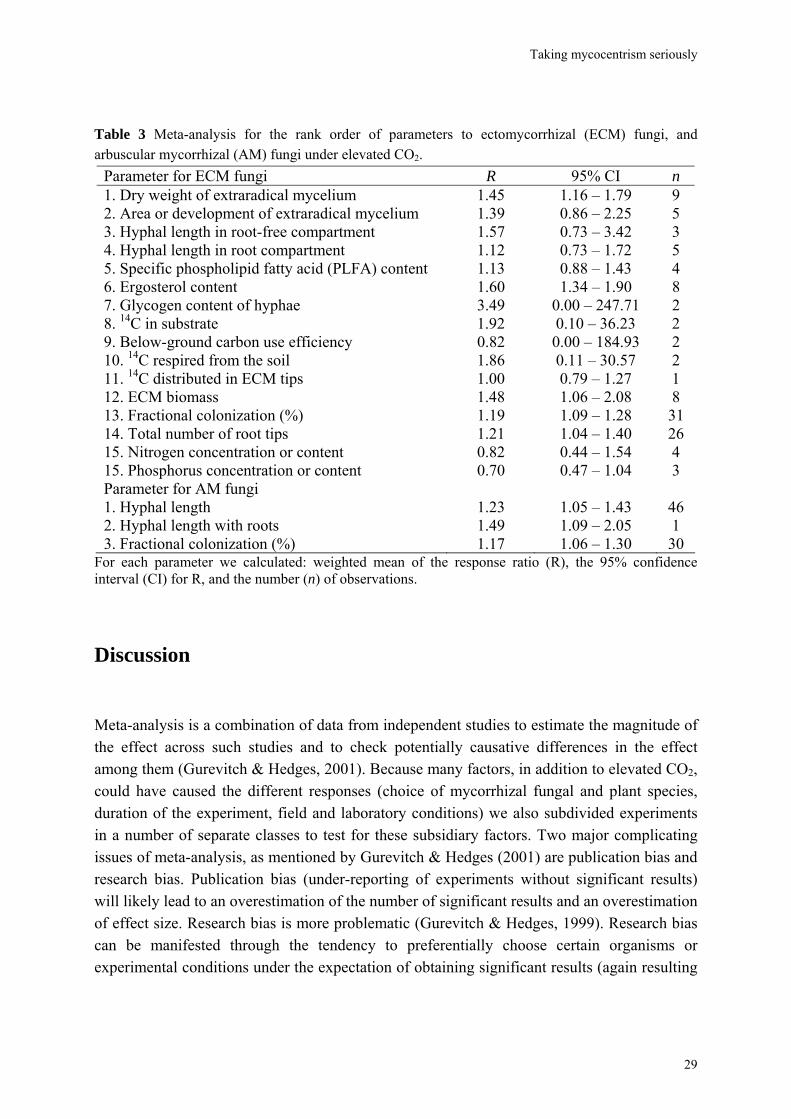
Table 3 lists the results of the meta-analysis for the various ECM fungal and AM fungal parameters. As for many parameters sample size was small, CIs tended to be (very) large and there were few consistent patterns.
27
Chapter 2
Table 2 Meta-analysis of the effects of elevated CO2 on mycorrhizal systems. Categories R 95% CI n P Fungal identity Plants associated with ECM fungi species specific 1.16 1.06 – 1.27 37 Plants associated with ECM fungal community 1.39 1.23 – 1.57 28 0.02
ECM fungi species specific 1.32 1.22 – 1.43 36 ECM fungal community 1.31 1.20 – 1.45 29 0.91
Plants associated with AM fungi species specific 1.20 1.12 – 1.28 32 Plants associated with AM fungal community 1.31 1.21 – 1.40 42 0.08
AM fungi species specific 1.31 1.12 – 1.52 32 AM fungal community 1.15 1.03 – 1.30 45 0.19
Plant identity
ECM fungi conifer tree 1.35 1.25 – 1.46 50 ECM fungi broad-leaved tree 1.31 1.13 – 1.52 15 0.73
ECM fungi conifer tree extraradical response 1.52 1.35 – 1.70 27 ECM fungi broad-leaved tree extraradical response 1.23 1.00 – 1.52 10 0.05
AM fungi associated with woody species 1.38 1.09 – 1.73 14 AM fungi associated with herbaceous species 1.17 1.07 – 1.30 63 0.18
ECM conifer tree 1.30 1.21 – 1.40 51 ECM broad-leaved tree 1.11 0.94 – 1.30 14 0.06
AM woody species 1.32 1.17 – 1.51 14 AM herbaceous species 1.23 1.16 – 1.30 60 0.26
Experimental duration
ECM fungi short-term (< 1 yr) 1.27 1.17 – 1.38 34 ECM fungi long-term (> 1 yr) 1.36 1.25 – 1.49 31 0.20
AM fungi short-term (< 1 yr) 1.22 1.11 – 1.35 60 AM fungi long-term (> 1 yr) 1.16 0.94 – 1.42 17 0.62
ECM plants short-term (< 1 yr) 1.13 1.02 – 1.25 32 ECM plants long-term (> 1 yr) 1.39 1.25 – 1.54 33 0.01
AM plants short-term (< 1 yr) 1.22 1.15 – 1.28 59 AM plants long-term (> 1 yr) 1.38 1.21 – 1.57 15 0.08
Experimental set-up ECM plants in laboratory experiments 1.16 1.07 – 1.27 41 ECM plants in field experiments 1.45 1.28 – 1.62 24 <0.01
ECM fungi in laboratory experiments 1.35 1.25 – 1.46 43 ECM fungi in field experiments 1.28 1.15 – 1.43 22 0.41
AM plants in laboratory experiments 1.28 1.21 – 1.38 47 AM plants in field experiments 1.16 1.05 – 1.28 27 0.08
AM fungi in laboratory experiments 1.22 1.08 – 1.39 48 AM fungi in field experiments 1.17 1.04 – 1.32 29 0.67
For each category we calculated: weighted mean of the response ratio (R), the 95% confidence interval (CI) for R, and the number (n) of observations. The final column indicates the probability (P) of the model heterogeneity test that both means are not significantly different. ECM, ectomycorrhizal; AM, arbuscular mycorrhizal.
28
Taking mycocentrism seriously
Table 3 Meta-analysis for the rank order of parameters to ectomycorrhizal (ECM) fungi, and arbuscular mycorrhizal (AM) fungi under elevated CO2.
Parameter for ECM fungi R 95% CI n 1. Dry weight of extraradical mycelium 1.45 1.16 – 1.79 9 2. Area or development of extraradical mycelium 1.39 0.86 – 2.25 5 3. Hyphal length in root-free compartment 1.57 0.73 – 3.42 3 4. Hyphal length in root compartment 1.12 0.73 – 1.72 5 5. Specific phospholipid fatty acid (PLFA) content 1.13 0.88 – 1.43 4 6. Ergosterol content 1.60 1.34 – 1.90 8 7. Glycogen content of hyphae 3.49 0.00 – 247.71 2 8. 14C in substrate 1.92 0.10 – 36.23 2 9. Below-ground carbon use efficiency 0.82 0.00 – 184.93 2 10. 14C respired from the soil 1.86 0.11 – 30.57 2 11. 14C distributed in ECM tips 1.00 0.79 – 1.27 1 12. ECM biomass 1.48 1.06 – 2.08 8 13. Fractional colonization (%) 1.19 1.09 – 1.28 31 14. Total number of root tips 1.21 1.04 – 1.40 26 15. Nitrogen concentration or content 0.82 0.44 – 1.54 4 15. Phosphorus concentration or content 0.70 0.47 – 1.04 3 Parameter for AM fungi 1. Hyphal length 1.23 1.05 – 1.43 46 2. Hyphal length with roots 1.49 1.09 – 2.05 1 3. Fractional colonization (%) 1.17 1.06 – 1.30 30
For each parameter we calculated: weighted mean of the response ratio (R), the 95% confidence interval (CI) for R, and the number (n) of observations.
Discussion Meta-analysis is a combination of data from independent studies to estimate the magnitude of the effect across such studies and to check potentially causative differences in the effect among them (Gurevitch & Hedges, 2001). Because many factors, in addition to elevated CO2, could have caused the different responses (choice of mycorrhizal fungal and plant species, duration of the experiment, field and laboratory conditions) we also subdivided experiments in a number of separate classes to test for these subsidiary factors. Two major complicating issues of meta-analysis, as mentioned by Gurevitch & Hedges (2001) are publication bias and research bias. Publication bias (under-reporting of experiments without significant results) will likely lead to an overestimation of the number of significant results and an overestimation of effect size. Research bias is more problematic (Gurevitch & Hedges, 1999). Research bias can be manifested through the tendency to preferentially choose certain organisms or experimental conditions under the expectation of obtaining significant results (again resulting
29
Chapter 2
in overestimation of effect size) or through the choice of model species and experimental conditions that are easy to handle. This may result in choosing fast-growing mycorrhizal species with a higher nutrient demand or experimental conditions that are too nutrient-rich from the point of view of mycorrhizal functioning (Read, 2002). Nutrient-rich conditions may explain experimental results where ECM trees performed less than the nonmycorrhizal controls (Gebauer et al., 1996; Rouhier & Read, 1998). Research bias may also result in investigating parameters that are easier to assess (fractional colonization), even if these are not the most suitable parameters. Finally, Klironomos et al. (2005) showed that pulse experiments with instantaneous doubling of CO2 levels, while more easy and rapid to execute, are likely to overestimate effects compared with conditions were CO2 levels are increased gradually.
Our meta-analysis showed that both mycorrhizal fungi and mycorrhizal plants respond positively to elevated CO2. The magnitude of the plant effect (25% for AM plants, 26% for ECM plants) is similar to the effects reported by Curtis & Wang (1998), who noted an overall response of 29% and Jablonski et al. (2002) who noted an overall effect of 31%. Our effect size is smaller than that reported by Poorter & Pérez-Soba (2001) who observed an effect of 47% under optimal conditions, but noted that under nutrient-poor conditions, where mycorrhizal symbioses are likely of largest benefit, effects can be much smaller. The average effect sizes of 21% for AM fungi and 34% for ECM fungi are lower than the results of the analysis by Treseder (2004) who noted an average enhanced effect of 47%. She noted that measurements of fractional colonization (36%) gave a lower response. While she deliberately selected fractional colonization in order to facilitate comparisons between studies, we tried to make a clear separation between the mycocentric and phytocentric view.
There are limits to this conceptual separation of mycocentric and phytocentric perspectives. Under conditions of normal soil fertility almost all mycorrhizal fungi and mycorrhizal plants can only complete their life cycle in the symbiotic condition. Responses to elevated CO2 must therefore be coordinated to some extent, and in a strict sense there may be no exclusive fungal and plant performance parameters. However, coordinated responses have often been assumed rather than demonstrated. Therefore, testing whether the magnitude of effects of elevated CO2 on fungus and plant are significantly different remains important. For proper testing the issue of parameter choice is relevant. For our analysis we selected parameters that appear indicative of a fungal or plant response over parameters that are more directly affected by the coordinated response of the symbiotic interface (the mycorrhizal root: measurements of root biomass and fractional colonization).
Our results provide evidence for problems associated with the use of fractional colonization for assessing mycorrhizal responses to elevated CO2. Extraradical mycelial performance parameters showed a significantly higher response ratio than fractional fungal colonization in ECM fungi. In AM fungi the effect was not significant. While interpretation of these results is inevitably constrained by the fact that there are very few studies where fungal
30
Taking mycocentrism seriously
growth in or around roots and in the soil have been measured in directly comparable units, we would argue that measurement of fractional colonization is an unsuitable index to determine fungal responses to elevated CO2. Fractional colonization is the result of plant root growth and fungal growth on or around roots. A differential effect of elevated CO2 on both parameters can be positive or negative (Sanders et al., 1998; Rillig & Allen, 1999; Allen, 2001; Rillig et al., 2002a). Furthermore, levels of mycorrhizal colonization change over time and depend on the root : shoot ratio. Changes in plant allometry as a result of responses to elevated CO2 could therefore result in changes in fractional colonization (Staddon, 1998; Staddon & Fitter, 1998).
Differences in response ratio between the extraradical mycelium and fractional colonization, and differences in response ratio between ECM fungi and plants support the need for conceptually separating mycocentric and phytocentric views as advocated by Fitter (2001). Such a separation also contributes to understanding changes in carbon partition under elevated CO2, which can be due both to downregulation of plant C-transporters and to upregulation of fungal C-transporters (Nehls & Hampp, 2000; Nehls et al., 2001). Old models of mycorrhizal feedbacks to elevated CO2 have not made this conceptual separation and have treated the fungi primarily as an extension of the root system. Under such a model elevated CO2 will increase C availability to the fungus, resulting in increased uptake of limiting nutrients such as N and P, finally resulting in enhanced plant performance as a result of this positive feedback. However, under a mycocentric view elevated CO2 will increase C availability for the fungus, by which the fungus increases its own biomass and fitness, irrespective whether this increased fungal fitness will feed back into enhanced nutrient uptake and increased plant performance.
Increased fungal biomass could increase competition for nutrients. Several parameters in the data set of Table 3, while still based on a very low number of observations and hence with large confidence intervals, are consistent with this suggestion. Larger mycelial dry weight (R = 1.45), mycelial area (R = 1.39), hyphal length in root free compartment (R = 1.57), and 14C incorporation in biomass (R = 1.92) can be juxtaposed next to decreased N and P concentrations of the ectomycorrhizas (R = 0.82 and 0.70, respectively). As a consequence of increased nutrient competition the efficiency with which fungi use the additional C can decrease resulting in a larger C respiration by the fungus. This pattern of decreased C-use efficiency was observed by Gorissen & Kuyper (2000) for the nitrotolerant Laccaria bicolor but not for the nitrophobic Suillus bovinus, suggesting that species-specific differences in fungal nutrient demand are a major factor in determining the potential of feedbacks. While there is large interest in ECM fungal behavior to elevated N availability, another major driver of global change (Lilleskov et al., 2002; Rillig et al., 2002a; Taylor et al., 2003; Treseder, 2004), the way fungal N use feed backs to plant performance requires more attention.
While for ECM symbioses the need to separate mycocentric and phytocentric perspectives is evident, the pattern for AM symbioses is less clear. Neither differences in
31
Chapter 2
response ratios between AM fungi and AM plants nor differences between the extraradical fungal response parameters and AM fractional colonization were significant. It may be possible that this difference between ECM and AM symbioses reflects a genuine difference in mycorrhizal functioning. The amount of extraradical mycelium of ECM fungi is an order of magnitude larger than that of AM fungi. This could result in a larger potential for nutrient immobilization even if the fungi respond similarly to additional C. Considering these differences in the amount of extraradical mycelium an increase in mycelial size has a lower chance in increasing nutrient uptake for ECM fungi than for AM fungi, even in the case of uptake of the same immobile elements. This possibility had also been raised by O’Neill (1994), who in her review suggested that undisturbed ecosystems may be ‘saturated’ with regard to mycorrhizas. This issue of mycelial abundance being larger than optimal from the plant’s perspective for uptake rates should be further explored in models of nutrient uptake by mycorrhizal fungal mycelia (Yanai et al., 1995).
O’Neill (1994) also mentioned the possibility that increasing CO2 levels could result in differences in ECM fungal species composition rather than changes in mycorrhizal performance. A change towards ECM fungi that produce a larger amount of extraradical mycelium under elevated CO2 was reported by Godbold & Berntson (1997), although Fransson et al. (2001) found no evidence for such a change. The interesting question then is whether such changes in the mycorrhizal fungal community structure may decrease or enhance plant responses compared to situations where just one fungal species is present. Such knowledge is highly pertinent for upscaling mycorrhizal plant responses to elevated CO2 (Staddon et al., 2002). A comparison of experiments with single mycorrhizal species and fungal communities did not show significant differences from a mycocentric perspective, but interestingly a large effect from a phytocentric perspective. In both ECM and AM plants, community-wide responses were much larger than responses in experiments with single fungal species. This result contradicts the insurance hypothesis of theories on species diversity which predicts an evening out of species effects in multi-species communities (Loreau, 2000). We offer two suggestions to explain this discrepancy. It could be the case that elevated CO2 results in fungal community shifts towards species that are apparently less nutrient-limited (i.e. that make more fungal biomass at the same levels of C and nutrient availability). Such species shifts then increase the potential for positive feedback. The results by Klironomos et al. (2005), where a pulse of CO2 led to a loss of the most C-demanding AM fungi (Gigaspora, Scutellospora), and hence release from a C-drain, are consistent with this hypothesis. An alternative possibility is research bias: selection of species that grow well under experimental conditions but that are not fully representative for field conditions. Such research bias may result in over-representation of r-selected, nitrotolerant species, resulting in an underestimation of effects in the real world. Further experiments are needed to test both hypotheses.
32
Taking mycocentrism seriously
Ectomycorrhizal fungi responded more strongly than AM fungi under elevated CO2. O’Neill (1994) had previously suggested that ECM fungi may respond more strongly than AM fungi. However, this outcome contrasts with the results of Treseder (2004). She noted, based on data of fractional colonization, a much larger response for AM fungi (R = 1.84) than for ECM fungi (R = 1.19), even though the difference was not significant (P = 0.11). Her data set contained only one data point for extraradical hyphal responses of both ECM and AM fungi, and a direct comparison between her and our results is therefore impossible.
The ECM fungal responses to short-term and long-term experiments did not differ significantly. Ectomycorrhizal plants showed a larger response to elevated CO2 in long-term experiments than in short-term experiments. The same pattern was noted for AM fungal and plant responses. These observations contradict the generally held view of downregulation of photosynthesis under elevated CO2, if enhanced photosynthesis does not lead to a similarly enhanced nutrient uptake. We cannot offer an explanation for this difference, but note that it may well be artefactual (research bias) as most short-term experiments were done in pots with single species, and most long-term experiments in the field with fungal communities.
In conclusion, while both mycorrhizal fungi and mycorrhizal plants are stimulated under elevated CO2, the magnitude of response of both organisms in the symbiosis may differ to some extent, both for ECM and AM symbioses. A conceptual separation of mycocentric and phytocentric views is therefore necessary to understand such differential responses and the consequences of these differences for feedbacks. Ectomycorrhizal systems respond more strongly than AM systems to elevated CO2, although it is not clear whether this difference results from research bias or reflects some underlying fundamental differences in either the biology of the fungi or the plants. Because elevated CO2 may affect species composition of mycorrhizal fungi, and species identity is a large determinant of outcome in individual studies, our analysis suggests the importance of studies of species interactions and of argued choices of species selection in experiments.
Acknowledgements This study derives an important inspiration from work by Alastair H. Fitter, who has emphasized in various publications the need to conceptually separate mycocentric and phytocentric views. We thank Jessica Gurevitch, Glaciela Kaschuk, Lijbert Brussaard and three anonymous referees for useful comments on the manuscript and all authors whose studies were included in the analyses. This study was funded by the C.T. de Wit Graduate School for Production Ecology and Resource Conservation (PE&RC) of Wageningen University and Research Centre, the Netherlands.
33

Chapter 2 Chapter 2
34
34
Competition for nitrogen between plant and mycorrhizal fungi
Chapter 3
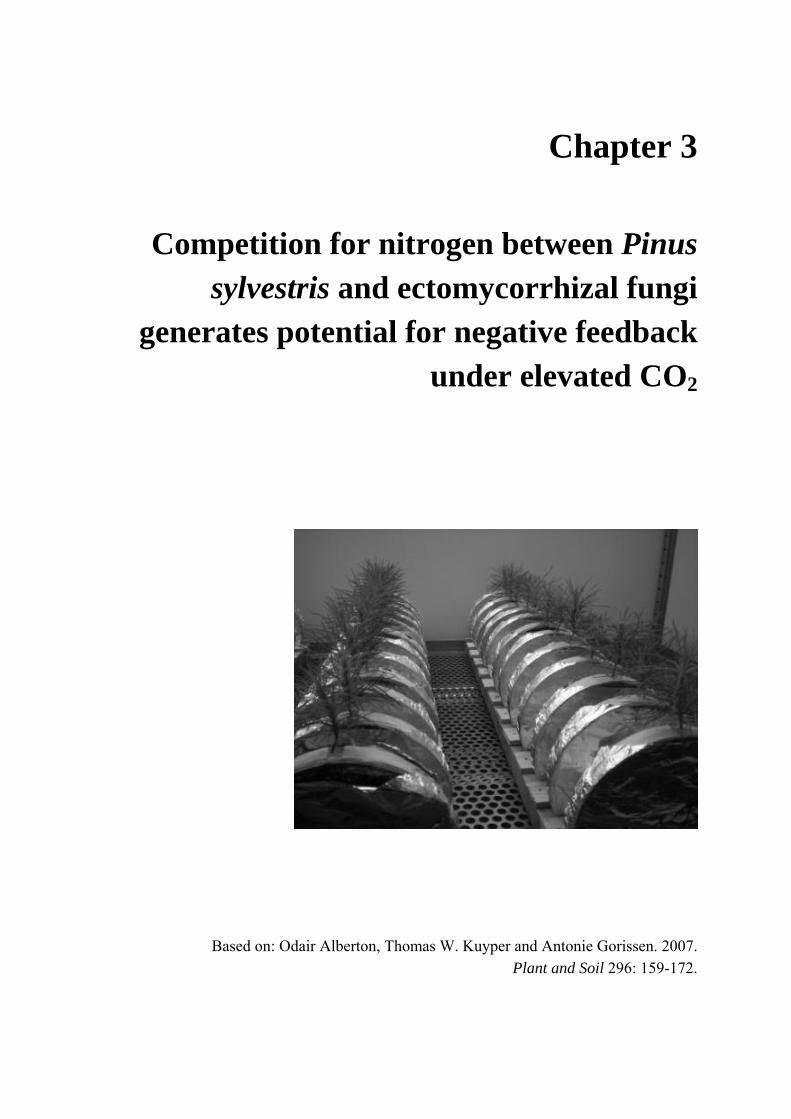
Competition for nitrogen between Pinus sylvestris and ectomycorrhizal fungi
generates potential for negative feedback under elevated CO2
Based on: Odair Alberton, Thomas W. Kuyper and Antonie Gorissen. 2007.
Plant and Soil 296: 159-172.
45
Chapter 3
Abstract We investigated fungal species-specific responses of ectomycorrhizal (ECM) Scots pine (Pinus sylvestris) seedlings on growth and nutrient acquisition together with mycelial development under ambient and elevated CO2. Each seedling was associated with one of the following ECM species: Hebeloma cylindrosporum, Laccaria bicolor, Suillus bovinus, S. luteus, Piloderma croceum, Paxillus involutus, Boletus badius, or non-mycorrhizal, under ambient and elevated CO2 (350 or 700 µl l−1 CO2); each treatment contained 6 replicates. The trial lasted 156 d. During the final 28 days, the seedlings were labeled with 14CO2. We measured hyphal length, plant biomass, 14C allocation, and plant nitrogen and phosphorus concentration. Almost all parameters were significantly affected by fungal species and/or CO2. There were very few significant interactions. Elevated CO2 decreased shoot-to-root ratio, most strongly so in species with the largest extraradical mycelium. Under elevated CO2, ECM root growth increased significantly more than hyphal growth. Extraradical hyphal length was significantly negatively correlated with shoot biomass, shoot N content and total plant N uptake. Root dry weight was significantly negatively correlated with root N and P concentration. Fungal sink strength for N strongly affected plant growth through N immobilization. Mycorrhizal fungal-induced progressive nitrogen limitation (PNL) has the potential to generate negative feedback with plant growth under elevated CO2. Key words: carbon and nitrogen allocation; ectomycorrhizal fungi; elevated CO2; extraradical hyphae; mycocentric; N immobilization; progressive nitrogen limitation; Pinus sylvestris
36
Competition for nitrogen between plant and mycorrhizal fungi
Introduction Responses to elevated CO2 have often been studied from the plant’s perspective (phytocentric approach) and less often from the fungal perspective (mycocentric approach) in which carbon (C) and nutrient sink strength of the fungus plays an important role (Fitter et al., 2000; Staddon, 2005). It has often been assumed that plant and fungal responses are coordinated and of the same magnitude, implying that elevated CO2 provides roughly similar benefits for both symbiotic partners (Alberton et al., 2005; Reich et al., 2006) Under such conditions positive feedbacks between increased C availability and increased nutrient availability are likely to occur, leading to sustained increased productivity of the plant. However, Diaz et al. (1993) hypothesized that an enhanced C flow to the soil increases nutrient immobilization by (saprotrophic) microbiota and hence decreases plant nutrient availability, which provides a negative feedback and limits plant response to elevated CO2. Such microbially induced progressive nitrogen limitation (PNL) potentially decreases plant response to rising atmospheric CO2 (Luo et al., 2004; Hu et al., 2006). Furthermore, a recent meta-analysis of mycorrhizal plant and fungal responses to elevated CO2 suggested that in ectomycorrhizal (ECM) symbioses, fungal responses are larger than plant responses (Alberton et al., 2005). On average, doubling atmospheric CO2 concentration led to an increase of 45% of the ECM mycelium and 26% of the plant. As a consequence of this differential response, competition between mycorrhizal plant and fungus for nutrients could increase.
The meta-analysis also indicated that different fungal species derive similar benefits from elevated CO2, but that fungal species identity matters very much from the plant’s perspective. Plants associated with individual fungal species also showed a significantly lower response to elevated CO2 than plants that were colonized by a fungal assemblage. Alberton et al. (2005) proposed two hypotheses to explain this observation. Elevated CO2 could result in a shift in the fungal assemblage towards species that have lower nutrient-to-C demands (Fransson et al., 2001; Parrent et al., 2006). The alternative hypothesis is that research results are biased by selection of species that perform well under the conditions normally encountered in experiments, but that are not sufficiently representative for fungal assemblages in the field. Research bias likely leads to overrepresentation of ECM fungi that tend to be nutrient-limited rather than C-limited, since ECM fungi contain higher concentration of N than plant material (Colpaert et al., 1996). Because the meta-analysis indicated that fungal species identity was a major determinant of the outcome of individual studies, Alberton et al. (2005) also suggested argued choices in species selection for experiments. Because only a limited number of species have been investigated to date, there is a clear need for testing ECM plant and fungal responses to elevated CO2 by a number of different fungal species, with different C and nutrient economies, in one experiment (see also Fransson et al., 2007).
37
Chapter 3
This work aimed at investigating fungal species-specific responses of ECM Scots pine seedlings under controlled conditions at ambient and elevated CO2. We hypothesized that (1) elevated CO2 will increase C allocation to the fungus; (2) enhanced allocation will increase nutrient immobilization in fungal tissue; (3) larger nutrient immobilization in fungal tissue will show negative feedback to plant nutrient content and ultimately plant biomass due PNL; (4) under such conditions mycorrhizal associations may constrain plant responses to elevated CO2; (5) these effects will be strongest in species that produce the largest amount of mycelium. In other words, this study sought for evidence of nutrient competition and hence PNL between ECM fungus and plant in order to improve our understanding and predictive ability of ECM functioning under elevated CO2.
Materials and methods Plants, fungi and substrate Seeds of Scots pine (Pinus sylvestris), purchased from PVM (Grubbenvorst, The Netherlands), were soaked in demineralized water overnight, and then surface-sterilized in a 30% H2O2-solution containing a drop of Tween 20 during 30 min. The sterilized seeds were germinated on sterile water agar media containing 5 g l−1 of glucose. After 3 weeks, each seedling was transferred to a Petri dish (Ø 14.5 cm), filled with 50 g of a sterilized (1 h at 110oC) peat-vermiculite mixture (2:5, w/w). The mixture contained 29.9 mg kg−1 of available mineral N and 1.4 mg kg−1 of available P. The peat-vermiculite mixture was moistened with 50 ml full-strength modified Melin-Norkrans (MMN) solution (without agar, glucose and malt extract) at the start of the experiment. MMN solution was used to ensure that both mycorrhizal and non-mycorrhizal treatments were solely limited by N (and not by P), and to prevent a decrease in pH due the ammonium-N uptake during the experiment (Kamminga-van Wijk & Prins, 1989). During the experiment we furthermore added 5 times 23 ml MMN. In total, 8.66 mg of N and 28.48 mg of P were added to each Petri dish. Each seedling was inoculated around the root system with 12 plugs of actively growing mycelium of one of the following ECM species: Hebeloma cylindrosporum (CBS 558.96, kindly provided by Centraalbureau voor Schimmelcultures CBS, Utrecht, The Netherlands), Laccaria bicolor, Suillus bovinus, S. luteus, Piloderma croceum (BL 97-01, kindly provided by R. Finlay, SLU, Uppsala, Sweden), Paxillus involutus, Boletus badius. A non-mycorrhizal treatment was also included. The isolates of L. bicolor, S. bovinus, S. luteus, P. involutus, and B. badius were isolated from fruitbodies collected in the surroundings of Harderwijk, The Netherlands, in 2004. The Petri dishes were hermetically sealed with parafilm and tape, covered with aluminum foil, but contained three openings. The median opening allowed shoots to grow out
38
Competition for nitrogen between plant and mycorrhizal fungi
of the dish using lanoline for sealing, while one lateral opening could be instantaneously opened for water addition, after which it was closed again. During the labeling, the third opening was connected to a PVC tube (Ø 2 cm; length 15 cm) containing three layers of soda-lime (carbosorb) separated by cotton plugs to trap root and mycorrhizal respiration and to permit the free exchange of oxygen. Approximately 7.5 g of soda-lime were used in the lower layer to capture respiration. The upper layer served as a barrier to capture CO2 entering from atmosphere, and the layer in between was used as a background. Plant growth and experimental conditions The seedlings were placed into four growth chambers (two for each CO2 level) with a steady flow of either 350 or 700 µl l−1 CO2. Temperatures were maintained at 20oC during the day (16 h, irradiation 250 µmol m−2 s−1) and at 16oC during the night (8 h), and relative humidity was kept around 70%. The Petri dishes were randomized every two weeks within each growth chamber. After 128 days, the Petri dishes were transferred to the Experimental Soil Plant Atmosphere System (ESPAS; Gorissen et al., 1996). The seedlings were exposed to 14CO2 (specific radioactivity 0.35 ± 0.05 kBq mg−1 C) supplied from a pressurized cylinder for an additional 28 d. The growth conditions (temperature, relative humidity, CO2 level) in the ESPAS were equal to the growth chambers, except for the photosynthetically active irradiation level, which was increased to 360 µmol m−2 s−1 for the first two weeks and 460 µmol m−2 s−1 for the last two weeks. Analyses All seedlings were harvested 28 d after 14C-labelling started. Plants were removed from Petri dishes; shoots, roots and the peat-vermiculite mixture were separated and dried at 70oC for 48 h. These fractions were subsequently ground and analyzed for total 14C content with a modified wet combustion method (Dalal, 1979). Plant material (30 mg) and peat-vermiculite (0.5 g) were digested in duplicate in 5 ml of a 10% (w/v) solution of K2Cr2O7 in a mixture of concentrated H2SO4 and H3PO4 (3:2, v/v) at 160°C for 2 h. The 14CO2 evolved was trapped in 10 ml of 0.5 M NaOH. The 14C was determined in 0.5 ml of NaOH by liquid scintillation counting (Tri-Carb 2100TR; Packard Instrument Company, Meriden, USA) with 3 ml of Ultima Gold (Packard).
The soda-lime containing the respired 14CO2 was transferred to bottles (0.5 l) and dissolved in 50 ml excess 6 M HCl, injected through a septum in the lid. The 14CO2 evolved was captured in 10 ml of 5 M NaOH and analyzed by liquid scintillation counting as described.
39
Chapter 3
N and P concentrations in shoots and roots were determined colorimetrically by automated flow analysis after digestion of samples with H2SO4-salicyclic acid-H2O2 and selenium (Temminghoff & Houba, 2004).
The total extraradical hyphal length in the peat-vermiculite mixture was determined with the gridline intersection method and fluorescent staining as outlined by Bloem & Vos (2004). We did not subtract hyphal length as measured in the control treatments from hyphal length as measured in the mycorrhizal treatments.
Statistical analyses The experiment consisted of two CO2 concentrations (350 or 700 µl l−1 CO2), eight mycorrhizal treatments (seven ECM species and a non-mycorrhizal control) and six replicates for each treatment. A total of 96 seedlings were included (2 x 8 x 6). In the growth chamber, all Petri dishes for treatment combinations were completely randomized. In order to comply with ANOVA assumptions for homogeneity (Levene’s test), the following variables were log10 transformed before analysis: extraradical hyphal length, root dry weight, shoot-to-root dry weight ratio, 14C in shoots, 14C in shoot-to-root ratio, net 14C uptake per unit shoot mass, N concentration in shoots and roots, P concentration in roots, N content in shoots, P content in roots and N uptake efficiency. ANOVA followed by Tukey’s honestly significant difference (HSD) post hoc test was performed using SPSS Version 12.0.1 for Windows (SPSS Inc., Chicago, IL, USA). Considering the large number of parameters measured and calculated (26), a sequential Bonferroni correction was applied to keep the P-value constant at P < 0.05. Pearson pairwise correlation coefficients were calculated and their significance determined in two-tailed t-test as indicators of direction of relationship between plant and fungal parameters.
Results No differences were observed between the results from both growth chambers for each CO2 level, and they were therefore combined. The respiration measurements showed very low and variable values (14C trapped in respiration usually between 0.5% and 1% of 14C in roots). We concluded that the carbosorb traps were most likely leaky, because respiration data are normally an order of magnitude larger (Gorissen et al., 1991; Andersen & Rygiewicz, 1995). Therefore no data on below-ground respiration and below-ground C use efficiency (Gorissen & Kuyper, 2000) are reported.
Almost all parameters were significantly affected by CO2 and/or fungal species. There were very few significant interactions (Table 1). The non-mycorrhizal plants performed
40
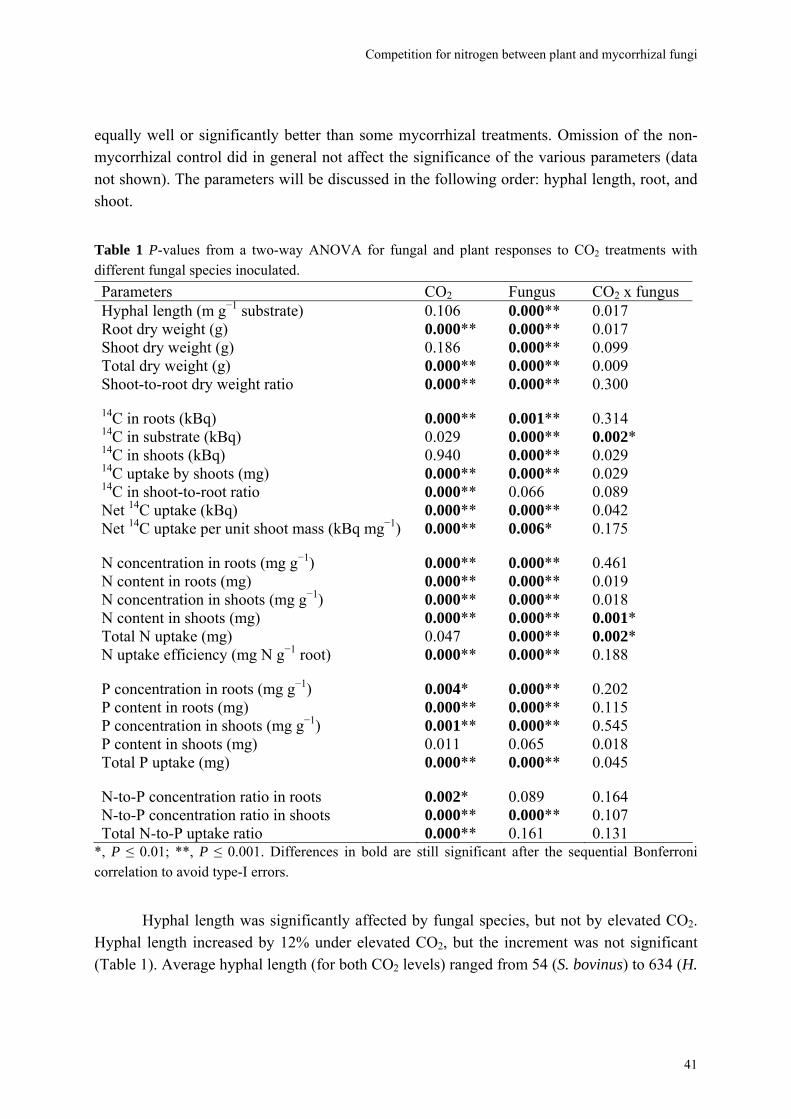
Competition for nitrogen between plant and mycorrhizal fungi
equally well or significantly better than some mycorrhizal treatments. Omission of the non-mycorrhizal control did in general not affect the significance of the various parameters (data not shown). The parameters will be discussed in the following order: hyphal length, root, and shoot.
Table 1 P-values from a two-way ANOVA for fungal and plant responses to CO2 treatments with different fungal species inoculated. Parameters CO2 Fungus CO2 x fungus Hyphal length (m g−1 substrate) 0.106 0.000** 0.017 Root dry weight (g) 0.000** 0.000** 0.017 Shoot dry weight (g) 0.186 0.000** 0.099 Total dry weight (g) 0.000** 0.000** 0.009 Shoot-to-root dry weight ratio 0.000** 0.000** 0.300 14C in roots (kBq) 0.000** 0.001** 0.314 14C in substrate (kBq) 0.029 0.000** 0.002* 14C in shoots (kBq) 0.940 0.000** 0.029 14C uptake by shoots (mg) 0.000** 0.000** 0.029 14C in shoot-to-root ratio 0.000** 0.066 0.089 Net 14C uptake (kBq) 0.000** 0.000** 0.042 Net 14C uptake per unit shoot mass (kBq mg−1) 0.000** 0.006* 0.175
N concentration in roots (mg g−1) 0.000** 0.000** 0.461 N content in roots (mg) 0.000** 0.000** 0.019 N concentration in shoots (mg g−1) 0.000** 0.000** 0.018 N content in shoots (mg) 0.000** 0.000** 0.001* Total N uptake (mg) 0.047 0.000** 0.002* N uptake efficiency (mg N g−1 root) 0.000** 0.000** 0.188
P concentration in roots (mg g−1) 0.004* 0.000** 0.202 P content in roots (mg) 0.000** 0.000** 0.115 P concentration in shoots (mg g−1) 0.001** 0.000** 0.545 P content in shoots (mg) 0.011 0.065 0.018 Total P uptake (mg) 0.000** 0.000** 0.045
N-to-P concentration ratio in roots 0.002* 0.089 0.164 N-to-P concentration ratio in shoots 0.000** 0.000** 0.107 Total N-to-P uptake ratio 0.000** 0.161 0.131
*, P ≤ 0.01; **, P ≤ 0.001. Differences in bold are still significant after the sequential Bonferroni correlation to avoid type-I errors.
Hyphal length was significantly affected by fungal species, but not by elevated CO2. Hyphal length increased by 12% under elevated CO2, but the increment was not significant (Table 1). Average hyphal length (for both CO2 levels) ranged from 54 (S. bovinus) to 634 (H.
41
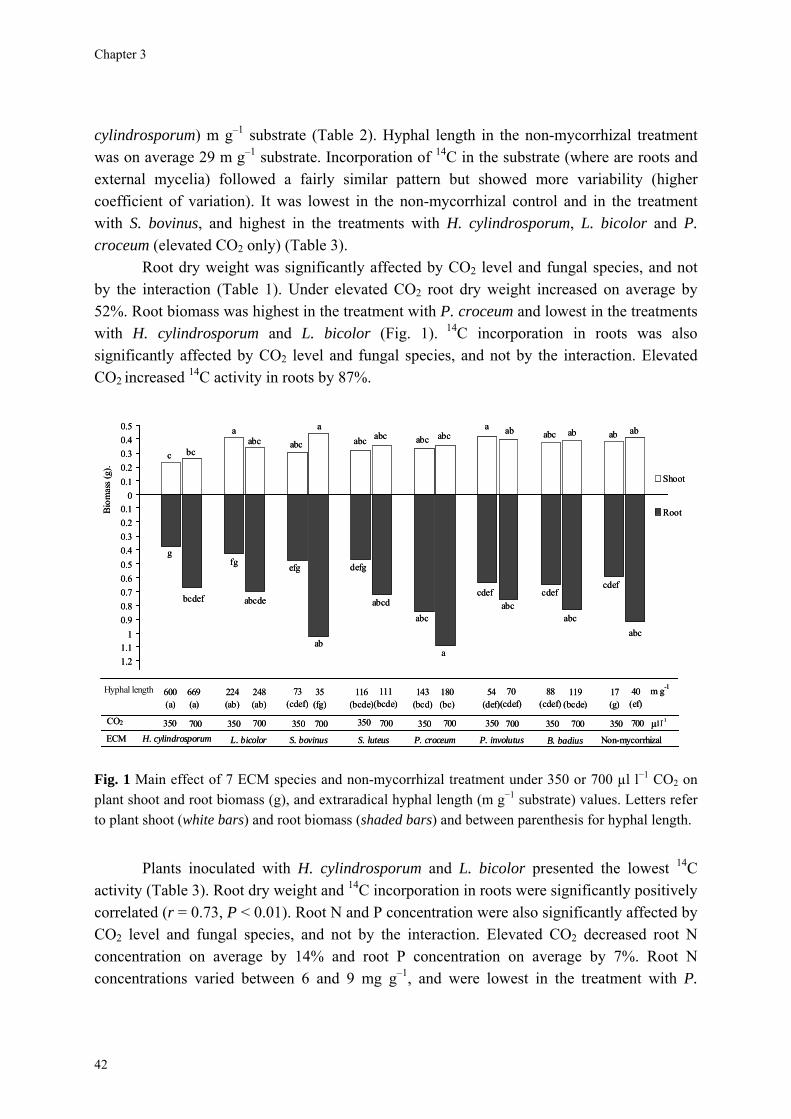
Chapter 3
cylindrosporum) m g–1 substrate (Table 2). Hyphal length in the non-mycorrhizal treatment was on average 29 m g–1 substrate. Incorporation of 14C in the substrate (where are roots and external mycelia) followed a fairly similar pattern but showed more variability (higher coefficient of variation). It was lowest in the non-mycorrhizal control and in the treatment with S. bovinus, and highest in the treatments with H. cylindrosporum, L. bicolor and P. croceum (elevated CO2 only) (Table 3).
Root dry weight was significantly affected by CO2 level and fungal species, and not by the interaction (Table 1). Under elevated CO2 root dry weight increased on average by 52%. Root biomass was highest in the treatment with P. croceum and lowest in the treatments with H. cylindrosporum and L. bicolor (Fig. 1). 14C incorporation in roots was also significantly affected by CO2 level and fungal species, and not by the interaction. Elevated CO2 increased 14C activity in roots by 87%.
-1.5-1.4-1.3-1.2-1.1
-1-0.9-0.8-0.7-0.6-0.5-0.4-0.3-0.2-0.1
00.10.20.30.40.5
Shoot
Root
c
a
bcabc abc
aabc abc abc abc
a ab abc ab ab ab
g
bcdef
fg
abcde
efg
ab
defg
abcd
abc
a
cdef cdefcdef
abc
abcabc
350 700 350 700 350 700 350 700 350 700 350 700 350 700 350 700H. cylindrosporum L. bicolor S. bovinus S. luteus P. croceum P. involutus B. badius Non-mycorrhizal
Biom
ass (
g).
CO2
Hyphal length 600(a)
669 (a)
224 (ab)
248 (ab)
73 (cdef)
35 (fg)
116(bcde)
111(bcde)
143(bcd)
180(bc)
54(def)
70(cdef)
88(cdef)
119(bcde)
17(g)
40 (ef)
ECM
m g-1
µl l-1
Fig. 1 Main effect of 7 ECM species and non-mycorrhizal treatment under 350 or 700 µl l−1 CO2 on plant shoot and root biomass (g), and extraradical hyphal length (m g−1 substrate) values. Letters refer to plant shoot (white bars) and root biomass (shaded bars) and between parenthesis for hyphal length.
Plants inoculated with H. cylindrosporum and L. bicolor presented the lowest 14C activity (Table 3). Root dry weight and 14C incorporation in roots were significantly positively correlated (r = 0.73, P < 0.01). Root N and P concentration were also significantly affected by CO2 level and fungal species, and not by the interaction. Elevated CO2 decreased root N concentration on average by 14% and root P concentration on average by 7%. Root N concentrations varied between 6 and 9 mg g–1, and were lowest in the treatment with P.
42
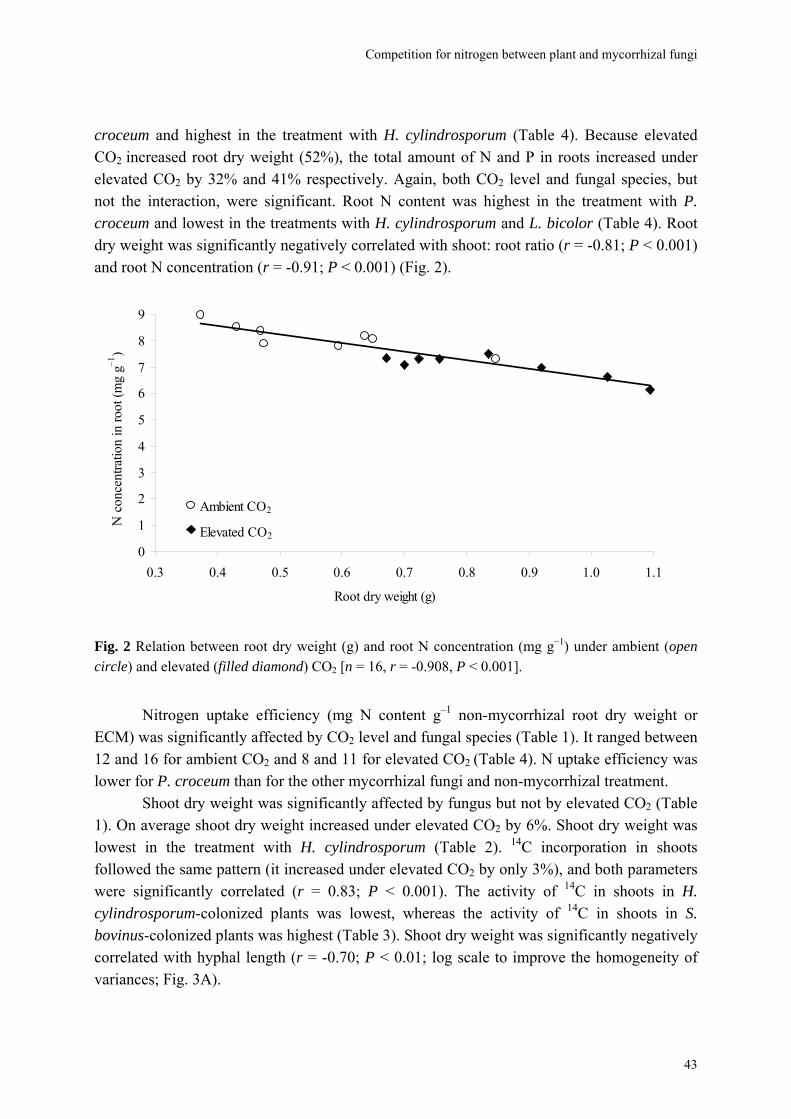
Competition for nitrogen between plant and mycorrhizal fungi
croceum and highest in the treatment with H. cylindrosporum (Table 4). Because elevated CO2 increased root dry weight (52%), the total amount of N and P in roots increased under elevated CO2 by 32% and 41% respectively. Again, both CO2 level and fungal species, but not the interaction, were significant. Root N content was highest in the treatment with P. croceum and lowest in the treatments with H. cylindrosporum and L. bicolor (Table 4). Root dry weight was significantly negatively correlated with shoot: root ratio (r = -0.81; P < 0.001) and root N concentration (r = -0.91; P < 0.001) (Fig. 2).
0
1
2
3
4
5
6
7
8
9
0.3 0.4 0.5 0.6 0.7 0.8 0.9 1.0 1.1
N c
once
ntra
tion
in ro
ot (m
g g
–1)..
.
ACO2
ECO2Ambient CO2
Elevated CO2
Root dry weight (g)
Fig. 2 Relation between root dry weight (g) and root N concentration (mg g−1) under ambient (open circle) and elevated (filled diamond) CO2 [n = 16, r = -0.908, P < 0.001].
Nitrogen uptake efficiency (mg N content g–1 non-mycorrhizal root dry weight or ECM) was significantly affected by CO2 level and fungal species (Table 1). It ranged between 12 and 16 for ambient CO2 and 8 and 11 for elevated CO2 (Table 4). N uptake efficiency was lower for P. croceum than for the other mycorrhizal fungi and non-mycorrhizal treatment.
Shoot dry weight was significantly affected by fungus but not by elevated CO2 (Table 1). On average shoot dry weight increased under elevated CO2 by 6%. Shoot dry weight was lowest in the treatment with H. cylindrosporum (Table 2). 14C incorporation in shoots followed the same pattern (it increased under elevated CO2 by only 3%), and both parameters were significantly correlated (r = 0.83; P < 0.001). The activity of 14C in shoots in H. cylindrosporum-colonized plants was lowest, whereas the activity of 14C in shoots in S. bovinus-colonized plants was highest (Table 3). Shoot dry weight was significantly negatively correlated with hyphal length (r = -0.70; P < 0.01; log scale to improve the homogeneity of variances; Fig. 3A).
43
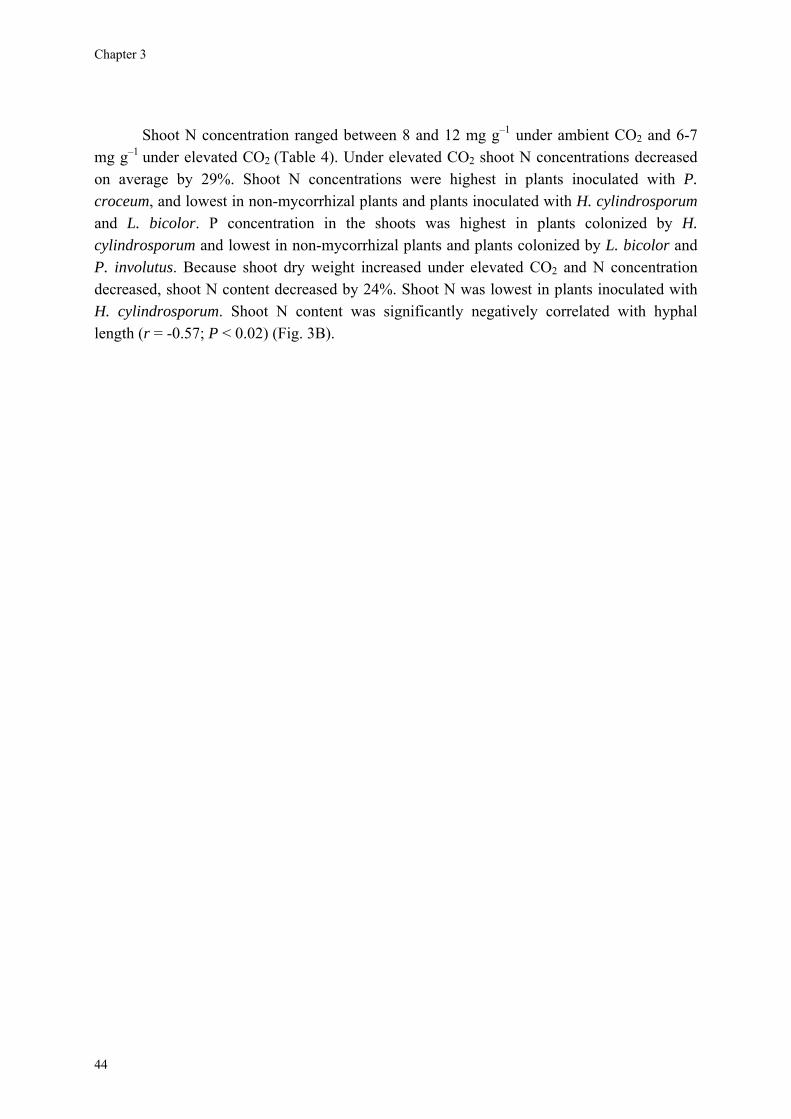
Chapter 3
44
Shoot N concentration ranged between 8 and 12 mg g–1 under ambient CO2 and 6-7 mg g–1 under elevated CO2 (Table 4). Under elevated CO2 shoot N concentrations decreased on average by 29%. Shoot N concentrations were highest in plants inoculated with P. croceum, and lowest in non-mycorrhizal plants and plants inoculated with H. cylindrosporum and L. bicolor. P concentration in the shoots was highest in plants colonized by H. cylindrosporum and lowest in non-mycorrhizal plants and plants colonized by L. bicolor and P. involutus. Because shoot dry weight increased under elevated CO2 and N concentration decreased, shoot N content decreased by 24%. Shoot N was lowest in plants inoculated with H. cylindrosporum. Shoot N content was significantly negatively correlated with hyphal length (r = -0.57; P < 0.02) (Fig. 3B).
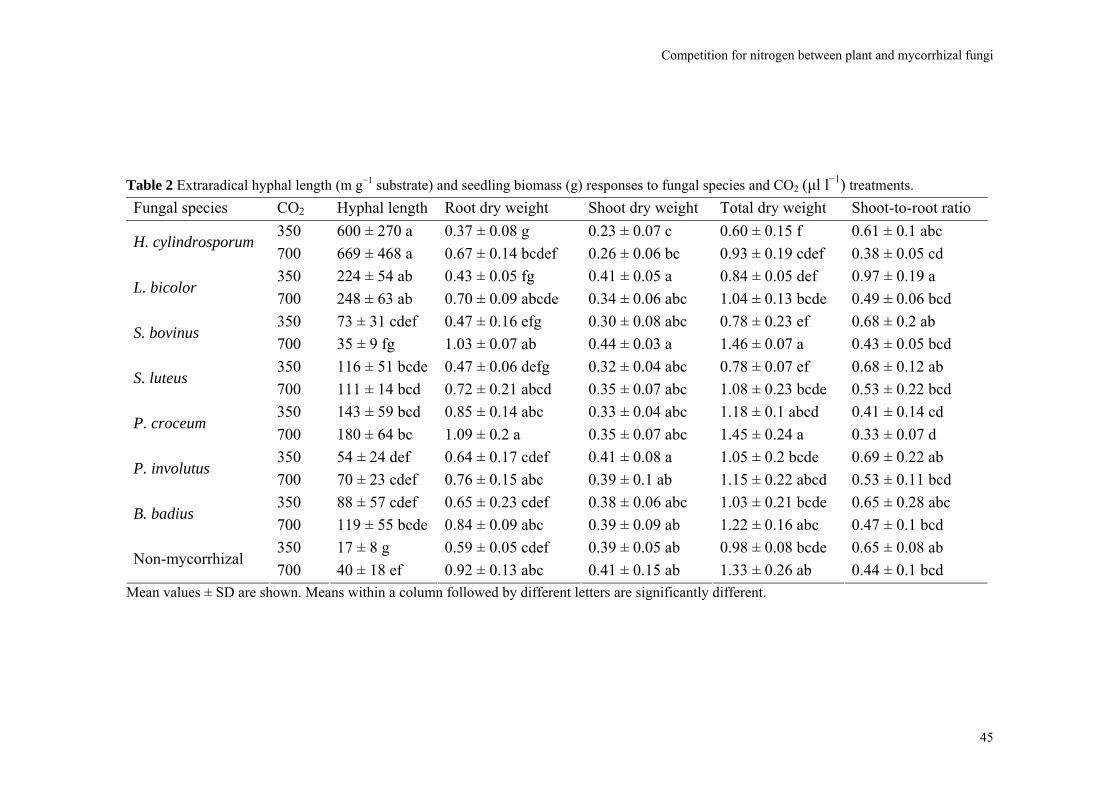
Competition for nitrogen between plant and mycorrhizal fungi
Table 2 Extraradical hyphal length (m g−1 substrate) and seedling biomass (g) responses to fungal species and CO2 (μl l−1) treatments. Fungal species CO2 Hyphal length Root dry weight Shoot dry weight Total dry weight Shoot-to-root ratio
350 600 ± 270 a 0.37 ± 0.08 g 0.23 ± 0.07 c 0.60 ± 0.15 f 0.61 ± 0.1 abc H. cylindrosporum
700 669 ± 468 a 0.67 ± 0.14 bcdef 0.26 ± 0.06 bc 0.93 ± 0.19 cdef 0.38 ± 0.05 cd 350 224 ± 54 ab 0.43 ± 0.05 fg 0.41 ± 0.05 a 0.84 ± 0.05 def 0.97 ± 0.19 a
L. bicolor 700 248 ± 63 ab 0.70 ± 0.09 abcde 0.34 ± 0.06 abc 1.04 ± 0.13 bcde 0.49 ± 0.06 bcd 350 73 ± 31 cdef 0.47 ± 0.16 efg 0.30 ± 0.08 abc 0.78 ± 0.23 ef 0.68 ± 0.2 ab
S. bovinus 700 35 ± 9 fg 1.03 ± 0.07 ab 0.44 ± 0.03 a 1.46 ± 0.07 a 0.43 ± 0.05 bcd 350 116 ± 51 bcde 0.47 ± 0.06 defg 0.32 ± 0.04 abc 0.78 ± 0.07 ef 0.68 ± 0.12 ab
S. luteus 700 111 ± 14 bcd 0.72 ± 0.21 abcd 0.35 ± 0.07 abc 1.08 ± 0.23 bcde 0.53 ± 0.22 bcd 350 143 ± 59 bcd 0.85 ± 0.14 abc 0.33 ± 0.04 abc 1.18 ± 0.1 abcd 0.41 ± 0.14 cd
P. croceum 700 180 ± 64 bc 1.09 ± 0.2 a 0.35 ± 0.07 abc 1.45 ± 0.24 a 0.33 ± 0.07 d 350 54 ± 24 def 0.64 ± 0.17 cdef 0.41 ± 0.08 a 1.05 ± 0.2 bcde 0.69 ± 0.22 ab
P. involutus 700 70 ± 23 cdef 0.76 ± 0.15 abc 0.39 ± 0.1 ab 1.15 ± 0.22 abcd 0.53 ± 0.11 bcd 350 88 ± 57 cdef 0.65 ± 0.23 cdef 0.38 ± 0.06 abc 1.03 ± 0.21 bcde 0.65 ± 0.28 abc
B. badius 700 119 ± 55 bcde 0.84 ± 0.09 abc 0.39 ± 0.09 ab 1.22 ± 0.16 abc 0.47 ± 0.1 bcd 350 17 ± 8 g 0.59 ± 0.05 cdef 0.39 ± 0.05 ab 0.98 ± 0.08 bcde 0.65 ± 0.08 ab
Non-mycorrhizal 700 40 ± 18 ef 0.92 ± 0.13 abc 0.41 ± 0.15 ab 1.33 ± 0.26 ab 0.44 ± 0.1 bcd
Mean values ± SD are shown. Means within a column followed by different letters are significantly different.
45
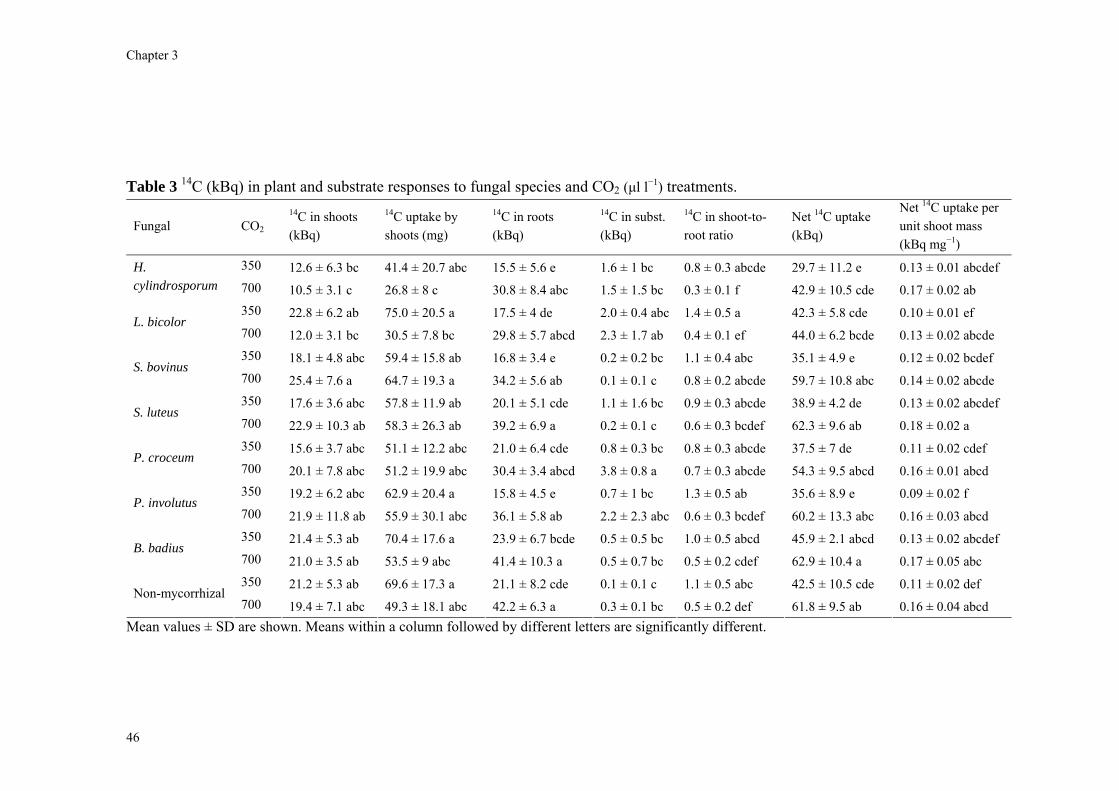
Chapter 3
Table 3 14C (kBq) in plant and substrate responses to fungal species and CO2 (μl l−1) treatments.
Fungal CO2
14C in shoots (kBq)
14C uptake by shoots (mg)
14C in roots (kBq)
14C in subst. (kBq)
14C in shoot-to-root ratio
Net 14C uptake (kBq)
Net 14C uptake per unit shoot mass (kBq mg−1)
350 12.6 ± 6.3 bc 41.4 ± 20.7 abc 15.5 ± 5.6 e 1.6 ± 1 bc 0.8 ± 0.3 abcde 29.7 ± 11.2 e 0.13 ± 0.01 abcdef H. cylindrosporum 700 10.5 ± 3.1 c 26.8 ± 8 c 30.8 ± 8.4 abc 1.5 ± 1.5 bc 0.3 ± 0.1 f 42.9 ± 10.5 cde 0.17 ± 0.02 ab
350 22.8 ± 6.2 ab 75.0 ± 20.5 a 17.5 ± 4 de 2.0 ± 0.4 abc 1.4 ± 0.5 a 42.3 ± 5.8 cde 0.10 ± 0.01 ef L. bicolor
700 12.0 ± 3.1 bc 30.5 ± 7.8 bc 29.8 ± 5.7 abcd 2.3 ± 1.7 ab 0.4 ± 0.1 ef 44.0 ± 6.2 bcde 0.13 ± 0.02 abcde 350 18.1 ± 4.8 abc 59.4 ± 15.8 ab 16.8 ± 3.4 e 0.2 ± 0.2 bc 1.1 ± 0.4 abc 35.1 ± 4.9 e 0.12 ± 0.02 bcdef
S. bovinus 700 25.4 ± 7.6 a 64.7 ± 19.3 a 34.2 ± 5.6 ab 0.1 ± 0.1 c 0.8 ± 0.2 abcde 59.7 ± 10.8 abc 0.14 ± 0.02 abcde 350 17.6 ± 3.6 abc 57.8 ± 11.9 ab 20.1 ± 5.1 cde 1.1 ± 1.6 bc 0.9 ± 0.3 abcde 38.9 ± 4.2 de 0.13 ± 0.02 abcdef
S. luteus 700 22.9 ± 10.3 ab 58.3 ± 26.3 ab 39.2 ± 6.9 a 0.2 ± 0.1 c 0.6 ± 0.3 bcdef 62.3 ± 9.6 ab 0.18 ± 0.02 a 350 15.6 ± 3.7 abc 51.1 ± 12.2 abc 21.0 ± 6.4 cde 0.8 ± 0.3 bc 0.8 ± 0.3 abcde 37.5 ± 7 de 0.11 ± 0.02 cdef
P. croceum 700 20.1 ± 7.8 abc 51.2 ± 19.9 abc 30.4 ± 3.4 abcd 3.8 ± 0.8 a 0.7 ± 0.3 abcde 54.3 ± 9.5 abcd 0.16 ± 0.01 abcd 350 19.2 ± 6.2 abc 62.9 ± 20.4 a 15.8 ± 4.5 e 0.7 ± 1 bc 1.3 ± 0.5 ab 35.6 ± 8.9 e 0.09 ± 0.02 f
P. involutus 700 21.9 ± 11.8 ab 55.9 ± 30.1 abc 36.1 ± 5.8 ab 2.2 ± 2.3 abc 0.6 ± 0.3 bcdef 60.2 ± 13.3 abc 0.16 ± 0.03 abcd 350 21.4 ± 5.3 ab 70.4 ± 17.6 a 23.9 ± 6.7 bcde 0.5 ± 0.5 bc 1.0 ± 0.5 abcd 45.9 ± 2.1 abcd 0.13 ± 0.02 abcdef
B. badius 700 21.0 ± 3.5 ab 53.5 ± 9 abc 41.4 ± 10.3 a 0.5 ± 0.7 bc 0.5 ± 0.2 cdef 62.9 ± 10.4 a 0.17 ± 0.05 abc 350 21.2 ± 5.3 ab 69.6 ± 17.3 a 21.1 ± 8.2 cde 0.1 ± 0.1 c 1.1 ± 0.5 abc 42.5 ± 10.5 cde 0.11 ± 0.02 def
Non-mycorrhizal 700 19.4 ± 7.1 abc 49.3 ± 18.1 abc 42.2 ± 6.3 a 0.3 ± 0.1 bc 0.5 ± 0.2 def 61.8 ± 9.5 ab 0.16 ± 0.04 abcd
Mean values ± SD are shown. Means within a column followed by different letters are significantly different.
46
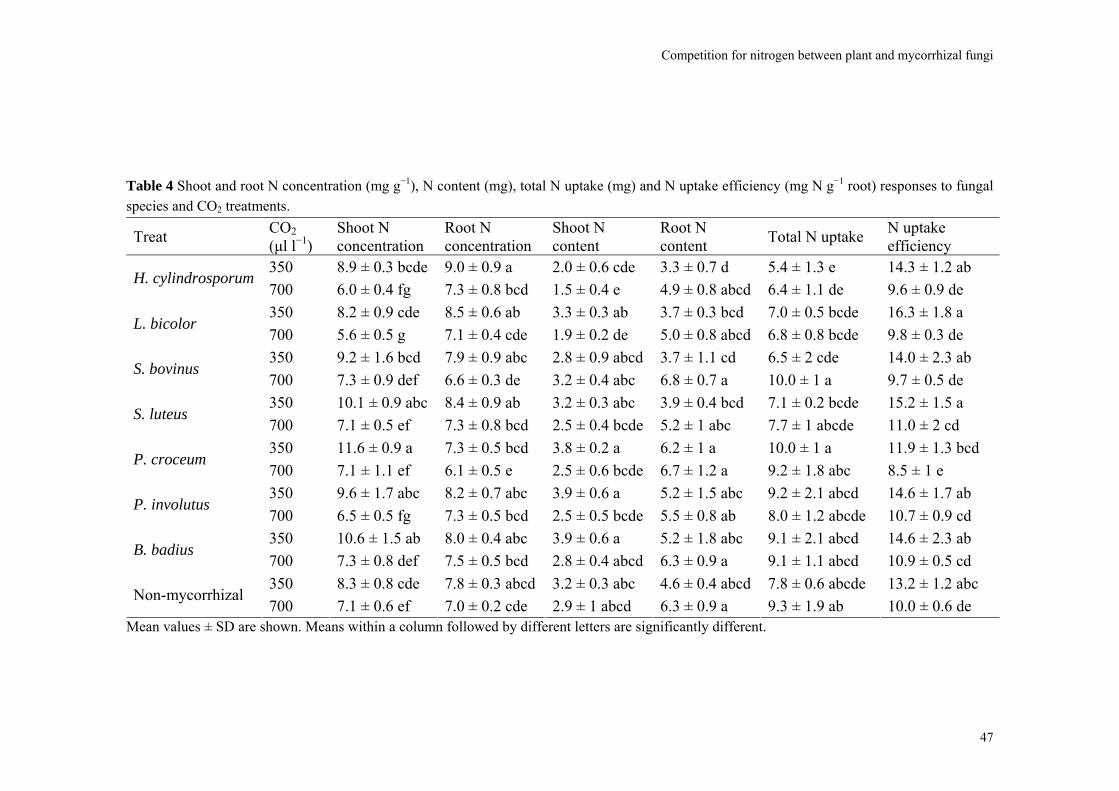
Competition for nitrogen between plant and mycorrhizal fungi
Table 4 Shoot and root N concentration (mg g−1), N content (mg), total N uptake (mg) and N uptake efficiency (mg N g−1 root) responses to fungal species and CO2 treatments.
Treat CO2 (μl l−1)
Shoot N concentration
Root N concentration
Shoot N content
Root N content Total N uptake N uptake
efficiency 350 8.9 ± 0.3 bcde 9.0 ± 0.9 a 2.0 ± 0.6 cde 3.3 ± 0.7 d 5.4 ± 1.3 e 14.3 ± 1.2 ab
H. cylindrosporum 700 6.0 ± 0.4 fg 7.3 ± 0.8 bcd 1.5 ± 0.4 e 4.9 ± 0.8 abcd 6.4 ± 1.1 de 9.6 ± 0.9 de 350 8.2 ± 0.9 cde 8.5 ± 0.6 ab 3.3 ± 0.3 ab 3.7 ± 0.3 bcd 7.0 ± 0.5 bcde 16.3 ± 1.8 a
L. bicolor 700 5.6 ± 0.5 g 7.1 ± 0.4 cde 1.9 ± 0.2 de 5.0 ± 0.8 abcd 6.8 ± 0.8 bcde 9.8 ± 0.3 de 350 9.2 ± 1.6 bcd 7.9 ± 0.9 abc 2.8 ± 0.9 abcd 3.7 ± 1.1 cd 6.5 ± 2 cde 14.0 ± 2.3 ab
S. bovinus 700 7.3 ± 0.9 def 6.6 ± 0.3 de 3.2 ± 0.4 abc 6.8 ± 0.7 a 10.0 ± 1 a 9.7 ± 0.5 de 350 10.1 ± 0.9 abc 8.4 ± 0.9 ab 3.2 ± 0.3 abc 3.9 ± 0.4 bcd 7.1 ± 0.2 bcde 15.2 ± 1.5 a
S. luteus 700 7.1 ± 0.5 ef 7.3 ± 0.8 bcd 2.5 ± 0.4 bcde 5.2 ± 1 abc 7.7 ± 1 abcde 11.0 ± 2 cd 350 11.6 ± 0.9 a 7.3 ± 0.5 bcd 3.8 ± 0.2 a 6.2 ± 1 a 10.0 ± 1 a 11.9 ± 1.3 bcd
P. croceum 700 7.1 ± 1.1 ef 6.1 ± 0.5 e 2.5 ± 0.6 bcde 6.7 ± 1.2 a 9.2 ± 1.8 abc 8.5 ± 1 e 350 9.6 ± 1.7 abc 8.2 ± 0.7 abc 3.9 ± 0.6 a 5.2 ± 1.5 abc 9.2 ± 2.1 abcd 14.6 ± 1.7 ab
P. involutus 700 6.5 ± 0.5 fg 7.3 ± 0.5 bcd 2.5 ± 0.5 bcde 5.5 ± 0.8 ab 8.0 ± 1.2 abcde 10.7 ± 0.9 cd 350 10.6 ± 1.5 ab 8.0 ± 0.4 abc 3.9 ± 0.6 a 5.2 ± 1.8 abc 9.1 ± 2.1 abcd 14.6 ± 2.3 ab
B. badius 700 7.3 ± 0.8 def 7.5 ± 0.5 bcd 2.8 ± 0.4 abcd 6.3 ± 0.9 a 9.1 ± 1.1 abcd 10.9 ± 0.5 cd 350 8.3 ± 0.8 cde 7.8 ± 0.3 abcd 3.2 ± 0.3 abc 4.6 ± 0.4 abcd 7.8 ± 0.6 abcde 13.2 ± 1.2 abc
Non-mycorrhizal 700 7.1 ± 0.6 ef 7.0 ± 0.2 cde 2.9 ± 1 abcd 6.3 ± 0.9 a 9.3 ± 1.9 ab 10.0 ± 0.6 de
Mean values ± SD are shown. Means within a column followed by different letters are significantly different.
47
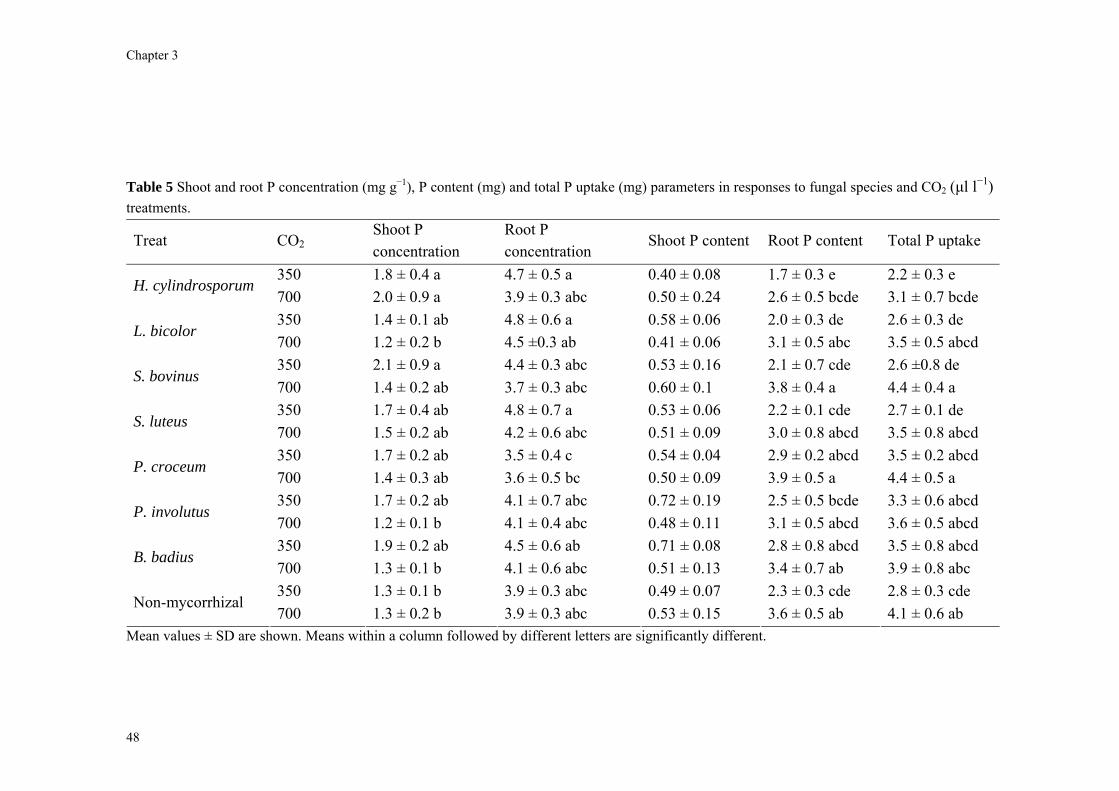
apter 3
Table 5 Shoot and root P concentration (mg g−1), P content (mg) and total P uptake (mg) parameters in responses to fungal species and CO2 (μl l−1) treatments.
Treat CO2Shoot P concentration
Root P concentration
Shoot P content Root P content Total P uptake
350 1.8 ± 0.4 a 4.7 ± 0.5 a 0.40 ± 0.08 1.7 ± 0.3 e 2.2 ± 0.3 e H. cylindrosporum
700 2.0 ± 0.9 a 3.9 ± 0.3 abc 0.50 ± 0.24 2.6 ± 0.5 bcde 3.1 ± 0.7 bcde 350 1.4 ± 0.1 ab 4.8 ± 0.6 a 0.58 ± 0.06 2.0 ± 0.3 de 2.6 ± 0.3 de
L. bicolor 700 1.2 ± 0.2 b 4.5 ±0.3 ab 0.41 ± 0.06 3.1 ± 0.5 abc 3.5 ± 0.5 abcd 350 2.1 ± 0.9 a 4.4 ± 0.3 abc 0.53 ± 0.16 2.1 ± 0.7 cde 2.6 ±0.8 de
S. bovinus 700 1.4 ± 0.2 ab 3.7 ± 0.3 abc 0.60 ± 0.1 3.8 ± 0.4 a 4.4 ± 0.4 a 350 1.7 ± 0.4 ab 4.8 ± 0.7 a 0.53 ± 0.06 2.2 ± 0.1 cde 2.7 ± 0.1 de
S. luteus 700 1.5 ± 0.2 ab 4.2 ± 0.6 abc 0.51 ± 0.09 3.0 ± 0.8 abcd 3.5 ± 0.8 abcd 350 1.7 ± 0.2 ab 3.5 ± 0.4 c 0.54 ± 0.04 2.9 ± 0.2 abcd 3.5 ± 0.2 abcd
P. croceum 700 1.4 ± 0.3 ab 3.6 ± 0.5 bc 0.50 ± 0.09 3.9 ± 0.5 a 4.4 ± 0.5 a 350 1.7 ± 0.2 ab 4.1 ± 0.7 abc 0.72 ± 0.19 2.5 ± 0.5 bcde 3.3 ± 0.6 abcd
P. involutus 700 1.2 ± 0.1 b 4.1 ± 0.4 abc 0.48 ± 0.11 3.1 ± 0.5 abcd 3.6 ± 0.5 abcd 350 1.9 ± 0.2 ab 4.5 ± 0.6 ab 0.71 ± 0.08 2.8 ± 0.8 abcd 3.5 ± 0.8 abcd
B. badius 700 1.3 ± 0.1 b 4.1 ± 0.6 abc 0.51 ± 0.13 3.4 ± 0.7 ab 3.9 ± 0.8 abc 350 1.3 ± 0.1 b 3.9 ± 0.3 abc 0.49 ± 0.07 2.3 ± 0.3 cde 2.8 ± 0.3 cde
Non-mycorrhizal 700 1.3 ± 0.2 b 3.9 ± 0.3 abc 0.53 ± 0.15 3.6 ± 0.5 ab 4.1 ± 0.6 ab
Mean values ± SD are shown. Means within a column followed by different letters are significantly different.
Ch
48
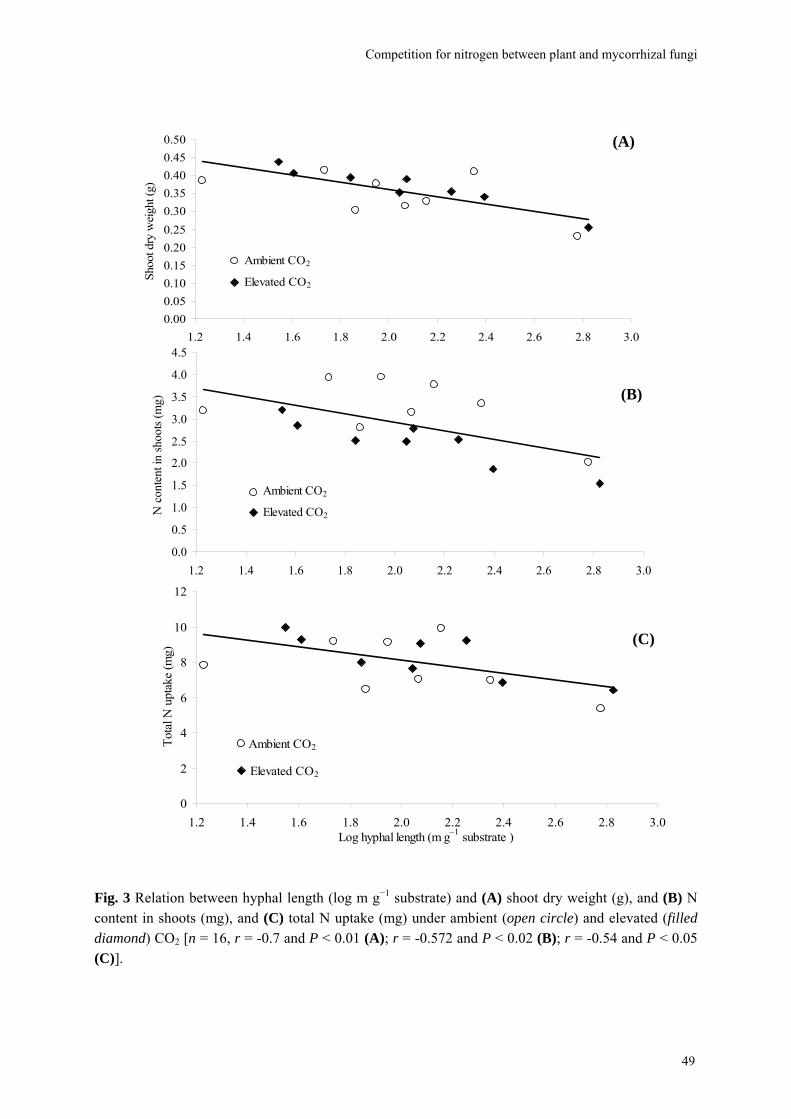
Competition for nitrogen between plant and mycorrhizal fungi
0.000.050.100.150.200.250.300.350.400.450.50
1.2 1.4 1.6 1.8 2.0 2.2 2.4 2.6 2.8 3.0
Shoo
t dry
wei
ght (
g) .
ACO2
ECO2
Ambient CO2
Elevated CO2
0.0
0.5
1.0
1.5
2.0
2.5
3.0
3.5
4.0
4.5
1.2 1.4 1.6 1.8 2.0 2.2 2.4 2.6 2.8 3.0
N c
onte
nt in
shoo
ts (m
g) …
...
ACO2ECO2
Ambient CO2
Elevated CO2
0
2
4
6
8
10
12
1.2 1.4 1.6 1.8 2.0 2.2 2.4 2.6 2.8 3.0 Log hyphal length (m g–1 substrate )
Tota
l N u
ptak
e (m
g)..
ACO2
ECO2
Ambient CO2
Elevated CO2
(A)
(B)
(C)
Fig. 3 Relation between hyphal length (log m g−1 substrate) and (A) shoot dry weight (g), and (B) N content in shoots (mg), and (C) total N uptake (mg) under ambient (open circle) and elevated (filled diamond) CO2 [n = 16, r = -0.7 and P < 0.01 (A); r = -0.572 and P < 0.02 (B); r = -0.54 and P < 0.05 (C)].
45 49
Chapter 3
Total plant dry biomass increased by 33% under elevated CO2 and once again presented significant differences due to fungal species. Total plant biomass was lowest in the treatment with H. cylindrosporum and highest in the treatment with P. croceum (Table 2). Elevated CO2 resulted in an average increase of 14C incorporation by 46%, with significant differences between species (Table 1). On average, total N uptake increased by 8% under elevated CO2. It was affected by fungal species and by the interaction fungal species × CO2, but not by CO2 (Table 1). Plants colonized by H. cylindrosporum, L. bicolor and S. luteus showed the lowest total N uptake and plants colonized by P. croceum and B. badius the highest (Table 4). Total N uptake was also significantly negatively correlated with hyphal length (r = -0.54; P < 0.05) (Fig. 3C). Under elevated CO2 P uptake increased by 32%. Total P uptake was also affected by fungal species, but not by the interaction. Total P uptake was lower in plants colonized by H. cylindrosporum, L. bicolor and S. luteus than in plants colonized by P. croceum (Table 5).
Shoot: root ratio was significantly affected by elevated CO2 and fungal species and not by their interaction. On average, elevated CO2 reduced shoot: root ratio from 0.67 to 0.45, a decrease of 33%. Shoot: root ratio was lowest in plants inoculated with P. croceum. Shoot: root ratio and the ratio of 14C incorporation in shoots and roots were significantly correlated (r = 0.75; P < 0.001). The 14C in shoot: root ratio decreased by 52% under elevated CO2. This decrease, caused by an increased C allocation to the roots compared to the shoots during the final four weeks of the experiment, indicated increased sink strength below-ground.
Discussion In our experiment hyphal length of 7 different ECM fungal species did not significantly increase under elevated CO2. The average increase of 12% was much lower than the value of 34% of the general ECM fungal response (i.e. mycelial dry weight, mycelial area, hyphal length, etc.) reported by Alberton et al. (2005). Our experiment did therefore not provide complete support for our first hypothesis. Plant performance (with regard to N) suggests an explanation for the lack of a fungal response.
Mycorrhizal symbiosis often enhances plant growth due to increased nutrient uptake compared to non-mycorrhizal plants. However, in our experiment the non-mycorrhizal plants performed equally well or significantly better than in some mycorrhizal treatments. Especially plants colonized by H. cylindrosporum showed a significantly lower growth performance. Basically, two related hypotheses have been forwarded to explain lower growth performance of mycorrhizal plants compared to non-mycorrhizal plants. The first hypothesis focuses on C costs for the mycorrhizal fungus, while the second hypothesis focuses on nutrient immobilization by the mycorrhizal fungus.
50
Competition for nitrogen between plant and mycorrhizal fungi
Under the first hypothesis increased C availability (through higher rates of photosynthesis) would decrease relative C costs to maintain the mycorrhizal fungus. One corollary following from that hypothesis would be that increased CO2 availability reduces C costs and hence decreases growth reduction. In our experiment, the growth performance of mycorrhizal plants was independent of CO2 levels. Dry weight of mycorrhizal plants (averaged over seven species) was 91% of that of non-mycorrhizal plants at ambient CO2 levels and 90% at elevated CO2 levels. So, increased sink strength for C in mycorrhizal plants does not seem to be the cause of the growth reduction. In addition, dry weight of mycorrhizal plants was largely determined by intrinsic fungal properties, notably the length of the extraradical mycelium, because we found significantly negative correlations between extraradical hyphal length and shoot weight (Fig. 3A), shoot N content (Fig. 3B), and total N uptake (Fig. 3C), indicating the importance of fungal sink strength for N.
Several lines of evidence suggest that this growth reduction of mycorrhizal plants was due to N immobilization in the extraradical mycelium. An N balance showed that under ambient CO2 76% of the mineral N that was in or added to the system could be accounted for in shoots and roots of non-mycorrhizal plants, and that mycorrhizal colonization reduced that to on average 67%. Under elevated CO2, 89% of N in the system could be accounted for in shoots and roots of non-mycorrhizal plants, and in ECM plants this was on average 68%. Plants colonized by H. cylindrosporum, where a very high length of extraradical mycelium was recorded, remained the smallest, despite the high below-ground investment. Because of the C compounds associated with the immobilization of N, the extraradical mycelium of Hebeloma species has been noted to be a large modifier of plant photosynthesis and carbohydrate metabolism (Miller et al., 1989; Rygiewicz & Andersen, 1994; Marmeisse et al., 1999). Also in conditions of low P supply, H. cylindrosporum associated with seedlings of Pinus pinaster reduced plant growth due to P retention (Conjeaud et al., 1996). When different kinds of N were supplied to the symbiosis P. pinaster – H. cylindrosporum, decreased plant growth of the pine was related to the C cost for fungal growth and N assimilation, and the extraradical hyphae were considered as the main sink (Plassard et al., 2000). Colpaert et al. (1992) demonstrated a negative correlation between mycelial size and the growth of P. sylvestris seedlings and in a subsequent study Colpaert et al. (1996) suggested that growth reduction of pine seedlings colonized by Scleroderma citrinum was best explained by the N-drain.
While in a strict sense our second and third hypothesis were not supported (because under elevated CO2 there were no increases in the size of the extraradical mycelium), the underlying mechanism of mycorrhizal fungal-induced PNL (mycelial size determines fungal N immobilization potential and hence plant N concentration and content) was confirmed. While laboratory evidence for nutrient (N) retention by ECM fungi resulting in reduced plant growth was also provided by Nylund & Wallander (1989), Dosskey et al. (1990, 1991), Colpaert & Verstuyft (1999), and Fransson et al. (2005), the question is relevant whether the
51
Chapter 3
same mechanism could also occur under field conditions. Instances of very strong N-limitation of ECM mycelial growth has been reported from several boreal and arctic ecosystems (Hendricks et al., 2006; Clemmensen et al., 2006; Wallander, 2006). There is also field evidence for N-limitation of arbuscular mycorrhizal fungi (Treseder & Allen, 2002; Allen et al., 2005). It is therefore likely that mycorrhizal fungal-induced PNL can also occur under field conditions and will ultimately constrain mycorrhizal plant responses to elevated CO2 (Johnson, 2006; Hu et al., 2006).
Further indirect evidence for mycorrhizal-fungal induced PNL comes from N concentration. In our system shoot and root N under ambient CO2 ranged between 7 and 12 mg g–1, and under elevated CO2 between 6 and 7 mg g–1. Especially these latter values are clearly below the deficiency limit of 10 mg g–1 as mentioned by Reuter et al. (1997) for pines. Similar low plant N concentrations were also observed in northern Finland in Scots pine and Norway spruce (Picea abies) stands on very poor soils (Helmisaari et al., 2007) with root N concentrations between 5 and 8 mg g-1, indicating that this degree of N-limitation also occurs in natural systems. The high N retention by mycorrhizal hyphae apparently limits plant growth given the fact that the non-mycorrhizal plants grew somewhat better than the mycorrhizal plants. This confirms our fourth hypothesis. The N: P ratio (ranging between 4 and 7 under both ambient and elevated CO2) and P concentration of shoots (between 1.2 and 2.1 mg g-1 under both ambient and elevated CO2), above the deficiency level of 1.0 mg g-1 (Reuter et al., 1997) indicated adequate P supply.
Alberton et al. (2005) pointed out that a large source of variation between experiments was due to differences between fungal species and stated that argued choices for fungal species selection are very important. ECM fungi show large intrinsic differences in their N sink strength. Relations between N availability and fungal C use, where increasing N levels result in a shift from fungal growth towards N assimilation, have been noted by Arnebrant (1994) and Wallander (1995). Ectomycorrhizal fungi can be classified along a gradient from nitrophobic to nitrotolerant or nitrophilic. Gorissen & Kuyper (2000) showed that the nitrophobic S. bovinus could respond to elevated CO2, whereas the nitrotolerant L. bicolor did not. In their study there were no significant differences in hyphal length between both species (although S. bovinus tended to form more mycelium), but pine seedlings colonized by S. bovinus had significantly higher N concentrations in shoots and roots, being above deficiency levels in the former case, and below deficiency levels in the latter. One important point if one wants to compare the results of this study with that by Gorissen & Kuyper (2000) is the duration of the experiment; in the present experiment it lasted two months longer, thereby increasing N-limitation due fungal and plant growth. Calculations, based on the data in Gorissen & Kuyper (2000) showed that S. bovinus transferred significantly more N per g ECM than L. bicolor; N-uptake efficiency for the former species was 20 and was reduced to 11 under elevated CO2, for the latter species 12 and slightly reduced to 11 under elevated CO2. Comparison with the present study (N-uptake efficiency of 12-16 under ambient CO2,
52
Competition for nitrogen between plant and mycorrhizal fungi
and 8-11 under elevated CO2) suggests additionally that the previous experiment was done under less N-constrained conditions. The decrease in N uptake efficiency under elevated CO2 shows that additional C hardly increase N uptake, consistent with the PNL hypothesis.
In the present study, differences between fungal species could very well be explained through one factor only, size of the extraradical mycelium. Differences in C to N exchange ratios in the fungus were clearly of limited importance. When plant growth is limited by nutrients, plants undergo morphological and physiological modifications. By changing the functional equilibrium between shoots and roots, plants allocate more C to below-ground structures for nutrient acquisition. If plants allocate more biomass to the organs that are involved in the acquisition of the resource that is currently most limiting, one would predict that elevated CO2 would decrease shoot: root ratio. Our data are consistent with that prediction. Shoot: root ratios declined under elevated CO2 from 0.67 to 0.45. A meta-analysis, conducted by Poorter & Nagel (2000) showed that under conditions of severe nutrient limitation, elevated CO2 led to a decrease in shoot: root ratio. Our experiments showed the largest reduction in shoot: root ratio in plants that were colonized by those ECM fungal species that had the largest extraradical mycelium, lowest N concentration in needles under elevated CO2 and lowest 14C incorporation in needles, viz. L. bicolor and H. cylindrosporum. The ultimate effect of this changed allocation of C (and unavoidably of N!) would be that photosynthesis rates go down, in the end to levels where no effect of elevated CO2 on shoot biomass or shoot 14C incorporation was noted (Table 1). The observation that fungal sink strength for N constrains plant response to elevated CO2 supports our claim that the size of the extraradical mycelium generates potential for negative feedback through PNL (Hu et al., 2006).
The fact that mycelial length, and hence, mycelial biomass did not increase significantly under elevated CO2 (Table 1) could suggest that plants do have some control over allocation of C to their fungal symbionts. However, increases in the ECM root biomass likely entails increases in fungal biomass on the roots as well. From data by Hobbie & Colpaert (2003) we calculated that fungi contributed 20% to the ECM root mass of pine seedlings (18% under high N, 21% under low N – average for S. luteus and T. terrestris). Assuming that fungi also contribute 20% to the mass of the ECM in our study, and converting hyphal length into fungal biomass (treating mycelium as an elongated cylinder with a diameter of 2.7 µm and a hyphal density of 1.3 g cm–3 (Bloem & Vos, 2004), we calculate that the increased allocation below-ground under elevated CO2 could increase ECM fungal biomass with on average of 32% for most species (64% for S. bovinus), remarkably close to the 34% of generalized fungal response in Alberton et al. (2005).
Shoot dry weight increased with only 6% under elevated CO2, and this was slightly less than the increase in hyphal length (12%). However, both changes were not significant. The increase in shoot weight was also less than reported in Alberton et al. (2005). The low above-ground plant response is mainly due to the low N availability. The experimental system
53
Chapter 3
(Petri dish) may not easily allow extrapolation of results into the field. However, this system, which achieves good control over humidity, light availability, temperature and CO2 level, has been successfully applied in several previous investigations (Ineichen & Wiemken, 1992; Ineichen et al., 1995; Fransson et al., 2007).
In conclusion, fungal sink strength for N, together with low N availability in a restricted growth medium constrained plant growth especially with fungal species with the largest mycelial size. In an experiment where nutrients were not limiting, elevated CO2 resulted both in a rapid positive response by ECM fungi and in an increase in photosynthetic performance by pine seedlings (Fransson et al., 2007). In nutrient-constrained systems, elevated CO2 will increase allocation belowground (to mycorrhizal fungi and roots) and enhance nutrient immobilization by mycorrhizal fungi. However, increased immobilization lowers plant N concentration and hence restricts the plant’s ability to respond to this elevated CO2. Mycelial sink strength then generates negative feedback to plant growth under elevated CO2, as predicted by the PNL hypothesis. If ecosystems are generally ‘saturated’ (O’Neill, 1994) with respect to ECM fungi, calculating the optimal mycelium size, using modeling approaches, taking into consideration soil properties and hyphal distribution in soil is an important challenge.
Acknowledgements This study was funded by the C.T. de Wit Graduate School for Production Ecology and Resource Conservation (PE&RC) of Wageningen University and Research Centre, the Netherlands. Constructive comments by two anonymous reviewers on an earlier version of the manuscript are gratefully acknowledged.
54
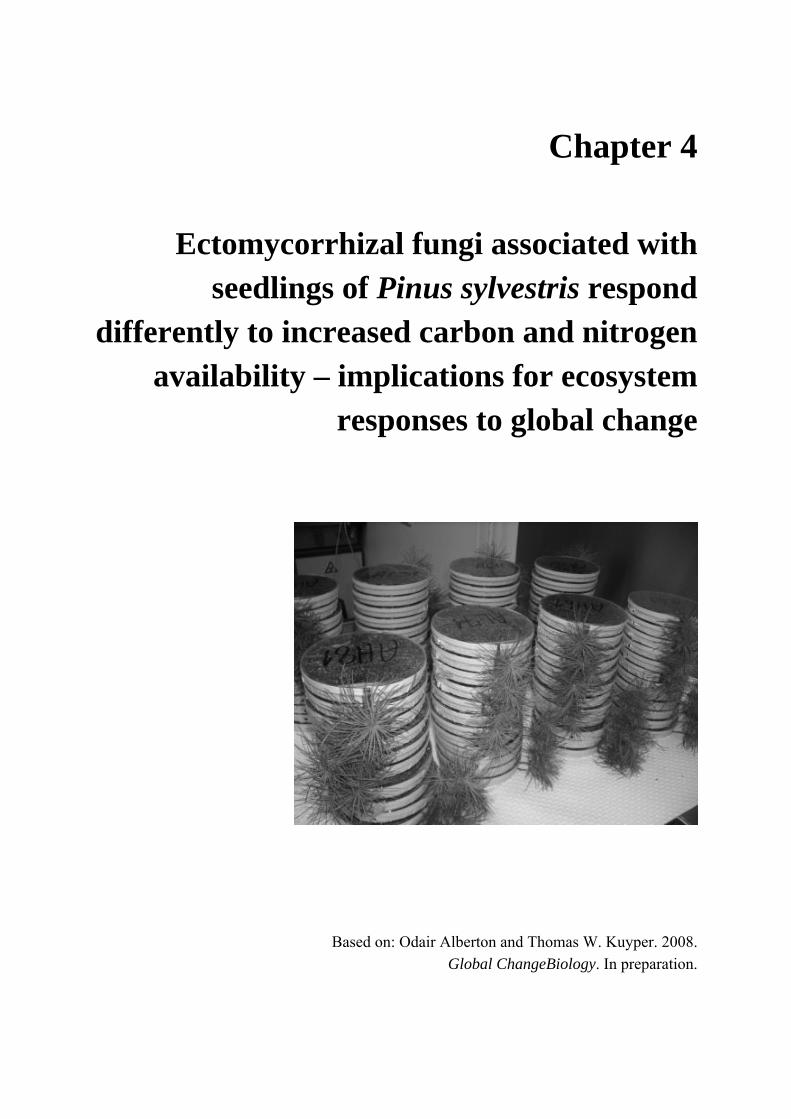
Chapter 4
Ectomycorrhizal fungi associated with seedlings of Pinus sylvestris respond
differently to increased carbon and nitrogen availability – implications for ecosystem
responses to global change
Based on: Odair Alberton and Thomas W. Kuyper. 2008. Global ChangeBiology. In preparation.
Chapter 4
Abstract The ectomycorrhizal (ECM) symbiosis can cause both positive and negative feedback with trees under elevated CO2. Positive feedback arises if the additional carbon (C) increases nutrient uptake by the fungus and nutrient transfer to the plant, whereas negative feedback results from enhanced competition for nitrogen (N). Because species of ECM fungi differ in their C and N demand, understanding fungal species-specific responses to variation in C and N supply is therefore essential to predict impacts of global change. We investigated fungal species-specific responses of ECM Scots pine (Pinus sylvestris) seedlings under ambient and elevated CO2 (350 or 700 µl l–1 CO2) and under low and high mineral N availability. Each seedling was associated with one of the following ECM species: Hebeloma cylindrosporum, Laccaria bicolor and Suillus bovinus. Non-mycorrhizal controls were included. Each treatment contained six replicates. The experiment lasted 103 days. During the final 27 days, seedlings were labeled with 14CO2 and 15N. Most plant and fungal parameters were significantly affected by fungal species, CO2 level and N supply. Interactions between these factors were also regularly significant. At low N availability, elevated CO2 had the smallest impact on the photosynthetic performance of seedlings inoculated with H. cylindrosporum. At ambient CO2, increasing N supply had the smallest impact on seedlings inoculated with S. bovinus and the largest on seedlings inoculated with H. cylindrosporum. At low N availability, extraradical hyphal length increased after doubling CO2 level, but at ambient CO2, increasing N levels reduced hyphal length for both H. cylindrosporum and S. bovinus, but not for L. bicolor. We discuss the potential interplay of two major elements of global change, elevated CO2 and increased N availability, and their effects on plant growth. We conclude that increased N supply potentially relieved mycorrhiza-induced progressive N limitation under elevated CO2. Key words: carbon and nitrogen allocation; ectomycorrhizal fungi; elevated CO2; extraradical hyphae; global change; mycocentric; N immobilization; Pinus sylvestris; progressive nitrogen limitation
56
Ectomycorrhizal fungi and global change
Introduction The rising CO2 in the atmosphere will affect plant performance, which could cause both negative and positive feedbacks to atmospheric CO2 levels. Under normal conditions, almost all plants are mycorrhizal, i.e. their roots associate with mutualistic fungi. It is therefore of interest how these mycorrhizal fungi (co-)determine plant responses to elevated CO2. Positive feedback occurs if elevated CO2 releases the fungi from C-limitation, leading to an extension of the fungal mycelium (its nutrient acquiring structure) and enhanced nutrient capture. Negative feedback could occur if the ecosystem is ‘saturated’ (O’Neill, 1994) with mycorrhizal mycelium, so that interhyphal distances are so small as to result in almost complete overlap of the depletion zones. Uptake would then be limited by the rate at which nutrients are becoming available through decomposition of organic matter and mineralization of nutrients. Under such conditions the expanding mycelium could immobilize more nutrients (especially N), leading to mycorrhiza-induced progressive nitrogen limitation (PNL) (Luo et al., 2004; Hu et al., 2006; Alberton et al., 2007). This latter outcome can be expected if plant and fungal responses are not fully coordinated, i.e. when the fungal response to elevated CO2 is larger than the plant’s response. In a meta-analysis Alberton et al. (2005) showed that doubling atmospheric CO2 concentration led to an average increase by 45% of the ectomycorrhizal (ECM) fungus and by 26% of the ECM plant, thereby generating conditions for negative feedback.
A decrease in nutrient availability may not only constrain plant responses; it may also reduce the carbon (C) use efficiency of fungi. As a consequence the mycorrhizal fungus will ‘waste’ the additional CO2 in respiration (Gorissen & Kuyper, 2000). This latter possibility was recently confirmed in a field study by Heinemeyer et al. (2007), who proposed the concept of a CO2 overflow tap through which mycorrhizal fungi directly return the additional C to the atmosphere.
Mycorrhiza-induced PNL is both an effect of the ecosystem N supply rate and of the species composition of the mycorrhizal assemblage. In a meta-analysis of mycorrhizal plant and fungal responses to elevated CO2, Alberton et al. (2005) provided evidence that fungal identity mattered from the plant’s perspective. Plants colonized by an ECM assemblage responded more strongly to elevated CO2 than plants colonized by one mycorrhizal fungus (an increase of 39% versus 16% – a significant difference). Despite a large interest in the ways in which different ECM fungi respond to N availability and can be classified along the continuum from nitrophobic to nitrotolerant (Baar et al., 1997; Gorissen & Kuyper, 2000; Lilleskov et al., 2001, 2002; Cudlin et al., 2007; Fransson et al., 2007), the interaction between increased C and N availability for different ECM fungi has received only little attention.
57
Chapter 4
The present study expands on an earlier study by Alberton et al. (2007) with the objectives to investigate responses of ECM Scots pine (Pinus sylvestris) seedlings and species-specific response of three different ECM fungi under two levels of CO2 availability (ambient and elevated) and at low and high levels of N supply. We hypothesized that (1) elevated CO2 will increase C allocation to the fungus; (2) enhanced allocation will increase nutrient immobilization in fungal tissue under low N availability; (3) larger nutrient immobilization in fungal tissue will show negative feedback to plant nutrient content and ultimately plant biomass; (4) under such conditions mycorrhizal presence may constrain plant responses to elevated CO2 under low N availability; (5) these effects will be strongest in species that produce the largest amount of fungal mycelium; (6) the competition for N between plant and fungi is alleviated by increasing N availability. In other words, this study sought for evidence of nutrient and C competition between ECM fungus and ECM plant in order to improve our understanding of ECM functioning under scenarios of global change.
Materials and Methods Plant, fungi and substrate Seeds of Scots pine, purchased from PVM Grubbenvorst, The Netherlands, were soaked in demineralized water overnight, and then surface-sterilized during 30 min in a 30% H2O2-solution containing a drop of Tween 20. The surface-sterilized seeds were germinated on sterile water agar media containing 5 g l–1 of glucose. After three weeks germination on water agar, each seedling was transferred to a Petri dish (Ø 14.5 cm), filled with 50 g of a sterilized (1 h at 110oC) peat-vermiculite mixture (2:5, w/w). The mixture contained 29.9 mg kg–1 of available mineral N and 1.4 mg kg–1 of available P. The peat-vermiculite mixture was moistened with 50 ml of full-strength modified Melin-Norkrans (MMN) solution (without agar, glucose and malt extract) at the start of the experiment. MMN solution was used to ensure that both inoculated and uninoculated treatments were solely limited by N (and not by P), and to prevent a decrease in pH due the ammonium-N uptake during the experiment (Kamminga-van Wijk & Prins, 1989). During the first 76 days, we added twice 38 ml of MMN. Just before the start of the 14C-labeling we added 40 ml of MMN with (15NH4)2HPO4 at 5% 15N (corresponding with 2.1 mg N in the low N treatment and 4.2 mg N in the high N treatment). This labeling with 14C and 15N during the final four weeks allowed us to separate the net effect over the full experimental period of 103 days from the effect over the final 27 days. In total 8.7 mg N (low N) and 17.5 mg N (high N), and 30 mg P (low N) and 40 mg P (high N) were added to each Petri dish.
58
Ectomycorrhizal fungi and global change
Each seedling was inoculated around the root system with 12 plugs of actively growing mycelium of one of the following ECM species: Hebeloma cylindrosporum (CBS 558.96, provided by Centraalbureau voor Schimmelcultures CBS, Utrecht, The Netherlands), Laccaria bicolor and Suillus bovinus. A non-mycorrhizal control treatment was also included. The isolates of L. bicolor and S. bovinus were isolated from fruitbodies collected in the surroundings of Harderwijk, The Netherlands, in 2004 (Alberton et al., 2007). Laccaria bicolor is a nitrotolerant (or nitrophilic) species and S. bovinus is nitrophobic (Gorissen & Kuyper, 2000; Fransson et al., 2007). Hebeloma cylindrosporum had large sink strength for N in a previous experiment (Alberton et al., 2007) and can also be listed as nitrotolerant (Conjeaud et al., 1996; Plassard et al., 2000).
The addition of MMN solution to the experimental system and the set up of the trap for below-ground respiration were done as described by Alberton et al. (2007). Plant growth and experimental conditions The seedlings were placed into two growth chambers (one for each CO2 level) with a steady flow of either 350 or 700 µl l–1 CO2. Temperature was maintained at 20oC during the day (16 h and photosynthetic photon fluence rate (PPFR) of 250 µmol m–2 s–1) and at 16oC during the night (8 h), and relative humidity was kept around 70%. The Petri dishes were randomized every two weeks within each growth chamber. After 76 days, the Petri dishes were transferred to the Experimental Soil Plant Atmosphere System (ESPAS; Gorissen et al., 1996). The seedlings were exposed to 14CO2 atmosphere (specific radioactivity 0.15 ± 0.08 kBq mg–1 C) supplied from a pressurized cylinder for 27 days. The growth conditions (temperature, relative humidity, CO2 level) in the ESPAS were equal to those in the growth chambers, except for PPFR, which was 375 µmol m–2 s–1. Analyses All seedlings were harvested 27 days after 14C and 15N labeling started. Plants were removed from Petri dishes; shoots, roots and the peat-vermiculite mixture were separated and dried at 60oC for 48 h. These fractions were subsequently ground and analyzed for 14C content with the modified wet combustion method (Dalal, 1979). Plant material (30 mg) and peat-vermiculite (0.5 g) were digested in duplicate in 5 ml of a 10% (w/v) solution of K2Cr2O7 in a mixture of concentrated H2SO4 and H3PO4 (3:2, v/v) at 160°C for 2 h. The 14CO2 evolved was trapped in 10 ml of 0.5 M NaOH. The 14C was determined in 0.5 ml of NaOH by liquid scintillation counting (Tri-Carb 2100TR; Packard) using 3 ml of Ultima Gold (Packard).
The soda-lime containing the below-ground respired 14CO2 was transferred to bottles (0.5 l) and dissolved in 50 ml excess 6 M HCl, injected through a septum in the lid. The 14CO2
59
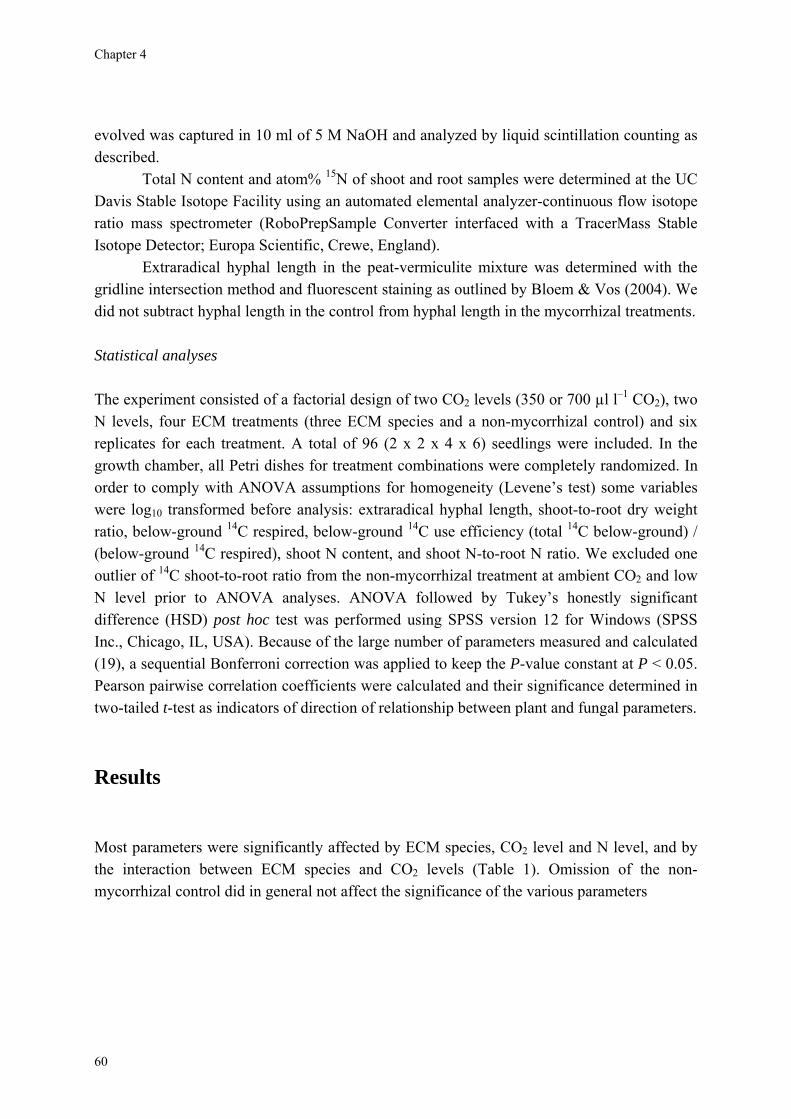
Chapter 4
60
evolved was captured in 10 ml of 5 M NaOH and analyzed by liquid scintillation counting as described.
Total N content and atom% 15N of shoot and root samples were determined at the UC Davis Stable Isotope Facility using an automated elemental analyzer-continuous flow isotope ratio mass spectrometer (RoboPrepSample Converter interfaced with a TracerMass Stable Isotope Detector; Europa Scientific, Crewe, England).
Extraradical hyphal length in the peat-vermiculite mixture was determined with the gridline intersection method and fluorescent staining as outlined by Bloem & Vos (2004). We did not subtract hyphal length in the control from hyphal length in the mycorrhizal treatments. Statistical analyses The experiment consisted of a factorial design of two CO2 levels (350 or 700 µl l–1 CO2), two N levels, four ECM treatments (three ECM species and a non-mycorrhizal control) and six replicates for each treatment. A total of 96 (2 x 2 x 4 x 6) seedlings were included. In the growth chamber, all Petri dishes for treatment combinations were completely randomized. In order to comply with ANOVA assumptions for homogeneity (Levene’s test) some variables were log10 transformed before analysis: extraradical hyphal length, shoot-to-root dry weight ratio, below-ground 14C respired, below-ground 14C use efficiency (total 14C below-ground) / (below-ground 14C respired), shoot N content, and shoot N-to-root N ratio. We excluded one outlier of 14C shoot-to-root ratio from the non-mycorrhizal treatment at ambient CO2 and low N level prior to ANOVA analyses. ANOVA followed by Tukey’s honestly significant difference (HSD) post hoc test was performed using SPSS version 12 for Windows (SPSS Inc., Chicago, IL, USA). Because of the large number of parameters measured and calculated (19), a sequential Bonferroni correction was applied to keep the P-value constant at P < 0.05. Pearson pairwise correlation coefficients were calculated and their significance determined in two-tailed t-test as indicators of direction of relationship between plant and fungal parameters.
Results Most parameters were significantly affected by ECM species, CO2 level and N level, and by the interaction between ECM species and CO2 levels (Table 1). Omission of the non-mycorrhizal control did in general not affect the significance of the various parameters
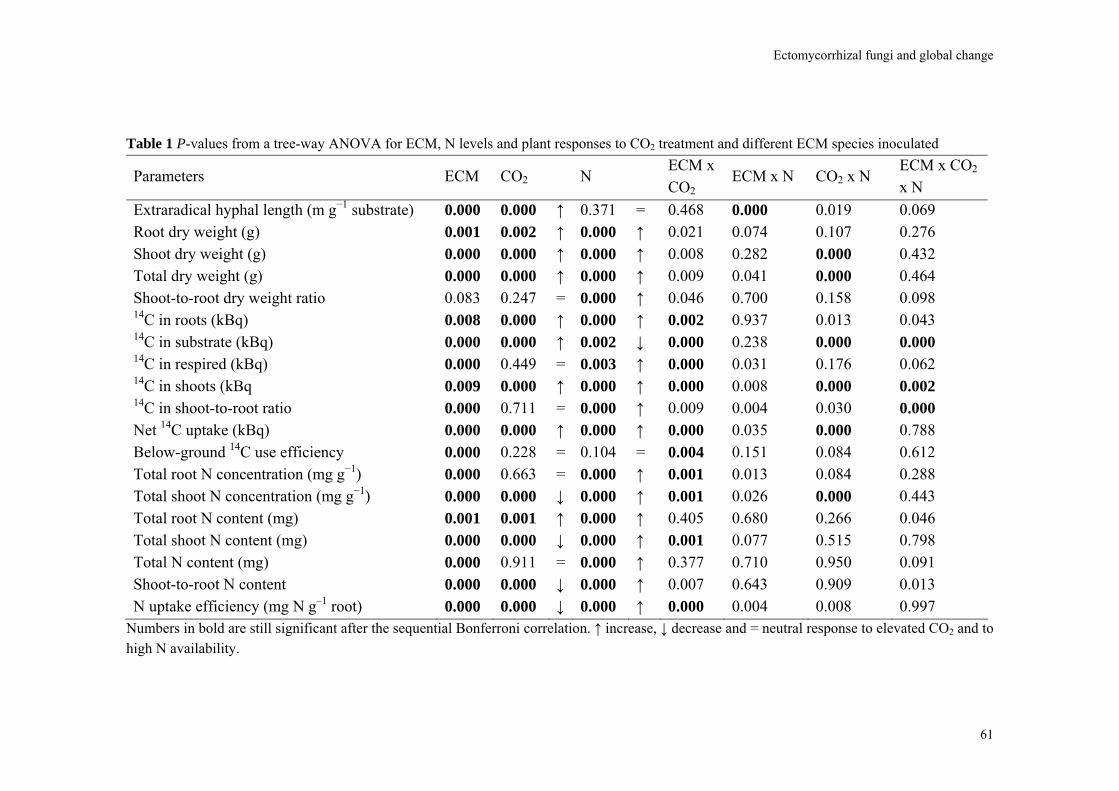
Ectomycorrhizal fungi and global change
61
Table 1 P-values from a tree-way ANOVA for ECM, N levels and plant responses to CO2 treatment and different ECM species inoculated
Parameters ECM CO2 N ECM x CO2
ECM x N CO2 x N ECM x CO2 x N
Extraradical hyphal length (m g−1 substrate) 0.000 0.000 ↑ 0.371 = 0.468 0.000 0.019 0.069 Root dry weight (g) 0.001 0.002 ↑ 0.000 ↑ 0.021 0.074 0.107 0.276 Shoot dry weight (g) 0.000 0.000 ↑ 0.000 ↑ 0.008 0.282 0.000 0.432 Total dry weight (g) 0.000 0.000 ↑ 0.000 ↑ 0.009 0.041 0.000 0.464 Shoot-to-root dry weight ratio 0.083 0.247 = 0.000 ↑ 0.046 0.700 0.158 0.098 14C in roots (kBq) 0.008 0.000 ↑ 0.000 ↑ 0.002 0.937 0.013 0.043 14C in substrate (kBq) 0.000 0.000 ↑ 0.002 ↓ 0.000 0.238 0.000 0.000 14C in respired (kBq) 0.000 0.449 = 0.003 ↑ 0.000 0.031 0.176 0.062 14C in shoots (kBq 0.009 0.000 ↑ 0.000 ↑ 0.000 0.008 0.000 0.002 14C in shoot-to-root ratio 0.000 0.711 = 0.000 ↑ 0.009 0.004 0.030 0.000 Net 14C uptake (kBq) 0.000 0.000 ↑ 0.000 ↑ 0.000 0.035 0.000 0.788 Below-ground 14C use efficiency 0.000 0.228 = 0.104 = 0.004 0.151 0.084 0.612 Total root N concentration (mg g−1) 0.000 0.663 = 0.000 ↑ 0.001 0.013 0.084 0.288 Total shoot N concentration (mg g−1) 0.000 0.000 ↓ 0.000 ↑ 0.001 0.026 0.000 0.443 Total root N content (mg) 0.001 0.001 ↑ 0.000 ↑ 0.405 0.680 0.266 0.046 Total shoot N content (mg) 0.000 0.000 ↓ 0.000 ↑ 0.001 0.077 0.515 0.798 Total N content (mg) 0.000 0.911 = 0.000 ↑ 0.377 0.710 0.950 0.091 Shoot-to-root N content 0.000 0.000 ↓ 0.000 ↑ 0.007 0.643 0.909 0.013 N uptake efficiency (mg N g–1 root) 0.000 0.000 ↓ 0.000 ↑ 0.000 0.004 0.008 0.997
Numbers in bold are still significant after the sequential Bonferroni correlation. ↑ increase, ↓ decrease and = neutral response to elevated CO2 and to high N availability.
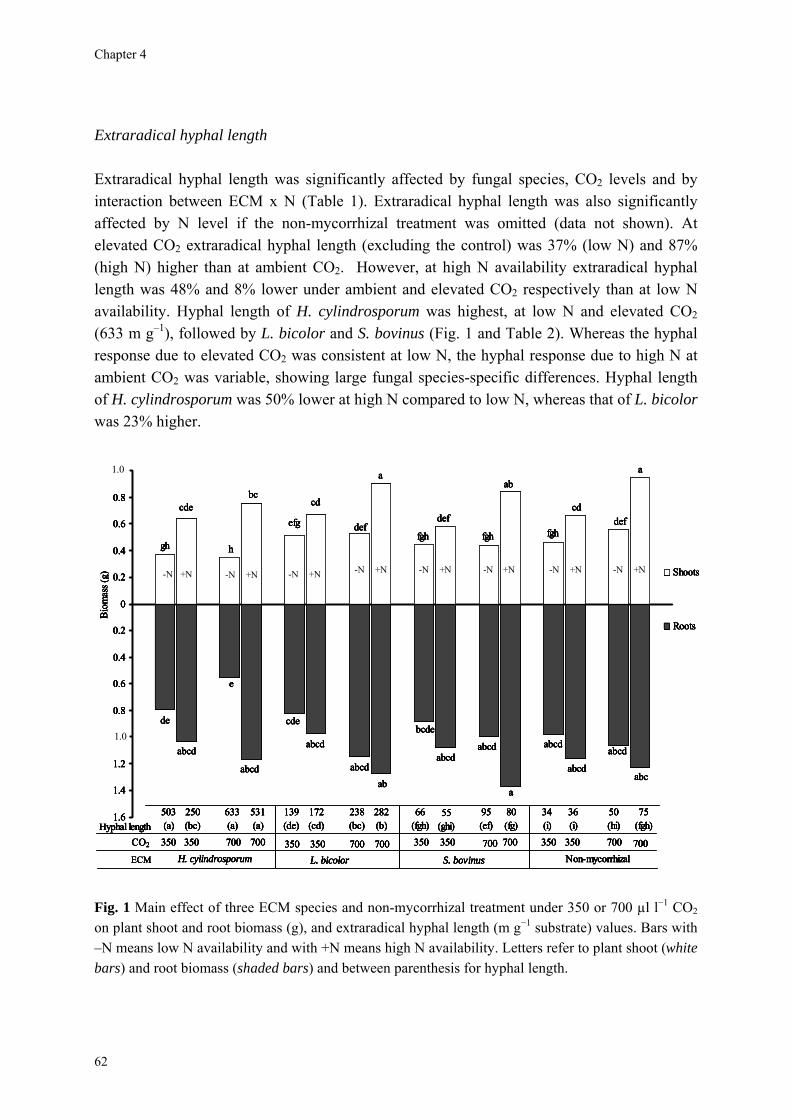
Chapter 4
62
Extraradical hyphal length Extraradical hyphal length was significantly affected by fungal species, CO2 levels and by interaction between ECM x N (Table 1). Extraradical hyphal length was also significantly affected by N level if the non-mycorrhizal treatment was omitted (data not shown). At elevated CO2 extraradical hyphal length (excluding the control) was 37% (low N) and 87% (high N) higher than at ambient CO2. However, at high N availability extraradical hyphal length was 48% and 8% lower under ambient and elevated CO2 respectively than at low N availability. Hyphal length of H. cylindrosporum was highest, at low N and elevated CO2 (633 m g–1), followed by L. bicolor and S. bovinus (Fig. 1 and Table 2). Whereas the hyphal response due to elevated CO2 was consistent at low N, the hyphal response due to high N at ambient CO2 was variable, showing large fungal species-specific differences. Hyphal length of H. cylindrosporum was 50% lower at high N compared to low N, whereas that of L. bicolor was 23% higher.
-1.6
-1.4
-1.2
-1
-0.8
-0.6
-0.4
-0.2
0
0.2
0.4
0.6
0.8
1
Shoots
Roots
fgh
ab
fgh
cddef
dabcd abcd
abcd
abca
abcd
700 700 350 350 700 700 bovinus Non-mycorrhizal
gh h
cdebc
efg
cd
def
a
fgh
def
de
abcd
e
abcd
cde
abcd
abcdab
bcde
abc
350 350 700 700 350 350 700 700 350 350H. cylindrosporum L. bicolor S.
Bio
mas
s (g)
…...
CO2
1.0
Hyphal length503(a)
250 (bc)
633 (a)
531 (a)
139 (de)
172 (cd)
238(bc)
282(b)
66(fgh)
55(ghi
-N +N-N +N -N +N -N +N -N +N
)95(ef)
80(fg)
34(i)
36(i)
50(hi)
75 (fgh)
-N +N -N +N -N +N
1.0 a
ECM
-1.6
-1.4
-1.2
-1
-0.8
-0.6
-0.4
-0.2
0
0.2
0.4
0.6
0.8
1
Shoots
Roots
fgh
ab
fgh
cddef
dabcd abcd
abcd
abca
abcd
700 700 350 350 700 700 bovinus Non-mycorrhizal
gh h
cdebc
efg
cd
def
a
fgh
def
de
abcd
e
abcd
cde
abcd
abcdab
bcde
abc
350 350 700 700 350 350 700 700 350 350H. cylindrosporum L. bicolor S.
Bio
mas
s (g)
…...
CO2
1.0
Hyphal length503(a)
250 (bc)
633 (a)
531 (a)
139 (de)
172 (cd)
238(bc)
282(b)
66(fgh)
55(ghi
-N +N-N +N -N +N -N +N -N +N
)95(ef)
80(fg)
34(i)
36(i)
50(hi)
75 (fgh)
-N +N -N +N -N +N
1.0 a
ECM
Fig. 1 Main effect of three ECM species and non-mycorrhizal treatment under 350 or 700 µl l−1 CO2 on plant shoot and root biomass (g), and extraradical hyphal length (m g−1 substrate) values. Bars with –N means low N availability and with +N means high N availability. Letters refer to plant shoot (white bars) and root biomass (shaded bars) and between parenthesis for hyphal length.

Ectomycorrhizal fungi and global change
63
Table 2 Extraradical hyphal length (m g−1 substrate) and seedlings biomass (g) responses to fungal species, CO2 levels (μl l−1) and N levels Fungal species CO2 N Hyphal length Shoot dry weight Root dry weight Total dry weight Shoot-to-root ratio
350 Low 503 ± 37 a 0.37 ± 0.05 gh 0.79 ± 0.14 de 1.16 ± 0.13 ef 0.49 ± 0.17 bc 350 High 250 ± 32 bc 0.64 ± 0.06 cde 1.03 ± 0.12 abcd 1.67 ± 0.14 bcd 0.63 ± 0.09 abc 700 Low 633 ± 46 a 0.35 ± 0.04 h 0.56 ± 0.23 e 0.91 ± 0.08 f 0.63 ± 0.09 abc
H. cylindrosporum
700 High 531 ± 56 a 0.74 ± 0.02 bc 1.17 ± 0.07 abcd 1.91 ± 0.07 ab 0.64 ± 0.05 abc 350 Low 139 ± 39 de 0.51 ± 0.06 efg 0.83 ± 0.18 cde 1.34 ± 0.22 def 0.64 ± 0.13 abc 350 High 172 ± 39 cd 0.67 ± 0.09 cd 0.98 ± 0.25 abcd 1.65 ± 0.19 bcd 0.74 ± 0.29 ab 700 Low 238 ± 76 bc 0.53 ± 0.04 def 1.14 ± 0.21 abcd 1.67 ± 0.23 bcd 0.47 ± 0.08 bc
L. bicolor
700 High 282 ± 75 b 0.90 ± 0.15 a 1.27 ± 0.36 ab 2.17 ± 0.44 a 0.74 ± 0.19 ab 350 Low 66 ± 15 fgh 0.44 ± 0.07 fgh 0.88 ± 0.18 bcde 1.32 ± 0.19 def 0.52 ± 0.14 abc 350 High 55 ± 7 ghi 0.58 ± 0.07 def 1.07 ± 0.25 abcd 1.65 ± 0.28 bcd 0.57 ± 0.17 abc 700 Low 95 ± 16 ef 0.44 ± 0.06 fgh 0.99 ± 0.23 abcd 1.43 ± 0.26 cde 0.46 ± 0.09 c
S. bovinus
700 High 80 ± 15 fg 0.84 ± 0.09 ab 1.37 ± 0.24 a 2.21 ± 0.29 a 0.62 ± 0.09 abc 350 Low 34 ± 9 i 0.46 ± 0.04 fgh 0.98 ± 0.24 abcd 1.44 ± 0.24 cde 0.49 ± 0.13 bc 350 High 36 ± 9 i 0.66 ± 0.06 cd 1.16 ± 0.18 abcd 1.82 ± 0.12 abc 0.59 ± 0.15 abc 700 Low 50 ± 14 hi 0.55 ± 0.04 def 1.06 ± 0.16 abcd 1.61 ± 0.20 bcd 0.53 ± 0.05 abc
Non-mycorrhizal
700 High 75 ± 13 fgh 0.94 ± 0.08 a 1.23 ± 0.17 abc 2.17 ± 0.21 a 0.78 ± 0.13 a Mean values ± SD are shown. Means within a column followed by different letters are significantly different.
Chapter 4
Plant carbon gain Plant biomass was significantly affected by fungal species, CO2 and N level (Table 2). Shoot and total dry weight were also significantly affected by the interaction between CO2 and N. Averaged cross the three ECM fungal treatments, shoot and root dry biomass increased by 32% and 23% respectively after doubling CO2 and at high N supply. At low N availability, doubling CO2 levels did not increase plant biomass. At ambient CO2, increasing N supply resulted in a higher shoot and root biomass (43% and 24% respectively). At elevated CO2, the high N supply resulted in an increase of 89% and 41% for shoot and root biomass. At low N supply plant response to elevated CO2 was highly fungal species-specific, ranging from a substantial decrease in plant biomass (21%) in seedlings inoculated with the nitrotolerant H. cylindrosporum to a small increase (8%) in seedlings inoculated with the nitrophobic S. bovinus. At high N supply all seedlings responded similarly positively to elevated CO2 (Fig. 1 and Table 2). In general, C availability (CO2 level) had a stronger effect on root than on shoot biomass (hence shoot-to-root ratios declined) whereas N availability showed the opposite effect (hence shoot-to-root ratios increased) (Table 2).
The 14C activity in shoots, roots and substrate were significantly affected by fungal species, CO2 and N levels (Table 1). Moreover, 14C in shoots was significantly affected by all interactions, except between ECM and N. Activity of 14C in shoots and roots were two to three times larger at high N supply than at low N supply. Elevated CO2 increased 14C in shoots and roots only under high N supply, on average by 28%. The shoot-to-root dry weight ratio was often lower than 14C in shoot-to-root ratio, especially in situations of high N supply, indicating that in the final weeks of the experiment a larger amount of C assimilated was kept in the shoot. At high N supply, seedlings inoculated with H. cylindrosporum did not respond to elevated CO2, whereas seedlings inoculated with the other fungal species showed increased 14C incorporation in shoots and/or roots (Table 3).
The 14C activity in the substrate was significantly affected by fungal species, CO2, N levels and also by all interactions except between ECM and N (Table 1). Under ambient CO2, 14C in substrate was 67% lower under high N supply compared to low N supply; at elevated CO2, N supply did not affect 14C activity in the substrate. Inoculation with H. cylindrosporum and L. bicolor resulted in significantly more 14C in the substrate than inoculation with S. bovinus. The 14C in substrate was positively correlated with extraradical hyphal length (Fig. 2; r = 0.57; n = 12; P < 0.052).
Below-ground 14C respiration was significantly affected by ECM, N levels and by the interaction between ECM and CO2 (Table 1). At high N supply, below-ground 14C respiration was 24% higher than low N supply. Seedlings inoculated with H. cylindrosporum and S. bovinus respired significantly more 14C below-ground (21% of total 14C assimilated) than seedlings inoculated with L. bicolor (14%) and non-mycorrhizal seedlings (9%) seedlings
64
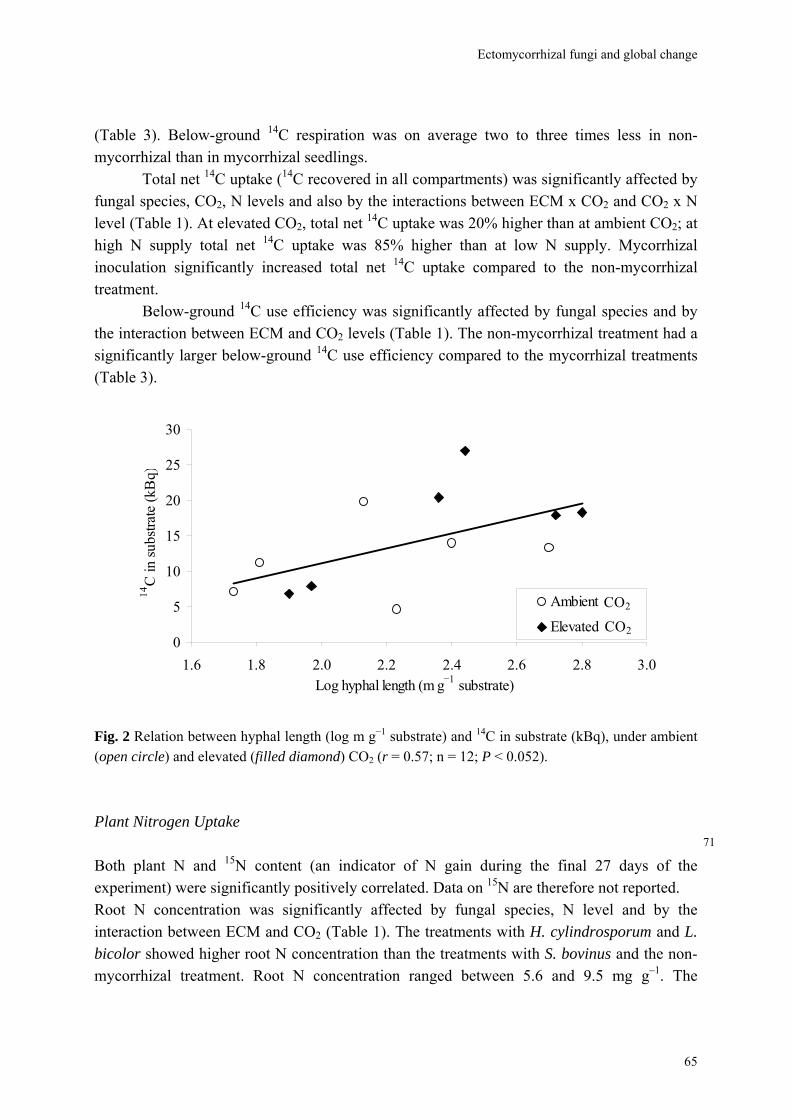
Ectomycorrhizal fungi and global change
(Table 3). Below-ground 14C respiration was on average two to three times less in non-mycorrhizal than in mycorrhizal seedlings.
Total net 14C uptake (14C recovered in all compartments) was significantly affected by fungal species, CO2, N levels and also by the interactions between ECM x CO2 and CO2 x N level (Table 1). At elevated CO2, total net 14C uptake was 20% higher than at ambient CO2; at high N supply total net 14C uptake was 85% higher than at low N supply. Mycorrhizal inoculation significantly increased total net 14C uptake compared to the non-mycorrhizal treatment.
Below-ground 14C use efficiency was significantly affected by fungal species and by the interaction between ECM and CO2 levels (Table 1). The non-mycorrhizal treatment had a significantly larger below-ground 14C use efficiency compared to the mycorrhizal treatments (Table 3).
0
5
10
15
20
25
30
1.6 1.8 2.0 2.2 2.4 2.6 2.8 3.0Log hyphal length (m g−1 substrate)
14C
in su
bstra
te (k
Bq)
Ambient CO2
Elevated CO2CO2
CO2
Fig. 2 Relation between hyphal length (log m g−1 substrate) and 14C in substrate (kBq), under ambient (open circle) and elevated (filled diamond) CO2 (r = 0.57; n = 12; P < 0.052). Plant Nitrogen Uptake Both plant N and 15N content (an indicator of N gain during the final 27 days of the experiment) were significantly positively correlated. Data on 15N are therefore not reported.
71
Root N concentration was significantly affected by fungal species, N level and by the interaction between ECM and CO2 (Table 1). The treatments with H. cylindrosporum and L. bicolor showed higher root N concentration than the treatments with S. bovinus and the non-mycorrhizal treatment. Root N concentration ranged between 5.6 and 9.5 mg g–1. The
65
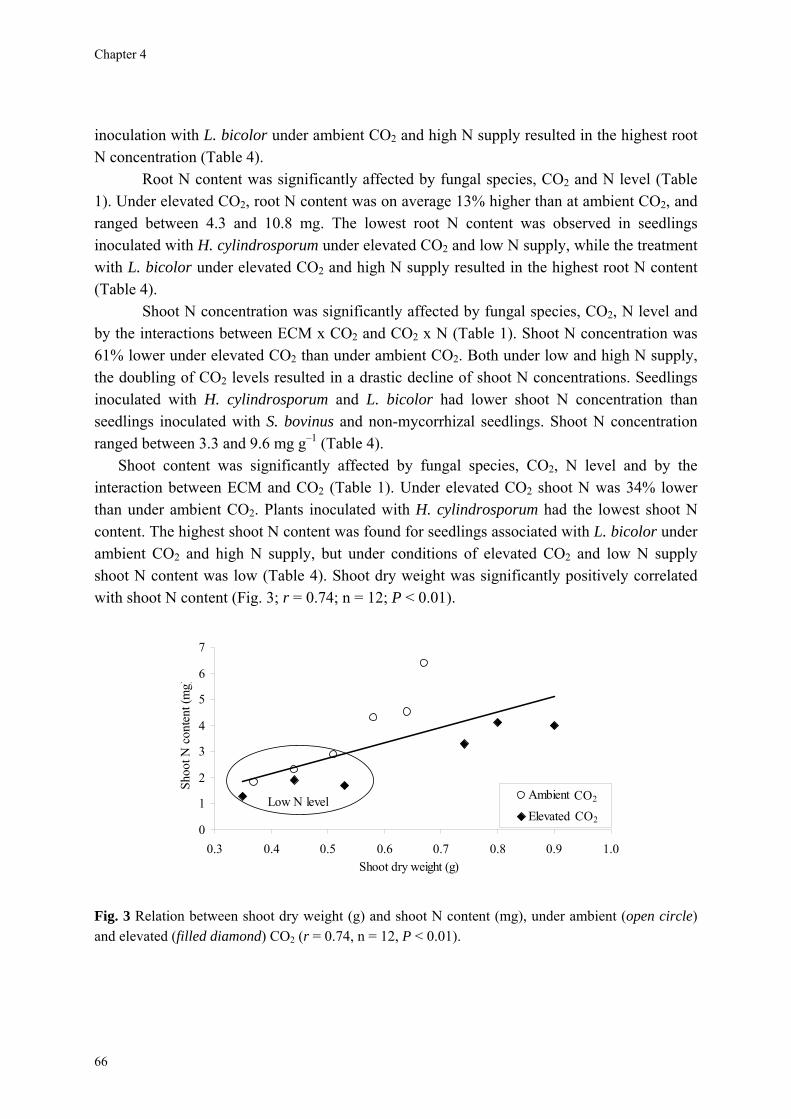
Chapter 4
inoculation with L. bicolor under ambient CO2 and high N supply resulted in the highest root N concentration (Table 4).
Root N content was significantly affected by fungal species, CO2 and N level (Table 1). Under elevated CO2, root N content was on average 13% higher than at ambient CO2, and ranged between 4.3 and 10.8 mg. The lowest root N content was observed in seedlings inoculated with H. cylindrosporum under elevated CO2 and low N supply, while the treatment with L. bicolor under elevated CO2 and high N supply resulted in the highest root N content (Table 4).
Shoot N concentration was significantly affected by fungal species, CO2, N level and by the interactions between ECM x CO2 and CO2 x N (Table 1). Shoot N concentration was 61% lower under elevated CO2 than under ambient CO2. Both under low and high N supply, the doubling of CO2 levels resulted in a drastic decline of shoot N concentrations. Seedlings inoculated with H. cylindrosporum and L. bicolor had lower shoot N concentration than seedlings inoculated with S. bovinus and non-mycorrhizal seedlings. Shoot N concentration ranged between 3.3 and 9.6 mg g–1 (Table 4).
Shoot content was significantly affected by fungal species, CO2, N level and by the interaction between ECM and CO2 (Table 1). Under elevated CO2 shoot N was 34% lower than under ambient CO2. Plants inoculated with H. cylindrosporum had the lowest shoot N content. The highest shoot N content was found for seedlings associated with L. bicolor under ambient CO2 and high N supply, but under conditions of elevated CO2 and low N supply shoot N content was low (Table 4). Shoot dry weight was significantly positively correlated with shoot N content (Fig. 3; r = 0.74; n = 12; P < 0.01).
0
1
2
3
4
5
6
7
0.3 0.4 0.5 0.6 0.7 0.8 0.9 1.0Shoot dry weight (g)
Shoo
t N c
onte
nt (m
g)
Ambient CO2
Elevated CO2CO2
CO2
Low N level
Fig. 3 Relation between shoot dry weight (g) and shoot N content (mg), under ambient (open circle) and elevated (filled diamond) CO2 (r = 0.74, n = 12, P < 0.01).
66
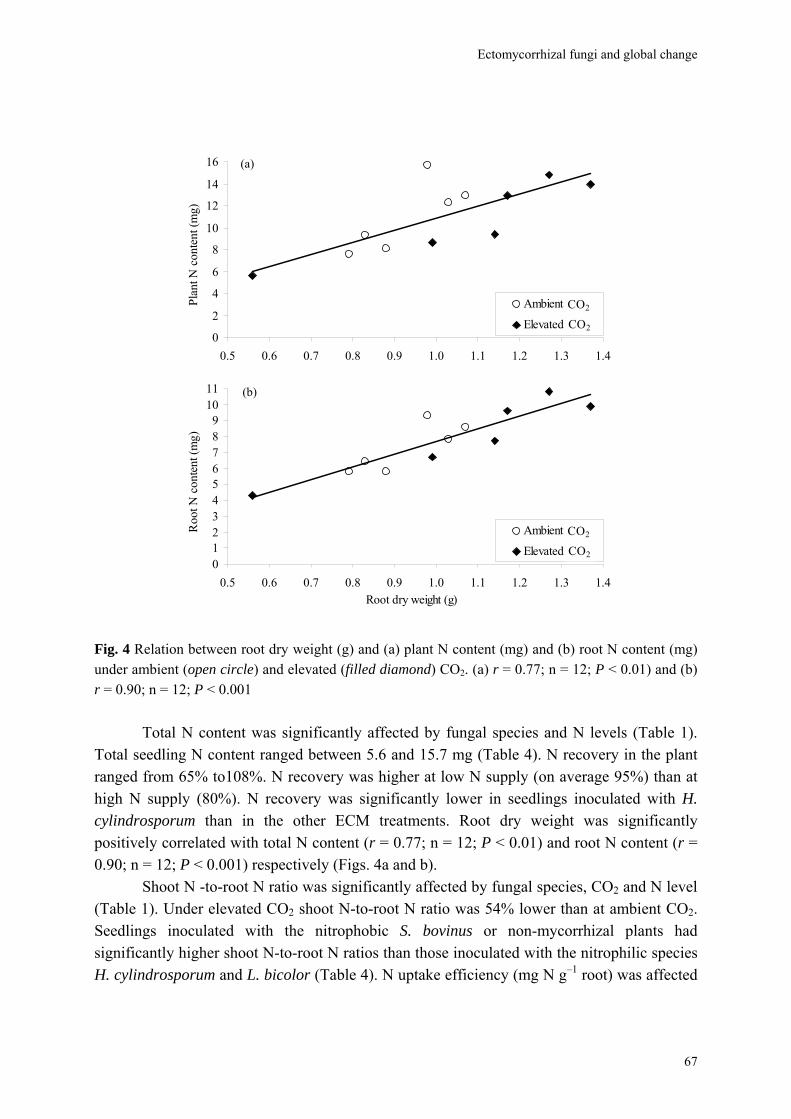
Ectomycorrhizal fungi and global change
0
2
4
6
8
10
12
14
16
0.5 0.6 0.7 0.8 0.9 1.0 1.1 1.2 1.3 1.4
Plan
t N c
onte
nt (m
g) …
.
Ambient CO2
Elevated CO2CO2
CO2
0123456789
1011
0.5 0.6 0.7 0.8 0.9 1.0 1.1 1.2 1.3 1.4Root dry weight (g)
Roo
t N c
onte
nt (m
g) …
.
Ambient CO2
Elevated CO2CO2
CO2
(a)
(b)
Fig. 4 Relation between root dry weight (g) and (a) plant N content (mg) and (b) root N content (mg) under ambient (open circle) and elevated (filled diamond) CO2. (a) r = 0.77; n = 12; P < 0.01) and (b) r = 0.90; n = 12; P < 0.001
Total N content was significantly affected by fungal species and N levels (Table 1).
Total seedling N content ranged between 5.6 and 15.7 mg (Table 4). N recovery in the plant ranged from 65% to108%. N recovery was higher at low N supply (on average 95%) than at high N supply (80%). N recovery was significantly lower in seedlings inoculated with H. cylindrosporum than in the other ECM treatments. Root dry weight was significantly positively correlated with total N content (r = 0.77; n = 12; P < 0.01) and root N content (r = 0.90; n = 12; P < 0.001) respectively (Figs. 4a and b).
Shoot N -to-root N ratio was significantly affected by fungal species, CO2 and N level (Table 1). Under elevated CO2 shoot N-to-root N ratio was 54% lower than at ambient CO2. Seedlings inoculated with the nitrophobic S. bovinus or non-mycorrhizal plants had significantly higher shoot N-to-root N ratios than those inoculated with the nitrophilic species H. cylindrosporum and L. bicolor (Table 4). N uptake efficiency (mg N g–1 root) was affected
67
Chapter 4
68
by fungal species, CO2, N level and by the interactions between ECM x CO2 and ECM x N (Table 1). It ranged between 8.4 and 16.6 (Table 4). The N uptake efficiency of seedlings inoculated with L. bicolor under ambient CO2 and high N supply was twice as high as those in treatments with elevated CO2 and low N supply (Table 4).
Discussion Three ECM fungal species associated with Scots pine seedlings were tested for their species-specific responses to both C and N availability. Mycorrhizal plant and fungal responses to elevated CO2 are influenced by fungal identity and both responses are not always fully coordinated (Alberton et al., 2005). Fungal identity matters from a phytocentric perspective because fungi differ in their sink strength for C and N. Gorissen & Kuyper (2000) observed that the nitrophobic S. bovinus had a higher demand for C than the nitrophilic species L. bicolor, and that L. bicolor had a higher demand for N than S. bovinus. Therefore, the interaction between increased C and N availability, both drivers of global change, and their impact on the performance of different ECM fungi and the composition of ECM fungal assemblages (Fransson et al., 2001; Parrent et al., 2006; Parrent & Vilgalys, 2007) deserves more attention.
Extraradical hyphal length showed ECM fungal species-specific differences and was affected by CO2 level and by the interaction between ECM species with N supply. Under elevated CO2 extraradical hyphal length was 37% (at low N supply) and 87% (at high N supply) higher than at ambient CO2. Increasing N availability decreased extraradical hyphal length of S. bovinus and H. cylindrosporum but increased hyphal length in L. bicolor by 23%. While the response to increased N for S. bovinus and L. bicolor fits with their classification as nitrophobic and nitrophilic, the response of H. cylindrosporum was more difficult to understand. It was the most effective competitor for N with the seedlings (lowest N content of seedlings, largest hyphal length) in both this experiment and in the experiment by Alberton et al. (2007), although it was also sensitive to N supply.
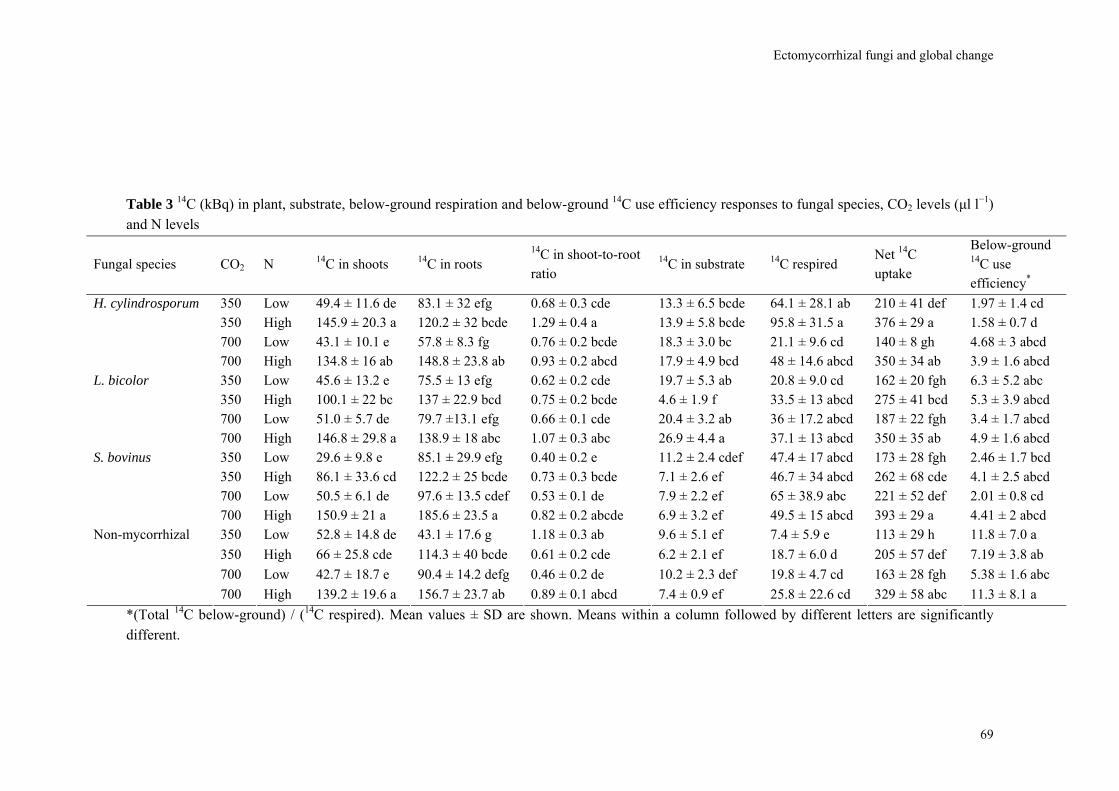
Ectomycorrhizal fungi and global change
Table 3 14C (kBq) in plant, substrate, below-ground respiration and below-ground 14C use efficiency responses to fungal species, CO2 levels (μl l−1) and N levels
Fungal species CO2 N 14C in shoots 14C in roots 14C in shoot-to-root ratio
14C in substrate 14C respired Net 14C uptake
Below-ground 14C use efficiency*
350 Low 49.4 ± 11.6 de 83.1 ± 32 efg 0.68 ± 0.3 cde 13.3 ± 6.5 bcde 64.1 ± 28.1 ab 210 ± 41 def 1.97 ± 1.4 cd 350 High 145.9 ± 20.3 a 120.2 ± 32 bcde 1.29 ± 0.4 a 13.9 ± 5.8 bcde 95.8 ± 31.5 a 376 ± 29 a 1.58 ± 0.7 d 700 Low 43.1 ± 10.1 e 57.8 ± 8.3 fg 0.76 ± 0.2 bcde 18.3 ± 3.0 bc 21.1 ± 9.6 cd 140 ± 8 gh 4.68 ± 3 abcd
H. cylindrosporum
700 High 134.8 ± 16 ab 148.8 ± 23.8 ab 0.93 ± 0.2 abcd 17.9 ± 4.9 bcd 48 ± 14.6 abcd 350 ± 34 ab 3.9 ± 1.6 abcd 350 Low 45.6 ± 13.2 e 75.5 ± 13 efg 0.62 ± 0.2 cde 19.7 ± 5.3 ab 20.8 ± 9.0 cd 162 ± 20 fgh 6.3 ± 5.2 abc 350 High 100.1 ± 22 bc 137 ± 22.9 bcd 0.75 ± 0.2 bcde 4.6 ± 1.9 f 33.5 ± 13 abcd 275 ± 41 bcd 5.3 ± 3.9 abcd 700 Low 51.0 ± 5.7 de 79.7 ±13.1 efg 0.66 ± 0.1 cde 20.4 ± 3.2 ab 36 ± 17.2 abcd 187 ± 22 fgh 3.4 ± 1.7 abcd
L. bicolor
700 High 146.8 ± 29.8 a 138.9 ± 18 abc 1.07 ± 0.3 abc 26.9 ± 4.4 a 37.1 ± 13 abcd 350 ± 35 ab 4.9 ± 1.6 abcd 350 Low 29.6 ± 9.8 e 85.1 ± 29.9 efg 0.40 ± 0.2 e 11.2 ± 2.4 cdef 47.4 ± 17 abcd 173 ± 28 fgh 2.46 ± 1.7 bcd 350 High 86.1 ± 33.6 cd 122.2 ± 25 bcde 0.73 ± 0.3 bcde 7.1 ± 2.6 ef 46.7 ± 34 abcd 262 ± 68 cde 4.1 ± 2.5 abcd 700 Low 50.5 ± 6.1 de 97.6 ± 13.5 cdef 0.53 ± 0.1 de 7.9 ± 2.2 ef 65 ± 38.9 abc 221 ± 52 def 2.01 ± 0.8 cd
S. bovinus
700 High 150.9 ± 21 a 185.6 ± 23.5 a 0.82 ± 0.2 abcde 6.9 ± 3.2 ef 49.5 ± 15 abcd 393 ± 29 a 4.41 ± 2 abcd 350 Low 52.8 ± 14.8 de 43.1 ± 17.6 g 1.18 ± 0.3 ab 9.6 ± 5.1 ef 7.4 ± 5.9 e 113 ± 29 h 11.8 ± 7.0 a 350 High 66 ± 25.8 cde 114.3 ± 40 bcde 0.61 ± 0.2 cde 6.2 ± 2.1 ef 18.7 ± 6.0 d 205 ± 57 def 7.19 ± 3.8 ab 700 Low 42.7 ± 18.7 e 90.4 ± 14.2 defg 0.46 ± 0.2 de 10.2 ± 2.3 def 19.8 ± 4.7 cd 163 ± 28 fgh 5.38 ± 1.6 abc
Non-mycorrhizal
700 High 139.2 ± 19.6 a 156.7 ± 23.7 ab 0.89 ± 0.1 abcd 7.4 ± 0.9 ef 25.8 ± 22.6 cd 329 ± 58 abc 11.3 ± 8.1 a *(Total 14C below-ground) / (14C respired). Mean values ± SD are shown. Means within a column followed by different letters are significantly different.
69
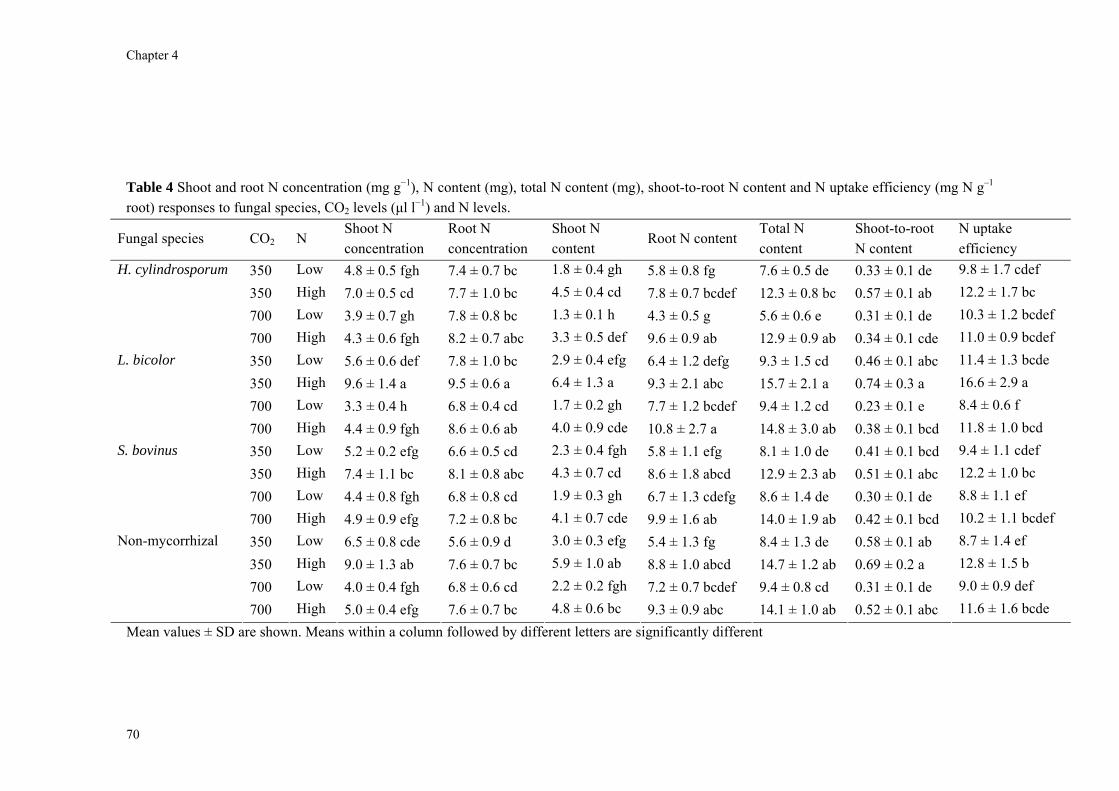
Ch
70
Fungal species CO2 N Shoot N concentration
Root N concentration
Shoot N content
Root N content Total N content
Shoot-to-root N content
N uptake efficiency
350 Low 4.8 ± 0.5 fgh 7.4 ± 0.7 bc 1.8 ± 0.4 gh 5.8 ± 0.8 fg 7.6 ± 0.5 de 0.33 ± 0.1 de 9.8 ± 1.7 cdef 350 High 7.0 ± 0.5 cd 7.7 ± 1.0 bc 4.5 ± 0.4 cd 7.8 ± 0.7 bcdef 12.3 ± 0.8 bc 0.57 ± 0.1 ab 12.2 ± 1.7 bc 700 Low 3.9 ± 0.7 gh 7.8 ± 0.8 bc 1.3 ± 0.1 h 4.3 ± 0.5 g 5.6 ± 0.6 e 0.31 ± 0.1 de 10.3 ± 1.2 bcdef
H. cylindrosporum
700 High 4.3 ± 0.6 fgh 8.2 ± 0.7 abc 3.3 ± 0.5 def 9.6 ± 0.9 ab 12.9 ± 0.9 ab 0.34 ± 0.1 cde 11.0 ± 0.9 bcdef 350 Low 5.6 ± 0.6 def 7.8 ± 1.0 bc 2.9 ± 0.4 efg 6.4 ± 1.2 defg 9.3 ± 1.5 cd 0.46 ± 0.1 abc 11.4 ± 1.3 bcde 350 High 9.6 ± 1.4 a 9.5 ± 0.6 a 6.4 ± 1.3 a 9.3 ± 2.1 abc 15.7 ± 2.1 a 0.74 ± 0.3 a 16.6 ± 2.9 a 700 Low 3.3 ± 0.4 h 6.8 ± 0.4 cd 1.7 ± 0.2 gh 7.7 ± 1.2 bcdef 9.4 ± 1.2 cd 0.23 ± 0.1 e 8.4 ± 0.6 f
L. bicolor
700 High 4.4 ± 0.9 fgh 8.6 ± 0.6 ab 4.0 ± 0.9 cde 10.8 ± 2.7 a 14.8 ± 3.0 ab 0.38 ± 0.1 bcd 11.8 ± 1.0 bcd 350 Low 5.2 ± 0.2 efg 6.6 ± 0.5 cd 2.3 ± 0.4 fgh 5.8 ± 1.1 efg 8.1 ± 1.0 de 0.41 ± 0.1 bcd 9.4 ± 1.1 cdef 350 High 7.4 ± 1.1 bc 8.1 ± 0.8 abc 4.3 ± 0.7 cd 8.6 ± 1.8 abcd 12.9 ± 2.3 ab 0.51 ± 0.1 abc 12.2 ± 1.0 bc 700 Low 4.4 ± 0.8 fgh 6.8 ± 0.8 cd 1.9 ± 0.3 gh 6.7 ± 1.3 cdefg 8.6 ± 1.4 de 0.30 ± 0.1 de 8.8 ± 1.1 ef
S. bovinus
700 High 4.9 ± 0.9 efg 7.2 ± 0.8 bc 4.1 ± 0.7 cde 9.9 ± 1.6 ab 14.0 ± 1.9 ab 0.42 ± 0.1 bcd 10.2 ± 1.1 bcdef 350 Low 6.5 ± 0.8 cde 5.6 ± 0.9 d 3.0 ± 0.3 efg 5.4 ± 1.3 fg 8.4 ± 1.3 de 0.58 ± 0.1 ab 8.7 ± 1.4 ef 350 High 9.0 ± 1.3 ab 7.6 ± 0.7 bc 5.9 ± 1.0 ab 8.8 ± 1.0 abcd 14.7 ± 1.2 ab 0.69 ± 0.2 a 12.8 ± 1.5 b 700 Low 4.0 ± 0.4 fgh 6.8 ± 0.6 cd 2.2 ± 0.2 fgh 7.2 ± 0.7 bcdef 9.4 ± 0.8 cd 0.31 ± 0.1 de 9.0 ± 0.9 def
Non-mycorrhizal
700 High 5.0 ± 0.4 efg 7.6 ± 0.7 bc 4.8 ± 0.6 bc 9.3 ± 0.9 abc 14.1 ± 1.0 ab 0.52 ± 0.1 abc 11.6 ± 1.6 bcde
apter 4
Table 4 Shoot and root N concentration (mg g−1), N content (mg), total N content (mg), shoot-to-root N content and N uptake efficiency (mg N g–1 root) responses to fungal species, CO2 levels (μl l−1) and N levels.
Mean values ± SD are shown. Means within a column followed by different letters are significantly different
Ectomycorrhizal fungi and global change
We attempted to dissect the direct (through soil N supply) and indirect (through C supply by the plant, ultimately derived from the atmosphere) effects of fungal identity. We calculated response ratio for plants (total dry weight) and fungi (hyphal length) to CO2 levels (at low N supply) and N supply (at ambient CO2). Doubling N supply resulted in a similar plant growth response irrespective of fungal identity (a yield increase of 23% to 44%), but a highly dissimilar fungal response (ranging from a decline of 17% to an increase of 101%). Doubling CO2 availability resulted in a very dissimilar plant response (ranging from a decline of 22% to an increase of 25%) but a fairly similar fungal response (an increase of 26 to 71%). We conclude that there is substantial direct fungal variation in response to N availability, which results in a consistent plant growth response to increased N availability, and little indirect fungal variation to atmospheric CO2 levels (which therefore maintains substantial plant variation in response to CO2 levels).
Both N deposition and elevated CO2 have the potential to change ECM fungal assemblages. Increasing N deposition usually selects against fungal species that form a low of extraradical hyphal biomass (Lilleskov et al., 2001, 2002; Parrent et al., 2006; Wallander, 2006), and increasing CO2 levels have been reported to select for such fungal species (Godbold & Berntson, 1997). It is therefore imperative to study the interactive effect of both elevated CO2 and N deposition on species interactions within ECM fungal assemblages in order to improve our predictions on the role that ECM associations may play in a world of global change (Lilleskov & Parrent, 2007).
In a meta-analysis of soil CO2 efflux partitioning between heterotrophic (saprotrophic organisms) and autrotrophic (plant roots and associated mycorrhizal fungi), Subke et al. (2006) suggested that higher levels of C assimilation do not translate into higher C sequestration, but rather in a faster transport of C through plants to return to the atmosphere. Högberg & Read (2006) argued for the need to conceptually separate the contributions that plant roots and mycorrhizal fungi make to this autotrophic respiration. In our study, below-ground 14C respiration of mycorrhizal seedlings corresponded to 14-21% of total 14C assimilated and of non-mycorrhizal seedlings only 9%, even though non-mycorrhizal plants were of the same size as mycorrhizal plants. The need for separating the plant and fungal contribution also follows from studies by Gorissen & Kuyper (2000) and Heinemeyer et al. (2007) who mentioned the CO2 overflow tap through which mycorrhizal fungi directly return additional C to the atmosphere. Our study provided further support for this overflow mechanism for both L. bicolor and S. bovinus, but not for H. cylindrosporum.
The suggestion that fungal sink strength for N constrains plant response to elevated CO2 and fungal sink strength for C is increased at higher N levels, supports our claim that the size of the extraradical mycelium generates potential for negative feedback through PNL (Luo et al., 2004; Johnson, 2006; Hu et al., 2006; Reich et al., 2006; Alberton et al., 2007). The PNL hypothesis has been mentioned as a major cause that constrains and ultimately decreases plant responses to rising levels of atmospheric CO2 (De Graaff et al., 2006; Van Groenigen et
71
Chapter 4
al., 2006). Laboratory evidence for N retention by ECM fungi resulting in reduced plant growth was provided by Nylund & Wallander (1989), Dosskey et al. (1990, 1991), Colpaert et al. (1992, 1996), Colpaert & Verstuyft (1999), Fransson et al. (2005) and Alberton et al. (2007). It is less clear whether the same mechanism also occurs under field conditions. In places under strong N-limitation of ECM mycelial growth has been reported from several boreal and arctic ecosystems (Hendricks et al., 2006; Clemmensen et al., 2006). There is also field evidence for N-limitation of arbuscular mycorrhizal fungi (Treseder & Allen, 2002; Allen et al., 2005).
In conclusion, ECM plant and fungal performance showed fungal species-specific responses to differences in C and N availability. At low N availability, elevated CO2 increased competition between plant and fungus for N, which corroborates the PNL theory. Increased N supply potentially relieved mycorrhiza-induced PNL under elevated CO2. However, this relief may reduce the uptake of others nutrients, because the increased N availability decreases hyphal length and hence the acquisition of other nutrients such as phosphorus and cations. Understanding the interplay of both increased N availability and elevated CO2 and their combined effects on ECM fungal species-specific behavior, and on competitive interactions between ECM fungal species, which results in changes in the ECM fungal assemblage, remains an urgent and challenging task for the future (Lilleskov & Parrent, 2007).
Acknowledgements This study was funded by the C.T. de Wit Graduate School for Production Ecology and Resource Conservation (PE&RC) of Wageningen University and Research Centre, the Netherlands. We thank Antonie Gorissen (IsoLife, Wageningen) for technical assistance.
72
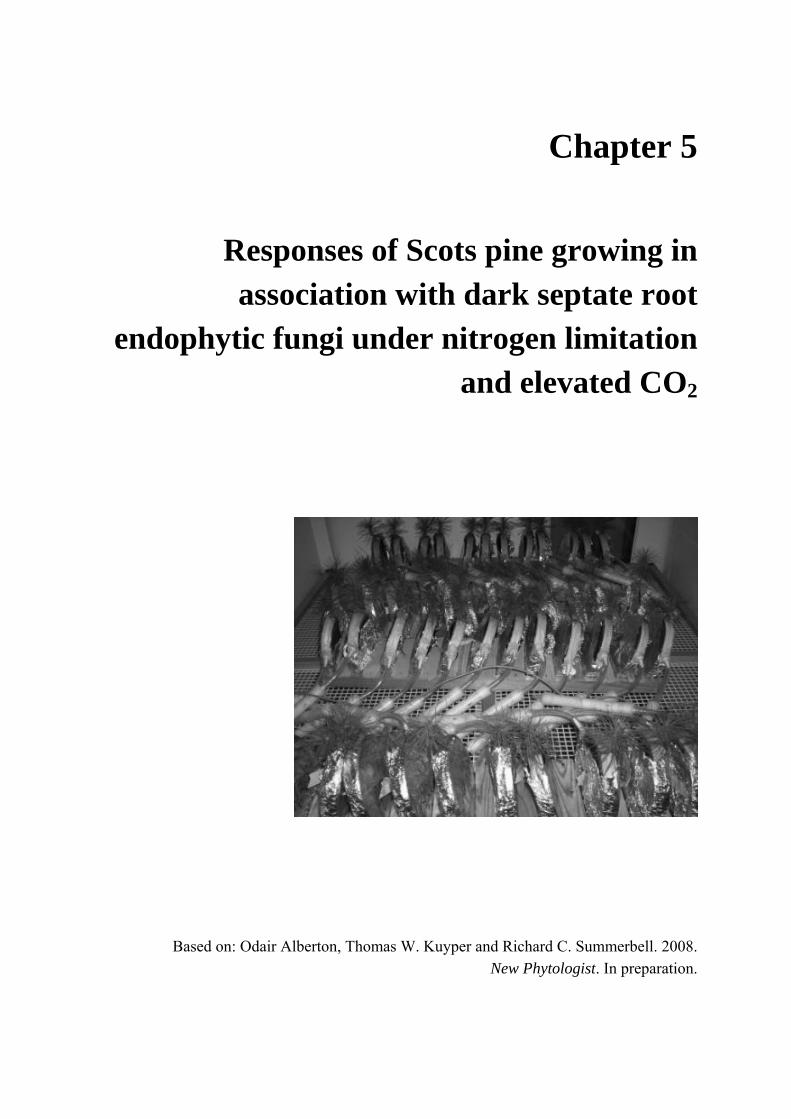
Chapter 5
Responses of Scots pine growing in association with dark septate root
endophytic fungi under nitrogen limitation and elevated CO2
Based on: Odair Alberton, Thomas W. Kuyper and Richard C. Summerbell. 2008. New Phytologist. In preparation.
Chapter 5
Abstract
We investigated the effects of different dark septate root endophytic fungi (DSE) on growth and nutrient acquisition by Pinus sylvestris seedlings under conditions of N-limitation and at two levels of C availability. Each seedling was inoculated with one of the following DSE taxa: Phialocephala fortinii (two strains), Cadophora finlandica, Chloridium paucisporum, Scytalidium vaccinii, Meliniomyces variabilis or M. vraolstadiae. The trial lasted 125 d. During the final 27 days, the seedlings were labeled with 14CO2 and 15N-labeled ammonium. We measured extraradical hyphal length, internal colonization, plant biomass, 14C allocation and plant nitrogen. Almost all parameters were significantly affected by DSE species and CO2 level and in a number of cases by the interaction. Under elevated CO2, seedlings inoculated with S. vaccinii had the largest biomass. At elevated CO2, carbon gain in plants inoculated with DSE was 17% higher than in control plants. Carbon gain and N uptake were not correlated. Shoot N concentration decreased by 57% under elevated CO2 and was lowest with S. vaccinii association. We compared the behavior of DSE association with an earlier experiment under similar conditions with ectomycorrhizal fungi. Similarities and differences in benefits and costs of DSE and ectomycorrhizal fungi are discussed. Key words: dark septate endophytes, Pinus sylvestris, elevated CO2, carbon and nutrient allocation, mycorrhizas
74
Dark septate endophytic fungi under elevated CO2
Introduction The rising level of atmospheric CO2 is predicted to have substantial impacts on plant growth and the functioning of ecosystems. However, when we try to identify the key issues that we need better understanding of in order to explain and predict responses on larger temporal and spatial scales, a major gap in knowledge has been identified, viz. an insufficient understanding of the below-ground dynamics, both root dynamics and the dynamics of the soil microbiological populations.
Roots of a very large number of plant species worldwide are regularly colonized by a group of ascomycete fungi with usually dark-pigmented (melanized) septate hyphae (Mandyam & Jumpponen, 2005; Sieber & Grünig, 2006). These fungi are now referred to as dark septate endophytes (DSE – Stoyke & Currah, 1991); in former times they were also known under the collective name Mycelium radicis atrovirens and as pseudomycorrhizal fungi (Summerbell, 2005a). DSE constitute a polyphyletic assemblage, with most species belonging to the Leotiomycetes (Kernaghan et al., 2003; Hambleton & Sigler, 2005; Wang et al., 2006).
DSE fungi exhibit a very broad host range (Schadt et al., 2001). A review by Jumpponen & Trappe (1998a) reported that close to 600 species from more than 110 plant families across the world are hosts to DSE fungi. DSE fungi occur or co-occur in plants that are also able to form arbuscular, orchid, ericoid and ectomycorrhizal (ECM) associations. Summerbell (2005b) noted that DSE often co-occur with healthy ectomycorrhizas. They are also common on non-mycorrhizal tree roots (Ahlich & Sieber, 1996). Read & Haselwandter (1981) suggested that DSE often replace arbuscular mycorrhizal (AM) and ECM fungi in arctic and alpine ecosystems, however Ruotsalainen (2003) failed to confirm this pattern in northern Finland. Postma et al. (2007) similarly suggested that DSE replace AM fungi at very low pH. Their occurrence on very young tree seedlings (Horton et al., 1998) and in the earliest stages of primary succession (Jumpponen, 2003; Cázares et al., 2005) has been mentioned, but DSE can be equally abundant on mature trees (Ahlich & Sieber, 1996).
Despite their almost ubiquitous occurrence, the behavior of DSE on plant roots, and hence their impact on plant performance and fitness are still poorly understood. Wilcox & Wang (1987a) indicated pathological (parasitic) behavior on tree seedlings at low pH, as shown by reduced performance of the host plant. The abundance of DSE in healthy-looking roots, however, suggests that they are unlikely primary pathogens (Sieber & Grünig, 2006). In line with that suggestion, many studies (summarized in Mandyam & Jumpponen, 2005) indicated that DSE could show mutualistic behavior (improved nutrient uptake, increased tolerance against root pathogens, improved ability to withstand adverse environmental conditions, enhanced performance of the host plant).
75
Chapter 5
When DSE exhibit mutualistic behavior, they seem functionally rather similar to mycorrhizal fungi. Jumpponen (2001) therefore raised the question whether DSE are mycorrhizal. The answer to that question depends on the definition of mycorrhiza. From a structural point of view, DSE fungi colonizing roots of ECM trees are different from ECM fungi. DSE fungi usually form incomplete mantles that only partially cover the root, and very little of a Hartig net. Intracellular colonization, often in the form of microsclerotial structures (O’Dell et al., 1993), is common. Jumpponen (2001) claimed that DSE possess intracellular (and possibly intercellular) interfaces, suggesting a biotrophic nutritional mode. He therefore argued that DSE fungi are capable of forming mutualistic associations with plant roots that are functionally similar to mycorrhiza. Treu et al. (1996) described DSE as mycorrhizal, although they added that the association between roots and DSE did not fit with existing types of mycorrhiza. Sieber & Grünig (2006) also noted that Phialocephala fortinii may function as a mycorrhizal fungus. However, Addy et al. (2005) disagreed with such a classification, noting that premature categorization might impede understanding of the ecological and functional roles of DSE. They suggested several alternative explanations for enhanced plant growth without a nutritional interface over which carbon (C) and nutrients are exchanged, such as enhanced resistance against root pathogens, production of phytohormones, or increased mineralization in the rhizosphere. Ruotsalainen (2003) found support for that hypothesis, when a strain of DSE did not colonize seedlings of Gnaphalium norvegicum while still resulting in benefits for the seedling.
Associations with DSE share with mycorrhizal associations that they span the continuum from mildly antagonistic to mutualistic interactions (Johnson et al., 1997; Jumpponen, 2001). In the case of DSE, it is not known to what extent such differences in behavior are context-dependent, being influenced by the availability of plant C on the one hand and external nutrients on the other hand (Jumpponen & Trappe, 1998a,b; Jumpponen, 2001). Different outcomes of experiments with DSE on host plants can also be partly due to differences among various fungal taxa.
Sieber & Grünig (2006) suggested that enhanced CO2 as a consequence of burning fossil fuels and land use change, could affect DSE function, but noted that nothing was known about the direction and magnitude of effects. Taking in account that nothing or very little is know, the objectives of our study were to determine C gain and nutrient acquisition by different DSE species in association with Scots pine (Pinus sylvestris) seedlings under low N availability at ambient and elevated CO2.
76
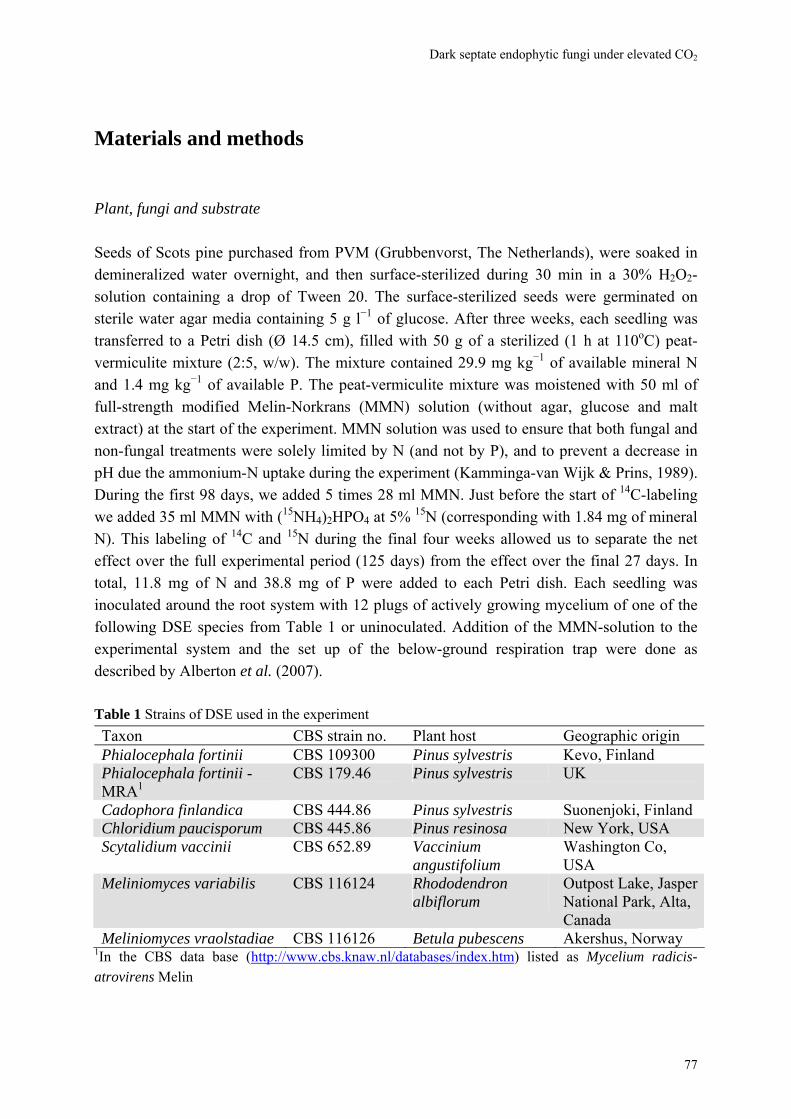
Dark septate endophytic fungi under elevated CO2
Materials and methods Plant, fungi and substrate Seeds of Scots pine purchased from PVM (Grubbenvorst, The Netherlands), were soaked in demineralized water overnight, and then surface-sterilized during 30 min in a 30% H2O2-solution containing a drop of Tween 20. The surface-sterilized seeds were germinated on sterile water agar media containing 5 g l−1 of glucose. After three weeks, each seedling was transferred to a Petri dish (Ø 14.5 cm), filled with 50 g of a sterilized (1 h at 110oC) peat-vermiculite mixture (2:5, w/w). The mixture contained 29.9 mg kg−1 of available mineral N and 1.4 mg kg−1 of available P. The peat-vermiculite mixture was moistened with 50 ml of full-strength modified Melin-Norkrans (MMN) solution (without agar, glucose and malt extract) at the start of the experiment. MMN solution was used to ensure that both fungal and non-fungal treatments were solely limited by N (and not by P), and to prevent a decrease in pH due the ammonium-N uptake during the experiment (Kamminga-van Wijk & Prins, 1989). During the first 98 days, we added 5 times 28 ml MMN. Just before the start of 14C-labeling we added 35 ml MMN with (15NH4)2HPO4 at 5% 15N (corresponding with 1.84 mg of mineral N). This labeling of 14C and 15N during the final four weeks allowed us to separate the net effect over the full experimental period (125 days) from the effect over the final 27 days. In total, 11.8 mg of N and 38.8 mg of P were added to each Petri dish. Each seedling was inoculated around the root system with 12 plugs of actively growing mycelium of one of the following DSE species from Table 1 or uninoculated. Addition of the MMN-solution to the experimental system and the set up of the below-ground respiration trap were done as described by Alberton et al. (2007). Table 1 Strains of DSE used in the experiment Taxon CBS strain no. Plant host Geographic origin Phialocephala fortinii CBS 109300 Pinus sylvestris Kevo, Finland Phialocephala fortinii - MRA1
CBS 179.46 Pinus sylvestris UK
Cadophora finlandica CBS 444.86 Pinus sylvestris Suonenjoki, Finland Chloridium paucisporum CBS 445.86 Pinus resinosa New York, USA Scytalidium vaccinii CBS 652.89 Vaccinium
angustifolium Washington Co, USA
Meliniomyces variabilis CBS 116124 Rhododendron albiflorum
Outpost Lake, Jasper National Park, Alta, Canada
Meliniomyces vraolstadiae CBS 116126 Betula pubescens Akershus, Norway 1In the CBS data base (http://www.cbs.knaw.nl/databases/index.htm) listed as Mycelium radicis-atrovirens Melin
77
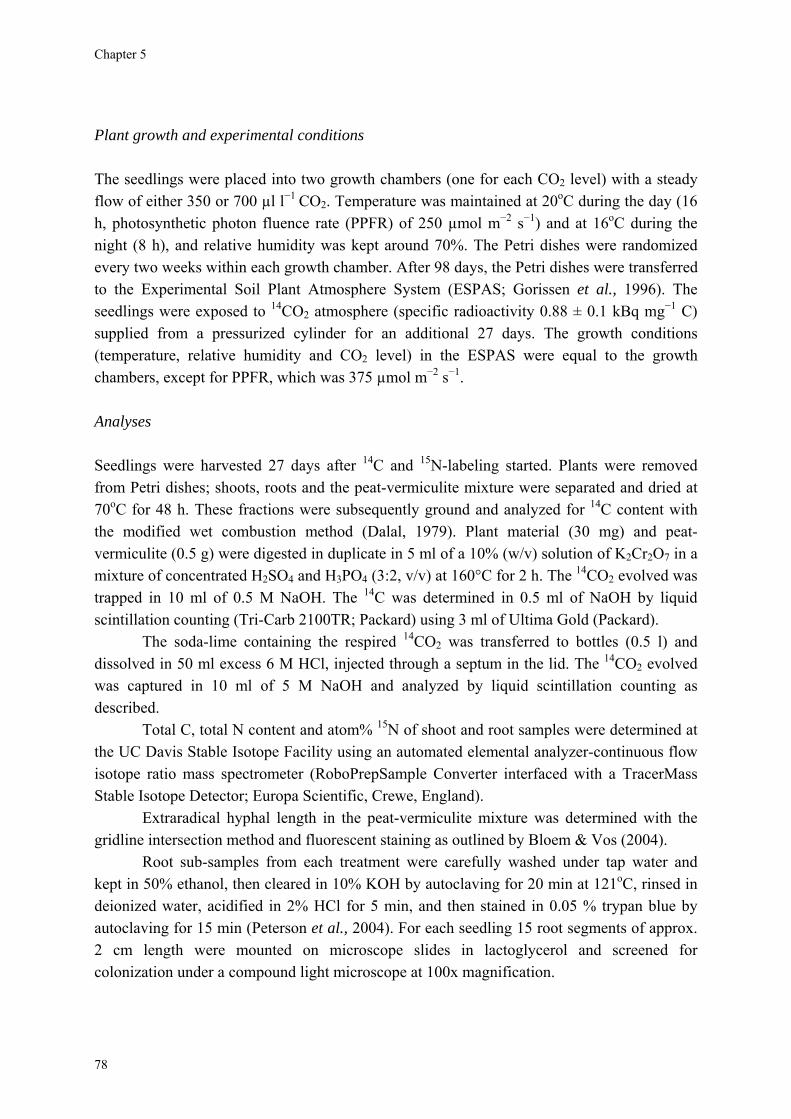
Chapter 5
Plant growth and experimental conditions The seedlings were placed into two growth chambers (one for each CO2 level) with a steady flow of either 350 or 700 µl l−1 CO2. Temperature was maintained at 20oC during the day (16 h, photosynthetic photon fluence rate (PPFR) of 250 µmol m−2 s−1) and at 16oC during the night (8 h), and relative humidity was kept around 70%. The Petri dishes were randomized every two weeks within each growth chamber. After 98 days, the Petri dishes were transferred to the Experimental Soil Plant Atmosphere System (ESPAS; Gorissen et al., 1996). The seedlings were exposed to 14CO2 atmosphere (specific radioactivity 0.88 ± 0.1 kBq mg−1 C) supplied from a pressurized cylinder for an additional 27 days. The growth conditions (temperature, relative humidity and CO2 level) in the ESPAS were equal to the growth chambers, except for PPFR, which was 375 µmol m−2 s−1. Analyses Seedlings were harvested 27 days after 14C and 15N-labeling started. Plants were removed from Petri dishes; shoots, roots and the peat-vermiculite mixture were separated and dried at 70oC for 48 h. These fractions were subsequently ground and analyzed for 14C content with the modified wet combustion method (Dalal, 1979). Plant material (30 mg) and peat-vermiculite (0.5 g) were digested in duplicate in 5 ml of a 10% (w/v) solution of K2Cr2O7 in a mixture of concentrated H2SO4 and H3PO4 (3:2, v/v) at 160°C for 2 h. The 14CO2 evolved was trapped in 10 ml of 0.5 M NaOH. The 14C was determined in 0.5 ml of NaOH by liquid scintillation counting (Tri-Carb 2100TR; Packard) using 3 ml of Ultima Gold (Packard).
The soda-lime containing the respired 14CO2 was transferred to bottles (0.5 l) and dissolved in 50 ml excess 6 M HCl, injected through a septum in the lid. The 14CO2 evolved was captured in 10 ml of 5 M NaOH and analyzed by liquid scintillation counting as described.
Total C, total N content and atom% 15N of shoot and root samples were determined at the UC Davis Stable Isotope Facility using an automated elemental analyzer-continuous flow isotope ratio mass spectrometer (RoboPrepSample Converter interfaced with a TracerMass Stable Isotope Detector; Europa Scientific, Crewe, England).
Extraradical hyphal length in the peat-vermiculite mixture was determined with the gridline intersection method and fluorescent staining as outlined by Bloem & Vos (2004).
Root sub-samples from each treatment were carefully washed under tap water and kept in 50% ethanol, then cleared in 10% KOH by autoclaving for 20 min at 121oC, rinsed in deionized water, acidified in 2% HCl for 5 min, and then stained in 0.05 % trypan blue by autoclaving for 15 min (Peterson et al., 2004). For each seedling 15 root segments of approx. 2 cm length were mounted on microscope slides in lactoglycerol and screened for colonization under a compound light microscope at 100x magnification.
78
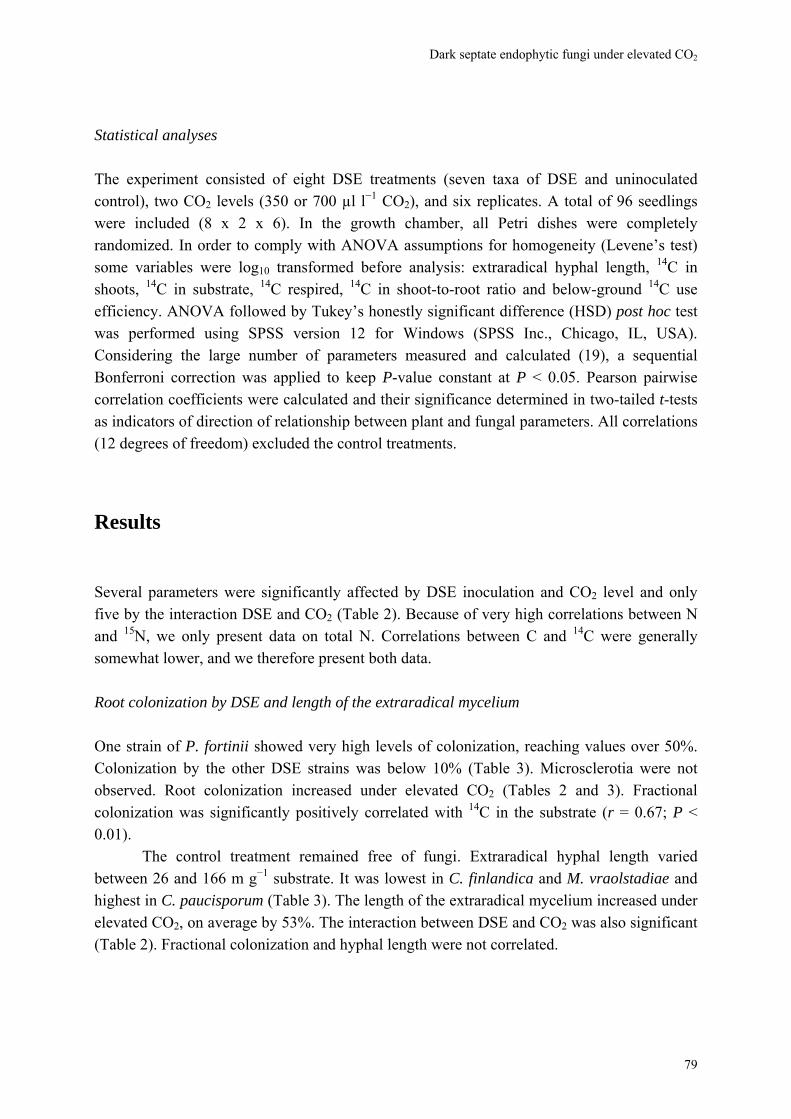
Dark septate endophytic fungi under elevated CO2
Statistical analyses The experiment consisted of eight DSE treatments (seven taxa of DSE and uninoculated control), two CO2 levels (350 or 700 µl l−1 CO2), and six replicates. A total of 96 seedlings were included (8 x 2 x 6). In the growth chamber, all Petri dishes were completely randomized. In order to comply with ANOVA assumptions for homogeneity (Levene’s test) some variables were log10 transformed before analysis: extraradical hyphal length, 14C in shoots, 14C in substrate, 14C respired, 14C in shoot-to-root ratio and below-ground 14C use efficiency. ANOVA followed by Tukey’s honestly significant difference (HSD) post hoc test was performed using SPSS version 12 for Windows (SPSS Inc., Chicago, IL, USA). Considering the large number of parameters measured and calculated (19), a sequential Bonferroni correction was applied to keep P-value constant at P < 0.05. Pearson pairwise correlation coefficients were calculated and their significance determined in two-tailed t-tests as indicators of direction of relationship between plant and fungal parameters. All correlations (12 degrees of freedom) excluded the control treatments.
Results Several parameters were significantly affected by DSE inoculation and CO2 level and only five by the interaction DSE and CO2 (Table 2). Because of very high correlations between N and 15N, we only present data on total N. Correlations between C and 14C were generally somewhat lower, and we therefore present both data. Root colonization by DSE and length of the extraradical mycelium One strain of P. fortinii showed very high levels of colonization, reaching values over 50%. Colonization by the other DSE strains was below 10% (Table 3). Microsclerotia were not observed. Root colonization increased under elevated CO2 (Tables 2 and 3). Fractional colonization was significantly positively correlated with 14C in the substrate (r = 0.67; P < 0.01). The control treatment remained free of fungi. Extraradical hyphal length varied between 26 and 166 m g−1 substrate. It was lowest in C. finlandica and M. vraolstadiae and highest in C. paucisporum (Table 3). The length of the extraradical mycelium increased under elevated CO2, on average by 53%. The interaction between DSE and CO2 was also significant (Table 2). Fractional colonization and hyphal length were not correlated.
79
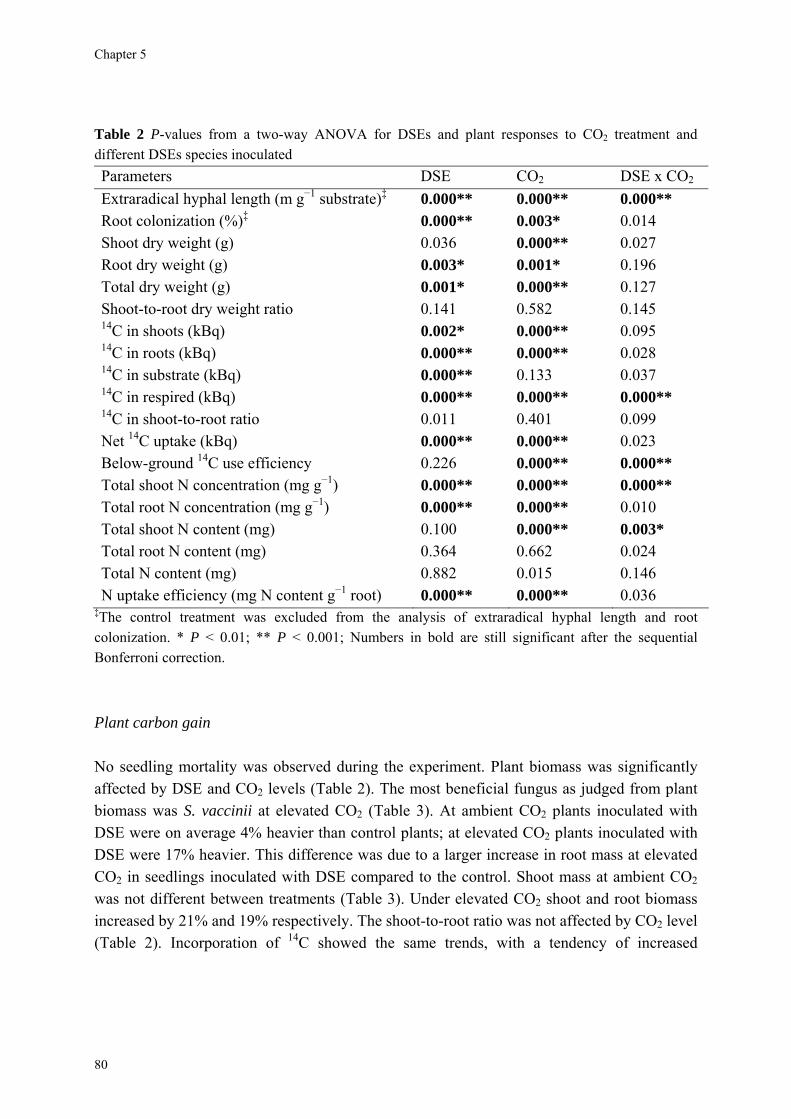
Chapter 5
Table 2 P-values from a two-way ANOVA for DSEs and plant responses to CO2 treatment and different DSEs species inoculated Parameters DSE CO2 DSE x CO2
Extraradical hyphal length (m g−1 substrate)‡ 0.000** 0.000** 0.000** Root colonization (%)‡ 0.000** 0.003* 0.014 Shoot dry weight (g) 0.036 0.000** 0.027 Root dry weight (g) 0.003* 0.001* 0.196 Total dry weight (g) 0.001* 0.000** 0.127 Shoot-to-root dry weight ratio 0.141 0.582 0.145 14C in shoots (kBq) 0.002* 0.000** 0.095 14C in roots (kBq) 0.000** 0.000** 0.028 14C in substrate (kBq) 0.000** 0.133 0.037 14C in respired (kBq) 0.000** 0.000** 0.000** 14C in shoot-to-root ratio 0.011 0.401 0.099 Net 14C uptake (kBq) 0.000** 0.000** 0.023 Below-ground 14C use efficiency 0.226 0.000** 0.000** Total shoot N concentration (mg g−1) 0.000** 0.000** 0.000** Total root N concentration (mg g−1) 0.000** 0.000** 0.010 Total shoot N content (mg) 0.100 0.000** 0.003* Total root N content (mg) 0.364 0.662 0.024 Total N content (mg) 0.882 0.015 0.146 N uptake efficiency (mg N content g−1 root) 0.000** 0.000** 0.036
‡The control treatment was excluded from the analysis of extraradical hyphal length and root colonization. * P < 0.01; ** P < 0.001; Numbers in bold are still significant after the sequential Bonferroni correction. Plant carbon gain No seedling mortality was observed during the experiment. Plant biomass was significantly affected by DSE and CO2 levels (Table 2). The most beneficial fungus as judged from plant biomass was S. vaccinii at elevated CO2 (Table 3). At ambient CO2 plants inoculated with DSE were on average 4% heavier than control plants; at elevated CO2 plants inoculated with DSE were 17% heavier. This difference was due to a larger increase in root mass at elevated CO2 in seedlings inoculated with DSE compared to the control. Shoot mass at ambient CO2 was not different between treatments (Table 3). Under elevated CO2 shoot and root biomass increased by 21% and 19% respectively. The shoot-to-root ratio was not affected by CO2 level (Table 2). Incorporation of 14C showed the same trends, with a tendency of increased
80
Dark septate endophytic fungi under elevated CO2
81
allocation below-ground. Carbon gain was neither correlated with levels of internal colonization nor extraradical hyphal length.
Below-ground respiration of 14C accounted for 4-10% of the 14C budget under ambient CO2 and for 7-27% under elevated CO2. Below-ground respiration increased significantly under elevated CO2. Below-ground carbon-use efficiency (CUE – see Gorissen & Kuyper, 2000) declined strongly under elevated CO2 for almost all treatments, except for the control plants and plants inoculated with M. vraolstadiae (Table 4). Below-ground CUE was negatively correlated with 14C respired (r = -0.82; P < 0.001). Below-ground CUE was significantly positively correlated with shoot N concentration and content (r = 0.81 and 0.71 respectively; P < 0.01).
Plant nitrogen uptake Shoot N concentration was significantly different among DSE treatments (Table 2). At ambient CO2 shoot N concentration was highest in plants inoculated with P. fortinii – MRA and S. vaccinii. Shoot N concentration ranged between 8.2 and 11.5 mg g−1 under ambient CO2 and declined to 4.7 to 7.5 mg g−1 under elevated CO2 (Table 5). The decline in shoot N concentration was less in control plants than in plants inoculated with DSE. The decline was largest in plants inoculated with S. vaccinii. On average, shoot N concentration was 57% lower under elevated CO2 (Table 5). The interaction between DSE and CO2 levels was also significant (Table 2). Root N concentration was also significantly affected by DSE and CO2
level (Table 2). Elevated CO2 decreased root N concentration on average by 16%. It was lowest in the treatment with M. vraolstadiae and highest in the control (Table 5). The decline in root N concentration under elevated CO2 was much smaller than the decline in shoot N concentration. Shoot and root N concentration were not significantly correlated (r = 0.266; P > 0.05).
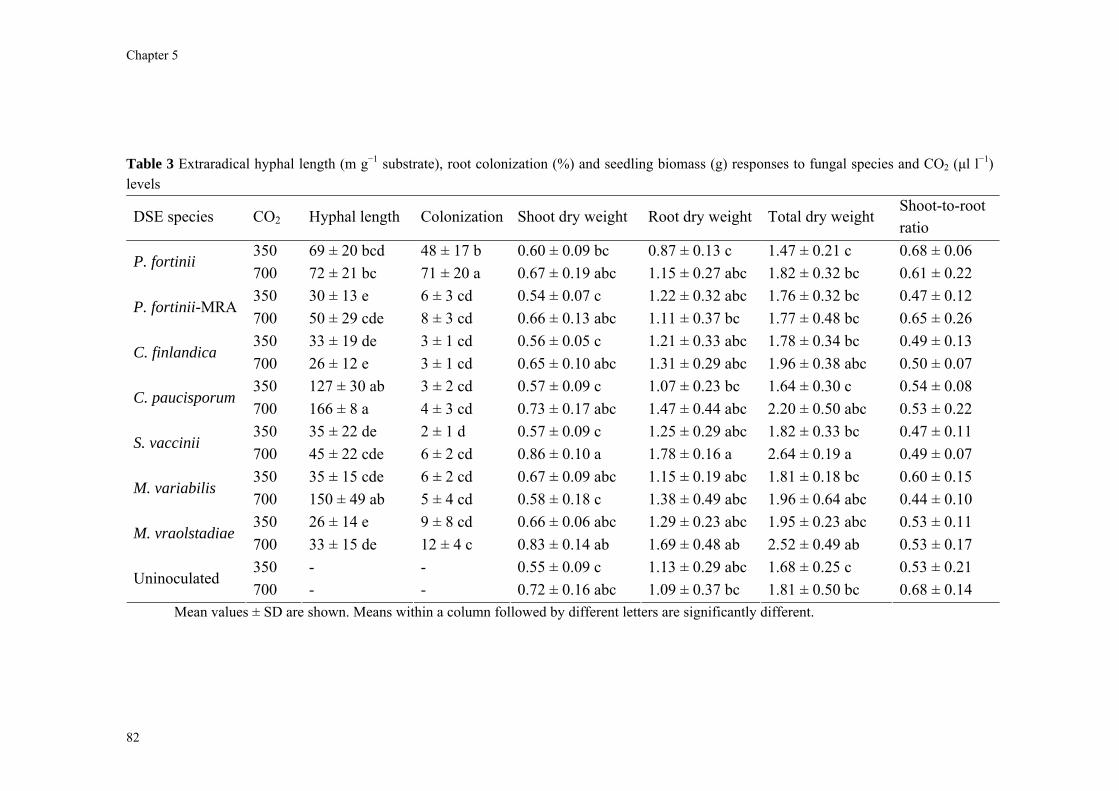
Chapter 5
Table 3 Extraradical hyphal length (m g−1 substrate), root colonization (%) and seedling biomass (g) responses to fungal species and CO2 (μl l−1) levels
DSE species CO2 Hyphal length Colonization Shoot dry weight Root dry weight Total dry weight Shoot-to-root ratio
350 69 ± 20 bcd 48 ± 17 b 0.60 ± 0.09 bc 0.87 ± 0.13 c 1.47 ± 0.21 c 0.68 ± 0.06 P. fortinii
700 72 ± 21 bc 71 ± 20 a 0.67 ± 0.19 abc 1.15 ± 0.27 abc 1.82 ± 0.32 bc 0.61 ± 0.22 350 30 ± 13 e 6 ± 3 cd 0.54 ± 0.07 c 1.22 ± 0.32 abc 1.76 ± 0.32 bc 0.47 ± 0.12
P. fortinii-MRA 700 50 ± 29 cde 8 ± 3 cd 0.66 ± 0.13 abc 1.11 ± 0.37 bc 1.77 ± 0.48 bc 0.65 ± 0.26 350 33 ± 19 de 3 ± 1 cd 0.56 ± 0.05 c 1.21 ± 0.33 abc 1.78 ± 0.34 bc 0.49 ± 0.13
C. finlandica 700 26 ± 12 e 3 ± 1 cd 0.65 ± 0.10 abc 1.31 ± 0.29 abc 1.96 ± 0.38 abc 0.50 ± 0.07 350 127 ± 30 ab 3 ± 2 cd 0.57 ± 0.09 c 1.07 ± 0.23 bc 1.64 ± 0.30 c 0.54 ± 0.08
C. paucisporum 700 166 ± 8 a 4 ± 3 cd 0.73 ± 0.17 abc 1.47 ± 0.44 abc 2.20 ± 0.50 abc 0.53 ± 0.22 350 35 ± 22 de 2 ± 1 d 0.57 ± 0.09 c 1.25 ± 0.29 abc 1.82 ± 0.33 bc 0.47 ± 0.11
S. vaccinii 700 45 ± 22 cde 6 ± 2 cd 0.86 ± 0.10 a 1.78 ± 0.16 a 2.64 ± 0.19 a 0.49 ± 0.07 350 35 ± 15 cde 6 ± 2 cd 0.67 ± 0.09 abc 1.15 ± 0.19 abc 1.81 ± 0.18 bc 0.60 ± 0.15
M. variabilis 700 150 ± 49 ab 5 ± 4 cd 0.58 ± 0.18 c 1.38 ± 0.49 abc 1.96 ± 0.64 abc 0.44 ± 0.10 350 26 ± 14 e 9 ± 8 cd 0.66 ± 0.06 abc 1.29 ± 0.23 abc 1.95 ± 0.23 abc 0.53 ± 0.11
M. vraolstadiae 700 33 ± 15 de 12 ± 4 c 0.83 ± 0.14 ab 1.69 ± 0.48 ab 2.52 ± 0.49 ab 0.53 ± 0.17 350 - - 0.55 ± 0.09 c 1.13 ± 0.29 abc 1.68 ± 0.25 c 0.53 ± 0.21
Uninoculated 700 - - 0.72 ± 0.16 abc 1.09 ± 0.37 bc 1.81 ± 0.50 bc 0.68 ± 0.14
Mean values ± SD are shown. Means within a column followed by different letters are significantly different.
82
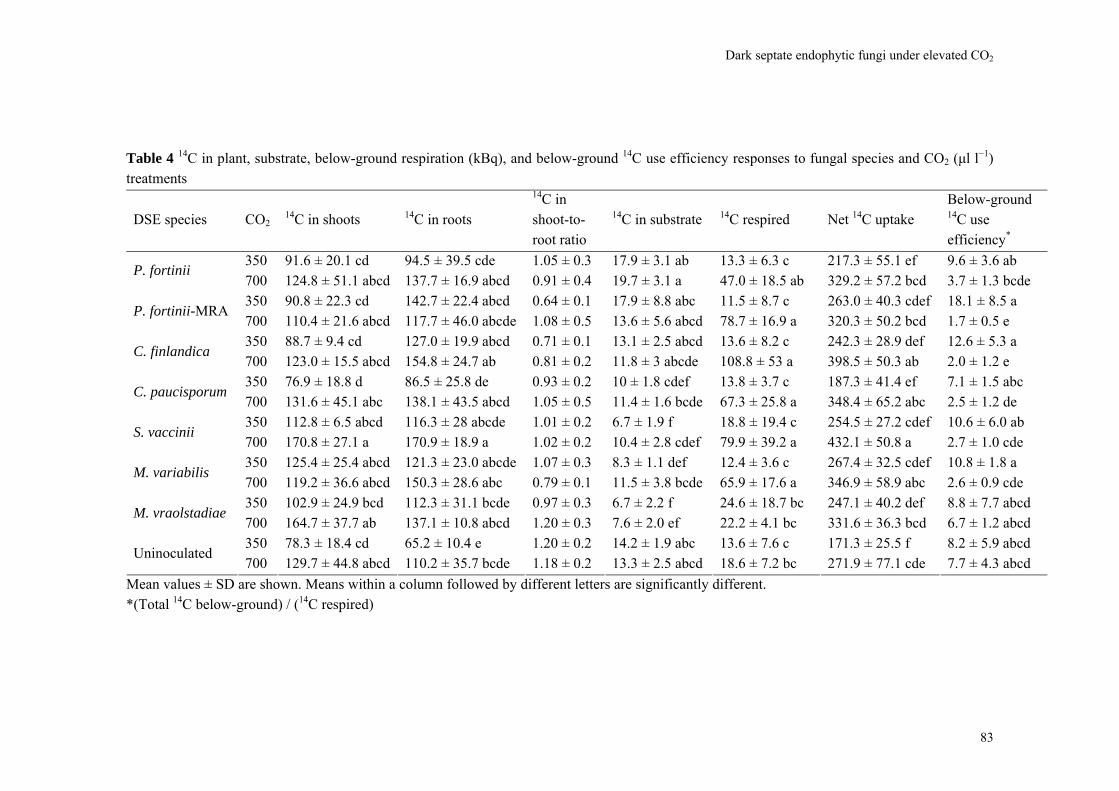
Dark septate endophytic fungi under elevated CO2
Table 4 14C in plant, substrate, below-ground respiration (kBq), and below-ground 14C use efficiency responses to fungal species and CO2 (μl l−1) treatments
DSE species CO214C in shoots 14C in roots
14C in shoot-to-root ratio
14C in substrate 14C respired Net 14C uptake Below-ground 14C use efficiency*
350 91.6 ± 20.1 cd 94.5 ± 39.5 cde 1.05 ± 0.3 17.9 ± 3.1 ab 13.3 ± 6.3 c 217.3 ± 55.1 ef 9.6 ± 3.6 ab P. fortinii
700 124.8 ± 51.1 abcd 137.7 ± 16.9 abcd 0.91 ± 0.4 19.7 ± 3.1 a 47.0 ± 18.5 ab 329.2 ± 57.2 bcd 3.7 ± 1.3 bcde 350 90.8 ± 22.3 cd 142.7 ± 22.4 abcd 0.64 ± 0.1 17.9 ± 8.8 abc 11.5 ± 8.7 c 263.0 ± 40.3 cdef 18.1 ± 8.5 a
P. fortinii-MRA 700 110.4 ± 21.6 abcd 117.7 ± 46.0 abcde 1.08 ± 0.5 13.6 ± 5.6 abcd 78.7 ± 16.9 a 320.3 ± 50.2 bcd 1.7 ± 0.5 e 350 88.7 ± 9.4 cd 127.0 ± 19.9 abcd 0.71 ± 0.1 13.1 ± 2.5 abcd 13.6 ± 8.2 c 242.3 ± 28.9 def 12.6 ± 5.3 a
C. finlandica 700 123.0 ± 15.5 abcd 154.8 ± 24.7 ab 0.81 ± 0.2 11.8 ± 3 abcde 108.8 ± 53 a 398.5 ± 50.3 ab 2.0 ± 1.2 e 350 76.9 ± 18.8 d 86.5 ± 25.8 de 0.93 ± 0.2 10 ± 1.8 cdef 13.8 ± 3.7 c 187.3 ± 41.4 ef 7.1 ± 1.5 abc
C. paucisporum 700 131.6 ± 45.1 abc 138.1 ± 43.5 abcd 1.05 ± 0.5 11.4 ± 1.6 bcde 67.3 ± 25.8 a 348.4 ± 65.2 abc 2.5 ± 1.2 de 350 112.8 ± 6.5 abcd 116.3 ± 28 abcde 1.01 ± 0.2 6.7 ± 1.9 f 18.8 ± 19.4 c 254.5 ± 27.2 cdef 10.6 ± 6.0 ab
S. vaccinii 700 170.8 ± 27.1 a 170.9 ± 18.9 a 1.02 ± 0.2 10.4 ± 2.8 cdef 79.9 ± 39.2 a 432.1 ± 50.8 a 2.7 ± 1.0 cde 350 125.4 ± 25.4 abcd 121.3 ± 23.0 abcde 1.07 ± 0.3 8.3 ± 1.1 def 12.4 ± 3.6 c 267.4 ± 32.5 cdef 10.8 ± 1.8 a
M. variabilis 700 119.2 ± 36.6 abcd 150.3 ± 28.6 abc 0.79 ± 0.1 11.5 ± 3.8 bcde 65.9 ± 17.6 a 346.9 ± 58.9 abc 2.6 ± 0.9 cde 350 102.9 ± 24.9 bcd 112.3 ± 31.1 bcde 0.97 ± 0.3 6.7 ± 2.2 f 24.6 ± 18.7 bc 247.1 ± 40.2 def 8.8 ± 7.7 abcd
M. vraolstadiae 700 164.7 ± 37.7 ab 137.1 ± 10.8 abcd 1.20 ± 0.3 7.6 ± 2.0 ef 22.2 ± 4.1 bc 331.6 ± 36.3 bcd 6.7 ± 1.2 abcd 350 78.3 ± 18.4 cd 65.2 ± 10.4 e 1.20 ± 0.2 14.2 ± 1.9 abc 13.6 ± 7.6 c 171.3 ± 25.5 f 8.2 ± 5.9 abcd
Uninoculated 700 129.7 ± 44.8 abcd 110.2 ± 35.7 bcde 1.18 ± 0.2 13.3 ± 2.5 abcd 18.6 ± 7.2 bc 271.9 ± 77.1 cde 7.7 ± 4.3 abcd
Mean values ± SD are shown. Means within a column followed by different letters are significantly different. *(Total 14C below-ground) / (14C respired)
83
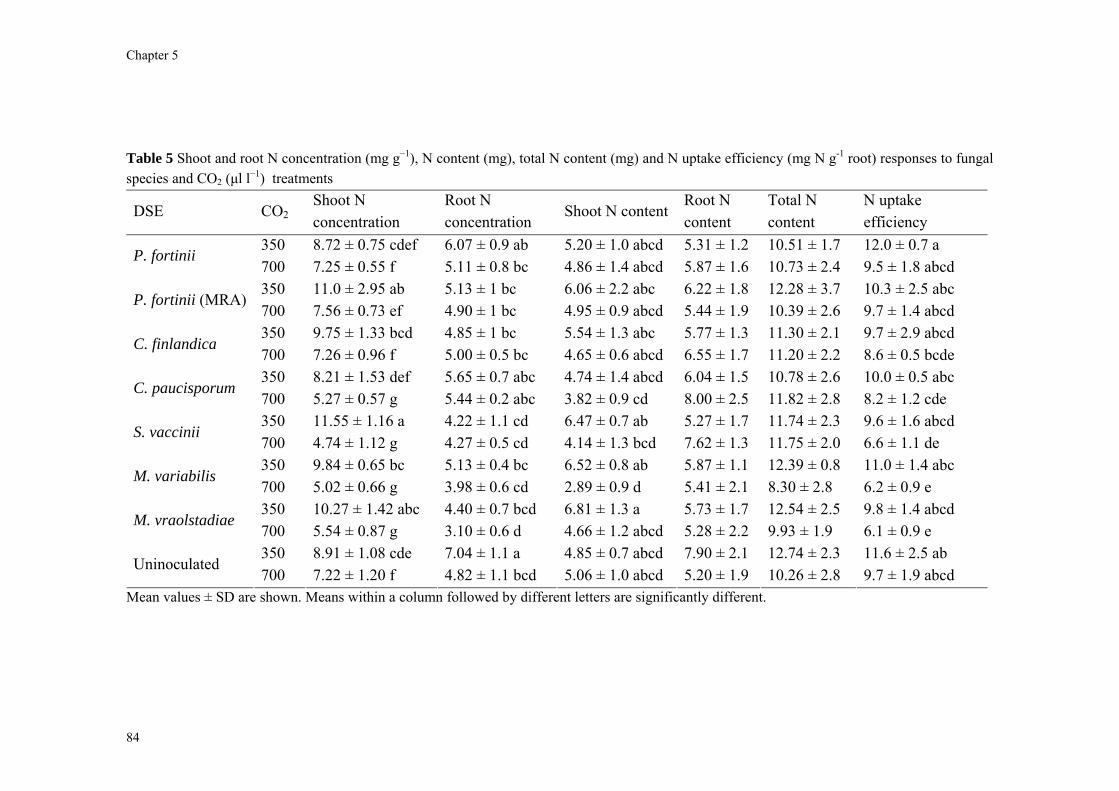
Ch
84
apter 5
Table 5 Shoot and root N concentration (mg g−1), N content (mg), total N content (mg) and N uptake efficiency (mg N g-1 root) responses to fungal species and CO2 (μl l−1) treatments
DSE CO2Shoot N concentration
Root N concentration
Shoot N content Root N content
Total N content
N uptake efficiency
350 8.72 ± 0.75 cdef 6.07 ± 0.9 ab 5.20 ± 1.0 abcd 5.31 ± 1.2 10.51 ± 1.7 12.0 ± 0.7 a P. fortinii
700 7.25 ± 0.55 f 5.11 ± 0.8 bc 4.86 ± 1.4 abcd 5.87 ± 1.6 10.73 ± 2.4 9.5 ± 1.8 abcd 350 11.0 ± 2.95 ab 5.13 ± 1 bc 6.06 ± 2.2 abc 6.22 ± 1.8 12.28 ± 3.7 10.3 ± 2.5 abc
P. fortinii (MRA) 700 7.56 ± 0.73 ef 4.90 ± 1 bc 4.95 ± 0.9 abcd 5.44 ± 1.9 10.39 ± 2.6 9.7 ± 1.4 abcd 350 9.75 ± 1.33 bcd 4.85 ± 1 bc 5.54 ± 1.3 abc 5.77 ± 1.3 11.30 ± 2.1 9.7 ± 2.9 abcd
C. finlandica 700 7.26 ± 0.96 f 5.00 ± 0.5 bc 4.65 ± 0.6 abcd 6.55 ± 1.7 11.20 ± 2.2 8.6 ± 0.5 bcde 350 8.21 ± 1.53 def 5.65 ± 0.7 abc 4.74 ± 1.4 abcd 6.04 ± 1.5 10.78 ± 2.6 10.0 ± 0.5 abc
C. paucisporum 700 5.27 ± 0.57 g 5.44 ± 0.2 abc 3.82 ± 0.9 cd 8.00 ± 2.5 11.82 ± 2.8 8.2 ± 1.2 cde 350 11.55 ± 1.16 a 4.22 ± 1.1 cd 6.47 ± 0.7 ab 5.27 ± 1.7 11.74 ± 2.3 9.6 ± 1.6 abcd
S. vaccinii 700 4.74 ± 1.12 g 4.27 ± 0.5 cd 4.14 ± 1.3 bcd 7.62 ± 1.3 11.75 ± 2.0 6.6 ± 1.1 de 350 9.84 ± 0.65 bc 5.13 ± 0.4 bc 6.52 ± 0.8 ab 5.87 ± 1.1 12.39 ± 0.8 11.0 ± 1.4 abc
M. variabilis 700 5.02 ± 0.66 g 3.98 ± 0.6 cd 2.89 ± 0.9 d 5.41 ± 2.1 8.30 ± 2.8 6.2 ± 0.9 e 350 10.27 ± 1.42 abc 4.40 ± 0.7 bcd 6.81 ± 1.3 a 5.73 ± 1.7 12.54 ± 2.5 9.8 ± 1.4 abcd
M. vraolstadiae 700 5.54 ± 0.87 g 3.10 ± 0.6 d 4.66 ± 1.2 abcd 5.28 ± 2.2 9.93 ± 1.9 6.1 ± 0.9 e 350 8.91 ± 1.08 cde 7.04 ± 1.1 a 4.85 ± 0.7 abcd 7.90 ± 2.1 12.74 ± 2.3 11.6 ± 2.5 ab
Uninoculated 700 7.22 ± 1.20 f 4.82 ± 1.1 bcd 5.06 ± 1.0 abcd 5.20 ± 1.9 10.26 ± 2.8 9.7 ± 1.9 abcd
Mean values ± SD are shown. Means within a column followed by different letters are significantly different.
Dark septate endophytic fungi under elevated CO2
N content of shoot and roots, and total plant N uptake were not affected by DSE (Table 2). In total 13.3 mg of mineral N was available for plant growth. Total N uptake ranged between 10.5 and 12.7 mg under ambient CO2, and between 8.3 and 11.8 mg at elevated CO2. Total N uptake declined under elevated CO2 by 12%. The decline was largest in plants inoculated with M. variabilis and M. vraolstadiae. N content of shoots declined by 32% under elevated CO2, whereas N content of roots did not change. Total N content was not significantly correlated with plant biomass, shoot or root dry weight. Likewise, shoot N content was not significantly correlated with plant C gain. Mycelium length was significantly negatively correlated with shoot N content (r = -0.70; P < 0.01).
Under ambient CO2 control plants allocated more N below-ground than plants inoculated with DSE, but under elevated CO2 control plants allocated less N below-ground than plants inoculated with DSE.
Nitrogen uptake efficiency (mg N content g−1 root dry weight) (NUpE) was significantly affected by DSE and CO2 levels (Table 2). The NUpE ranged between 9.6 and 12 under ambient CO2, and 6.1 and 9.7 under elevated CO2. In the treatments with M. variabilis and M. vraolstadiae under elevated CO2 NUpE was lowest, while inoculation with P. fortinii under ambient CO2 resulted in the highest NUpE (Table 5).
Discussion Fungal performance All seven DSE in this experiment were able to grow and colonize the roots of P. sylvestris seedlings. In an earlier experiment we had also tested Meliniomyces bicolor, an ECM fungus on conifer (pine, spruce) and hardwood (birch, southern beech) trees whose ECM morphotype is known as Piceirhiza bicolorata (Vrålstad et al., 2000; 2002a,b). Unfortunately that taxon did not colonize roots of pine seedlings under our experimental conditions. Strains of M. vraolstadiae have been described as mycorrhizal and non-mycorrhizal (Hambleton & Sigler, 2005). The strain used by us was non-mycorrhizal in resynthesis experiments (Vrålstad et al., 2000). Meliniomyces variabilis is also variable in its mode of living, with some strains forming ECM while other strains were obtained from ECM, ericoid mycorrhizal and AM roots (Hambleton & Sigler, 2005). The strain used by us was originally isolated from Rhododendron albiflorum. Cadophora finlandica is also variable in its mode of living. Wilcox & Wang (1987b) mentioned that the species could form ECM (including ectendomycorrhizas) on seedlings of Pinus, Picea and Betula. Hambleton & Sigler (2005) mentioned both ECM and ericoid mycorrhizal associations for the taxon. Villarreal-Ruiz et al.
85
Chapter 5
(2004) isolated a strain under the name C. finlandica that could both form functional ECM and ericoid mycorrhizas of the P. bicolorata type. Scytalidium vaccinii, the anamorph of Rhizoscyphus ericae is known as the ericoid mycorrhizal fungus par excellence. However, Hambleton & Sigler (2005) mentioned an isolate from Norway that was sampled from an ECM root of Pinus, while Piercey et al. (2002) reported that one strain of that fungus associated with roots of Picea mariana to form an intracellular association, just like M. variabilis. The inconsistent behavior of different strains of species of the Rhizoscyphus clade (including Meliniomyces and Cadophora) suggests that its life history strategy adopted could depend on experimental conditions, or alternatively that there is no relationship between taxonomy and its biology.
Phialocephala fortinii is considered the most important representative of the DSE. Stoyke et al. (1992) and Harney et al. (1997) showed that the large majority of DSE isolates were P. fortinii. Grünig et al. (2004) stated that the roots of every Picea abies tree in natural forests of Central Europe are colonized by P. fortinii. The species has been described as a co-inhabitant of ECM roots (Summerbell, 2005b) or an ECM fungus (Kaldorf et al., 2004). However, the species also seems to be very plastic in its ecological behavior (Menkis et al., 2004). Both strains of P. fortinii were very different in colonization of pine seedlings. It could be possible that differential behavior is due to the experimental conditions, the more as the second strain (P. fortinii – MRA) is already in culture for almost 60 years. Piercey et al. (2004) and Grünig et al. (2004) suggested that P. fortinii consists of at least 8 cryptic species, some of which occur sympatrically, even on the same root segment. Unfortunately, ITS sequences do not allow recognition of these cryptic species. We cannot therefore exclude that both strains belong to different cryptic species and that the differences reflect their independent evolutionary histories. Functional aspects of the relationship between pine seedlings and DSE The ecological role of DSE is still poorly understood, and results of studies between DSE fungi and their host plants are liable to multiple interpretations (Jumpponen & Trappe, 1998b). For P. fortinii, Jumpponen (2001) listed examples of negative, neutral and positive effects on plant performance. In order to quantify responses of host plants to DSE we performed a meta-analysis based on 8 studies (Cameron, 1998; Jumpponen et al., 1998; Jumpponen & Trappe, 1998b; Yu, 2000; Hashimoto & Hyakumachi, 2001; Schulz et al., 2002; Vohník et al., 2003; Jones & Smith, 2004). In total 36 data points were obtained. The meta-analysis showed a positive response ratio (inoculated/control = R) of 1.21 and the 95% confidence interval was 1.06 to 1.37. A subdivision of responses showed that shoot weight showed a neutral response (R = 1.05, n = 20), whereas root weight showed a positive response (R = 1.64, n = 9). Total dry weight also showed a positive response (R = 1.33, n = 7). The response ratio between shoot and root weight was significantly different (P < 0.005). The data
86
Dark septate endophytic fungi under elevated CO2
from our study show only a weak beneficial effect of DSE under ambient CO2 with no differences between shoot and root responses. The beneficial effect of DSE was larger under elevated CO2. Because root mass (+30%), extraradical hyphal length (+53%) and fractional colonization significantly increased under elevated CO2, rising CO2 could increase soil C sequestration, because melanized fungal hyphae (the case of DSE hyphae) decompose more slowly than hyaline hyphae (see Six et al., 2006). Barrow & Aaltonen (2001) mentioned that DSE also produce hyaline hyphae that stain rather poorly, and these hyphae could have been overlooked by us. Potential mechanisms for mutualistic behavior by DSE Mandyam & Jumpponen (2005) listed various mechanisms to explain the usually mutualistic nature of the interaction between DSE and host plant. These include improved nutrient uptake, especially of P, enhanced pathogen resistance, and the production of phytohormones (especially auxins). Next to the possibility that the beneficial effects of DSE are determined by their saprotrophic capabilities (Caldwell et al., 2000; Ruotsalainen, 2003), most mechanisms are based on a biotrophic mode of life for DSE. A mechanism through saprotrophy seems unlikely, however, considering the significantly higher hyphal length after 4 months at elevated CO2. In line with a biotrophic life style, Sieber & Grünig (2006) suggested that enhanced CO2 could affect DSE function, but noted that nothing was known about the direction and magnitude of effects.
Several of the proposed mechanisms could not be tested in our experiment. In order to control pH and prevent subsequent substrate acidification (which could affect the degree to which DSE are mutualistic – see Wilcox & Wang, 1987a) because the sole N source was ammonium, relatively large amounts of P were added. This rich P supply precluded testing for beneficial effects of DSE on P solubilization. Similarly, our axenic experimental system did not allow to test whether DSE increased plant performance and fitness through enhanced pathogen resistance.
Jumpponen et al. (1998) noted that the effects of P. fortinii on the growth of Pinus contorta were neutral at low N supply, but were positive at higher N supply. Kernaghan et al. (2003) observed that P. fortinii was more common in nurseries with higher levels of applied N, but that several other DSE including C. finlandica and Rhizoscyphus ericae (the perfect stage of S. vaccinii) were more common in nurseries with lower levels of N application. In our study, NUpE was significantly higher in the clade with both Phialocephala strains than in the Rhizoscyphus ericae s.l. clade (P < 0.001). It would therefore be important in future research to test the behavior of various DSE over a range of N availabilities.
In our study, inoculation of Scots pine with P. fortinii did not increase N uptake; and under elevated CO2 DSE reduced even N content of the pine seedlings. These data suggest increased competition for N between plant and fungus (Alberton et al., 2007) due to the fact
87
Chapter 5
that elevated CO2 allowed the fungus to produce more biomass. However, only a small part of the additional C was incorporated in fungal biomass and a large part of it was wasted in respiration (cf. Gorissen & Kuyper, 2000) through an overflow CO2 tap (Heinemeyer et al., 2007). Below-ground respiration of 14C accounted for 4-10% of the 14C budget under ambient CO2 and for 7-27% under elevated CO2. Below-ground carbon-use efficiency declined strongly under elevated CO2 for almost all treatments (except control plants and plants inoculated with M. vraolstadiae), also supporting the suggestion that a large amount of CO2 was wasted in respiration.
If elevated CO2 increases fungal immobilization of N, we would expect increased competition for N and decreased availability of N for the host plant, which potentially constrains ecosystem response to elevated CO2 (Reich et al., 2006; Hobbie et al., 2007). However, even under low N availability elevated CO2 led to increases in both above-ground and below-ground plant biomass. The mechanisms through which growth increases could be sustained, even under decreased N availability, merits further study. Behavioral differences and similarities between DSE and ECM fungi In an earlier experiment, Alberton et al. (2007) described the impact of seven different ECM fungi on the growth performance of Scots pine seedlings at ambient and elevated CO2. Because the same experimental conditions were applied in that experiment, a comparison between both experiments provides suggestions for different and similar mechanisms that result in behavioral differences and similarities between DSE and ECM fungi. In the study with ECM fungi there was a very significant negative correlation between the amount of the extraradical mycelium and plant performance (Alberton et al., 2007. Direct competition for N between plant and fungus increased when elevated CO2 decreased fungal C limitation, leading to progressive nitrogen limitation (Luo et al., 2004; Hu et al., 2006) constraining the ability of the pine seedlings to respond to elevated CO2. With DSE the situation was different. The amount of the extraradical mycelium was much smaller. Even though the fungi were also C-limited (as evidenced from a 53% increase in the length of the extraradical mycelium and an increase in root colonization under elevated CO2), hyphal length was not negatively correlated with plant C.
Furthermore, the increased sink strength of the ECM fungi resulted in a significant decline in shoot-to-root ratio of the seedlings, especially in seedlings that were inoculated with fungi that produce the largest amount of mycelium. For example, under elevated CO2 ECM plants significantly decreased shoot-to-root ratio. In the case of seedlings inoculated with DSE, elevated CO2 did not result in significant changes in shoot-to-root ratio. However, in seedlings inoculated with DSE, the ratio of shoot N-to-root N significantly decreased under elevated CO2 (P < 0.001), even though plant biomass increased.
88
Dark septate endophytic fungi under elevated CO2
In conclusion DSE responded differently under N limitation to elevated CO2 and were capable to form associations that showed functional similarities to mycorrhizas. Elevated CO2 increased the beneficial effect of DSE. Increased below-ground allocation under elevated CO2 might play an important role in soil C-sequestration because DSE hyphae decompose more slowly than hyaline hyphae. It would be important in future research to test the behavior of various DSE over a range of N availabilities. Acknowledgements This study was funded by the C.T. de Wit Graduate School for Production Ecology and Resource Conservation (PE&RC) of Wageningen University and Research Centre, the Netherlands. We thank Antonie Gorissen (IsoLife, Wageningen) for technical assistance.
89

Chapter 6
Chapter 6
General Discussion
Odair Alberton
Chapter 6
In this final Chapter I summarize the findings from the previous Chapters and discuss it in a more general context. I use a modeling approach based on path analysis to provide further insight on feedback mechanisms that root-inhabiting fungi, especially through their extraradical mycelium, exert on plants in the context of increasing CO2 levels and varying levels of N availability. Mycorrhizal functioning under elevated CO2
The increase of atmospheric CO2 will affect plant performance. Changes in plant performance could show both positive (Fig. 1A) and negative (Fig. 1B) feedbacks to atmospheric CO2 levels or neutral effects. This context dependency or conditionality of responses (Van der Heijden & Kuyper, 2001) is a function of experimental parameters, including choice of organisms. Under natural conditions, almost all plants are mycorrhizal, i.e. their roots associate with mutualistic fungi. It is therefore of interest how mycorrhizal fungi, when associated with the same plant species (Pinus sylvestris in this study) (co-)determine plant responses to elevated CO2. Positive feedback occurs if elevated CO2 releases the fungi from C-limitation, leading to an extension of the fungal mycelium (its nutrient acquiring structure), and if this larger mycelium enhances nutrient capture (Millard et al., 2007) and transfer to the host. Even when the fungus is C-limited, negative feedback could occur if the ecosystem is ‘saturated’ (O’Neill, 1994) with mycorrhizal mycelium, so that interhyphal distances are so small as to result in almost complete overlap of the depletion zones. The conceptual model in Fig. 1 is therefore different from the economic model by Johnson et al. (2006). The graphs in their paper imply that elevated CO2 inevitably results in enhanced nutrient uptake. Furthermore their model assumes symmetry in the interaction, because of the negative correlation between fungal C demand and fungal nutrient demand. As a consequence, the trade-off between plant and fungus is inevitably one of positive feedback, because the plant associates with the fungus from which it derives the largest benefit, and the fungus also derives more benefit from that plant than competing plant species (Bever, 2003; Kuyper & De Goede, 2004). However, under this positive feedback the very large number of mycorrhizal fungal species that associate with a plant are hard to explain. The model by Johnson et al. (2006) leads to the prediction that under elevated CO2 mycorrhizal fungal richness will decrease. The available literature did not provide evidence for that hypothesis.
In Chapter 2 and Appendix (Update) I showed through meta-analysis that both mycorrhizal fungi and mycorrhizal plants respond positively to elevated CO2 but that responses are only partly coordinated. The magnitude of the plant effect is 32% for arbuscular mycorrhizal (AM) plants and 12% for ectomycorrhizal (ECM) plants, whereas the average effect is 21% for AM fungi and 32% for ECM fungi (Appendix). Differential (and, in the case
92
General Discussion
of ECM systems, statistically different) plant and fungal responses to elevated CO2 support my main conclusion, viz. that a conceptual separation of phytocentric and mycocentric views is essential to improve our understanding of plant responses to elevated CO2. The magnitude of the mycorrhizal response in my meta-analysis was lower than the response in the meta-analysis by Treseder (2004) who noted a strong mycorrhizal fungal response to elevated CO2, by an average of 47%. Her study differs in two major respects from mine. She deliberately restricted her data to field studies. Furthermore, she only used fractional colonization as the fungal parameter. While the use of fractional colonization makes the comparison between AM and ECM fungi easier, because it uses the same metric in both cases, there are several problems with the use of fractional colonization, especially in the case of ECM fungi. Often ECM colonization is well above 90% in the field, and such high levels constrain responses to elevated CO2, because of the small fraction left over for colonization. In order to facilitate a comparison between her meta-analysis and mine, I tested whether fractional colonization and the amount (length, biomass) of the extraradical mycelium responded similarly. I demonstrated that extraradical mycelium performance parameters showed a significantly higher response ratio than fractional fungal colonization in ECM fungi (Chapter 2 and Appendix). However, in AM fungi the difference was not significant. Treseder (2004; see also Garcia et al., 2008) did not provide arguments why fractional colonization would be superior over performance of the extraradical mycelium to assess fungal response. In Chapter 2, I argued that measurement of fractional colonization is an unsuitable index to determine fungal responses to elevated CO2. Fractional colonization is the result of plant root growth and fungal growth on or around roots. A differential effect of elevated CO2 on both parameters can be positive, if the negative response of the fungus is smaller than the negative response of the plant, or negative, if the positive response of the fungus is smaller than the positive response of the plant (e.g. Sanders et al., 1998; Rillig & Allen, 1999; Allen, 2001; Rillig et al., 2002a).
Differences in the response ratio between the extraradical mycelium and fractional colonization, and differences in the response ratio between ECM fungi and plants support the need for conceptually separating mycocentric and phytocentric views as advocated by Fitter (2001). Old models of mycorrhizal feedbacks to elevated CO2 did not make this conceptual separation and treated the fungi primarily as an extension of the root system. Under such a model elevated CO2 will increase C availability to the fungus, resulting in increased uptake of limiting nutrients such as N and phosphorus (P), finally resulting in enhanced plant performance as a result of this positive feedback. However, under a mycocentric view elevated CO2 will increase C availability for the fungus, by which the fungus increases its own biomass and fitness, irrespective whether this increased fungal fitness will feed back into enhanced nutrient uptake, transfer to the host and increased plant performance.
93
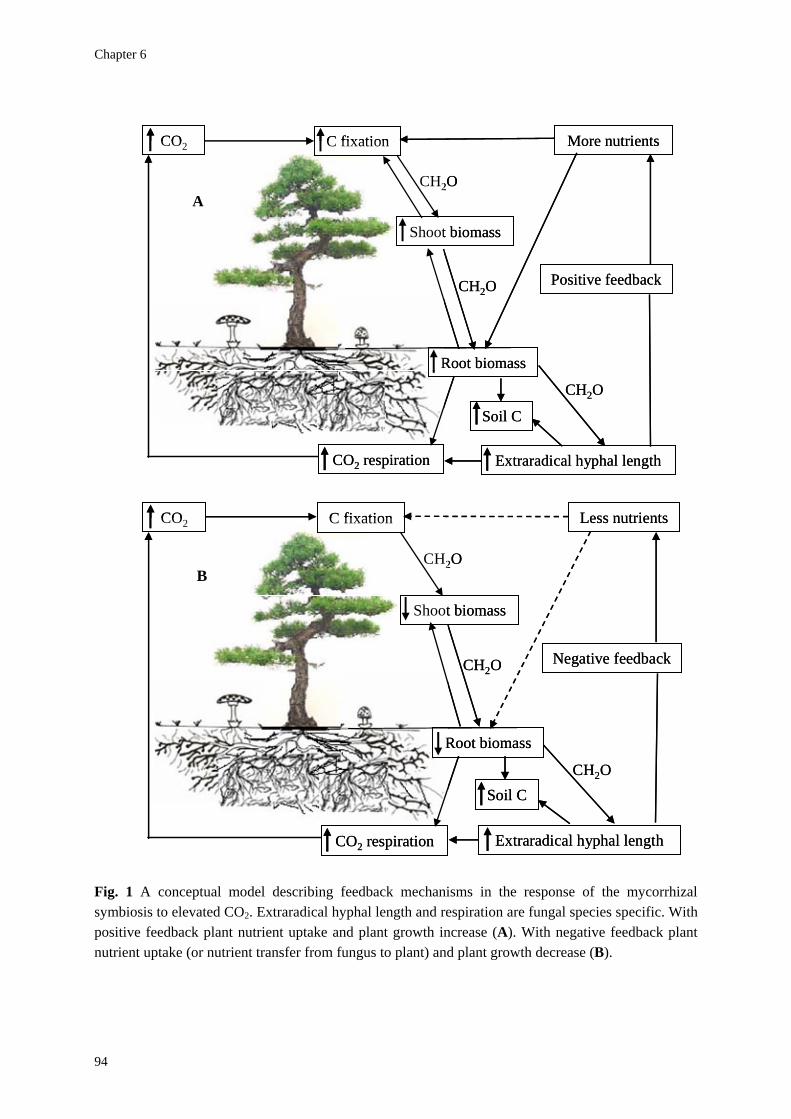
Chapter 6
CO2 C fixation
Shoot biomass
Root biomass
Extraradical hyphal lengthCO2 respiration
More nutrients
Positive feedback
Soil C
CH2O
CH2O
CH2O
A
CO2 C fixation
Shoot biomass
Root biomass
Extraradical hyphal lengthCO2 respiration
More nutrients
Positive feedback
Soil C
CH2O
CH2O
CH2O
A
CO2 C fixation
Shoot biomass
Root biomass
Extraradical hyphal lengthCO2 respiration
Less nutrients
Negative feedback
Soil C
CH2O
CH2O
CH2O
B
CO2 C fixation
Shoot biomass
Root biomass
Extraradical hyphal lengthCO2 respiration
Less nutrients
Negative feedback
Soil C
CH2O
CH2O
CH2O
B
Fig. 1 A conceptual model describing feedback mechanisms in the response of the mycorrhizal symbiosis to elevated CO2. Extraradical hyphal length and respiration are fungal species specific. With positive feedback plant nutrient uptake and plant growth increase (A). With negative feedback plant nutrient uptake (or nutrient transfer from fungus to plant) and plant growth decrease (B).
94
General Discussion
Increased fungal biomass in fact often increases competition for nutrients between plants and fungi (Chapter 2). This conclusion is supported by larger mycelial dry weight (R = 1.48), mycelial area (R = 1.39), hyphal length in root free compartment (R = 1.57), and 14C incorporation in biomass (R = 1.34), and in combination with decreased N and P concentrations of the ECM fungus (R = 0.82 and 0.70, respectively) (Appendix). As a consequence of increased nutrient competition, the carbon use efficiency of fungi can decrease, resulting in a higher C respiration by the fungus. This pattern of decreased below-ground C-use efficiency was observed by Gorissen & Kuyper (2000) for Laccaria bicolor but not for Suillus bovinus, suggesting the importance of fungal species-specific differences in nutrient demand. The meta-analysis (Appendix) indicated a large variation in fungal carbon use efficiency (CUE), but did not suggest that fungal CUE consistently decreases under elevated CO2. Next to technical problems in assessing fungal CUE (see Chapter 3, where I failed to determine this parameter), the interaction between N availability and fungal CUE could be responsible for this large variation. Because of the apparent importance of ECM fungal behavior to elevated N availability, another major driver of global change (Lilleskov et al., 2002; Rillig et al., 2002a; Taylor et al., 2003; Treseder, 2004), the way fungal N use feed backs to both fungal C use and plant performance requires more attention.
While for ECM symbioses the need to separate mycocentric and phytocentric perspectives is evident, the pattern for AM symbioses is less clear (Chapter 2 and Appendix). It may be possible that this difference between ECM and AM symbioses reflects a genuine difference in mycorrhizal functioning. The amount of extraradical mycelium of ECM fungi is an order of magnitude larger than that of AM fungi. This could result in a larger potential for nutrient immobilization even if the fungi respond similarly to additional C. Considering these differences in the amount of extraradical mycelium, an increase in mycelial size has a lower chance in increasing nutrient uptake for ECM fungi than for AM fungi, even in the case of uptake of the same immobile elements. This possibility had been raised before by O’Neill (1994), who in her review suggested that undisturbed ecosystems may be ‘saturated’ with regard to mycorrhizal hyphae and suggested that ECM fungi may respond more strongly in N immobilization than AM fungi. O’Neill’s hypothesis that ECM fungi responded more strongly than AM fungi under elevated CO2 was confirmed in the meta-analysis (Appendix). This issue of mycelial abundance being larger than optimal from the plant’s perspective for uptake rates should be further explored in models of nutrient uptake by mycorrhizal fungal mycelia.
Schnepf & Roose (2006) modeled the contribution of AM fungi in nutrient uptake. They concluded that the fungal pathway of phosphate uptake rapidly and almost completely dominated over the plant pathway, assuming the same kinetic properties of the uptake system. Their model also indicated that hyphal depletion zones very quickly (within 8 hours!) overlapped. The degree of depletion could, however, have been overestimated because that critically depends on the part of the hyphal length over which nutrients can be taken up (uptake only at hyphal tips versus uptake over the whole mycelium). They finally noted that
95
Chapter 6
their model included almost instantaneous translocation of phosphate from fungus to plant, because nutrient uptake was assumed to be always above fungal need. For ECM, the conditions are different because almost all root tips are covered by the ECM fungal sheath and there is very little, if at all, direct contact between plant tissue and soil solution. Extrapolating their model to ECM systems, where as mentioned the fungal pathways accounts for 100% of the uptake pathway and where hyphal length is an order of magnitude larger than in the case of AM systems, suggests that both the zone over which active uptake takes place, and the degree to which nutrient uptake is above fungal demand, are critical parameters that experimentalists should determine to improve mycorrhizal uptake models. Another relevant model of fungus – plant interactions in mycorrhizal associations was recently published by Landis & Fraser (2008). Their model also challenges the assumption of coordinated responses, and introduces the possibility that C and nutrient transfer are quantitatively unlinked. The authors suggested that one of the benefits of their model is that its allows for nutrient competition between plant and fungus (and suppression of plant growth) at low soil nutrient levels. Their model, which implies that mycorrhizal associations have the capacity for both negative and positive feedbacks, was made for AM symbioses and focused on P, but the authors implied that it is flexible enough to be adapted to study ECM associations and N.
I found that under elevated CO2 (and at low N availability) shoot-to-root ratio decreased more strongly in plants colonized by ECM fungal species with the largest extraradical mycelium (Chapter 3). Under elevated CO2 under N limitation ECM root growth increased significantly more than hyphal growth. This could imply plant control over fungal performance at strong N limitation. Extraradical hyphal length was significantly negatively correlated with shoot biomass, shoot N content, and total plant N uptake. Fungal sink strength for N strongly affected plant growth through N immobilization. This mycorrhizal fungal-induced progressive nitrogen limitation (PNL) has the potential to generate negative feedback on plant growth under elevated CO2. Furthermore, non-mycorrhizal plants performed equally well or significantly better than in some mycorrhizal treatments. Especially plants colonized by H. cylindrosporum showed a significantly lower growth performance. Basically, two related hypotheses have been forwarded to explain lower growth performance of mycorrhizal plants compared to non-mycorrhizal plants. The first hypothesis focuses on C costs for the mycorrhizal fungus, while the second hypothesis focuses on nutrient immobilization by the mycorrhizal fungus.
Under the first hypothesis increased C availability (through higher rates of photosynthesis) would decrease relative C costs to maintain the mycorrhizal fungus. One corollary following from that hypothesis would be that increased CO2 availability reduces C costs and hence decreases growth reduction. Increased sink strength for C in mycorrhizal associations does not seem to be the cause of the growth reduction pointing at the importance of fungal sink strength for N.
I interpret the results of Chapter 3 as support for the second hypothesis, indicating that growth reduction of mycorrhizal plants was due to N immobilization in the extraradical
96
General Discussion
mycelium under low N availability condition. A N balance showed that under ambient CO2, 76% of the mineral N that was in or added to the system could be accounted for in shoots and roots of non-mycorrhizal plants, and that mycorrhizal colonization reduced that to on average 67%. Under elevated CO2, 89% of N in the system could be accounted for in shoots and roots of non-mycorrhizal plants, and in ECM plants this was on average 68%. Plants colonized by H. cylindrosporum, where a very high length of extraradical mycelium was recorded, remained the smallest, despite the high below-ground investment. Because of the C compounds associated with the immobilization of N, the extraradical mycelium of Hebeloma species has been noted to be a large modifier of plant photosynthesis and carbohydrate metabolism (Miller et al., 1989; Rygiewicz & Andersen, 1994; Marmeisse et al., 1999). Colpaert et al. (1992) demonstrated a negative correlation between mycelial size and the growth of P. sylvestris seedlings and in a subsequent study, Colpaert et al. (1996) suggested that growth reduction of pine seedlings colonized by Scleroderma citrinum was best explained by the N-drain through immobilization. One would therefore predict a negative correlation between nutrient availability and plant costs to sustain the mycorrhizal association (Hobbie, 2006; Landis & Fraser, 2008).
The underlying mechanism of mycorrhizal fungal-induced PNL (mycelial size determines fungal N immobilization potential and hence plant N concentration and content) was confirmed in Chapter 3. While laboratory evidence for nutrient (N) retention by ECM fungi resulting in reduced plant growth was also provided by Nylund & Wallander (1989), Dosskey et al. (1990, 1991), Colpaert & Verstuyft (1999), and Fransson et al. (2005), the question is relevant whether the same mechanism also occurs under field conditions. Instances of very strong N-limitation of ECM mycelial growth have been reported from several boreal and arctic ecosystems (Hendricks et al., 2006; Clemmensen et al., 2006; Wallander, 2006). There is also field evidence for N-limitation of arbuscular mycorrhizal fungi (Treseder & Allen, 2002; Allen et al., 2005). It is therefore likely that mycorrhizal fungal-induced PNL can indeed occur under field conditions and will ultimately constrain mycorrhizal plant responses to elevated CO2 (Johnson, 2006; Hu et al., 2006).
Further indirect evidence for mycorrhizal-fungal induced PNL comes from N concentration. In Chapter 3, shoot and root N under ambient CO2 ranged between 7 and 12 mg g–1, and under elevated CO2 between 6 and 7 mg g–1. Especially these latter values are clearly below the deficiency limit of 10 mg g–1 as mentioned by Reuter et al. (1997) for pines. Similar low plant N concentrations were also observed in northern Finland in Scots pine and Norway spruce (Picea abies) stands on very poor soils (Helmisaari et al., 2007) with root N concentrations between 5 and 8 mg g-1, indicating that this degree of N-limitation also occurs in natural systems. The high N retention by mycorrhizal hyphae apparently limits plant growth given the fact that the non-mycorrhizal plants grew somewhat better than the mycorrhizal plants.
The differences between fungal species could very well be explained through one factor only, size of the extraradical mycelium in Chapter 3. Differences in C to N exchange
97
Chapter 6
ratios in the fungus were clearly of limited importance. When plant growth is limited by nutrients, plants undergo morphological and physiological modifications. By changing the functional equilibrium between shoots and roots, plants allocate more C to below-ground structures for nutrient acquisition. If plants allocate more biomass to the organs that are involved in the acquisition of the resource that is currently most limiting, one would predict that elevated CO2 would decrease shoot: root ratio. The Chapter 3 data are consistent with that prediction and shoot: root ratios declined under elevated CO2 from 0.67 to 0.45 and the largest reduction in shoot: root ratio occurred in plants that were colonized by those ECM fungal species that had the largest extraradical mycelium and lowest N concentration in shoots under elevated CO2, viz. L. bicolor and H. cylindrosporum. The observation that fungal sink strength for N constrains plant response to elevated CO2 supports the claim that the size of the extraradical mycelium generates potential for negative feedback through PNL (Hu et al., 2006).
The very severe nutrient limitation to which the mycorrhizal plants were exposed in the experiment described in Chapter 3, could possibly explain why only the size of the extraradical mycelium was an explanatory variable, and why fungal species-specific differences in C to N exchange were of such limited importance. In order to explore that possibility, it was imperative to execute a similar experiment under higher levels of N availability. In Chapter 4, three ECM fungal species, chosen to cover the range of variation in Chapter 3 and to cover the range from nitrophobic to nitrophilic or nitrotolerant fungi, were tested for their species-specific responses to both C and N availability. Fungal identity matters from a phytocentric perspective because fungi differ in their sink strength for C and N. Gorissen & Kuyper (2000) observed that the nitrophobic S. bovinus had a higher demand for C than the nitrophilic species L. bicolor, and that L. bicolor had a higher demand for N than S. bovinus. Both N deposition and elevated CO2 have the potential to change ECM fungal assemblages. Increasing N deposition usually selects against fungal species that form a large extraradical hyphal biomass (Lilleskov et al., 2001, 2002; Parrent et al., 2006; Wallander, 2006), and increasing CO2 levels have been reported to select for such fungal species (Godbold & Berntson, 1997).
Extraradical hyphal length showed ECM fungal species-specific differences and was affected by CO2 level and by the interaction between ECM species with N supply (Chapter 4). Under elevated CO2 extraradical hyphal length was 37% (at low N supply) and 87% (at high N supply) higher than at ambient CO2. Increasing N availability decreased extraradical hyphal length of S. bovinus and H. cylindrosporum but increased hyphal length in L. bicolor by 23%. While the response to increased N for S. bovinus and L. bicolor fits with their classification as nitrophobic and nitrophilic, the response of H. cylindrosporum was more difficult to understand. It was the most effective competitor for N with the seedlings (lowest N content of seedlings, largest extraradical hyphal length), although it was also sensitive to N supply. Further work related to the classification and the underlying mechanism(s) of fungal strategies along the continuum from nitrophobic to nitrophilic is therefore important, the more so
98
General Discussion
because the data by Gorissen & Kuyper (2000) and the model by Johnson et al. (2006) suggest a trade-off between fungal nutrient limitation and C limitation.
In a recent meta-analysis of soil CO2 efflux partitioning between heterotrophic (saprotrophic organisms) and autrotrophic (plant roots and associated mycorrhizal fungi), Subke et al. (2006) suggested that higher levels of photosynthesis do not translate into higher C sequestration, but simply in a faster transport of C through plants to return to the atmosphere. Högberg & Read (2006) argued for the need to conceptually separate the contributions that plant roots and mycorrhizal fungi make to this autotrophic respiration. In Chapter 4, below-ground 14C respiration of mycorrhizal seedlings corresponded by 14 to 21% of total 14C assimilated and of non-mycorrhizal pine seedlings only 9%, even though non-mycorrhizal plants were of similar size as mycorrhizal plants. The need for separating the plant and fungal contribution also follows from studies by Gorissen & Kuyper (2000) and Heinemeyer et al. (2007) who mentioned the CO2 overflow tap through which mycorrhizal fungi directly return additional C to the atmosphere. The results in Chapter 4 provided further support for this overflow mechanism for both L. bicolor and S. bovinus, but not for H. cylindrosporum.
The observation that fungal sink strength for N constrains plant response to elevated CO2 and that fungal sink strength for C is increased at higher N levels supports the claim that the size of extraradical mycelium generates potential for negative feedback through PNL (Luo et al., 2004; Johnson, 2006; Hu et al., 2006; Reich et al., 2006; Chapter 3). PNL has been mentioned as a major cause that constrains and ultimately decreases plant responses to rising levels of atmospheric CO2 (De Graaff et al., 2006; Van Groenigen et al., 2006). It is less clear whether the same mechanism also occurs under field conditions. The meta-analysis (Appendix) showed that ECM plant responses were much more constrained under elevated CO2 in the laboratory than in the field, whereas the opposite was noticed for ECM fungi. That result could suggest lack of ecological realism in laboratory experiments, with the implication that the conceptual separation between phytocentric and mycocentric views is largely artificial. However, I would argue against this pessimistic conclusion. The substantial difference between the experiments in the lab and under field conditions from the fungal perspective could also be due to differential assessment of extraradical mycelium (in the lab) or fractional colonization (in the field). Further analysis of the data did not show this to be the case. From the plant perspective differences between laboratory and field experiments could be due to differential nutrient levels. Further analysis indicated that field experiments were more often done under higher nutrient levels, thereby relaxing competition between plants and fungi to an extent that is not completely realistic.
In a recent paper Finzi et al. (2007) observed for four experimental forests an increase in net primary production of 23% under elevated CO2 levels that are predicted for the latter half of this century. That conclusion seems also at variance with the hypothesis of PNL and with one of the main conclusions of my thesis. In their paper they also assessed N productivity (the inverse of N concentration). In all four forests N productivity significantly increased (i.e. N concentrations significantly decreased), indicating increased nutrient
99
Chapter 6
limitation, consistent with my observations in Chapter 3 and 4. In three forests (but not in the Populus stand in Italy) total N uptake significantly increased, which suggests that these systems are not saturated with mycorrhizal fungi. One of these forests is an AM forest stand (with Liquidambar styraciflua), while two stands are dominated by ECM trees. The Rhinelander stand is a young stand, where canopy closure took place just before the data on primary productivity were collected (Norby et al., 2005). Assuming that above-ground canopy closure would roughly coincide with below-ground root closure, these data suggest that the system was not yet saturated, and that such results can not be scaled up to mature forests. The Duke forest (consisting of a rather mature stand of Pinus taeda) apparently confirms the conclusion by Finzi et al. (2007) of higher forest productivity under elevated CO2. Curiously, the data by Finzi et al. (2002) showed significantly higher pools of C (on average + 14%) and N (+ 11%) in pine needles during 1997-2000, but no changes in C (+ 2%) and N (+ 1%) pools belowground. N supply in the elevated CO2 plots was somewhat, though not significantly, better than in the ambient plots (+12%) and this could also have affected productivity. I am therefore not convinced that Finzi et al. (2007) have unambiguously shown that in ECM forests elevated CO2 results in elevated N uptake through increased fine root production and/ or increased allocation to ECM fungi.
Roles of Dark Septate Endophytes under elevated CO2
Sieber & Grünig (2006) suggested that elevated atmospheric CO2 levels could affect Dark Septate root Endophytic fungi (DSE), but noted that nothing is known about the direction and magnitude of effects and that even their function is still obscure. I therefore tested, at low N availability and at two CO2 levels, seven DSE strains that were able to grow in culture and colonize the roots of P. sylvestris seedlings (Chapter 5). None of the DSE strains caused mortality in the host. Even though under elevated CO2 extraradical hyphal length increased by 53%, this enlarged sink did not create significant competition for soil N and plants. In fact seedlings inoculated with DSE allocated more N to roots than uninoculated controls or seedlings grown under ambient CO2.
Phialocephala fortinii is considered the most important representative of the DSE. Both strains of P. fortinii tested were very different in fractional colonization of pine seedlings (Chapter 5). Piercey et al. (2004) and Grünig et al. (2004) suggested that P. fortinii consists of at least 8 cryptic species, some of which can co-occur on the same root segment. Possibly both strains belong to different cryptic species with differential behavior reflecting their independent evolutionary histories. However, I cannot exclude that differential behavior is due to artificial conditions, since the second strain (P. fortinii – MRA) is already in culture for almost 60 years.
100
General Discussion
I also performed a meta-analysis of DSE effects on plant growth, using 9 studies that yielded 48 data points (Chapter 5). The meta-analysis showed a positive response ratio in plant growth, on average an increase of 14%. A subdivision of responses showed that shoot weight response was neutral (R = 1.03, n = 28), whereas root weight showed a positive response (R = 1.40, n = 13). The results in Chapter 5 showed only a weak beneficial effect of DSE under ambient CO2 with no differences between shoot and root responses, but a larger beneficial effect of DSE under elevated CO2.
The inoculation of pine seedlings with P. fortinii did not increase N uptake; and under elevated CO2, DSE reduced even plant N content (Chapter 5). These results suggest increased competition for N between plant and fungus due to the fact that elevated CO2 allowed the fungus to produce more biomass. However, only a small part of additional C was incorporated in fungal biomass and a large part of it was wasted in respiration through an overflow CO2 tap (cf Heinemeyer et al., 2007). Below-ground respiration of 14C accounted by 4 to 10% of the 14C budget under ambient CO2 and for 7 to 27% under elevated CO2. Below-ground C-use efficiency declined under elevated CO2 for almost all treatments, also supporting the suggestion that a large amount of CO2 was wasted in respiration.
Jumpponen et al. (1998) noted that the effects of P. fortinii on the growth of Pinus contorta were neutral at low N supply, but were positive at higher N supply. Kernaghan et al. (2003) observed that P. fortinii was more common in nurseries with higher N levels, but that several other DSE including Cadophora finlandica and Rhizoscyphus ericae were more common in nurseries with lower levels of N application. It would therefore be important in future research to test the behavior of various DSE over a range of N availabilities, just as in the case of ECM fungi. Path analysis My study does not provide the final answer how to scale up experiments with ECM fungi under controlled conditions to the functioning of ECM forests under a world of global change (elevated CO2 levels, and also increased N availability in many places around the world). At the same time, my experiments have confirmed the need to conceptually separate phytocentric and mycocentric views. In order to provide some quantification of the degree to which ECM and plants and fungi (and DSE fungi) exert control over the symbiosis (and hence the degree to which responses are or are not coordinated) under different levels of C and N, I applied path analysis. Based on the experiments described in Chapters 3, 4 and 5, I assessed the strength of several pathways as a function of both C and N availability. I also used path analysis to explore the potential for a common framework of integrating phytocentric and mycocentric perspectives in studying mycorrhizal responses to global change.
101
Chapter 6
Path analysis is a statistical method, a type of multiple regression analysis for modeling the correlation structure among variables, allowing complex patterns of inter-relationships to be tested. I used the AMOS 7.0 software package (Arbuckle, 2006) to calculate path coefficients and squared multiple correlations of the models. Path analysis modeling techniques do not allow determination or testing of causality between variables. Rather a priori knowledge of the system or theoretical backgrounds is used to construct a conceptual model (path diagram) of the causal relationships among the measured variables and then the data are used to assess the performance of the model (Jastrow et al., 1998). For each connecting path between variables, a path coefficient can be calculated. These path coefficients are equivalent to the standardized partial regression coefficients of multiple regression, and represent the effect of one variable on another dependent variable, with all other variables held constant (Mitchell, 1992).
I treat extraradical hyphal length (EHL) as the central component of the conceptual model, to emphasize the mycocentric view (Chapter 2). In the model, the entry point for the CO2 effect as an independent variable is represented by the shoot and root biomass, whereas below-ground 14C respiration represents the C-efflux from the system (above-ground respiration was not measured and could not be included in the model). Shoot biomass (considered as a proxy for photosynthesis) is regarded in the model as the C source and EHL as the C sink, which implies that increased C sink strength of the fungus leads to a decrease in shoot biomass – unless the EHL increases N uptake (resulting in higher N concentration and hence a larger N source). Changes in EHL may transform the EHL into a N source or N sink. When EHL is sub-optimal (acquisition limitation), EHL acts as N source because more hyphae are becoming available for N acquisition. However, when EHL is optimal (or even supra-optimal, as in cases of mycorrhizal ‘saturation’), EHL immobilizes N and acts as sink. For this reason, shoot N content and EHL were presented with their squared multiple correlations in Figs 2-4. For other variables, I only showed standardized partial regression path coefficients significant at P < 0.05 (Pearson two-tailed t-test).
Several previous studies have also applied path analysis modeling techniques in AM systems to determine the relative influence of EHL on soil and plant parameters (e.g. Miller & Jastrow, 1990; Jastrow et al., 1998; Rillig at al., 2002b; Augé et al., 2003; 2007).
Next to the path model depicted in Figs 2-4, I also tried alternative path models. As a first alternative I tried to explicitly include a feedback mechanism from shoot N content to shoot biomass. However, path analysis is based on the assumption of a linear causal chain (Mitchell, 2001). Consequently, that path model yielded irrelevant results, including both path coefficients larger than unity and negative variances (squared multiple correlations).
As a second alternative I modeled an exclusive mycocentric approach, where extraradical hyphal length (nutrient uptake capacity) was the underlying causal factor. That model explained most variance through shoot biomass (a proxy for photosynthesis). It is not surprisingly that this path model indicated the shortcoming of an exclusive mycocentric model because C availability for the fungus was eliminated.
102
General Discussion
Fig. 2A shows the path coefficients estimated for the experiments of Chapter 3 that included 7 different ECM fungi (non-mycorrhizal control seedlings were for obvious reasons not considered) under ambient CO2 and Fig. 2B shows the results under elevated CO2. N availability was low in this experiment. Shoot N content explains around 60% of the variation in the model in both ambient and elevated CO2, EHL explains 35% of the total variance under ambient CO2 and 20% under elevated CO2 (Table 1 and Fig. 2A; 2B). Under ambient CO2, EHL is significantly positively correlated with root N concentration (r = 0.36) but under elevated CO2, this correlation is not significant (Table 2 and Fig. 2A; 2B). For the shoot N concentration the opposite pattern is noted: no correlation at ambient CO2, and a significantly negative correlation (r = -0.44) under elevated CO2. Under both CO2 levels, EHL is significantly negatively correlated with shoot N content (r = -0.40 and -0.38, respectively). The differential effect of EHL on N concentration of roots and shoot under different CO2 levels suggests decreased coordination and increasing N competition between plant and fungus under increasing CO2 concentration, consistent with the hypothesis of PNL driven by the fungal sink strength for N.
The path analysis results from Chapter 4 are depicted in Fig 3 (A-D). Both EHL and shoot N content explained 35% of total variation under ambient CO2 and low N level (Table 1 and Fig. 3A). Elevated CO2 levels improved the explanatory value of the model for both shoot N content and EHL, whereas increasing N levels substantially decreased the explanatory value of these variables. Apparently, under high N conditions plant behavior cannot be adequately explained by a variable representing the mycocentric perspective, whereas elevated CO2 makes this perspective almost imperative. The negative correlation between EHL and shoot N content (interpreted as evidence for direct fungal plant competition for N) disappeared at high N and ambient CO2. Some pathways remain difficult to understand, for instance the negative correlation between EHL and below-ground respiration at low N and elevated CO2 compared to the positive correlation at ambient CO2 (Fig. 3A, B). It is not clear whether this result is due to technical problems in measuring below-ground respiration or to the (as yet unexplained) behavior of Hebeloma cylindrosporum, a fungus that did not allow placement along the continuum from nitrophobic to nitrophilic or nitrotolerant.
For DSE a path analysis was also executed. In general, EHL and shoot N content has less explanatory value than in the case of ECM systems. The explanatory value also decreased at elevated CO2. Except for the correlation between hyphal length and root dry weight, which was only significant at ambient CO2, and between root and shoot dry weight, which was only significant at elevated CO2, there were few differences between both CO2 levels (Table 1, Fig. 4A and 4B). Possibly, DSE react differently to global change than ECM fungi, indicating that there are limits to the degree of similarity in mutualistic function between both groups. The EHL correlates significantly negatively with shoot N content and concentration, but not with shoot dry weight (Table 2). Apparently, the impact of DSE is more through improved nutrient use efficiency by the plant than through enhanced nutrient acquisition as in ECM systems.
103
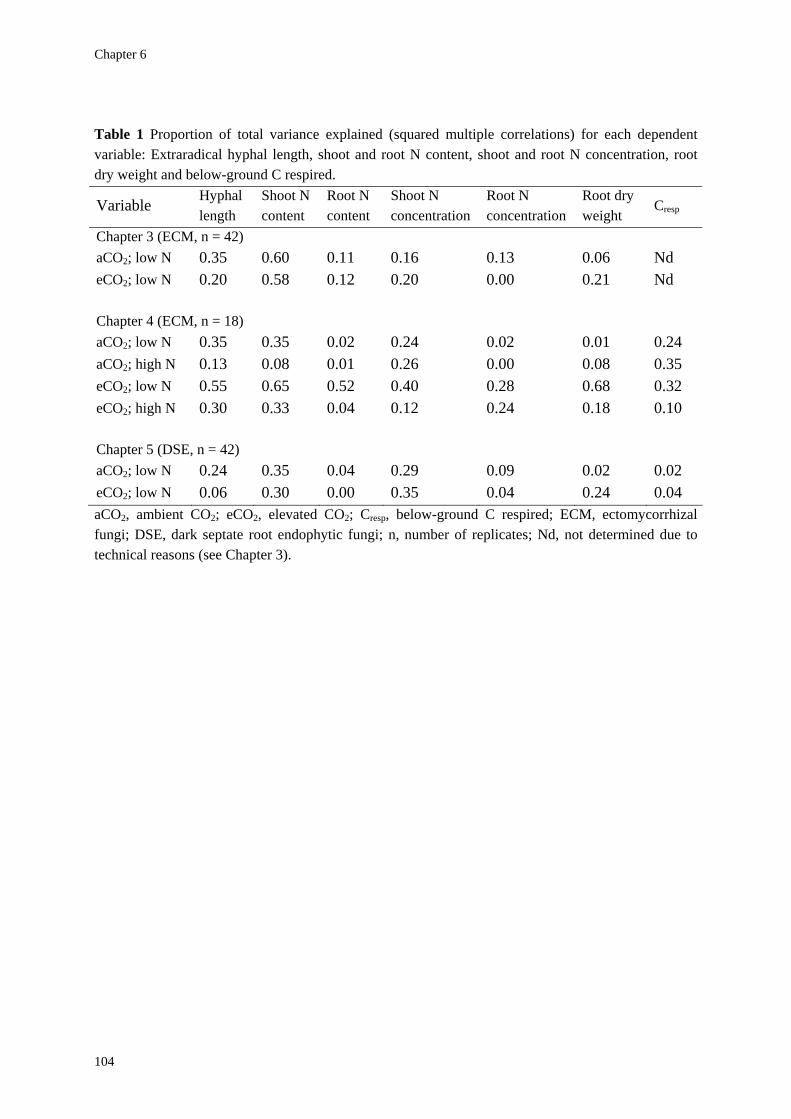
Chapter 6
Table 1 Proportion of total variance explained (squared multiple correlations) for each dependent variable: Extraradical hyphal length, shoot and root N content, shoot and root N concentration, root dry weight and below-ground C respired.
Variable Hyphal length
Shoot N content
Root N content
Shoot N concentration
Root N concentration
Root dry weight
Cresp
Chapter 3 (ECM, n = 42) aCO2; low N 0.35 0.60 0.11 0.16 0.13 0.06 Nd eCO2; low N 0.20 0.58 0.12 0.20 0.00 0.21 Nd Chapter 4 (ECM, n = 18) aCO2; low N 0.35 0.35 0.02 0.24 0.02 0.01 0.24 aCO2; high N 0.13 0.08 0.01 0.26 0.00 0.08 0.35 eCO2; low N 0.55 0.65 0.52 0.40 0.28 0.68 0.32 eCO2; high N 0.30 0.33 0.04 0.12 0.24 0.18 0.10 Chapter 5 (DSE, n = 42) aCO2; low N 0.24 0.35 0.04 0.29 0.09 0.02 0.02 eCO2; low N 0.06 0.30 0.00 0.35 0.04 0.24 0.04 aCO2, ambient CO2; eCO2, elevated CO2; Cresp, below-ground C respired; ECM, ectomycorrhizal fungi; DSE, dark septate root endophytic fungi; n, number of replicates; Nd, not determined due to technical reasons (see Chapter 3).
104
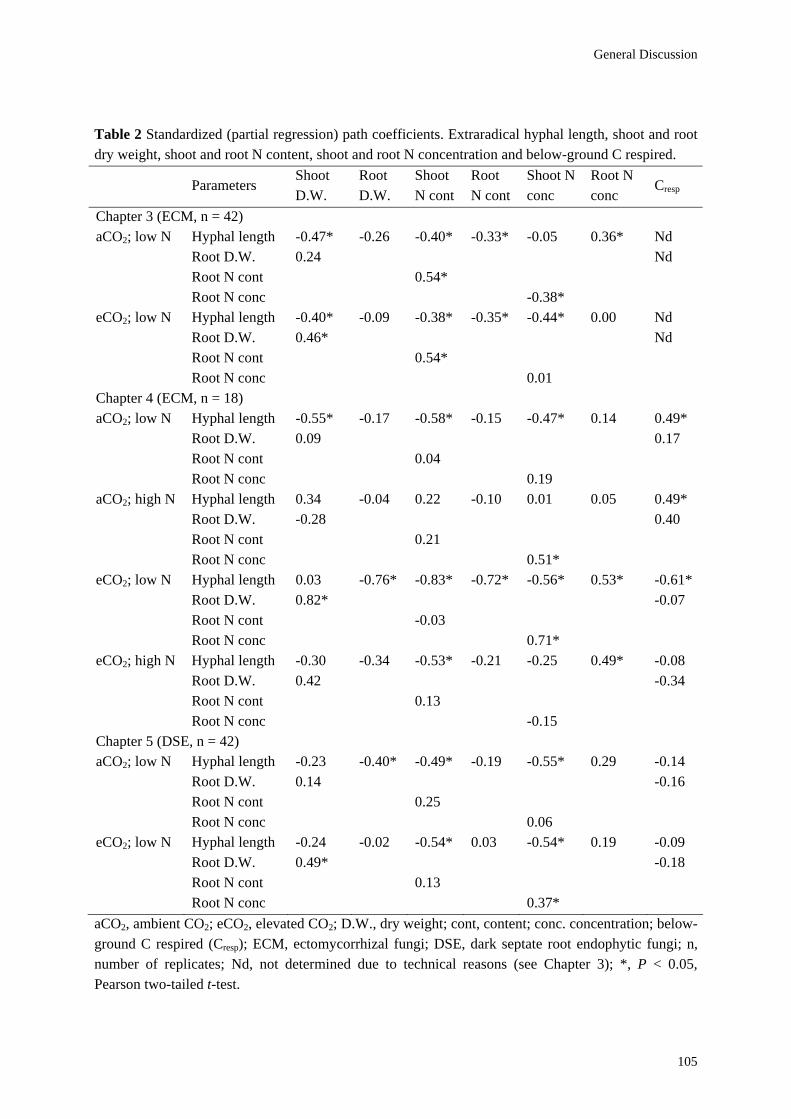
General Discussion
Table 2 Standardized (partial regression) path coefficients. Extraradical hyphal length, shoot and root dry weight, shoot and root N content, shoot and root N concentration and below-ground C respired.
Parameters Shoot D.W.
Root D.W.
Shoot N cont
Root N cont
Shoot N conc
Root N conc
Cresp
Chapter 3 (ECM, n = 42) aCO2; low N Hyphal length -0.47* -0.26 -0.40* -0.33* -0.05 0.36* Nd Root D.W. 0.24 Nd Root N cont 0.54* Root N conc -0.38* eCO2; low N Hyphal length -0.40* -0.09 -0.38* -0.35* -0.44* 0.00 Nd Root D.W. 0.46* Nd Root N cont 0.54* Root N conc 0.01 Chapter 4 (ECM, n = 18) aCO2; low N Hyphal length -0.55* -0.17 -0.58* -0.15 -0.47* 0.14 0.49* Root D.W. 0.09 0.17 Root N cont 0.04 Root N conc 0.19 aCO2; high N Hyphal length 0.34 -0.04 0.22 -0.10 0.01 0.05 0.49* Root D.W. -0.28 0.40 Root N cont 0.21 Root N conc 0.51* eCO2; low N Hyphal length 0.03 -0.76* -0.83* -0.72* -0.56* 0.53* -0.61* Root D.W. 0.82* -0.07 Root N cont -0.03 Root N conc 0.71* eCO2; high N Hyphal length -0.30 -0.34 -0.53* -0.21 -0.25 0.49* -0.08 Root D.W. 0.42 -0.34 Root N cont 0.13 Root N conc -0.15 Chapter 5 (DSE, n = 42) aCO2; low N Hyphal length -0.23 -0.40* -0.49* -0.19 -0.55* 0.29 -0.14 Root D.W. 0.14 -0.16 Root N cont 0.25 Root N conc 0.06 eCO2; low N Hyphal length -0.24 -0.02 -0.54* 0.03 -0.54* 0.19 -0.09 Root D.W. 0.49* -0.18 Root N cont 0.13 Root N conc 0.37* aCO2, ambient CO2; eCO2, elevated CO2; D.W., dry weight; cont, content; conc. concentration; below-ground C respired (Cresp); ECM, ectomycorrhizal fungi; DSE, dark septate root endophytic fungi; n, number of replicates; Nd, not determined due to technical reasons (see Chapter 3); *, P < 0.05, Pearson two-tailed t-test.
105
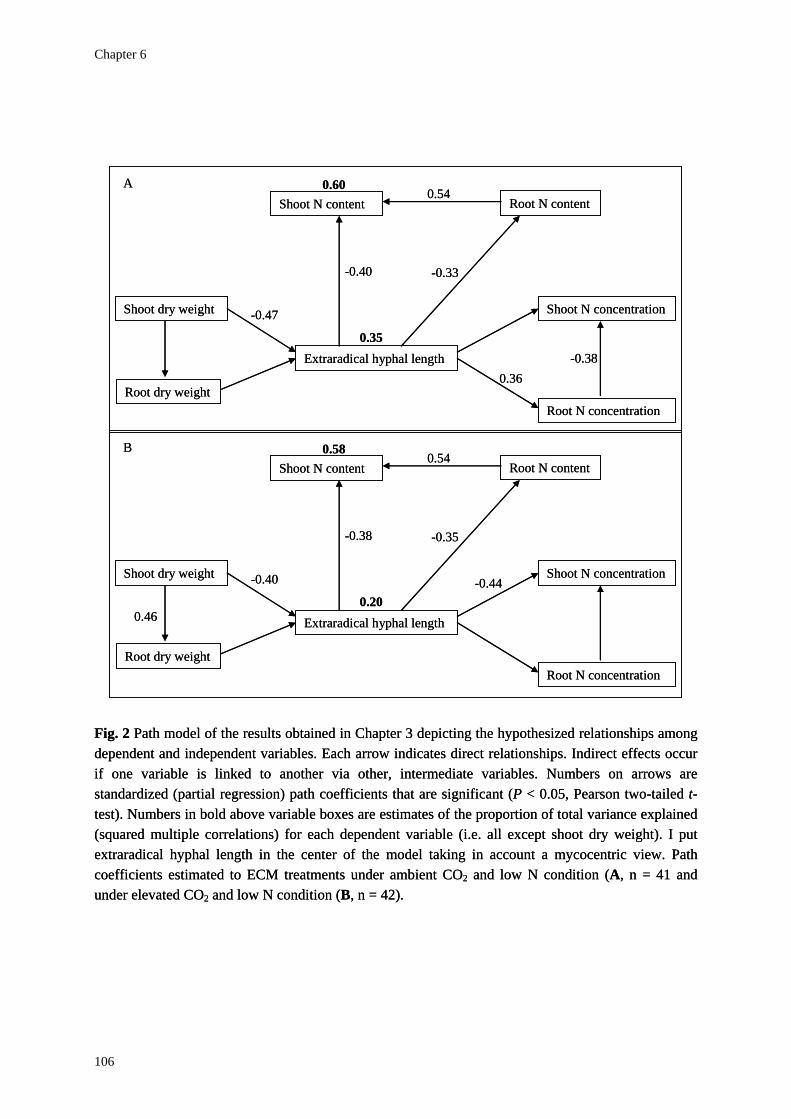
Ch
10
apter 6
6
Fig. 2 Path model of the results obtained in Chapter 3 depicting the hypothesized relationships among dependent and independent variables. Each arrow indicates direct relationships. Indirect effects occur if one variable is linked to another via other, intermediate variables. Numbers on arrows are standardized (partial regression) path coefficients that are significant (P < 0.05, Pearson two-tailed t-test). Numbers in bold above variable boxes are estimates of the proportion of total variance explained (squared multiple correlations) for each dependent variable (i.e. all except shoot dry weight). I put extraradical hyphal length in the center of the model taking in account a mycocentric view. Path coefficients estimated to ECM treatments under ambient CO2 and low N condition (A, n = 41 and under elevated CO2 and low N condition (B, n = 42).
Fig. 2 Path model of the results obtained in Chapter 3 depicting the hypothesized relationships among dependent and independent variables. Each arrow indicates direct relationships. Indirect effects occur if one variable is linked to another via other, intermediate variables. Numbers on arrows are standardized (partial regression) path coefficients that are significant (P < 0.05, Pearson two-tailed t-test). Numbers in bold above variable boxes are estimates of the proportion of total variance explained (squared multiple correlations) for each dependent variable (i.e. all except shoot dry weight). I put extraradical hyphal length in the center of the model taking in account a mycocentric view. Path coefficients estimated to ECM treatments under ambient CO2 and low N condition (A, n = 41 and under elevated CO2 and low N condition (B, n = 42).
Shoot dry weight
Root dry weight
Extraradical hyphal length
Root N concentration
Shoot N concentration
Root N content Shoot N content
0.35
0.60
-0.47
0.36-0.38
-0.40 -0.33
0.54A
Shoot dry weight
Root dry weight
Extraradical hyphal length
Root N concentration
Shoot N concentration
Root N content Shoot N content
0.35
0.60
-0.47
0.36-0.38
-0.40 -0.33
0.54A
Shoot dry weight
Root dry weight
Extraradical hyphal length
Root N concentration
Shoot N concentration
Root N content Shoot N content
0.460.20
0.58
-0.40 -0.44
-0.38 -0.35
0.54B
Shoot dry weight
Root dry weight
Extraradical hyphal length
Root N concentration
Shoot N concentration
Root N content Shoot N content
0.460.20
0.58
-0.40 -0.44
-0.38 -0.35
0.54B
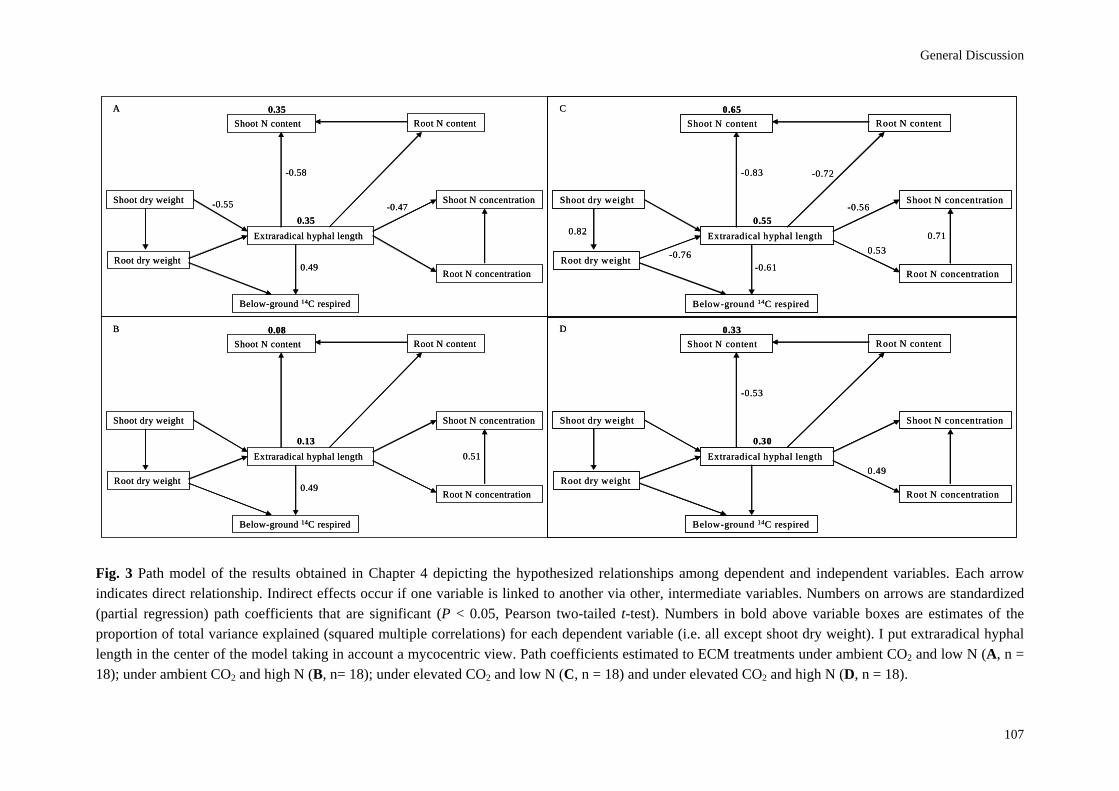
General Discussion
107
Fig. 3 Path model of the results obtained in Chapter 4 depicting the hypothesized relationships among dependent and independent variables. Each arrow indicates direct relationship. Indirect effects occur if one variable is linked to another via other, intermediate variables. Numbers on arrows are standardized (partial regression) path coefficients that are significant (P < 0.05, Pearson two-tailed t-test). Numbers in bold above variable boxes are estimates of the proportion of total variance explained (squared multiple correlations) for each dependent variable (i.e. all except shoot dry weight). I put extraradical hyphal length in the center of the model taking in account a mycocentric view. Path coefficients estimated to ECM treatments under ambient CO2 and low N (A, n = 18); under ambient CO2 and high N (B, n= 18); under elevated CO2 and low N (C, n = 18) and under elevated CO2 and high N (D, n = 18).
Shoot dry weight
Root dry weight
Extraradical hyphal length
Below-ground 14C respired
Root N concentration
Shoot N concentration
Root N content Shoot N content
0.35
0.35
-0.55
0.49
-0.47
-0.58
A
Shoot dry weight
Root dry weight
Extraradical hyphal length
Below-ground 14C respired
Root N concentration
Shoot N concentration
Root N content Shoot N content
0.35
0.35
-0.55
0.49
-0.47
-0.58
A
Shoot dry weight
Root dry weight
Extraradical hyphal length
Below-ground 14C respired
Root N concentration
Shoot N concentration
Root N content Shoot N content
0.13
0.08
0.49
0.51
B
Shoot dry weight
Root dry weight
Extraradical hyphal length
Below-ground 14C respired
Root N concentration
Shoot N concentration
Root N content Shoot N content
0.13
0.08
0.49
0.51
B
Shoot dry weight
Root dry weight
Extraradical hyphal length
Below-ground 14C respired
Root N concentration
Shoot N concentration
Root N content Shoot N content
0.820.55
0.65
-0.76-0.61
0.530.71
-0.56
-0.83 -0.72
C
Shoot dry weight
Root dry weight
Extraradical hyphal length
Below-ground 14C respired
Root N concentration
Shoot N concentration
Root N content Shoot N content
0.820.55
0.65
-0.76-0.61
0.530.71
-0.56
-0.83 -0.72
C
Shoot dry weight
Root dry weight
Extraradical hyphal length
Below-ground 14C respired
Root N concentration
Shoot N concentration
Root N content Shoot N content
0.30
0.33
0.49
-0.53
Shoot N concentration
Root N concentration
Root N content
Extraradical hyphal length
D
Shoot dry weight
Root dry weight
Below-ground 14C respired
Shoot N content
0.30
0.33
0.49
-0.53
D
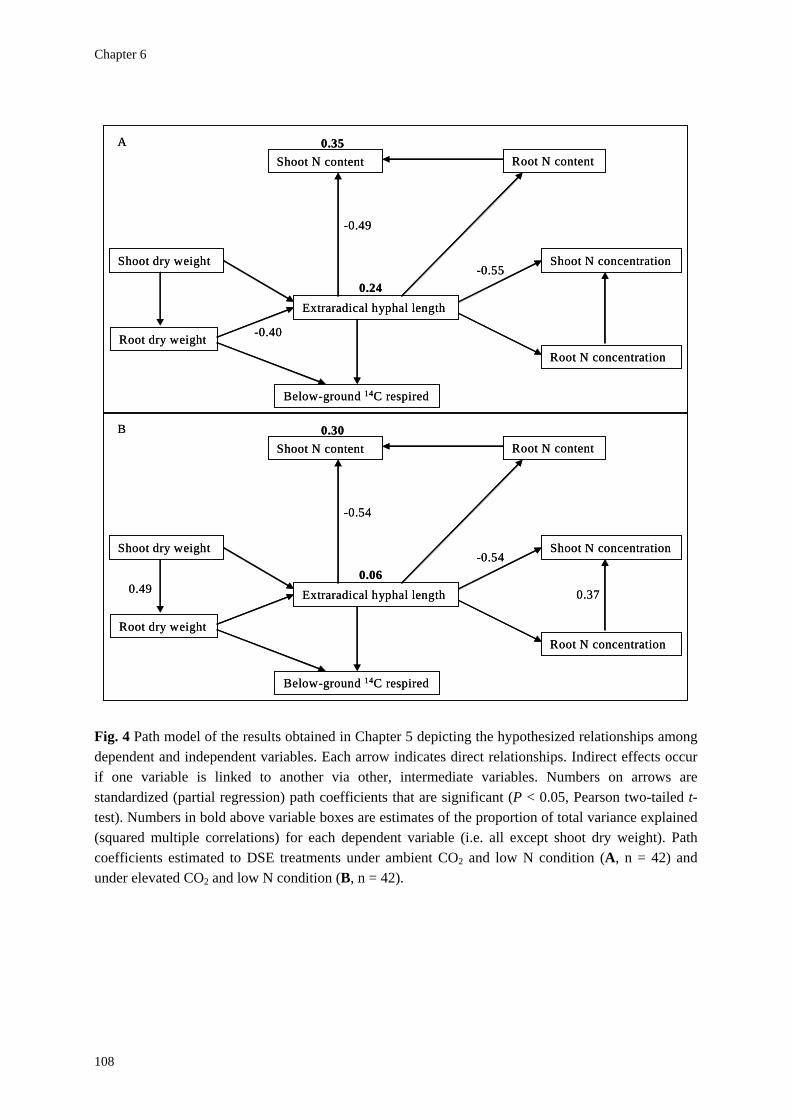
Chapter 6
Fig. 4 Path model of the results obtained in Chapter 5 depicting the hypothesized relationships among dependent and independent variables. Each arrow indicates direct relationships. Indirect effects occur if one variable is linked to another via other, intermediate variables. Numbers on arrows are standardized (partial regression) path coefficients that are significant (P < 0.05, Pearson two-tailed t-test). Numbers in bold above variable boxes are estimates of the proportion of total variance explained (squared multiple correlations) for each dependent variable (i.e. all except shoot dry weight). Path coefficients estimated to DSE treatments under ambient CO2 and low N condition (A, n = 42) and under elevated CO2 and low N condition (B, n = 42).
Shoot dry weight
Root dry weight
Extraradical hyphal length
Below-ground 14C respired
Root N concentration
Shoot N concentration
Root N content Shoot N content
0.24
0.35
-0.40
-0.55
-0.49
A
Shoot dry weight
Root dry weight
Extraradical hyphal length
Below-ground 14C respired
Root N concentration
Shoot N concentration
Root N content Shoot N content
0.24
0.35
-0.40
-0.55
-0.49
A
Shoot dry weight
Root dry weight
Extraradical hyphal length
Below-ground 14C respired
Root N concentration
Shoot N concentration
Root N content Shoot N content
0.490.06
0.30
0.37
-0.54
-0.54
B
Shoot dry weight
Root dry weight
Extraradical hyphal length
Below-ground 14C respired
Root N concentration
Shoot N concentration
Root N content Shoot N content
0.490.06
0.30
0.37
-0.54
-0.54
B
108
General Discussion
Key findings
• The need for a conceptual separation between a mycocentric and phytocentric view is evident for ECM associations
• Extraradical hyphal length can cause mycorrhizal fungal-induced PNL and generate negative feedback with plant growth under elevated CO2.
• Increasing N supply potentially relieves mycorrhiza-induced PNL under elevated CO2.
• Under elevated CO2 the beneficial impact of dark septate endophytes on plant
performance is more through improved nutrient use efficiency by the plant than through enhanced nutrient acquisition.
• Under N limitation and at elevated CO2 a large part of photoassimilates are rapidly
wasted in respiration through a fungal overflow CO2 tap.
• For ECM fungi path analysis indicates larger support for a mycocentric perspective at increasing CO2, but decreased support for this perspective at enhanced N availability.
109

Chapter 6
110
Appendix An update of the meta-analysis (Chapter 2)
Abstract The meta-analysis was updated on January 2nd, 2008. The update did not show any major differences compared to the previous analysis. Responses of both mycorrhizal fungi and mycorrhizal plants to elevated CO2 were significantly positive. The response ratio for ECM fungi was 1.32 (an increase of 32%) and for AM fungi 1.21 (21%), indicating a significantly different response. The response ratio for ECM plants was 1.12 and significantly lower than AM plants (1.32). Fractional colonization continued to be an unsuitable fungal parameter. Evidence was found for the mycocentric view in ECM, but not in AM systems.
Materials and Methods I updated the database from Alberton et al. (2005) on January 2nd, 2008. I used the same criteria to assess performance. The literature search was done through ‘Web of Science’ and ‘Scopus’. In total, 12 new papers on ECM systems and 5 new papers on AM system were analyzed. In all, I analyzed 103 data points for ECM systems and 94 data points for AM systems. The order of importance for parameter choice and the statistics were the same as used by Alberton et al. (2005).
Results and Discussion Data on the responses by fungi and plants in both mycorrhizal symbioses are given in Table 1. Responses of both mycorrhizal fungi and mycorrhizal plants were significantly positive under elevated CO2. The mean response ratio was 1.32 (CI = 1.25─1.40) for ECM fungi, an increase of 32%, and 1.21 (CI = 1.12─1.38) for AM fungi, an increase of 21%. The Q-test indicated a
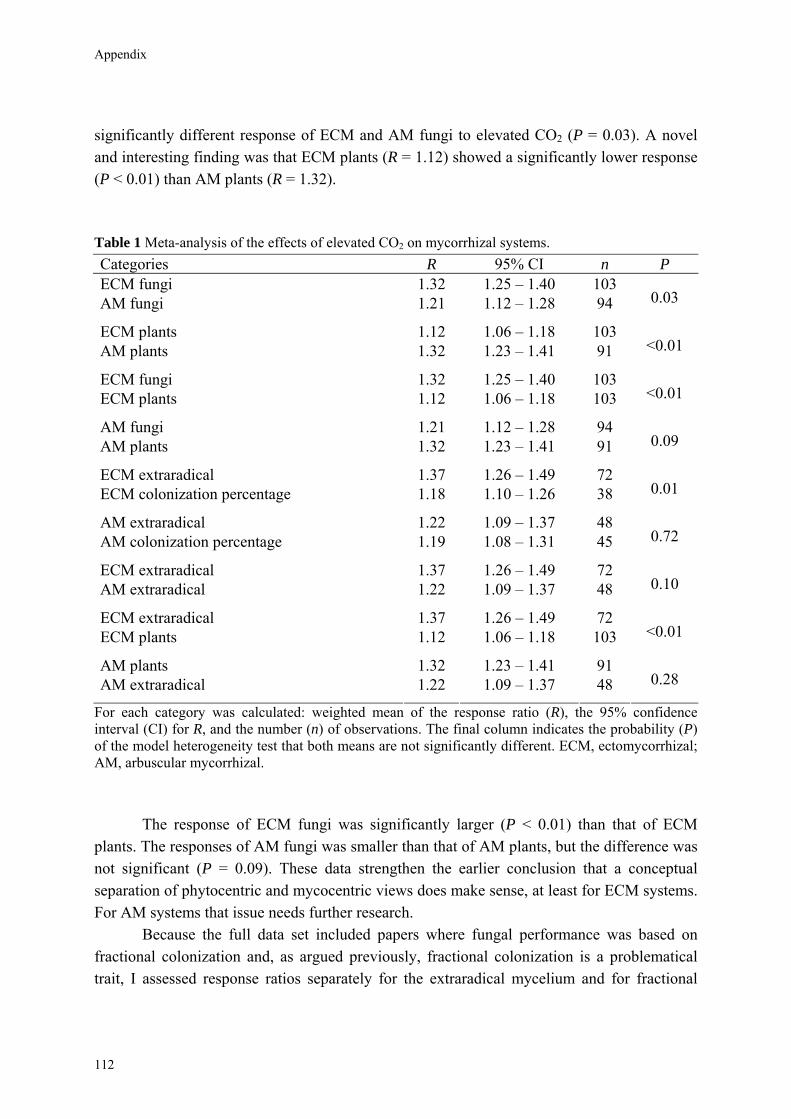
Appendix
significantly different response of ECM and AM fungi to elevated CO2 (P = 0.03). A novel and interesting finding was that ECM plants (R = 1.12) showed a significantly lower response (P < 0.01) than AM plants (R = 1.32). Table 1 Meta-analysis of the effects of elevated CO2 on mycorrhizal systems. Categories R 95% CI n P
ECM fungi 1.32 1.25 – 1.40 103 AM fungi 1.21 1.12 – 1.28 94 0.03
ECM plants 1.12 1.06 – 1.18 103 AM plants 1.32 1.23 – 1.41 91 <0.01
ECM fungi 1.32 1.25 – 1.40 103 ECM plants 1.12 1.06 – 1.18 103 <0.01
AM fungi 1.21 1.12 – 1.28 94 AM plants 1.32 1.23 – 1.41 91 0.09
ECM extraradical 1.37 1.26 – 1.49 72 ECM colonization percentage 1.18 1.10 – 1.26 38 0.01
AM extraradical 1.22 1.09 – 1.37 48 AM colonization percentage 1.19 1.08 – 1.31 45 0.72
ECM extraradical 1.37 1.26 – 1.49 72 AM extraradical 1.22 1.09 – 1.37 48 0.10
ECM extraradical 1.37 1.26 – 1.49 72 ECM plants 1.12 1.06 – 1.18 103 <0.01
AM plants 1.32 1.23 – 1.41 91 AM extraradical 1.22 1.09 – 1.37 48 0.28
For each category was calculated: weighted mean of the response ratio (R), the 95% confidence interval (CI) for R, and the number (n) of observations. The final column indicates the probability (P) of the model heterogeneity test that both means are not significantly different. ECM, ectomycorrhizal; AM, arbuscular mycorrhizal.
The response of ECM fungi was significantly larger (P < 0.01) than that of ECM
plants. The responses of AM fungi was smaller than that of AM plants, but the difference was not significant (P = 0.09). These data strengthen the earlier conclusion that a conceptual separation of phytocentric and mycocentric views does make sense, at least for ECM systems. For AM systems that issue needs further research.
Because the full data set included papers where fungal performance was based on fractional colonization and, as argued previously, fractional colonization is a problematical trait, I assessed response ratios separately for the extraradical mycelium and for fractional
112
Appendix
colonization. For ECM fungi the extraradical mycelium (R = 1.37) responded to a larger extent to elevated CO2 than fractional colonization (R = 1.18), and the difference between both was significant (P = 0.01). For AM fungi both responses were similar (extraradical mycelium: R = 1.22; fractional colonization: R = 1.19) and not significantly different (P = 0.72). The responses of the extraradical mycelium of ECM and AM fungi were not significantly different (P = 0.10). A comparison between ECM plant response and fungal response based on the performance of the extraradical mycelium confirmed that plants and fungi responded quantitatively differently (P < 0.01), while no difference was evident for AM systems (P = 0.28).
Could fungal identity matter from the phytocentric perspective (Table 2)? A subdivision of experiments with fungal communities and experiments with individual fungal species still showed large and significant differences between ECM plants in both kinds of experiments (P < 0.01). Plants colonized by an ECM fungal community showed a much larger response (R = 1.29) than plants colonized by single fungal species (R = 1.02). Fungal responses in both kinds of experiments were similar (P = 0.26). The AM plants also showed differences between experiments with fungal communities and experiments with individual species (P = 0.07). Plants colonized by AM fungal communities responded (R = 1.38) more strongly to elevated CO2 than plants colonized by individual species (R = 1.20). Fungal responses again were not significantly different (P = 0.18).
Could plant identity matter from the mycocentric perspective (Table 2)? Responses of ECM fungi on conifers and broad-leaved trees were significant different (R = 1.39 and 1.17; P < 0.01). Moreover, the response ratios for the extraradical mycelium showed even larger differences (ECM fungi with conifers: R = 1.50; ECM fungi with broad-leaved trees: R = 1.08; P < 0.01). Responses of AM fungi when associated with woody species were larger than responses of AM fungi when associated with herbaceous plants (R = 1.38 and 1.18), but the difference was not significant (P = 0.13). ECM conifer tree species responded similarly to broad-leaved tree species (R = 1.14 and 1.06; P = 0.34), and AM trees and AM herbs also responded similarly (R = 1.29 and 1.32; P = 0.77).
Fungal responses in both short-term (< 1 year) and long-term (> 1 year) experiments (Table 2) were not significantly different in both ECM and AM systems. Contrary of theories of downregulation (acclimation) of photosynthesis ECM plants showed a larger response to elevated CO2 in long-term experiments than in short-term experiments (P < 0.01). AM plants showed similar response to elevated CO2 in long-term experiments as in short-term experiments (P = 0.88). ECM plants showed a much larger response ratio in field experiments (R = 1.31) than in laboratory experiments (R = 1.03) and the difference between both kinds of experiments was significant (P < 0.01). While the ECM fungal response was also different between both classes of experiments (R = 1.18 and 1.39, field and lab respectively; P < 0.01), the ECM fungi showed a larger response in lab experiments. These data indicate that the conceptual separation between mycocentric and phytocentric views is very important in
113
Appendix
laboratory experiments, but less so in field experiments. While this difference could suggest that the conceptual separation is largely an artifact of less realistic conditions in laboratory experiments, I would argue against this conclusion. Almost half (14 data points out of 34) of the observations in the field were done under high nutrient levels, whereas only 9 out of 69 data points from laboratory experiments were derived from experiments done under high nutrient conditions. Under higher N levels plant responses to elevated CO2 generally increase, whether fungal responses decrease (Chapter 4). Another potential explanation, viz. that in field experiments fungal performance was more often assessed as fractional colonization, and in lab experiments assessed as extraradical hyphal length or biomass, could be rejected, because there were no large differences in the way fungal performance was assessed in both types of experiments.
There were no significant differences in response between field and laboratory experiments for AM fungi (P = 0.57). For AM plants the difference in response was significantly higher in laboratory experiments than in field experiments (R = 1.38 and R = 1.15, respectively; P = 0.03). The larger response of AM plants to elevated CO2 in the lab than in the field fits with an earlier observation by McGonigle (1988) who noted that field trials showed much less benefit of AM fungi than experiments under controlled conditions. Possible explanations for this effect are different nutrient levels in both kinds of experimental set up and the density-dependence of mycorrhizal response (Koide, 1991).
Table 3 lists the results of the meta-analysis for the various ECM fungal and AM fungal parameters. The increased sample size did not lead to major different results. Parameters related to fungal carbon use responded positively, but the decline in N and P concentrations of the mycelium indicate that nutrients have become more limiting.
114
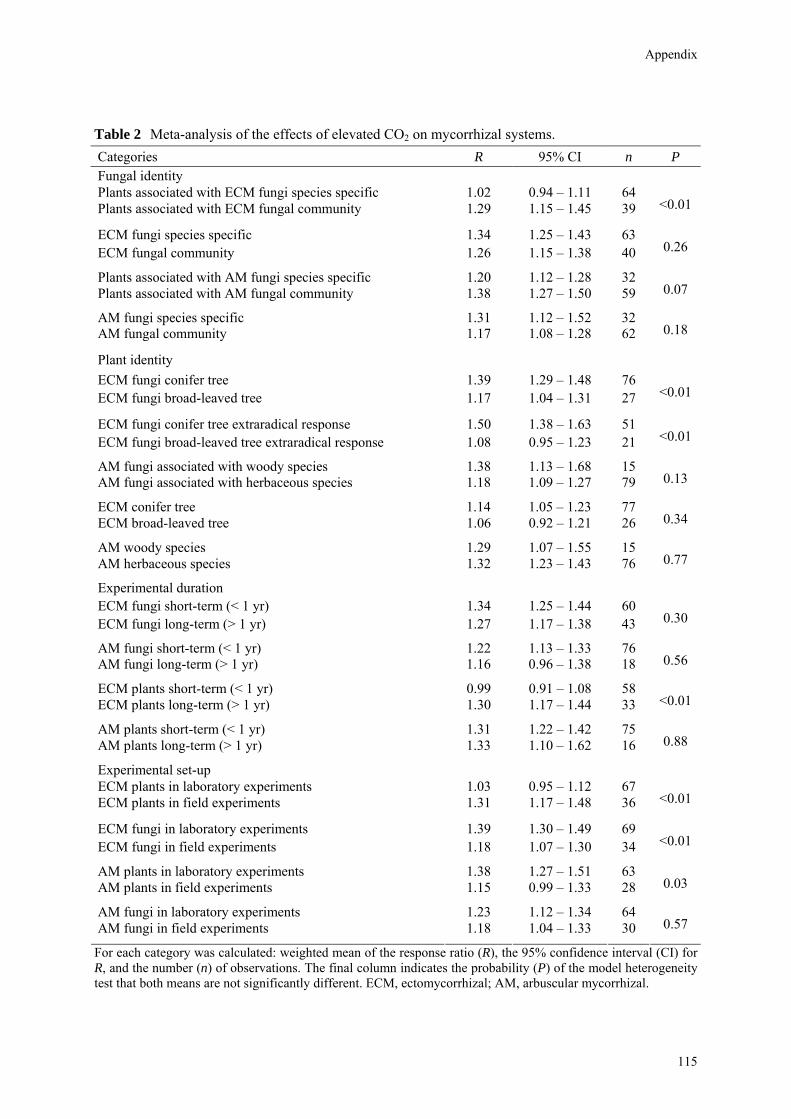
Appendix
Table 2 Meta-analysis of the effects of elevated CO2 on mycorrhizal systems. Categories R 95% CI n P Fungal identity Plants associated with ECM fungi species specific 1.02 0.94 – 1.11 64 Plants associated with ECM fungal community 1.29 1.15 – 1.45 39 <0.01
ECM fungi species specific 1.34 1.25 – 1.43 63 ECM fungal community 1.26 1.15 – 1.38 40 0.26
Plants associated with AM fungi species specific 1.20 1.12 – 1.28 32 Plants associated with AM fungal community 1.38 1.27 – 1.50 59 0.07
AM fungi species specific 1.31 1.12 – 1.52 32 AM fungal community 1.17 1.08 – 1.28 62 0.18
Plant identity
ECM fungi conifer tree 1.39 1.29 – 1.48 76 ECM fungi broad-leaved tree 1.17 1.04 – 1.31 27 <0.01
ECM fungi conifer tree extraradical response 1.50 1.38 – 1.63 51 ECM fungi broad-leaved tree extraradical response 1.08 0.95 – 1.23 21 <0.01
AM fungi associated with woody species 1.38 1.13 – 1.68 15 AM fungi associated with herbaceous species 1.18 1.09 – 1.27 79 0.13
ECM conifer tree 1.14 1.05 – 1.23 77 ECM broad-leaved tree 1.06 0.92 – 1.21 26 0.34
AM woody species 1.29 1.07 – 1.55 15 AM herbaceous species 1.32 1.23 – 1.43 76 0.77
Experimental duration
ECM fungi short-term (< 1 yr) 1.34 1.25 – 1.44 60 ECM fungi long-term (> 1 yr) 1.27 1.17 – 1.38 43 0.30
AM fungi short-term (< 1 yr) 1.22 1.13 – 1.33 76 AM fungi long-term (> 1 yr) 1.16 0.96 – 1.38 18 0.56
ECM plants short-term (< 1 yr) 0.99 0.91 – 1.08 58 ECM plants long-term (> 1 yr) 1.30 1.17 – 1.44 33 <0.01
AM plants short-term (< 1 yr) 1.31 1.22 – 1.42 75 AM plants long-term (> 1 yr) 1.33 1.10 – 1.62 16 0.88
Experimental set-up ECM plants in laboratory experiments 1.03 0.95 – 1.12 67 ECM plants in field experiments 1.31 1.17 – 1.48 36 <0.01
ECM fungi in laboratory experiments 1.39 1.30 – 1.49 69 ECM fungi in field experiments 1.18 1.07 – 1.30 34 <0.01
AM plants in laboratory experiments 1.38 1.27 – 1.51 63 AM plants in field experiments 1.15 0.99 – 1.33 28 0.03
AM fungi in laboratory experiments 1.23 1.12 – 1.34 64 AM fungi in field experiments 1.18 1.04 – 1.33 30 0.57
For each category was calculated: weighted mean of the response ratio (R), the 95% confidence interval (CI) for R, and the number (n) of observations. The final column indicates the probability (P) of the model heterogeneity test that both means are not significantly different. ECM, ectomycorrhizal; AM, arbuscular mycorrhizal.
115
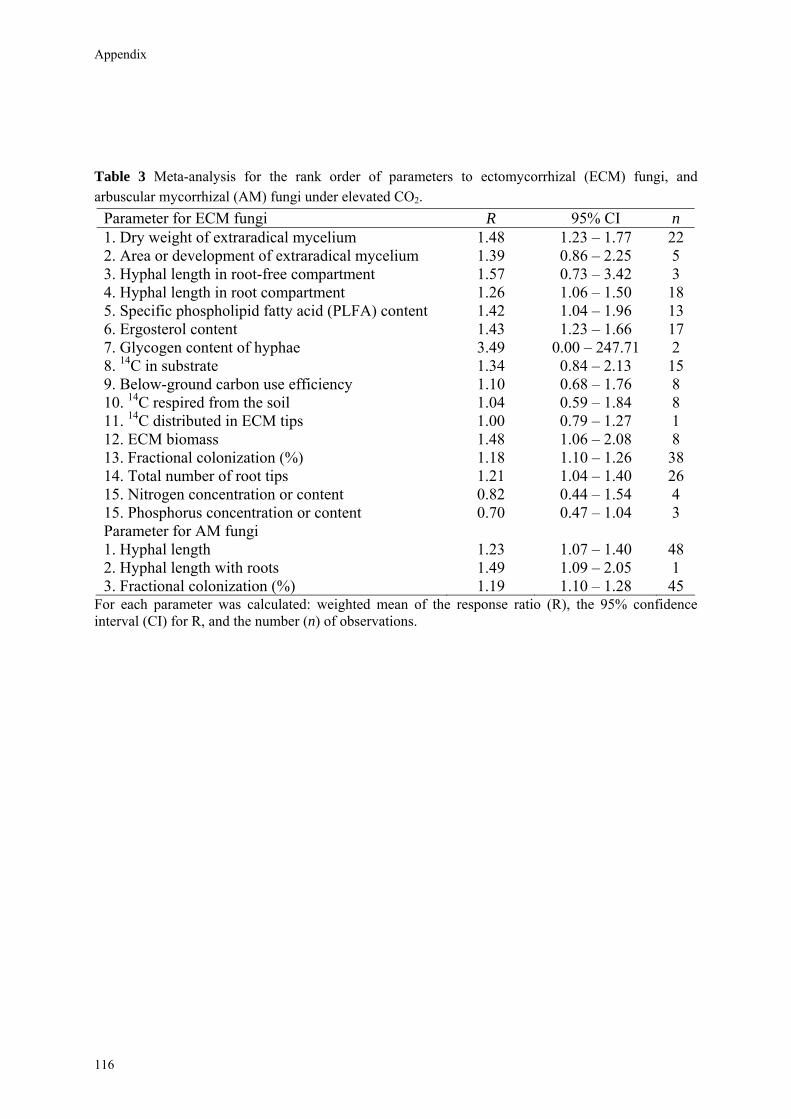
Appendix
Table 3 Meta-analysis for the rank order of parameters to ectomycorrhizal (ECM) fungi, and arbuscular mycorrhizal (AM) fungi under elevated CO2.
Parameter for ECM fungi R 95% CI n 1. Dry weight of extraradical mycelium 1.48 1.23 – 1.77 22 2. Area or development of extraradical mycelium 1.39 0.86 – 2.25 5 3. Hyphal length in root-free compartment 1.57 0.73 – 3.42 3 4. Hyphal length in root compartment 1.26 1.06 – 1.50 18 5. Specific phospholipid fatty acid (PLFA) content 1.42 1.04 – 1.96 13 6. Ergosterol content 1.43 1.23 – 1.66 17 7. Glycogen content of hyphae 3.49 0.00 – 247.71 2 8. 14C in substrate 1.34 0.84 – 2.13 15 9. Below-ground carbon use efficiency 1.10 0.68 – 1.76 8 10. 14C respired from the soil 1.04 0.59 – 1.84 8 11. 14C distributed in ECM tips 1.00 0.79 – 1.27 1 12. ECM biomass 1.48 1.06 – 2.08 8 13. Fractional colonization (%) 1.18 1.10 – 1.26 38 14. Total number of root tips 1.21 1.04 – 1.40 26 15. Nitrogen concentration or content 0.82 0.44 – 1.54 4 15. Phosphorus concentration or content 0.70 0.47 – 1.04 3 Parameter for AM fungi 1. Hyphal length 1.23 1.07 – 1.40 48 2. Hyphal length with roots 1.49 1.09 – 2.05 1 3. Fractional colonization (%) 1.19 1.10 – 1.28 45
For each parameter was calculated: weighted mean of the response ratio (R), the 95% confidence interval (CI) for R, and the number (n) of observations.
116
Summary
As a consequence of burning fossil fuels and land use change, human society is rapidly increasing atmospheric concentrations of CO2 and this together with increased nutrient availability are predicted to have substantial impact on plant growth and the functioning of ecosystems. To better understand and predict responses to elevated CO2 and interactions between elevated CO2 with nutrient supply, it is necessary to conduct more studies on below-ground dynamics, including both roots and associated micro-organisms. These micro-organisms, especially mycorrhizal fungi that form a mutually beneficial symbiosis with plant roots, play a key role in ecosystems. Although almost all terrestrial plants are mycorrhizal, plant responses to elevated CO2 have often been studied from an exclusive plant perspective, the phytocentric approach. The mycorrhizal fungal perspective, the mycocentric approach, has generally been neglected. If this mycorrhizal symbiosis is ignored, studies of plant responses might be of limited realism. It is therefore important to understand the diversity, extent and dynamics of mycelia of mycorrhizal fungi in soils.
I therefore investigated differences in fungal species-specific responses under ambient and elevated CO2 and under low and high N availability to determine the conditions under which positive and negative feedbacks between plants (in this case Scots pine seedlings) and different mycorrhizal fungi occur. I used meta-analysis techniques and experimental approaches under controlled conditions to determine the effects of doubling atmospheric CO2 and increased nutrient availability on mycorrhizal plant and mycorrhizal fungal dynamics to better understand forest ecosystems under global change.
In Chapter 2 and the Appendix, I conducted meta-analyses to study mycorrhizal fungal and plant responses separately under elevated CO2 to conceptually separate a phytocentric model from a mycocentric model that assumes that increased C availability to the fungus will not automatically feed back to enhanced plant growth performance. I compared the responses of ectomycorrhizal (ECM) and arbuscular mycorrhizal (AM) fungi, and ECM and AM plants. Responses of both mycorrhizal fungi and mycorrhizal plants to elevated CO2 were significantly positive. Fractional colonization was an unsuitable parameter to determine ECM fungal responses to elevated CO2. Fungal identity and plant identity were important parameters that were affected by elevated CO2. Evidence was found for the need to separate the mycocentric and phytocentric perspective in ECM, but not in AM systems.
Under conditions of increasing nutrient limitation, plants undergo morphological and physiological modifications. By changing the functional equilibrium between shoots and roots, plants allocate more C to below-ground structures including mycorrhizas to promote nutrient acquisition. If plants allocate more biomass to the organs that are involved in the acquisition of the resource that is currently most limiting, one would predict that elevated CO2
Summary
decreases shoot : root ratio. The results in Chapter 3 showed that under elevated CO2 and low N availability shoot : root ratio indeed decreased and most strongly so in ECM species with the largest extraradical mycelium, consistent with our prediction. Under elevated CO2, ECM root growth increased more than hyphal growth. Extraradical hyphal length was significantly negatively correlated with shoot biomass, shoot N content and total plant N uptake. Apparently, fungal sink strength for N strongly affected plant growth through N immobilization in the extraradical mycelium. This mycorrhizal fungal-induced Progressive Nitrogen Limitation (PNL) has the potential to generate negative feedback with plant growth under elevated CO2.
Fungal identity matters from a phytocentric perspective because fungi differ in their sink strength for C and N (Chapter 3). Therefore, understanding fungal species-specific responses to variation in C and N supply is essential to predict impacts of global change on plants and their associated fungi. For this aim, I investigated fungal species-specific responses of ECM Scots pine seedlings under ambient and elevated CO2 and under low and high N availability (Chapter 4). Most plant and fungal parameters were significantly affected by fungal species, CO2 level and N supply. Under elevated CO2 extraradical hyphal length was 37% (at low N supply) and 87% (at high N supply) higher than at ambient CO2. I also found that increasing N supply potentially relieved mycorrhiza-induced PNL under elevated CO2 (Chapter 4). Below-ground 14C respiration of mycorrhizal seedlings corresponded to 14-21% of total 14C assimilated and of non-mycorrhizal pine seedlings this was only 9%, even though non-mycorrhizal plants were of similar size as mycorrhizal plants. This increased respiration has an important implication for C sequestration because mycorrhizal plants showed a larger so-called CO2 overflow than non-mycorrhizal plants, a mechanism through which mycorrhizal fungi directly return additional C to the atmosphere.
In fact, only if the amount of extraradical mycelium is sub-optimal from the perspective of plant nutrition, will increased mycelial biomass, induced by elevated CO2, be profitable for the plant. If, however, the amount of extraradical mycelium is already supra-optimal from a phytocentric perspective further increases in C allocation to the fungus will not be profitable to the plant, but only enhance fungal fitness. In fact, increased fungal fitness could increase PNL. In particular, the diversity among fungal species and their individual responses to CO2 and nutrient availability will have a major impact on plant performance. This issue of mycelial abundance being larger than optimal from the plant’s perspective for uptake rates should be further explored in models of nutrient uptake by mycorrhizal fungal mycelia.
I also investigated the effects of different Dark Septate root Endophytic fungi (DSE) on growth and nutrient acquisition by Scots pine seedlings because nothing was known about the direction and magnitude of effects under conditions of N-limitation and elevated CO2 (Chapter 5). I observed that none of the DSE caused mortality in the host. Under elevated CO2 plant biomass increased on average by 17% when inoculated with DSE. Shoot N
118
Summary
concentration decreased by 57% under elevated CO2. Even though under elevated CO2 extraradical hyphal length increased on average by 53%, this enlarged sink did not create significant competition for soil N and no reduction in plant growth was observed. In fact, seedlings inoculated with DSE allocated more N to roots than uninoculated controls or seedlings grown under ambient CO2. While the impact of ECM fungi on plant performance under elevated CO2 was mainly through changes in nutrient uptake efficiency, the impact of DSE was through changes in nutrient use efficiency. It would be important to test the behavior of various DSE over a range of N availabilities under elevated CO2 in future research.
In Chapter 6 (General Discussion), I synthesize the findings of the previous chapters. In order to provide some quantification of the degree to which ECM plants and fungi exert control over the symbiosis (and hence the degree to which responses are or are not coordinated) under different levels of C and N, I applied a statistical modeling method called path analysis. Based on the experiments described in Chapters 3, 4, and 5, I assessed the strength of several pathways as a function of both C and N availability. I also used path analysis modeling to explore the potential for a common framework of integrating phytocentric and mycocentric perspectives in studying mycorrhizal responses to global change. The path analysis results from data of Chapter 3 were consistent with the hypothesis that PNL is driven by the fungal sink strength for N. The path analysis results from data of Chapter 4 showed that elevated CO2 improved the explanatory value of the model for both extraradical hyphal length and shoot N content, whereas high N level substantially decreased the explanatory value of the models. I also applied path analysis for DSE associations (Chapter 5) and observed that both extraradical hyphal length and shoot N content have less explanatory value than in the case of ECM systems. The explanatory value also decreased at elevated CO2. Extraradical hyphal length correlated significantly negatively with shoot N content and concentration, but not with shoot dry weight. Path analysis is therefore supportive of the hypothesis that the impact of DSE is more through improved N use efficiency by the plant than through enhanced nutrient acquisition. Apparently, DSE fungi react differently to global change than ECM fungi, indicating that there are limits to the degree of similarity in mutualistic function between both groups.
This thesis clearly shows that it makes sense to look at effects of climate change on forest ecosystems from both a mycocentric and a phytocentric viewpoint. It demonstrates the importance to implement separate phytocentric and mycocentric views into models describing C and N flows in forest ecosystems, especially in those where ECM are dominantly occurring such as the boreal conifer forests.
119

Summary
120
Samenvatting
Door het verbranden van fossiele brandstoffen en door landgebruikveranderingen is de mens verantwoordelijk voor de snelle toename van atmosferisch CO2 (koolzuurgas). In combinatie met de toegenomen beschikbaarheid van nutriënten (in het bijzonder stikstof) zal deze toename van CO2 hoogstwaarschijnlijk aanzienlijke gevolgen hebben voor de plantengroei en het functioneren van ecosystemen. Om een beter begrip te krijgen van en om tot betere voorspellingen te komen over het effect van verhoogd CO2 op plantengroei, evenals van het effect van de interactie tussen verhoogd CO2 en verhoogd nutriëntenaanbod, is het noodzakelijk om meer studies te verrichten aan de ondergrondse dynamiek, zowel betrekking hebbend op wortels als de daarmee geassocieerde micro-organismen. Deze micro-organismen, en in het bijzonder de mycorrhizaschimmels die een wederzijds voordelige associatie vormen met plantenwortels, spelen sleutelrollen in ecosystemen. Hoewel bijna alle landplanten mycorrhiza vormen, hebben studies aan het effect van verhoogd CO2 op planten slechts zeer beperkt aandacht besteed aan de rol van die mycorrhizaschimmels. Studies zijn uitgevoerd vanuit een exclusief plantenperspectief, de zogenaamde phytocentrische benadering. Een mycocentrische benadering vanuit het perspectief van de mycorrhizaschimmel is dus veel minder onderwerp van studie geweest. Maar als de mycorrhizasymbiose wordt verwaarloosd, is het waarschijnlijk dat de uitkomsten van zulke proeven maar een beperkte praktische betekenis hebben. Het is om die reden belangrijk om een beter begrip te krijgen van de diversiteit, de talrijkheid en de dynamiek van de mycelia (de netwerken van schimmeldraden) van mycorrhizaschimmels in de bodem.
Om die reden onderzocht ik hoe zaailingen van grove den in associatie met verschillende soorten mycorrhizaschimmels met hun soortspecifieke myceliumeigenschappen reageerden op normaal en verhoogd CO2, en onder omstandigheden van een laag en hoger aanbod van stikstof. Het doel van de studies was om te onderzoeken onder welke omstandigheden (soort mycorrhizaschimmel, aanbod van koolstof en stikstof) er positieve en negatieve terugkoppelingen tussen schimmelgroei en plantengroei optraden. De resultaten van eerder uitgevoerde experimenten vatte ik kwantitatief samen met behulp van meta-analyse. Mijn eigen onderzoek bestond uit een drietal experimenten. Die combinatie leidde tot een beter begrijpen van de dynamiek van mycorrhizaschimmel en mycorrhizaplant onder verschillend aanbod van koolstof en stikstof, en daarmee tot een beter begrip van de reactie van bosecosystemen op global change.
In hoofdstuk 2 en de Appendix presenteer ik de resultaten van de meta-analyse. Ik onderzocht afzonderlijk de veranderingen in de groei van plant en schimmel en maakte dus een conceptueel onderscheid tussen een phytocentrisch en mycocentrisch perspectief. In een dergelijk mycocentrisch model is de veronderstelling losgelaten dat de toegenomen koolstofbeschikbaarheid automatisch zal leiden tot betere groei van het schimmelnetwerk en
Samenvatting
dus tot een verhoogde opname van nutriënten en doorgifte van die nutriënten naar de plant. In de meta-analyses vergeleek ik de reactie van zowel ectomycorrhizavormende (ECM) als arbusculaire-mycorrhizavormende (AM) schimmels als die van ECM en AM planten. Zowel de mycorrhizaschimmels als de mycorrhizaplanten reageerden significant positief op verhoogd CO2. Daarbij bleek dat de kolonisatiegraad van ECM-schimmels op wortels niet geschikt was om dit effect vast te stellen. Een belangrijke verklarende factor in deze analyse was daarnaast de identiteit van schimmelsoort en plantensoort. Voor ECM-systemen kwam ik tot de conclusie dat het belangrijk is om dit conceptuele onderscheid tussen een mycocen-trische en een phytocentrische benadering te maken. Voor AM-systemen kon dit niet worden aangetoond.
Wanneer plantengroei in sterkere mate beperkt wordt door een tekort aan planten-voedende stoffen, zullen planten morfologische en fysiologische veranderingen ondergaan die zullen leiden tot een nieuw evenwicht tussen spruit en wortel (het functionele evenwicht tussen bovengrondse en ondergrondse delen van de plant). Bij toenemende nutriëntenbeperking zullen planten meer investeren in wortels en hun mycorrhizaschimmels om de schaarse nutriënten te verwerven. Op grond van die theorie kan voorspeld worden dat onder omstandigheden van verhoogd CO2 de verhouding tussen spruit en wortel zal afnemen. Mijn resultaten uit hoofdstuk 3 laten zien dat bij verhoogd CO2 en een laag stikstofaanbod planten inderdaad een lagere spruit : wortelverhouding hebben. Die lagere verhouding was het sterkst bij zaailingen in associatie met mycorrhizaschimmels die het grootste netwerk vormden. Onder verhoogd CO2 nam de wortelgroei meer toe dan de groei van het schimmelnetwerk. Er was een significant negatief verband tussen de grootte van het schimmelnetwerk (bepaald als de totale lengte van schimmeldraden) en het gewicht en stikstofgehalte van de spruit, evenals met de totale hoeveelheid stikstof die in de plant werd teruggevonden. Ik concludeer hieruit dat het vermogen van de schimmel om het opgenomen N voor eigen gebruik te bestemmen leidt tot een lagere doorgifte van stikstof naar de plant. Mycorrhizaschimmels induceren daardoor een toenemende stikstofbeperking voor de plant. Dit verschijnsel is in de literatuur PNL genoemd, Progressive Nitrogen Limitation. Deze mycorrhiza-geïnduceerde PNL kan leiden tot een negatieve terugkoppeling met plantengroei onder verhoogd CO2.
Vanuit het perspectief van de plant maakt het dus uit met welke mycorrhiza-schimmelsoort ze geassocieerd is, doordat schimmelsoorten in hun behoefte aan en concurrentiekracht voor koolstof en stikstof verschillen (Hoofdstuk 3). Om die reden is kennis van de schimmelsoort-specifieke reactie op verschillen in koolstof- en stikstofaanbod es-sentieel om de effecten van klimaatverandering op planten en mycorrhizaschimmels te voorspellen. Daartoe onderzocht ik schimmelsoort-specifieke reacties van ecto-mycorrhizavormende zaailingen van grove den onder normaal en verhoogd CO2 en bij laag en hoger aanbod aan stikstof (Hoofdstuk 4). De meeste parameters van plant en schimmel werden significant beïnvloed door de factoren schimmelsoort, CO2-beschikbaarheid en
122
Samenvatting
stikstofaanbod. Onder verhoogd CO2-gehalte was de lengte van het schimmelnetwerk 37% (bij een laag aanbod van stikstof) resp. 87% (bij een hoger stikstofaanbod) groter dan bij het normale CO2 niveau (Hoofdstuk 4). De ondergrondse ademhaling (van 14C) van de zaailingen met mycorrhiza was 14-21% van de totale hoeveelheid vastgelegde koolstof, terwijl dat bij de niet-gemycorrhizeerde, controlezaailingen slechts 9% bedroeg, terwijl de planten met en zonder mycorrhiza even groot waren. Deze toegenomen ondergrondse ademhaling heeft be-langrijke implicaties voor de mogelijkheid om koolstof in ecosystemen vast te leggen, doordat de planten met mycorrhiza een grotere hoeveelheid koolstof ‘verkwisten’ dan planten zonder mycorrhiza via de zogenaamde CO2–overflow tap, een mechanisme waardoor mycor-rhizaschimmels het vastgelegde CO2 als het ware weer direct vanuit de bodem terugpompen in de atmosfeer.
Ik concludeer uit die waarnemingen dat alleen onder condities waarin de lengte van het schimmelnetwerk suboptimaal is vanuit het perspectief van de plantenvoeding, de toegenomen hoeveelheid schimmelbiomassa, die het gevolg is van de hogere CO2-gehaltes in de atmosfeer, ook voor de plant voordelig zal zijn. Maar als de hoeveelheid schimmelbiomassa al supra-optimaal is vanuit het perspectief van plantenvoeding (als de grond als het ware ‘verzadigd’ is met mycorrhiza), zal een verdere toename van koolstof naar de schimmel geen voordeel voor de plant met zich meebrengen, maar uitsluitend voor de schimmel zelf van voordeel zijn. Daardoor zal de toegenomen fitness van de schimmel juist de PNL (de toenemende beperking van plantengroei door stikstof) versterken, doordat dit grotere schimmelnetwerk een grotere concurrent om stikstof wordt. De diversiteit aan schimmelsoorten en hun individuele behoefte aan zowel koolstof als stikstof worden daardoor belangrijke bepalende factoren hoe planten op verhoogd CO2 zullen reageren. De hypothese dat de schimmelbiomassa groter kan zijn dan wat optimaal is vanuit het perspectief van de plant dient verder modelmatig onderzocht te worden in modellen over nutriëntenopname door de schimmel en nutriëntentransport van schimmel naar plant.
Ik onderzocht tenslotte (Hoofdstuk 5) de effecten van verschillende soorten DSE-schimmels (Dark Septate root Endophytic fungi; wortelschimmels met donkergekleurde, gesepteerde hyphen) op de groei van en de verwerving van voedingsstoffen door zaailingen van grove den. Het bleek dat er nog niets bekend was hoe deze schimmels zouden reageren op een verhoogd CO2-gehalte onder omstandigheden van een laag stikstofaanbod. Geen van de DSE-schimmels veroorzaakte afsterven van de zaailingen. Bij een verhoogd CO2-gehalte was het gewicht van de dennenzaailingen die met DSE waren geïnoculeerd gemiddeld 17% groter dan bij normaal CO2. De concentratie van stikstof in de spruit nam onder die omstandigheden met 57% af. Hoewel onder verhoogd CO2 de lengte van het schimmelnetwerk gemiddeld met 53% toenam, leidde dit niet tot een grotere concurrentie om stikstof tussen plant en schimmel en er werd geen afname in plantengroei waargenomen. Onder verhoogd CO2 werd in zaai-lingen, die met DSE-schimmels waren geïnoculeerd, meer stikstof ondergronds vastgehouden en werd minder stikstof naar de spruit getransporteerd, dan in zaailingen zonder DSE, of in
123
Samenvatting
zaailingen met DSE onder normaal CO2. Dit bleek een belangrijk verschil in het gedrag van zaailingen met ECM-schimmels en zaailingen met DSE-schimmels. In het geval van mycorrhiza leidde een verhoging van het CO2-gehalte tot veranderingen in de opname-efficiëntie van nutriënten, in het geval van DSE-schimmels tot een verandering in de efficiëntie waarmee planten hun nutriënten gebruiken. Voor toekomstig onderzoek wordt aanbevolen om het gedrag van DSE-schimmels bij verhoogd CO2 over een groter bereik van stikstofbeschikbaarheid te onderzoeken.
In hoofdstuk 6 (Algemene discussie) vat ik de gegevens van de afzonderlijke hoofdstukken samen. Om de mate waarin ECM-schimmels en ECM-planten controle over de symbiose uitoefenen, en dus de mate waarin de reactie van schimmel en plant ‘gecoördineerd’ zijn onder verschillend aanbod van koolstof en stikstof, te kwantificeren, gebruikte ik een statische methode die pad-analyse wordt genoemd. Op basis van de proeven die ik beschreef in de hoofdstukken 3,4 en 5, bepaalde ik de sterkte (verklarend vermogen) van verschillende routes van het causale netwerk als functie van de beschikbaarheid van koolstof en stikstof. Ik gebruikte pad-analyse ook om de mogelijkheden te exploreren voor een gemeenschappelijk modelmatig kader waarin het mycocentrische en phytocentrische perspectief geïntegreerd kunnen worden. In de pad-analyse was een centrale plaats ingeruimd voor het schimmelnetwerk. De resultaten van de pad-analyse van hoofdstuk 3 waren in overeenstemming met de hypothese dat PNL (toenemende stikstofbeperking) wordt veroorzaakt door de concurrentiekracht van de schimmel voor stikstof. De resultaten van de pad-analyse van hoofdstuk 4 lieten zien dat het voorgestelde causale model een hogere verklaringskracht (voor zowel de lengte van het schimmelnetwerk als het stikstofgehalte van de bovengrondse delen) had onder verhoogd CO2 dan onder normaal CO2, en een lagere verklaringskracht onder een hoog stikstofaanbod dan onder een laag stikstofaanbod. Pad-analyse voor zaailingen met DSE-schimmels, zoals beschreven in hoofdstuk 5, liet zien dat de verklarende kracht van het model lager is dan in het geval van ECM-systemen. Bij verhoogd CO2 nam hier juist de verklarende kracht verder af. Pad-analyse ondersteunt hier dus de hypothese dat DSE-schimmels voornamelijk effectief zijn via veranderingen in de nutriëntengebruiksefficiëntie van de plant, en niet via veranderingen in de efficiëntie waarmee nutriënten kunnen worden verworven. Blijkbaar reageren DSE-schimmels anders op global change dan ECM-schimmels en zij er dus grenzen aan de mate van overeenkomst tussen beide groepen, ook al zijn beide groepen schimmels voor de plant gewoonlijk voordelig.
Mijn proefschrift laat duidelijk zien dat het zinvol is om in een studie naar de effecten van klimaatsverandering op ecosystemen onderscheid te maken tussen een mycocentrisch en een phytocentrisch perspectief. Het is noodzakelijk om beide perspectieven te scheiden in modellen die de stromen van koolstof en stikstof beschrijven. Een dergelijk conceptueel onderscheid is vooral noodzakelijk in bosecosystemen waarin ectomycorrhizabomen domineren, zoals in boreale naaldbossen.
124
References Addy HD, Piercey MM, Currah RS. 2005. Microfungal endophytes in roots. Canadian
Journal of Botany 83: 1-13. Ahlich K, Sieber TN. 1996. The profusion of dark septate endophytic fungi in non-
ectomycorrhizal fine roots of forest trees and shrubs. New Phytologist 132: 259-270. Alberton O, Kuyper TW, Gorissen A. 2005. Taking mycocentrism seriously: mycorrhizal
fungal and plant responses to elevated CO2. New Phytologist 167: 859-868. Alberton O, Kuyper TW, Gorissen A. 2007. Competition for nitrogen between Pinus
sylvestris and ectomycorrhizal fungi generates potential for negative feedback under elevated CO2. Plant and Soil 296: 159-172.
Allen MF, Klironomos JN, Treseder KK, Oechel WC. 2005. Responses of soil biota to elevated CO2 in a chaparral ecosystem. Ecological Applications 15: 1701-1711.
Allen MF. 2001. Modeling arbuscular mycorrhizal infection: is % infection an appropriate variable? Mycorrhiza 10: 255-258.
Andersen CP, Rygiewicz PT. 1995. Allocation of carbon in mycorrhizal Pinus ponderosa seedlings exposed to ozone. New Phytologist 131: 471-480.
Arbuckle JL. 2006. AMOS 7.0 user’s guide and program. Chicago IL, USA: Amos Development Corporation.
Arnebrant K. 1994. Nitrogen amendments reduce the growth of extramatrical ectomycorrhizal mycelium. Mycorrhiza 5: 7-15.
Augé RM, Moore JL, Cho K, Stutz JC, Sylvia DM, Al-Agely AK, Saxton AM. 2003. Relating foliar dehydration tolerance of mycorrhizal Phaseolus vulgaris to soil and root colonization by hyphae. Journal of Plant Physiology 160: 1147-1156.
Augé RM, Toler HD, Moore JL, Cho K, Saxton AM. 2007. Comparing contributions of soil versus root colonization to variations in stomatal behavior and soil drying in mycorrhizal Sorghum bicolor and Cucurbita pepo. Journal of Plant Physiology 164: 1289-1299.
Baar J, Comoni B, Oude Elferink M, Kuyper TW. 1997. Performance of four ectomycorrhizal fungi on organic and inorganic nitrogen sources. Mycological Research, 101, 523-529.
Barrow JR, Aaltonen RE. 2001. Evaluation of the internal colonization of Atriplex canescens (Pursh) Nutt. roots by dark septate fungi and the influence of host physiological activity. Mycorrhiza 11: 199-205.
References
Bhupinderpal-Singh, Nordgren A, Ottosson Löfvenius M., Högberg MN, Mellander P-E, Högberg P. 2003. Tree root and soil heterotrophic respiration as revealed by girdling of boreal Scots pine forest: extending observations beyond the first year. Plant, Cell and Environment 26: 1287-1296.
Bloem J, Vos A. 2004. Fluorescent staining of microbes for total direct counts. In: Kowalchuk GA, de Bruijn FJ, Head IM, Akkermans AD, van Elsas JD, eds. Molecular Microbial Ecology Manual, 2nd ed. Dordrecht, the Netherlands: Kluwer Academic Publishers, 402: 861-874.
Caldwell BA, Jumpponen A, Trappe JM. 2000. Utilization of major detrital substrates by dark-septate, root endophytes. Mycologia 92: 230-232.
Cameron SL. 1998. Colonization of Populus tremuloides seedlings by the fungus Phialocephala fortinii in the presence of the ectomycorrhizal fungus Thelephora terrestris. MSc dissertation, University of Guelph, Canada.
Cázares E, Trappe JM, Jumpponen A. 2005. Mycorrhiza-plant colonization patterns on a subalpine glacier forefront as a model system of primary succession. Mycorrhiza 15: 405-416.
Ceulemans R, Janssens IA, Jach ME. 1999. Effects of CO2 enrichment on trees and forests: lessons to be learned in view of future ecosystems studies. Annals of Botany 84: 577-590.
Clemmensen KE, Michelsen A, Jonasson S, Shaver GR. 2006. Increased ectomycorrhizal fungal abundance after long-term fertilization and warming of two artic tundra ecosystems. New Phytologist 171: 391-404.
Colpaert JV, van Assche JA, Luijtens K. 1992. The growth of the extramatrical mycelium of ectomycorrhizal fungi and the growth response of Pinus sylvestris L. New Phytologist 120: 127-135.
Colpaert JV, van Laere A, van Assche JA. 1996. Carbon and nitrogen allocation in ectomycorrhizal and non-mycorrhizal Pinus sylvestris L. seedlings. Tree Physiology 16: 787-793.
Colpaert JV, Verstuyft I. 1999. The Ingestadt concept in ectomycorrhizal research: Possibilities and limitations. Physiologia Plantarum 105: 233-238.
Conjeaud C, Scheromm P, Mousain D. 1996. Effects of phosphorus and ectomycorrhiza on maritime pine (Pinus pinaster). New Phytologist 133: 345-351.
Cudlin P, Kieliszewska-Rokicka B, Rudawska M, Grebenc T, Alberton O, Lehto T, Bakker MR, Borja I, Konôpka B, Leski T, Kraigher H, Kuyper TW. 2007. Fine roots and ectomycorrhizas as indicators of environmental change. Plant Biosystems 141: 406-425.
Curtis PS, Wang X. 1998. A meta-analysis of eleveted CO2 effects on woody plants mass, form, and physiology. Oecologia 113: 299-313.
Dalal RC. 1979. Simple procedure for the determination of total carbon and its radioactivity in soils and plant materials. Analyst 104: 151-154.
126
References
De Graaff M-A, van Groenigen K-J, Six J, Hungate B, van Kessel C. 2006. Interactions between plant growth and soil nutrient cycling under elevated CO2: a meta-analysis. Global Change Biology 12: 2077-2091.
Díaz S, Grime JP, Harris J, McPherson E. 1993. Evidence of a feedback mechanism limiting plant response to elevated carbon dioxide. Nature 364: 616-617.
Dosskey MG, Boersma L, Linderman RG. 1991. Role for the photosynthate demand of ectomycorrhizas in the response of Douglas fir seedlings to drying soil. New Phytologist 117: 327-334.
Dosskey MG, Linderman RG, Boersma L. 1990. Carbon-sink stimulation of photosynthesis in Douglas fir seedlings by some ectomycorrhizas. New Phytologist 115: 269-274.
Ek H. 1997. The influence of nitrogen fertilization on the carbon economy of Paxillus involutus in ectomycorrhizal association with Betula pendula. New Phytologist 135: 133-142.
Fernando AA, Currah RS. 1996. A comparative study of the effects of root endophytes Leptodontidium orchidicola and Phialocephala fortinii (Fungi Imperfecti) on the growth of some subalpine plants in culture. Canadian Journal of Botany 74: 1071-1078.
Finzi AC, DeLucia EH, Hamilton JG, Richter DD, Schlesinger W. 2002. The nitrogen budget of a pine forest under free air CO2 enrichment. Oecologia 132: 567-578.
Finzi AC, Norby RJ, Calfapietra C, Gallet-Budynek A, Gielen B, Holmes WE, Hoosbeek MR, Iversen CM, Jackson RB, Kubiske ME, Ledford J, Liberloo M, Oren R, Polle A, Pritchard S, Zak DR, Schlesinger WH, Ceulemans R. 2007. Increases in nitrogen uptake rather than nitrogen-use efficiency support higher rates of temperate forest productivity under elevated CO2. Proceedings of the National Academy of Sciences of the USA. 104: 14014-14019.
Fitter AH, Graves JD, Watkins NK, Robinson D, Scrimgeour C. 1998. Carbon transfer between plants and its control in networks of arbuscular mycorrhizas. Functional Ecology 12: 406-412.
Fitter AH, Heinemeyer A, Staddon PL. 2000. The impact of elevated CO2 and global climate change on arbuscular mycorrhizas: a mycocentric approach. New Phytologist 147: 179-187.
Fitter AH. 2001. Specificity, links and networks in the control of diversity in plant and microbial communities. In: Press, MC, Huntly, NJ, Levin S, eds. Ecology: Achievement and Challenge. Oxford, Blackwell Science, 95-114.
Fransson PMA, Anderson IC, Alexander IJ. 2007. Does carbon partitioning in ectomycorrhizal pine seedlings under elevated CO2 vary with fungal species? Plant and Soil 291: 323-333.
Fransson PMA, Taylor AFS, Finlay RD. 2001. Elevated atmospheric CO2 alters root symbiont community structure in forest trees. New Phytologist 152: 431-442.
127
References
Fransson PMA, Taylor AFS, Finlay RD. 2005. Mycelial production, spread and root colonization by the ectomycorrhizal fungi Hebeloma crustuliniforme and Paxillus involutus under elevated atmospheric CO2. Mycorrhiza 15: 25-31.
Garcia MO, Ovasapyan T, Greas M, Treseder KK. 2008. Mycorrhizal dynamics under elevated CO2 and nitrogen fertilization in a warm temperate forest. Plant and Soil 303: 301-310.
Gebauer RLE, Reynolds, JF, Strain BR. 1996. Allometric relations and growth in Pinus taeda: the effect of elevated CO2 and changing N availability. New Phytologist 134: 85-93.
Godbold DL, Berntson GM. 1997. Elevated atmospheric CO2 concentration changes ectomycorrhizal morphotype assemblages in Betula papyrifera. Tree Physiology 17: 347-350.
Gorissen A, Joosten NN, Jansen AE. 1991. Effects of ozone and ammonium sulphate on carbon partitioning to mycorrhizal roots of juvenile Douglas fir. New Phytologist 119: 243-250.
Gorissen A, Kuikman PJ, van Ginkel JH, van de Beek H, Jansen AG. 1996. ESPAS - an advanced phytotron for measuring carbon dynamics in a whole plant-soil system. Plant and Soil 179: 81-87.
Gorissen A, Kuyper TW. 2000. Fungal species-specific responses of ectomycorrhizal Scots pine (Pinus sylvestris) to elevated [CO2]. New Phytologist 146: 163-168.
Grünig CR, McDonald BA, Sieber TN, Rogers SO, Holdenrieder O. 2004. Evidence for subdivision of the root-endophyte Phialocephala fortinii into cryptic species and recombination within species. Fungal Genetics and Biology 41: 676-687.
Gurevitch J, Hedges LV. 1999. Statistical issues in ecological meta-analysis. Ecology 80: 1142-1149.
Gurevitch J, Hedges LV. 2001. Meta-analysis: combining the results of independent experiments. In: Scheiner SM, Gurevitch J, eds. Design and Analysis of Ecological Experiments, 2nd edn. Oxford, UK: Oxford University Press, 347-369.
Hambleton S, Sigler L. 2005. Meliniomyces, a new anamorph genus for root-associated fungi with phylogenetic affinities to Rhizoscyphus ericae (= Hymenoscyphus ericae), Leotiomycetes. Studies in Mycology 53: 1-27.
Harney SK, Rogers SO, Wang CJK. 1997. Molecular characterization of dematiaceous root endophytes. Mycological Research 101: 1397-1404.
Hashimoto Y, Hyakumachi M. 2001. Effects of isolates of ectomycorrhizal fungi and endophytic Mycelium radicis atrovirens that were dominant in soil from disturbed sites on growth of Betula platyphylla var. japonica seedlings. Ecological Research 16: 117-125.
Hedges LV, Gurevitch J, Curtis PS. 1999. The meta-analysis of response ratio in experimental ecology. Ecology 80: 1150-1156.
128
References
Heinemeyer A, Hartley IP, Evans SP, de la Fuentes JAC, Ineson P. 2007. Forest soil CO2 flux: uncovering the contribution and environmental responses of ectomycorrhizas. Global Change Biology 13: 1786-1797.
Helmisaari H-S, Derome J, Nöjd P, Kukkola M. 2007. Fine root biomass in relation to site and stand characteristics in Norway spruce and Scots pine stands. Tree Physiologist 27: 1493-1504.
Hendricks JJ, Mitchell RJ, Kuehn KA, Pecot SD, Sims SE. 2006. Measuring external mycelia production of ectomycorrhizal fungi in the field: the soil matrix matters. New Phytologist 171: 179-186.
Hobbie EA, Colpaert JV. 2003. Nitrogen availability and colonization by mycorrhizal fungi correlate with nitrogen isotope patterns in plants. New Phytologist 157: 115-126.
Hobbie EA, Rygiewicz PT, Johnson MG, Moldenke AR. 2007. 13C and 15N in microarthropods reveal little response of Douglas-fir ecosystems to climate change. Global Change Biology 13: 1386-1397.
Hobbie EA. 2006. Carbon allocation to ectomycorrhizal fungi correlates with belowground allocation in culture studies. Ecology 87: 563-569.
Högberg P, Read DJ. 2006. Towards a more plant physiological perspective on soil ecology. Trends in Ecology and Evolution 21: 548-554.
Horton TR, Cázares E, Bruns TD. 1998. Ectomycorrhizal, vesicular-arbuscular and dark septate fungal colonization of bishop pine (Pinus muricata) seedlings in the first 5 months of growth after wildfire. Mycorrhiza 8: 11-18.
Hu S, Tu C, Chen X, Gruver JB. 2006. Progressive N limitation of plant response to elevated CO2: a microbiological perspective. Plant and Soil 289: 47-58.
Ineichen K, Wiemken V, Wiemken A. 1995. Shoots, roots and ectomycorrhiza formation of pine seedlings at elevated atmospheric carbon dioxide. Plant, Cell & Environment 18: 703-707.
Ineichen K, Wiemken V. 1992. Changes in the fungus-specific, soluble-carbohydrate pool during rapid and synchronous ectomycorrhiza formation of Picea abies with Pisolithus tinctorius. Mycorrhiza 2: 1-7.
Jablonski LM, Wang X, Curtis PS. 2002. Plant reproduction under elevated CO2 conditions: a meta-analysis of reports on 79 crops and wild species. New Phytologist 156: 9-26.
Jastrow JD, Miller RM, Lussenhop J. 1998. Contributions of interacting biological mechanisms to soil aggregate stabilization in restored prairie. Soil Biology & Biochemistry 30: 905-916.
Johnson DW. 2006. Progressive N limitation in forests: review and implications for long-term responses to elevated CO2. Ecology 87: 64-75.
Johnson NC, Graham JH, Smith FA. 1997. Functioning of mycorrhizal associations along the mutualism-parasitism continuum. New Phytologist 135: 575-585.
129
References
Johnson NC, Hoeksema JD, Bever JD, Chaudhary VB, Gehring C, Klironomos J, Koide R, Miller RM, Moore J, Moutoglis P, Schwartz M, Simard S, Swenson W, Umbanhowar J, Wilson G, Zabinki C. 2006. From lilliput to brobdingnag: extending models of mycorrhizal functions across scales. BioScince 56: 889-900.
Jones MD, Smith SE. 2004. Exploring functional definitions of mycorrhizas: Are mycorrhizas always mutualisms? Canadian Journal of Botany 82: 1089-1109.
Jumpponen A, Mattson KG, Trappe JM. 1998. Mycorrhizal functioning of Phialocephala fortinii with Pinus contorta on glacier forefront soil: interactions with nitrogen and organic matter. Mycorrhiza 7: 261-265.
Jumpponen A, Trappe JM. 1998a. Dark septate endophytes: a review of facultative biotrophic root-colonizing fungi. New Phytologist 140: 295-310.
Jumpponen A, Trappe JM. 1998b. Performance of Pinus contorta inoculated with two strains of root endophytic fungus, Phialocephala fortinii: effects of synthesis system and glucose concentration. Canadian Journal of Botany 76: 1205-1213.
Jumpponen A. 2001. Dark septate endophytes - are they mycorrhizal? Mycorrhiza 11: 207-211.
Jumpponen A. 2003. Soil fungal community assembly in a primary successional glacier forefront ecosystem as inferred from rDNA sequence analyses. New Phytologist 158: 569-578.
Kaldorf M, Renker C, Fladung M, Buscot F. 2004. Characterization and spatial distribution of ectomycorrhizas colonizing aspen clones released in an experimental field. Mycorrhiza 14: 295-306.
Kamminga-van Wijk C, Prins HBA. 1989. The influence of pH on ectomycorrhizal development of Pseudotsuga menziesii inoculated with Laccaria bicolor in hydroculture. Agriculture Ecosystem Environment 28: 213-217.
Kernaghan G, Sigler L, Khasa D. 2003. Mycorrhizal and root endophytic fungi of containerized Picea glauca seedlings assessed by rDNA sequence analysis. Microbial Ecology 45: 128-136.
Klironomos JN, Allen MF, Rillig MC, Piotrowski J, Makvandi-Nejad S, Wolfe BE, Powell JR. 2005. Abrupt rise in atmospheric CO2 overestimates community response in a model plant-soil system. Nature 433: 621-624.
Koide RT. 1991. Density-dependent response to mycorrhizal infection in Abutilon theophrasti Medic. Oecologia 85: 389-395.
Kuyper TW, De Geode RGM. 2004. Interaction between higher plants and soil-dwelling organisms. In: Van der Maarel E, ed. Vegetation Ecology. Blackwell Publishing, Ltd. pp. 286-308.
Landis FC, Fraser LH. 2008. A new model of carbon and phosphorus transfers in arbuscular mycorrhizas. New Phytologist 177: 466-479.
130
References
Lilleskov EA, Fahey TJ, Lovett GM. 2001. Ectomycorrhizal fungal aboveground community change over an atmospheric nitrogen deposition gradient. Ecological Applications 11: 397-410.
Lilleskov EA, Hobby EA, Fahey TJ. 2002. Ectomycorrhizal fungal taxa differing in response to nitrogen deposition also differ in pure culture organic nitrogen use and natural abundance of nitrogen isotopes. New Phytologist 154: 219-231.
Lilleskov EA, Parrent JL. 2007. Can we develop general predictive models of mycorrhizal fungal community – environment relationships? New Phytologist 174: 250-256.
Lindahl BO, Taylor AFS, Finlay RD. 2002. Defining nutritional constraints on carbon cycling in boreal forests – towards a less ‘phytocentric’ perspective. Plant and Soil 242: 123-135.
Loreau M. 2000. Biodiversity and ecosystem functioning: recent theoretical advances. Oikos 91: 3-17.
Luo Y, Su B, Currie WS, Dukes JS, Finzi A, Hartwig U, Hungate B, McMurtrie RS, Oren R, Parton WJ, Pataki DE, Shaw R, Zak DR, Field CB. 2004. Progressive nitrogen limitation of ecosystem responses to rising atmospheric carbon dioxide. BioScience 54: 731-739.
Mandyam K, Jumpponen A. 2005. Seeking the elusive function of the root-colonising dark septate endophytic fungi. Studies in Mycology 53: 173-189.
Marmeisse R, Gryta H, Jargeat P, Fraissinet-Tachet L, Gay G, Debaud JC. 1999. Hebeloma. In: Cairney JWG, Chambers SM, eds. Ectomycorrhizal fungi: Key genera in profile. Springer-Verlag, Berlin, 89-127.
McGonigle TP. 1988. A numerical analyis of published field trials with vesicular-arbuscular mycorrhizal fungi. Functional Ecology 2: 473-478.
Menkis A, Allmer J, Vasiliauskas R, Lygis V, Stenlid J, Finlay R. 2004. Ecology and molecular characterization of dark septate fungi from roots, living stems, coarse and fine woody debris. Mycological Research 108: 965-973.
Millard P, Sommerkorn M, Grelet G-A. 2007. Environmental change and carbon limitation in trees: a biochemical, ecophysiological and ecosystem appraisal. New Phytologist 175: 11-28.
Miller RM, Jastrow JD. 1990. Hierarchy of root and mycorrhizal fungal interactions with soil aggregation. Soil Biology & Biochemistry 22: 579-584.
Miller SL, Durall DM, Rygiewicz PT. 1989. Temporal allocation of 14C to extramatrical hyphae of ectomycorrhizal ponderosa pine seedlings. Tree Physiology 5: 239-249.
Mitchell RJ. 1992. Testing evolutionary and ecological hypotheses using path analysis and structural equation modeling. Functional Ecology 6: 123-129.
Mitchell, RJ. 2001. Path analysis: pollination. In: Scheiner SM, Gurevitch J, eds. Design and Analysis of Ecological Experiments, 2nd edn. Oxford, UK: Oxford University Press, 217-234.
131
References
Nehls U, Hampp R. 2000. Carbon allocation in ectomycorrhizas. Physiological and Molecular Plant Pathology 57: 95-100.
Nehls U, Mikolajewski S, Magel E, Hampp R. 2001. Carbohydrate metabolism in ectomycorrhizas: gene expression, monosaccharide transport and metabolic control. New Phytologist 150: 533-541.
Norby RJ, DeLucia EH, Gielen B, Calfapietra C, Giardina CP, King JS, Ledford J, McCarthy HR, Moore DJP, Ceulemans R, De Angelis P, Finzi AC, Karnosky DF, Kubiske ME, Lukac M, Pregitzer KS, Scarascia-Mugnozza GE, Schlesinger WH, Oren R. 2005. Forest response to elevated CO2 is conserved across a broad range of productivity. Proceedings of the National Academy of Sciences of the USA. 102: 18052-18056.
Nylund JE, Wallander H. 1989. Effects of ectomycorrhiza on host growth and carbon balance in a semi-hydroponic cultivation system. New Phytologist 112: 389-398.
O’Dell TE, Massicotte HB, Trappe JM. 1993. Root colonization of Lupinus latifolius Agardh. and Pinus contorta Dougl. by Phialocephala fortinii Wang & Wilcox. New Phytologist 124: 93-100.
O’Neill EG. 1994. Responses of soil biota to elevated atmospheric carbon dioxide. Plant and Soil 165: 55-65.
Parrent JL, Morris WF, Vilgalys R. 2006. CO2-enrichment and nutrient availability alter ectomycorrhizal fungal communities. Ecology 87: 2278-2287.
Parrent JL, Vilgalys R. 2007. Biomass and compositional responses of ectomycorrhizal fungal hyphae to elevated CO2 and nitrogen fertilization. New Phytologist 176: 164-174.
Peterson RL, Massicotte HB, Melville LH. 2004. Mycorrhizas: Anatomy and Cell Biology. NRC Research Press, National Research Council of Canada, Ottawa.
Piercey MM, Graham SW, Currah RS. 2004. Patterns of genetic variation in Phialocephala fortinii across a broad latitudinal transect in Canada. Mycological Research 108: 955-964.
Piercey MM, Thormann MN, Currah RS. 2002. Saprobic characteristics of three fungal taxa from ericalean roots and their association with the roots of Rhododendron groenlandicum and Picea mariana in culture. Mycorrhiza 12: 175-180.
Plassard C, Bonafos B, Touraine B. 2000. Differential effects of mineral and organic N sources, and of ectomycorrhizal infection by Hebeloma cylindrosporum, on growth and N utilization in Pinus pinaster. Plant, Cell & Environment 23: 1195-1205.
Poorter H, Nagel O. 2000. The role of biomass allocation in the growth response of plants to different levels of light, CO2, nutrients and water: a quantitative review. Australian Journal of Plant Physiology 27: 595-607.
Poorter H, Pérez-Soba M. 2001. The growth response of plants to elevated CO2 under non-optimal environmental conditions. Oecologia 129: 1-20.
132
References
Postma JWM, Olsson PA, Falkengren-Grerup U. 2007. Root colonisation by arbuscular mycorrhizal, fine endophytic and dark septate fungi across a pH gradient in acid beech forests. Soil Biology and Biochemistry 39: 400-408.
Read DJ, Haselwandter K. 1981. Observations on the mycorrhizal status of some alpine plant communities. New Phytologist 88: 341-352.
Read DJ, Leake JR, Perez-Moreno J. 2004. Mycorrhizal fungi as drivers of ecosystem processes in heathland and boreal forest biomes. Canadian Journal of Botany 82: 1243-1263.
Read DJ. 2002. Towards ecological relevance – progress and pitfalls in the path towards an understanding of mycorrhizal functions in nature. In: Van der Heijden MGA & Sanders IR, eds., Mycorrhizal ecology. Ecological studies, vol. 157. New York, USA: Springer-Verlag Berlin Heidelberg, pp. 3-29.
Reich PB, Hungate BA, Luo Y. 2006. Carbon-nitrogen interactions in terrestrial ecosystems in response to rising atmospheric carbon dioxide. Annual Review of Ecology, Evolution, and Systematics 37: 611-636.
Reuter DJ, Robinson JB, Dutkiewicz C. 1997. Plant analysis: an interpretation manual. Collingwood, Australia: CSIRO.
Rillig MC, Allen MF. 1999. What is the role of arbuscular mycorrhizal fungi in plant-to-ecosystem responses to elevated atmospheric CO2? Mycorrhiza 9: 1-8.
Rillig MC, Treseder KK, Allen MF. 2002a. Global change and mycorrhizal fungi. In: Van der Heijden MGA & Sanders IR, eds. Mycorrhizal Ecology. Ecological studies, vol. 157. New York, USA: Springer-Verlag Berlin Heidelberg, pp. 135-160.
Rillig MC, Wright SF, Eviner VT. 2002b. The role of arbuscular mycorrhizal fungi and glomalin in soil aggregation: comparing effects of five plant species. Plant and Soil. 238: 325-333.
Robinson D, Fitter A. 1999. The magnitude and control of carbon transfer between plants linked by a common mycorrhizal network. Journal of Experimental Botany 50: 9-13.
Rosenberg MS, Adams DC, Gurevitch J. 2000. MetaWin: Statistical software for meta-analysis. Version 2. Sunderland, MA, USA: Sinauer Associates.
Rouhier H, Read DJ. 1998. Plant and fungal responses to elevated atmospheric carbon dioxide in mycorrhizal seedlings of Pinus sylvestris. Environmental and Experimental Botany 40: 237-246.
Ruotsalainen AL. 2003. Mycorrhizal colonization and plant performance in arcto-alpine conditions. PhD thesis, University of Oulu, Finland.
Rygiewicz PT, Andersen CP. 1994. Mycorrhizae alter quality and quantity of carbon allocated below ground. Nature 396: 58-60.
Sanders IR, Streitwolf-Engel R, van der Heijden MGA, Boller T, Wiemken A. 1998. Increased allocation to external hyphae of arbuscular mycorrhizal fungi under CO2 enrichment. Oecologia 117: 496-503.
133
References
Schadt CW, Mullen RB, Schmidt SK. 2001. Isolation and phylogenetic identification of a dark-septate fungus associated with the alpine plant Ranunculus adoneus. New Phytologist 150: 747-755.
Schnepf A, Roose T. 2006. Modelling the contribution of arbuscular mycorrhizal fungi to plant phosphate uptake. New Phytologist 171: 669-682.
Schulz B, Boyle C, Draeger S, Römmert A-K Krohn K. 2002. Endophytic fungi: a source of novel biologically active secondary metabolites. Mycological Research 106: 996-1004.
Sieber TN, Grünig CR. 2006. Biodiversity of fungal root-endophyte communities and populations, in particular of the dark septate endophyte Phialocephala fortinii s.l. In: Schulz B, Boyle C, Sieber TN, eds. Microbial root endophytes. Soil biology, volume 9. Springer-Verlag Berlin Heidelberg, 107-132.
Six J, Frey SD, Thiet RK, Batten KM. 2006. Bacterial and fungal contributions to carbon sequestration in agroecosystems. Soil Science Society of America Journal 70: 555-569.
Smith SJ, Read DJ. 1997. Mycorrhizal symbiosis, 2nd edn. Cambridge, UK: Academic Press. Staddon PL, Fitter AH. 1998. Does elevated atmospheric carbon dioxide affect arbuscular
mycorrhizas? Trends in Ecology and Evolution 13: 455-458. Staddon PL, Heinemeyer A, Fitter AH. 2002. Mycorrhizas and global environmental
change: research at different scales. Plant and Soil 244: 253-261. Staddon PL. 1998. Insights into mycorrhizal colonization at elevated CO2: a simple carbon
partitioning model. Plant and Soil 205: 171-180. Staddon PL. 2005. Mycorrhizal fungi and environmental change: the need for a mycocentric
approach. New Phytologist 167: 635-637. Stoyke G, Currah RS. 1991. Endophytic fungi from the mycorrhizae of alpine ericoid plants.
Canadian Journal of Botany 69: 347-352. Stoyke G, Egger KN, Currah RS. 1992. Characterization of sterile endophytic fungi from
the mycorrhizae of subalpine plants. Canadian Journal of Botany 70: 2009-2016. Subke J-A, Inglima I, Cotrufo F. 2006. Trends and methodological impacts in soil CO2
efflux partitioning: A metaanalytical review. Global Change Biology 12: 921-943. Summerbell RC. 2005a. From Lamarckian fertilizers to fungal castles: recapturing the pre-
1985 literature on endophytic and saprotrophic fungi associated with ectomycorrhizal root systems. Studies in Mycology 53: 191-256.
Summerbell RC. 2005b. Root endophyte and mycorrhizosphere fungi of black spruce, Picea mariana, in a boreal forest habitat: influence of site factors on fungal distributions. Studies in Mycology 53: 121-145.
Taylor AFS, Fransson PM, Högberg P, Högberg MN, Plamboeck AH. 2003. Species level patterns in C-13 and N-15 abundance of ectomycorrhizal and saprotrophic fungal sporocarps. New Phytologist 159: 757-774.
134
References
Temminghoff EJM, Houba VJG. 2004. Digestion in tubes with H2SO4 – salicylic acid – H2O2 and selenium. In: Temminghoff EJM, Houba VJG, eds. Plant analysis procedures. 2nd ed. Dordrecht, the Netherlands: Kluwer Academic Publishers, 7-9.
Tingey DT, Phillips DL, Johnson MG. 2000. Elevated CO2 and conifer roots: effects on growth, life span and turnover. New Phytologist 147: 87-103.
Treseder KK, Allen MF. 2000. Mycorrhizal fungi have a potential role in soil carbon storage under elevated CO2 and nitrogen deposition. New Phytologist 147: 189-200.
Treseder KK, Allen MF. 2002. Direct nitrogen and phosphorus limitation of arbuscular mycorrhizal fungi: a model and field test. New Phytologist 155: 507-515.
Treseder KK. 2004. A meta-analysis of mycorrhizal responses to nitrogen, phosphorus, and atmospheric CO2 in field studies. New Phytologist 164: 347-355.
Treu R, Laursen GA, Stephenson SL, Landolt JC, Densmore R. 1996. Mycorrhizae from Denali National Park and Preserve, Alaska. Mycorrhiza 6: 21-29.
Van der Heijden EW, Kuyper TW. 2001. Laboratory experiments imply the conditionality of mycorrhizal benefits for Salix repens: role of pH and nitrogen to phosphorus ratios. Plant and Soil 228: 275-290.
Van Groenigen K-J, Six J, Hungate BA, De Graaff M-A, Van Breemen N, Van Kessel C. 2006. Element interactions limit soil carbon storage. Proceedings of the National Academy of Sciences of the USA 103: 6571-6574.
Villarreal-Ruiz L, Anderson IA, Alexander IJ. 2004. Interaction between an isolate from the Hymenoscyphus ericae aggregate and roots of Pinus and Vaccinium. New Phytologist 164: 183-192.
Vohník M, Lukančič S, Bahor E, Regvar M, Vosátka M, Vodnik D. 2003. Inoculation of Rhododendron cv. Belle-Heller with two strains of Phialocephala fortinii in two differents substrates. Folia Geobotanica 38: 191-200.
Vrålstad T, Fossheim T, Schumacher T. 2000. Piceirhiza bicolorata - the ectomycorrhizal expression of the Hymenoscyphus ericae aggregate? New Phytologist 145: 549-563.
Vrålstad T, Myhre E, Schumacher T. 2002a. Molecular diversity and phylogenetic affinities of symbiotic root-associated ascomycetes of the Helotiales in burnt and metal polluted habitats. New Phytologist 155: 131-148.
Vrålstad T, Schumacher T, Taylor AFS. 2002b. Mycorrhizal synthesis between fungal strains of the Hymenoscyphus ericae aggregate and potential ectomycorrhizal and ericoid hosts. New Phytologist 153: 143-152.
Wallander H. 1995. A new hypothesis to explain allocation of dry matter between mycorrhizal fungi and pine seedlings in relation to nutrient supply. Plant and Soil 168-169: 243-248.
Wallander H. 2006. External mycorrhizal mycelia – the importance of quantification in natural ecosystems. New Phytologist 171: 240-242.
135
References
Wang Z, Johnston PR, Takamatsu S, Spatafora JW, Hibbett DS. 2006. Toward a phylogenetic classification of the Leotiomycetes based on rDNA data. Mycologia 98: 1065-1075.
Wilcox HE, Wang CJK. 1987a. Mycorrhizal and pathological associations of dematiaceous fungi in roots of 7-month-old tree seedlings. Canadian Journal of Forest Research 17: 884-899.
Wilcox HE, Wang CJK. 1987b. Ectomycorrhizal and ectendomycorrhizal associations of Phialophora finlandia with Pinus resinosa, Picea rubens and Betula alleghaniensis. Canadian Journal of Forestry Research 17: 976-990.
Yanai RD, Fahey TJ, Miller SL. 1995. Efficiency of nutrient acquisition by fine roots and mycorrhizae. In: Smith WK, Hinckley, TM, eds. Resource physiology of conifers. New York, USA: Academic Press, 75-103.
Yu TEJC. 2000. Characterization of the interaction between Phialocephala fortinii and two plant species, Asparagus officinalis and Lupinus latifolius. MSc dissertation, University of Guelph, Canada.
References on ECM for meta-analysis (Alberton et al., 2005) Berntson GM, Bazzaz FA. 1998. Regenerating temperature forest mesocosms in elevated
CO2: belowground growth and nitrogen cycling. Oecologia 113: 115-125. Berntson GM, Wayne PM, Bazzaz FA. 1997. Below-ground architecture and mycorrhizal
responses to elevated CO2 in Betula alleghaniensis populations. Functional Ecology 11: 684-695.
Constable JVH, Bassirirad H, Lussenhop J, Zerihun Y. 2001. Influence of elevated CO2 and mycorrhizae on nitrogen acquisition: contrasting responses in Pinus taeda and Liquidambar styraciflua. Tree Physiology 21: 83-91.
DeLucia EH, Callaway RM, Thomas EM, Schlesinger WH. 1997. Mechanisms of phosphorus acquisition for Ponderosa pine seedlings under high CO2 and temperature. Annals of Botany 79: 111-120.
Fransson PMA, Taylor AFS, Finlay RD. 2005. Mycelial production, spread and root colonisation by the ectomycorrhizal fungi Hebeloma crustuliniforme and Paxillus involutus under elevated atmospheric CO2. Mycorrhiza 15: 25-31.
Godbold DL, Berntson GM, Bazzaz FA. 1997. Growth and mycorrhizal colonization of three North American tree species under elevated CO2. New Phytologist 137: 433-440.
Gorissen A, Kuyper TW. 2000. Fungal species-specific responses of ectomycorrhizal Scots pine (Pinus sylvestris) to elevated [CO2]. New Phytologist 146: 163-168.
136
References
Ineichen K, Wiemken V, Wiemken A. 1995. Shoots, roots and ectomycorrhiza formation of pine seedlings at elevated atmospheric carbon dioxide. Plant, Cell and Environment 18: 703-707.
Kasurinen A, Helmisaari HS, Holopainen T. 1999. The influence of elevated CO2 and O3 on fine roots and mycorrhizas of naturally growing young Scots pine trees during three exposure years. Global Change Biology 5: 771-780.
Kytöviita MM, Le Thiec D, Dizengremel P. 2001. Elevated CO2 and ozone reduce nitrogen acquisition by Pinus halepensis from its mycorrhizal symbiont. Phyiologia Plantarum 111: 305-312.
Kytöviita MM, Pelloux J, Fontaine V, Botton B, Dizengremel P. 1999. Elevated CO2 does not ameliorate effects of ozone on carbon allocation in Pinus halepensis and Betula pendula in symbiosis with Paxillus involutus. Physiologia Plantarum 106: 370-377.
Langley JA, Dijkstra P, Drake BG, Hungate BA. 2003. Ectomycorrhizal colonization, biomass, and production in a Regenerating Scrub Oak Forest in response to elevated CO2. Ecosystems 6: 424-430.
Lewis JD, Strain BR. 1996. The role of mycorrhizas in the response of Pinus taeda seedlings to elevated CO2. New Phytologist 133: 431-443.
Lewis JD, Thomas RB, Strain BR. 1994. Effect of elevated CO2 on mycorrhizal colonization of loblolly pine (Pinus taeda L.) seedlings. Plant and Soil 165: 81-88.
Loewe A, Einig W, Shi L, Dizengremel P, Hampp R. 2000. Mycorrhiza formation and elevated CO2 both increase the capacity for sucrose synthesis in source leaves of spruce and aspen. New Phytologist 145: 565-574.
Lukac M, Calfapietra C, Godbold DL. 2003. Production, turnover and mycorrhizal colonization of root systems of three Populus species grown under elevated CO2 (POPFACE). Global Change Biology 9: 838-848.
Markkola AM, Ohtonen A, Ahonen-Jonnarth U, Ohtonem R. 1996. Scots pine responses to CO2 enrichment – I. Ectomycorrhizal fungi and soil fauna. Environmental Pollution 94: 309-316.
Pérez-Soba M, Dueck TA, Gigliota P, Kuiper PJC. 1995. Interactions of elevated CO2, NH3 and O3 on mycorrhizal infection, gas exchange and N metabolism in sampling of Scots pine. Plant and Soil 176: 107-116.
Rouhier H, Read DJ. 1998a. Plant and fungal responses to elevated atmospheric carbon dioxide in mycorrhizal seedlings of Pinus sylvestris. Environmental and Experimental Botany 40: 237-246.
Rouhier H, Read DJ. 1999. Plant and fungal responses to elevated atmospheric CO2 in mycorrhizal seedlings of Betula pendula. Environmental and Experimental Botany 42: 231-241.
137
References
Turnau K, Berger A, Loewe A, Einig W, Hampp R, Chalot M, Dizengremel P, Kottke I. 2001. Carbon dioxide concentration and nitrogen input affect the C and N storage pools in Amanita muscaria - Picea abies mycorrhizae. Tree Physiology 21: 93-99.
Vose JM, Elliot KJ, Johnson DW, Walker RF, Johnson MG, Tingey DT. 1995. Effects of elevated CO2 and N fertilization on soil respiration from ponderosa pine (Pinus ponderosa) in open-top chambers. Canadian Journal of Forest Research 25: 1243-1251.
Walker RF, Geisinger DR, Johnson DW, Ball JT. 1995. Enriched atmospheric CO2 and soil effects on growth and ectomycorrhizal colonization of juvenile ponderosa pine. Forest Ecology and Management 78: 207-215.
Walker RF, Geisinger DR, Johnson DW, Ball JT. 1997. Elevated CO2 and soil N fertility effects on growth, mycorrhizal colonization, and xylem water potential of juvenile ponderosa pine in a field soil. Plant and Soil 195: 25-36.
Walker RF, Geisinger DR, Johnson DW, Ball JT. 1998a. Atmospheric CO2 enrichment and soil N fertility effects on juvenile ponderosa pine: Growth, ectomycorrhizal development, and xylem water potential. Forest Ecology and Management 102: 33-44.
Walker RF, Geisinger DR, Johnson DW, Ball JT. 1998b. Growth and ectomycorrhizal colonization of ponderosa pine seedlings supplied different levels of atmospheric CO2 and soil N and P. Forest Ecology and Management 109: 9-20.
Wiemken V, Ineichen K, Boller T. 2001a. Development of ectomycorrhizas in model beech-spruce ecosystems on siliceous and calcareous soil: a 4-year experiment with atmospheric CO2 enrichment and nitrogen fertilization. Plant and Soil 234: 99-108.
Wiemken V, Laczko E, Ineichen K, Boller T. 2001b. Effects of elevated carbon dioxide and nitrogen fertilization on mycorrhizal fine roots and the soil microbial community in beech-spruce ecosystems on siliceous and calcareous soil. Microbial Ecology 42: 126-135.
References on ECM for meta-analysis (Updated 02 January, 2008) Alberton O, Kuyper TW, Gorissen A. 2007. Competition for nitrogen between Pinus
sylvestris and ectomycorrhizal fungi generates potential for negative feedback under elevated CO2. Plant and Soil 296: 159-172.
Alberton O, Kuyper TW. 2008. Ectomycorrhizal fungi associated with seedlings of Pinus sylvestris respond differently to increased carbon and nitrogen availability – implications for ecosystem response to global change. In prep.
Berntson GM, Bazzaz FA .1997. Nitrogen cycling in microcosms of yellow birch exposed to elevated CO2: simultaneous positive and negative below-ground feedbacks. Global Change Biology 3: 247-258.
138
References
Choi DS, Quoreshi AM, Maruyama Y, Kin HO, Koike T. 2005. Effects of ectomycorrhizal infection on growth and photosynthetic characteristics of Pinus densiflora seedlings grown under elevated CO2 concentrations. Photosynthetica 43: 223-229.
Fransson PMA, Anderson IC, Alexander IJ. 2007. Does carbon partitioning in ectomycorrhizal pine seedlings under elevated CO2 vary with fungal species? Plant and Soil 291: 323-333.
Godbold DL, Hoosbeek MR, Lukac M, Cotrufo MF, Janssens IA, Ceulemans R, Polle A, Velthorst EJ, Scarascia-Mugnozza G, De Angelis P, Miglietta F, Peressotti A. 2006. Mycorrhizal hyphal turnover as a dominant process for carbon input into soil organic matter. Plant and Soil 281: 15-24.
Hobbie EA, Rygiewicz PT, Johnson MG, Moldenke AR. 2007. 13C and 15N in microarthropods reveal little response of Douglas-fir ecosystems to climate change. Global Change Biology 13: 1386-1397.
Kasai K, Usami T, Lee J, Ishikawa S-I, Oikawa T. 2000. Responses of ectomycorrhizal colonization and morphotype assemblage of Quercus myrsinaefolia seedlings to elevated air temperature and elevated atmospheric CO2. Microbes and Environment 15: 197-207.
Kasurinen A, Keinänen MM, Kaipainen S, Nilsson LO, Vapaavuori E, Kontro MH, Holopainen T. 2005. Below-ground responses of silver birch trees exposed to elevated CO2 and O3 levels during three growing seasons. Global Change Biology 11: 1167-1179.
King JS, Pregitzer KS, Zak DR, Holmes WE, Schmidt K. 2005. Fine root chemistry and decomposition in model communities of north-temperate tree species show little response to elevated atmospheric CO2 and varying soil resource availability. Oecologia 146: 318-328.
Kogowara S, Norisada M, Tange T, Yagi H, Kojima K. 2006. Elevated atmospheric CO2 concentration alters the effect of phosphate supply on growth of Japanese red pine (Pinus densiflora) seedlings. Tree Physiology 26: 25-33.
Shinano T, Yamanoto T, Tawaraya K, Tadokoro M, Koike T, Osaki M. 2007. Effects of elevated atmospheric CO2 concentration on the nutrient uptake characteristics of Japanese larch (Larix kaempferi). Tree Physiology 27: 97-104.
References on AM for meta-analysis (Alberton et al., 2005) Constable JVH, Bassirirad H, Lussenhop J, Zerihun Y. 2001. Influence of elevated CO2
and mycorrhizae on nitrogen acquisition: contrasting responses in Pinus taeda and Liquidambar styraciflua. Tree Physiology 21: 83-91.
139
References
Gavito ME, Bruhn D, Jakobsen I. 2002. Phosphorus uptake by arbuscular mycorrhizal hyphae does not increase when the host plant grows under atmospheric CO2 enrichment. New Phytologyst 154: 751-760.
Gavito ME, Curtis PS, Mikkelsen TN, Jakobsen I. 2000. Atmospheric CO2 and mycorrhizas effects on biomass allocation and nutrient uptake of nodulated pea (Pisum sativum L.) plants. Journal of Experimental Botany 51: 1931-1938.
Gavito ME, Schweiger P, Jakobsen I. 2003. P uptake by arbuscular mycorrhizal hyphae: effect of soil temperature and atmospheric CO2 enrichment. Global Change Biology 9: 106-116.
Hartwig UA, Wittman P, Braun R, Hartwig-Räz B, Jansa J, Mozafar A, Lüscher A, Leuchtmann A, Frossard E, Nösberger J. 2002. Arbuscular mycorrhizas infection enhances the growth response of Lolium perene to elevated atmospheric pCO2. Journal of Experimental Botany 53: 1207-1213.
Hu S, Wu J, Burkey KO, Firestone MK. 2005. Plant and microbial N acquisition under elevated atmospheric CO2 in two mesocosm experiments with annual grasses. Global Changes Biology 11: 213-223.
Jifon JL, Graham JH, Drouillard DL, Syvertsen JP. 2002. Growth depression of mycorrhizal Citrus seedlings grown at high phosphorus supply is mitigated by elevated CO2. New Phytologist 153: 133-142.
Jongen M, Fay P, Jones MB. 1996. Effects of elevated carbon dioxide and arbuscular mycorrhizal infection on Trifolium repens. New Phytologist 132: 413-423.
Klironomos JN, Allen MF, Rillig MC, Piotrowski J, Makvandi-Nejad S, Wolfe BE, Powell JR. 2005. Abrupt rise in atmospheric CO2 overestimates community response in a model plant-soil system. Nature 433: 621-624.
Klironomos JN, Rillig MC, Allen MF. 1996. Below-ground microbial and microfaunal responses to Artemisia tridendata grown under elevated atmospheric CO2. Functional Ecology 10: 527-534.
Klironomos JN, Ursic M, Rillig M, Allen MF. 1998. Interspecific differences in the response of arbuscular mycorrhizal fungi to Artemisia tridentata grown under elevated atmospheric CO2. New Phytologist 138: 599-605.
Louche-Tessandier D, Samson G, Hernández-Sebastià C, Chagvardieff P, Desjardins Y. 1999. Importance of light and CO2 on the effects of endomycorrhizal colonization on growth and photosynthesis of potato plantlets (Solanum tuberosum) in an in vitro tripartite system. New Phytologist 142: 539-550.
Lussenhop J, Treonis A, Curtis PS, Teeri, JA, Vogel CS. 1998. Response of soil biota to elevated atmospheric CO2 in poplar model systems. Oecologia 113: 247-251.
Olesniewicz KS, Thomas RB. 1999. Effects of mycorrhizal colonization on biomass production and nitrogen fixation of black locust (Robinia pseudoacacia) seedlings grown under elevated atmospheric carbon dioxide. New Phytologist 142: 133-140.
140
References
Rillig MC, Allen MF, Klironomos JN, Chiarello NR, Field CB. 1998. Plant species-specific changes in root-inhabiting fungi in California annual grassland: response to elevated CO2 and nutrients. Oecologia 113: 252-259.
Rillig MC, Allen MF. 1998. Arbuscular mycorrhizae of Gutierrezia sarothrae and elevated carbon dioxide: evidence for shifts in C allocation to and within the mycobiont. Soil Biology & Biochemistry 30: 2001-2008.
Rillig MC, Field CB, Allen MF. 1999. Soil biota responses to long-term atmospheric CO2 enrichment in two California annual grasslands. Oecologia 119: 572-577.
Rillig MC, Field CB. 2003. Arbuscular mycorrhizae respond to plants exposed to elevated atmospheric CO2 as a function of soil depth. Plant and Soil 254: 383-391.
Rouhier H, Read DJ. 1998b. The role of mycorrhizas in determing the response of Plantago lanceolata to CO2 enrichment. New Phytologist 139: 367-373.
Sanders IR, Streitwolf-Engel R, van der Heijden MGA, Boller T, Wiemken A. 1998. Increased allocation to external hyphae of arbuscular mycorrhizal fungi under CO2 enrichment. Oecologia 117: 496-503.
Staddon PL, Fitter AH, Graves J. 1999. Effect of elevated atmospheric CO2 on mycorrhizal colonization, external mycorrhizal hyphal production and phosphorus inflow in Plantago lanceolata and Trifolium repens in association with the arbuscular mycorrhizal fungus Glomus mosseae. Global Change Biology 5: 347-358.
Staddon PL, Graves J, Fitter AH. 1998. Effect of enhanced atmospheric CO2 on mycorrhizal colonization by Glomus mosseae in Plantago lanceolata and Trifolium repens. New Phytologist 139: 571-580.
Staddon PL, Gregersen R, Jakobsen I. 2004a. The response of two Glomus mycorrhizal fungi and a fine endophyte to elevated atmospheric CO2, soil warming and drought. Global Change Biology 10: 1909-1921.
Staddon PL, Jakobsen I, Blum H. 2004b. Nitrogen input mediates the effect of free-air CO2 enrichment on mycorrhizal fungal abundance. Global Change Biology 10: 1678-1688.
References on AM for meta-analysis (Updated 02 January, 2008) Cavagnaro TR, Sokolow SK, Jackson LE. 2007. Mycorrhizal effects on growth and
nutrition of tomato under elevated atmospheric carbon dioxide. Functional Plant Biology 34: 730-736.
Chen X, Tu C, Burton MG, Watson DM, Burkey KO, Hu S. 2007. Plant nitrogen acquisition and interactions under elevated carbon dioxide: impact of endophytes and mycorrhizae. Global Change Biology 13: 1238-1249.
141
References
Dhillion SS, Roy J, Abrams M. 1996. Assessing the impact of elevated CO2 on soil microbial in a Mediterranean model ecosystem. Plant and Soil 187: 159-172.
Kimball BA, Idso SB, Johnson S, Rillig MC. 2007. Seventeen years of carbon dioxide enrichment of sour orange trees: final results. Global Change Biology 13: 2171-2183.
Tang J, Chen J, Chen X. 2006. Response of 12 weedy species to elevated CO2 in low-phosphorus-availability soil. Ecological Research 21: 664-670.
142
List of publications in peer-reviewed journals Alberton O, Kuyper TW, Gorissen A. 2005. Taking mycocentrism seriously: mycorrhizal
fungal and plant responses to elevated CO2. New Phytologist 167: 859-868. Alberton O, Kaschuk G, Hungria, H. 2006. Sampling effects on the assessment of genetic
diversity of rhizobia associated with soybean and common bean. Soil Biology & Biochemistry 38: 1298-1307.
Alberton O, Kuyper TW, Gorissen A. 2007. Competition for nitrogen between Pinus sylvestris and ectomycorrhizal fungi generates potential for negative feedback under elevated CO2. Plant and Soil 296: 159-172.
Cudlin P, Kieliszewska-Rokicka B, Rudawska M, Grebenc T, Alberton O, Lehto T, Bakker MR, Børja I, Konôpka B, Leski T, Kraigher H, Kuyper TW. 2007. Fine roots and ectomycorrhizas as indicators of environmental change. Plant Biosystems 141: 406-425.
Loureiro MDF, Kaschuk G, Alberton O, Hungria M. 2007. Soybean [Glycine max (L.) Merrill] rhizobial diversity in Brazilian oxisols under various soil, cropping, and inoculation managements. Biology and Fertility of Soils 43: 665-674.
Ostonen I, Püttsepp Ü, Biel C, Alberton O, Bakker MR, Lõhmus K, Majdi H, Metcalfe D, Olsthoorn AFM, Pronk A, Vanguelova E, Weih M, Brunner I. 2007. Specific root length as an indicator of environmental change. Plant Biosystems 141:426-442.
Alberton O, Kuyper TW. 2008. Ectomycorrhizal fungi associated with seedlings of Pinus sylvestris respond differently to increased carbon and nitrogen availability – implications for ecosystem responses to global change. Global Change Biology. In preparation.
Alberton O, Kuyper TW. Summerbell RC. 2008. Responses of Scots pine growing in association with dark septate root endophytic fungi under nitrogen limitation and elevated CO2. New Phytologist. In preparation.
Alberton O, Kaschuk G, Klauberg Filho O, Santos JCP. 2008. Ryegrass and tall fescue responses to inoculation of Azospirillum amazonense and arbuscular mycorrhizal Acaulospora scrobiculata in highly buffered acid soil. Pedobiologia. Submitted.

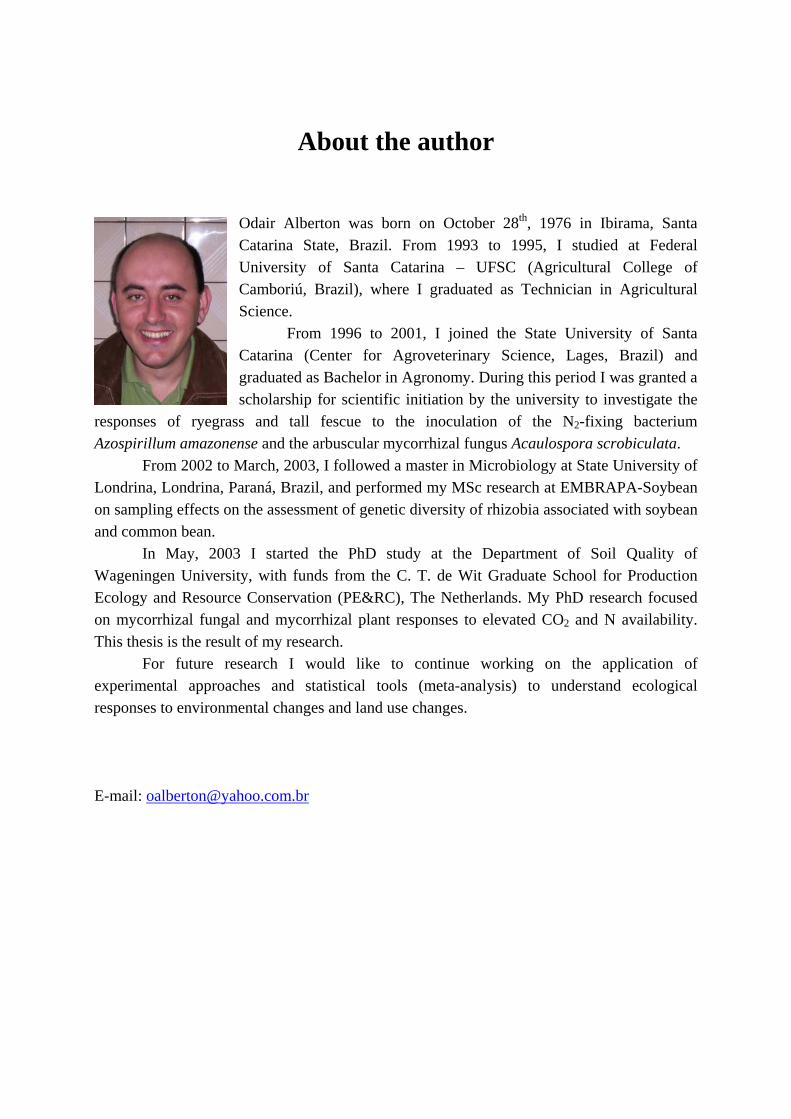
About the author
Odair Alberton was born on October 28th, 1976 in Ibirama, Santa Catarina State, Brazil. From 1993 to 1995, I studied at Federal University of Santa Catarina – UFSC (Agricultural College of Camboriú, Brazil), where I graduated as Technician in Agricultural Science.
From 1996 to 2001, I joined the State University of Santa Catarina (Center for Agroveterinary Science, Lages, Brazil) and graduated as Bachelor in Agronomy. During this period I was granted a scholarship for scientific initiation by the university to investigate the
responses of ryegrass and tall fescue to the inoculation of the N2-fixing bacterium Azospirillum amazonense and the arbuscular mycorrhizal fungus Acaulospora scrobiculata.
From 2002 to March, 2003, I followed a master in Microbiology at State University of Londrina, Londrina, Paraná, Brazil, and performed my MSc research at EMBRAPA-Soybean on sampling effects on the assessment of genetic diversity of rhizobia associated with soybean and common bean.
In May, 2003 I started the PhD study at the Department of Soil Quality of Wageningen University, with funds from the C. T. de Wit Graduate School for Production Ecology and Resource Conservation (PE&RC), The Netherlands. My PhD research focused on mycorrhizal fungal and mycorrhizal plant responses to elevated CO2 and N availability. This thesis is the result of my research.
For future research I would like to continue working on the application of experimental approaches and statistical tools (meta-analysis) to understand ecological responses to environmental changes and land use changes. E-mail: [email protected]


PE&RC PhD Education Certificate With the educational activities listed below the PhD candidate has complied with the educational requirements set by the C.T. de Wit Graduate School for Production Ecology and Resource Conservation (PE&RC) which comprises of a minimum total of 32 ECTS (= 22 weeks of activities). Review of Literature (5.6 ECTS)
- Meta-analysis on mycorrhizal fungal and mycorrhizal plants under elevated CO2 (2003-2007)
Laboratory Training and Working Visits (1.1 ECTS)
- Safe handling with radioactive materials and sources Post-Graduate Courses (2.8 ECTS)
- Advanced statistics; PE&RC (2004) - Soil ecology: crossing the frontier between below-and above ground; PE&RC (2007)
Deficiency, Refresh, Brush-up Courses (7.4 ECTS)
- Basic statistics; PE&RC (2004) - PPS-20306 system analysis, simulation and system management; WUR-PPS (2005)
Competence Strengthening / Skills Courses (3.1 ECTS)
- Written English; WGS (2004) - Scientific writing; WGS (2004)
Discussion Groups / Local Seminars and Other Meetings (6.1 ECTS)
- 8th Belgium-Netherlands mycorrhizal meeting (2003) - Seminar on rice, soil, land and farmer (2003) - Plant-soil relation discussion group (2003-2004) - Symposium on nutrient management in tropical agroecosystem (2004) - Mini-symposium on soil biodiversity and nutrient cycling (2004) - PhD workshop on scientific publishing (2004) - 9th Belgium-Netherlands mycorrhizal meeting (2004) - 10th Belgium-Netherlands mycorrhizal meeting (2004) - 11th Belgium-Netherlands mycorrhizal meeting (2005) - 12th Belgium-Netherlands mycorrhizal meeting (2005) - SENSE summer symposium: Kyoto and Beyond (2005)
PE&RC Annual Meetings, Seminars and the PE&RC Weekend (2.4 ECTS) - PE&RC meeting: 3D interactions in soil-plant systems (2003) - PE&RC day on global climate change & biodiversity (2003) - PE&RC day on biological disasters (2004) - PE&RC introduction weekend (2004) - PE&RC 10 years anniversary (2005) - PE&RC day on who pulls the strings (2006)
International Symposia, Workshops and Conferences (5.6 ECTS)
- Rhizosphere-2004 international congress; Munich (2004) - ICOM5 International conference on mycorrhiza; Granada, poster presentation (2006) - Rhizosphere-2 International conference; Montpellier, poster presentation (2007) - 4th International symposium on dynamics of physiological processes in roots of woody
plants; Bangor, poster presentation (2007)
148


