
NANOTECHNOLOGY-BASED APPROACHES FORREGENERATIVE MEDICINE AND BIOSENSING
BY ANIRUDDH P. SOLANKI
A dissertation submitted to the
Graduate School—New Brunswick
Rutgers, The State University of New Jersey
in partial fulfillment of the requirements
for the degree of
Doctor of Philosophy
Graduate Program in Chemistry and Chemical Biology
Written under the direction of
Professor Ki-Bum Lee
and approved by
New Brunswick, New Jersey
May, 2013
ABSTRACT OF THE DISSERTATION
Nanotechnology-based Approaches for Regenerative
Medicine and Biosensing
by Aniruddh P. Solanki
Dissertation Director: Professor Ki-Bum Lee
The recent emergence of nanotechnology has set high expectations in many fields of
science, especially in biology and medicine. Nanotechnology-based approaches are ex-
pected to solve key questions in the emerging field of regenerative medicine. Regen-
erative medicine essentially deals with regeneration of cells, ultimately leading to the
formation of tissues and organs. For this purpose, stem cells (embryonic stem cells or
adult stem cells) are thought to be ideal resources. However, controlling the differen-
tiation of stem cells into cells of a specific lineage is extremely vital and challenging.
Addressing this challenge, in this work, novel nanotechnology-based approaches for con-
trolling the differentiation of neural stem cells (NSCs) into neurons has been presented.
Regeneration of damaged neurons, due to traumatic injuries or degenerative diseases,
is extremely challenging. For this purpose, NSCs can be used as resources that can
differentiate into neurons, thus having great potential in solving needs of many patients
suffering from such conditions.
The initial part of this work presents the use of nanomaterials for efficiently deliver-
ing soluble cues such as small molecules and small interfering RNA (siRNA) into NSCs
for controlling their differentiation into neurons. However, for regenerative purposes,
it is preferred that least amounts of the delivery vehicle be used. Thus, the following
ii
part of the thesis presents the development and applications of nanotechnology-based
approaches for enhancing the differentiation of NSCs into neurons using insoluble cues.
The cellular microenvironment, consisting for the extracellular matrix (ECM) was mod-
ified by the use of nanostructures, to deliver siRNA into NSCs to enhance neuronal
differentiation. NSC differentiation was also controlled by the use of protein micropat-
terns, wherein the pattern geometry and size defined the fate of the NSCs. Lastly,
graphene, in combination with nanoparticles was used as component of the ECM to
not only enhance the differentiation of NSCs into neurons, but also align the axons
of the differentiated NSCs, having significant implications for its use in regenerating
injured spinal cords.
The final portion of the thesis focusses on developing highly sensitive and selective
biosensors, for detecting biomarkers implicated in various diseases such as cancer and
acute pancreatitis.
iii
Acknowledgements
First and foremost I would like to thank my Guru and spiritual master Guruhari
Hariprasad Swamiji, because of whom I have been able to come to the United States
and finish my graduate studies. There was a time when coming to study in the United
States would have only been left as a dream if it were not for His constant inspiration
to become the best at whatever you do, and the fact that God is taking care of me at
each and every moment, hence whatever happens, happens only for the good. He has
taught me how to use my eyes, ears and mouth correctly and that is something even
my parents did not teach me. He has been with me at each and every step of my adult
life and in fact it was Him who suggested I should move to New Jersey (when I was
in New York) to pursue my graduate studies. His words, such as work while you work,
play while you play; mind your own; man is defined by the company he keeps; you have
no right to judge anybody even for a fraction of a second; genius is ever genius, have
played a big role in shaping my life today. Whatever I have been able to achieve today,
is only because of His blessings.
Next, I would like to thank Prof. KiBum Lee, who has been an exceptional mentor,
guide, advisor and whatever other words there may be. But most importantly he has
been a great friend. Being his first student he will always have a special place in
my heart. I still remember the days when we did not have our own space and were
complaining about dripping water and old buildings. It was at those times that his
inspirational talks really helped me get motivated and focused. He always maintained
that our competition was not within the Rutgers departments but with the top schools
in the world, and that labs in many big schools were worse than ours, but produced
gerat science. So, there was no excuse for mediocre work. He has always shared his
experiences with me, trying to remind me not to make the same mistakes he made. I
believe it takes a lot of humility and courage to be able to share mistakes with your
iv

students and I really appreciate that. Being his student, and his first student, has
prepared me well for a position in academia, and I could not have asked for anything
more. In terms of research, Prof. Lee is the best mentor anyone could ask for. He had
given me full academic freedom to pursue any idea I had, provided it is backed by a
good hypothesis. It is precisely why I have not been bored doing research at all in the
past 5 years. I really thank him from the bottom of my heart and I thank God for
giving me such a brilliant, yet humble, advisor.
I would also like to thank my friends in the KBLee group. It has been a great
pleasure to see the group grow and grow, people come and people go for over 5 years.
I would especially like to thank Prasad and Birju, who were there from the beginning,
for helping me with everything, bearing with my sloppiness, and most importantly,
doing my lab duties for me. I hope we always remain friends and I also apologize for
anything I may have done or said in the time we have been together in the lab. A
special thanks to Shreyas Shah, who has been one of my best friends in lab and outside
and has been with me in the lab from the start, first as an undergrad and then as a
graduate student. His dedication, focus and attention to detail in many ways, has set
a bar in the lab. I believe there is nothing Shrey cannot do, and that is awesome in so
many ways. I would also take this moment to thank Sahishnu Patel, who is not only
my friend in the lab but also my roommate. I would like to thank him for bearing with
my laziness and helping me with whatever it is I need at whatever time. I am truly
fortunate to have his company. Finally I would like to thank Dean (Sy-Tsong) Chueng,
who is the IT person in our lab and a true genius. I would like to thank him for all the
troubleshooting he has done for me and helping me with LaTex in writing this thesis.
Evenings at the gym with him will definitely be one of the memorable moments spent
at Rutgers. I would also like to thank Perry for never saying no for anything I required,
and Raj Kappera for helping with the characterization and synthesis of graphene and
MoS2. I also appreciate the fact that Raj has not given up on our idea of making a
MoS2-based biosensor.
I believe this is a good time to thank Prof. Kathryn Uhrich, who has agreed to be
a part of my thesis committee. It is because of her that I am at Rutgers and I will
v
never forget the help she provided. In addition to being a brilliant scientist, she is an
exceptional teacher, the best I have had so far at Rutgers. I was fortunate to have
taken the polymer class when she taught it. That was the most fun class I have taken.
Her open-mindedness, straight-forwardness and clarity of thought is something I aspire
to achieve some day. I would also like to thank Prof. Eric Garfunkel and Prof. Manish
Chhowalla for being a part of my thesis committee and providing valuable guidance
throughout the years.
I would also like to thank Kishanji, the youth leader at my temple, who has been
an exceptional friend and someone I look up to. He has always been there for all the
problems I have had in my life, personal and professional. His presence and words have
helped me get back on track without wasting my time. I would also take this moment
to thank all my brothers in Sarvam and Shabri. I am not sure what I would without
their help.
Finally, I come to family and I have two families to thank. I lived with one during
my studies at Rutgers and I grew up with the other (in Bombay) before I came to the
United States. First, I would like to thank the one I stayed with in the United States.
Dinesh Uncle, Hina Aunty, Prerakbhai and Bhaktiben. I would not have been able to
finish my studies in time if it were not for them. They have not given me a chance to
wash dishes, do laundry, or even make my bed. Their sole purpose had been to take
care of me so I could study. I have no words to describe what they have done for me
and how fortunate I am. Next, my parents back in India, who have always asked me
to study hard and that if I do not study right now I would regret it later in life. They
have always made sure that my brother and I get everything we need so we can have
the best education. Despite all the trying times we have had, they have not given me a
chance to complain. I thank them for their blessings, love and care for all these years.
Finally, I would like to thank my younger brother Mihir, who has always believed in
me and asked me to stay away from jobs in industry as he believes academia offers the
most creative freedom. I thank him for his advice and all the help he has given me
whenever I have asked for it. He has always had my back.
vi

Dedication
I would like to dedicate this work to Lord Swaminarayan and my spiritual master
Guruhari Hairprasad Swamiji. I would also like to dedicate this work to Pujya Prabodh
Swamiji, Ashok Uncle, Kishanji and to my friends who were highly qualified individuals
in the United States, but left all their aspirations behind to become teachers at Atmiya
Vidya Mandir in India. Finally, this work is also dedicated to my parents Prakash
Solanki and Sheela Solanki who have worked all their life for making sure I can achieve
all my dreams.
vii
Table of Contents
Abstract . . . . . . . . . . . . . . . . . . . . . . . . . . . . . . . . . . . . . . . . ii
Acknowledgements . . . . . . . . . . . . . . . . . . . . . . . . . . . . . . . . . iv
Dedication . . . . . . . . . . . . . . . . . . . . . . . . . . . . . . . . . . . . . . . vii
List of Tables . . . . . . . . . . . . . . . . . . . . . . . . . . . . . . . . . . . . . xiv
List of Figures . . . . . . . . . . . . . . . . . . . . . . . . . . . . . . . . . . . . xv
1. Introduction . . . . . . . . . . . . . . . . . . . . . . . . . . . . . . . . . . . 1
1.1. Nanoparticles for Drug Delivery and Molecular Imaging in Stem Cells . 4
1.1.1. Magnetic Nanoparticles . . . . . . . . . . . . . . . . . . . . . . . 5
1.1.2. Quantum Dots . . . . . . . . . . . . . . . . . . . . . . . . . . . . 11
1.1.3. Gold Nanoparticles . . . . . . . . . . . . . . . . . . . . . . . . . . 18
1.1.4. Dendrimers . . . . . . . . . . . . . . . . . . . . . . . . . . . . . . 19
1.2. Nanotopography for Controlling Stem Cell Behaviors . . . . . . . . . . . 23
1.2.1. Patterning of Topographical Cues . . . . . . . . . . . . . . . . . 24
1.2.2. Nanomaterials for Generating Topographical Cues . . . . . . . . 27
1.3. Nanomaterials for Developing Biosensors . . . . . . . . . . . . . . . . . . 32
1.3.1. Carbon Nanotubes . . . . . . . . . . . . . . . . . . . . . . . . . . 32
1.3.2. Graphene . . . . . . . . . . . . . . . . . . . . . . . . . . . . . . . 34
1.3.3. Silicon Nanowires . . . . . . . . . . . . . . . . . . . . . . . . . . . 35
1.4. Conclusion . . . . . . . . . . . . . . . . . . . . . . . . . . . . . . . . . . 37
1.5. Overview of Dissertation . . . . . . . . . . . . . . . . . . . . . . . . . . . 38
2. Nanomaterials for siRNA Delivery into Neural Stem Cells . . . . . . 41
viii

2.1. Selective Inhibition of Human Brain Tumor Cells through Multifunc-
tional Quantum-Dot-Based siRNA Delivery . . . . . . . . . . . . . . . . 42
2.1.1. Introduction . . . . . . . . . . . . . . . . . . . . . . . . . . . . . 42
2.1.2. Results and Discussion . . . . . . . . . . . . . . . . . . . . . . . . 43
Multifunctional quantum-dots for delivery and tracking of siRNA 44
EGFP knockdown and target-specific intracellular delivery of siRNA-
QDs . . . . . . . . . . . . . . . . . . . . . . . . . . . . . 45
Knockdown of EGFRvIII as a chemotherapeutic target by siRNA-
QDs . . . . . . . . . . . . . . . . . . . . . . . . . . . . . 51
2.1.3. Conclusions . . . . . . . . . . . . . . . . . . . . . . . . . . . . . . 54
2.1.4. Materials and Methods . . . . . . . . . . . . . . . . . . . . . . . 54
Synthesis of the Core-Shell QDs . . . . . . . . . . . . . . . . . . 55
Synthesis of QD conjugates with siRNA . . . . . . . . . . . . . . 55
Cell Culture of U87-EGFP and U87-EGFRVIII . . . . . . . . . . 56
Targeted delivery of siRNA-QDs . . . . . . . . . . . . . . . . . . 56
Transmission electron microscopy and fluorescence microscopy . 57
Cell viability assay . . . . . . . . . . . . . . . . . . . . . . . . . . 57
Western blot analysis . . . . . . . . . . . . . . . . . . . . . . . . 57
2.2. Simultaneous Delivery of siRNA and Small Molecule Using Polyamine-
Cyclodextrins to Enhance Neuronal Differentiation of Neural Stem Cells 58
2.2.1. Introduction . . . . . . . . . . . . . . . . . . . . . . . . . . . . . 58
2.2.2. Results and Discussion . . . . . . . . . . . . . . . . . . . . . . . . 60
DexAM: Structure and Synthesis . . . . . . . . . . . . . . . . . . 61
GFP knockdown efficiency of DexAM . . . . . . . . . . . . . . . 63
DexAM is non-cytotoxic and biocompatible . . . . . . . . . . . . 65
Enhanced neuronal differentiation of NSCs using DexAM . . . . 66
2.2.3. Conclusions . . . . . . . . . . . . . . . . . . . . . . . . . . . . . . 69
2.2.4. Materials and Methods . . . . . . . . . . . . . . . . . . . . . . . 69
Detailed synthesis of DexAM . . . . . . . . . . . . . . . . . . . . 70
ix

Inclusion of retinoic acid (RA) into DexAM . . . . . . . . . . . . 75
Formation of polyplexes between siRNA and DexAM . . . . . . . 76
Neural stem cell culture and differentiation . . . . . . . . . . . . 77
Cell viability assay . . . . . . . . . . . . . . . . . . . . . . . . . . 77
Immunocytochemistry . . . . . . . . . . . . . . . . . . . . . . . . 77
3. Manipulating Surface Chemistry to Enhance Neuronal Differentiation
of Neural Stem Cells . . . . . . . . . . . . . . . . . . . . . . . . . . . . . . . . 79
3.1. Nanotopography-mediated Reverse Uptake of siRNA for Enhancing Neu-
ronal Differentiation of Neural Stem Cells . . . . . . . . . . . . . . . . . 80
3.1.1. Introduction . . . . . . . . . . . . . . . . . . . . . . . . . . . . . 80
3.1.2. Results and Discussion . . . . . . . . . . . . . . . . . . . . . . . . 84
Nanotopographical features determine siRNA-based gene knock-
down in NSCs . . . . . . . . . . . . . . . . . . . . . . . 84
NanoRU delivers only siRNA into NSCs and not SiNPs . . . . . 86
Controlling neuronal differentiation of NSCs using NanoRU . . . 88
NanoRU for delivering siRNA into other mammalian cells and
miRNA into NSCs . . . . . . . . . . . . . . . . . . . . . 90
NanoRU does not damage cell membranes and is non-toxic . . . 92
3.1.3. Conclusions . . . . . . . . . . . . . . . . . . . . . . . . . . . . . . 93
3.1.4. Materials and Methods . . . . . . . . . . . . . . . . . . . . . . . 94
NanoRU preparation . . . . . . . . . . . . . . . . . . . . . . . . . 94
Coating NanoRU with laminin and siRNA . . . . . . . . . . . . . 95
Rat neural stem cell (NSC) culture and differentiation . . . . . . 95
Culturing U87-EGFRvIII, SUM159, and Astrocytes . . . . . . . 96
Cell viability assays . . . . . . . . . . . . . . . . . . . . . . . . . 96
Immunocytochemistry . . . . . . . . . . . . . . . . . . . . . . . . 97
PCR analysis . . . . . . . . . . . . . . . . . . . . . . . . . . . . . 97
x
3.2. Controlling Differentiation of Neural Stem Cells Using Extracellular Ma-
trix Protein Patterns . . . . . . . . . . . . . . . . . . . . . . . . . . . . . 99
3.2.1. Introduction . . . . . . . . . . . . . . . . . . . . . . . . . . . . . 99
3.2.2. Results and Discussion . . . . . . . . . . . . . . . . . . . . . . . . 101
Differentiating neural stem cells on ECM protein patterns . . . . 102
Neuronal differentiation is dependent on the geometry of ECM
micropatterns . . . . . . . . . . . . . . . . . . . . . . . 103
Neuronal differentiation is influenced by the size of ECM mi-
cropatterns . . . . . . . . . . . . . . . . . . . . . . . . . 107
3.2.3. Conclusions . . . . . . . . . . . . . . . . . . . . . . . . . . . . . . 110
3.2.4. Materials and Methods . . . . . . . . . . . . . . . . . . . . . . . 111
Synthesis and Characterization of EG4-(CH2)11-SH . . . . . . . . 111
Generating ECM protein patterns . . . . . . . . . . . . . . . . . 112
Rat neural stem cell (NSC) culture and differentiation . . . . . . 113
Immunocytochemistry . . . . . . . . . . . . . . . . . . . . . . . . 113
3.3. Nanoparticle Arrays Decorated with Graphene Align Axons and Enhance
Neuronal Differentiation of Human Neural Stem Cells . . . . . . . . . . 115
3.3.1. Introduction . . . . . . . . . . . . . . . . . . . . . . . . . . . . . 115
3.3.2. Results and Discussion . . . . . . . . . . . . . . . . . . . . . . . . 117
Human NSCs align on GO and SiNP-GO substrates . . . . . . . 117
GO and SiNP-GO substrates enhance cell survival . . . . . . . . 121
Neuronal differentiation of hNSCs . . . . . . . . . . . . . . . . . 122
Axonal alignment on pristine graphene . . . . . . . . . . . . . . . 123
Human NSC alignment on flexible polymeric substrates . . . . . 125
3.3.3. Conclusions . . . . . . . . . . . . . . . . . . . . . . . . . . . . . . 127
3.3.4. Materials and Methods . . . . . . . . . . . . . . . . . . . . . . . 127
Synthesis of chemically derived graphene, pristine graphene and
MoS2 nanoflakes . . . . . . . . . . . . . . . . . . . . . . 127
Preparation of different substrates . . . . . . . . . . . . . . . . . 128
xi
Human neural stem cell (hNSC) culture and differentiation . . . 130
Image analysis . . . . . . . . . . . . . . . . . . . . . . . . . . . . 131
Cell viability assay . . . . . . . . . . . . . . . . . . . . . . . . . . 131
Immunocytochemistry . . . . . . . . . . . . . . . . . . . . . . . . 132
PCR analysis . . . . . . . . . . . . . . . . . . . . . . . . . . . . . 132
4. Developing Biosensors for Highly Sensitive and Selective Detection of
Biomarkers . . . . . . . . . . . . . . . . . . . . . . . . . . . . . . . . . . . . . . 134
4.1. Graphene-Encapsulated Nanoparticle-based Biosensor for the Selective
Detection of Cancer Biomarkers . . . . . . . . . . . . . . . . . . . . . . . 135
4.1.1. Introduction . . . . . . . . . . . . . . . . . . . . . . . . . . . . . 135
4.1.2. Results and Discussion . . . . . . . . . . . . . . . . . . . . . . . . 136
Fabrication of arrays of graphene-encapsulated nanoparticles . . 136
Gating effect of rGO-NP device . . . . . . . . . . . . . . . . . . . 139
Sensitivity and selectivity of rGO-NP biosensor for detecting HER2140
Sensitivity and selectivity of rGO-NP biosensor for detecting EGFR142
4.1.3. Conclusions . . . . . . . . . . . . . . . . . . . . . . . . . . . . . . 143
4.1.4. Materials and Methods . . . . . . . . . . . . . . . . . . . . . . . 144
Preparation of reduced graphene oxide and SiO2 NPs . . . . . . 144
Synthesis of 4-(pyren-1-yl)butanal . . . . . . . . . . . . . . . . . 144
Surface molecular patterning . . . . . . . . . . . . . . . . . . . . 144
Metal deposition and measurement of graphene devices . . . . . 145
Functionalization the rGO-NPs with monoclonal antibodies . . . 145
4.2. Label-free Polypeptide-based Enzyme Detection Using a Graphene-nanoparticle
Hybrid Sensor . . . . . . . . . . . . . . . . . . . . . . . . . . . . . . . . . 146
4.2.1. Introduction . . . . . . . . . . . . . . . . . . . . . . . . . . . . . 146
4.2.2. Results and Discussion . . . . . . . . . . . . . . . . . . . . . . . . 148
4.2.3. Conclusions . . . . . . . . . . . . . . . . . . . . . . . . . . . . . . 158
4.2.4. Materials and Methods . . . . . . . . . . . . . . . . . . . . . . . 159
xii

Metal deposition and measurement of graphene devices . . . . . 159
Synthesis of 1-butyl-3-methylimidazolium hexafluorophosphate (BMIM-
PF6) . . . . . . . . . . . . . . . . . . . . . . . . . . . . 159
Synthesis of 4-(pyren-1-yl)butanal . . . . . . . . . . . . . . . . . 160
Synthesis of the amino acid N-carboxy anhydrides (2, NCAs) . . 160
Deposition and Patterning of Graphene . . . . . . . . . . . . . . 160
Synthesis of 3-armed polypeptides (5) . . . . . . . . . . . . . . . 161
4.3. Zinc Oxide Thin Film Transistor Immunosensor with High Sensitivity
and Selectivity . . . . . . . . . . . . . . . . . . . . . . . . . . . . . . . . 163
4.3.1. Introduction . . . . . . . . . . . . . . . . . . . . . . . . . . . . . 163
4.3.2. Results and Discussion . . . . . . . . . . . . . . . . . . . . . . . . 164
Sensitivity of the ZnO-bioTFT immunosensor . . . . . . . . . . . 165
Selectivity of the ZnO-bioTFT immunosensor . . . . . . . . . . . 165
4.3.3. Conclusions . . . . . . . . . . . . . . . . . . . . . . . . . . . . . . 167
4.3.4. Materials and Methods . . . . . . . . . . . . . . . . . . . . . . . 168
Device fabrication . . . . . . . . . . . . . . . . . . . . . . . . . . 168
Bio-functionalization of device with antibodies . . . . . . . . . . 171
5. Conclusions and Perspectives . . . . . . . . . . . . . . . . . . . . . . . . . 172
References . . . . . . . . . . . . . . . . . . . . . . . . . . . . . . . . . . . . . . . 176
xiii

List of Tables
3.1. Primers for PCR analysis . . . . . . . . . . . . . . . . . . . . . . . . . . 98
3.2. Primers for PCR analysis . . . . . . . . . . . . . . . . . . . . . . . . . . 133
xiv

List of Figures
1.1. Range of scale of biomolecular interactions. . . . . . . . . . . . . . . . . 2
1.2. Nanotechnology-based approaches for regulating stem cell fate [1]. . . . 3
1.3. Neural stem cells labeled with magnetic nanoparticles . . . . . . . . . . 6
1.4. Magnetic resonance images of SPION-labeled stem cells . . . . . . . . . 9
1.5. Transplanted oligodendrocyte precursor cells (OPCs) into organotypic
slice cultures . . . . . . . . . . . . . . . . . . . . . . . . . . . . . . . . . 11
1.6. Excitation and emission spectra of quantum dots . . . . . . . . . . . . . 12
1.7. Emission properties of ZAIS quantum dots . . . . . . . . . . . . . . . . 14
1.8. Mesenchymal stem cells labeled with quantum dots . . . . . . . . . . . . 15
1.9. Multiplex imaging of embryonic stem cells labeled with quantum dots . 16
1.10. In utero electroporation for labelling neural stem and progenitor cells . . 17
1.11. Dendrimer-based gene delivery into mesenchymal stem cells . . . . . . . 21
1.12. Tracking neural stem cells labeled with magnetodendrimers . . . . . . . 22
1.13. Nanoscale features for controlling stem cell behaviors . . . . . . . . . . . 23
1.14. Cells cultured on different patterned features . . . . . . . . . . . . . . . 24
1.15. Mesenchymal stem cells differentiated on ECM protein patterns . . . . . 26
1.16. Human neural stem cell growth and polarization on CNT patterns coated
with laminin . . . . . . . . . . . . . . . . . . . . . . . . . . . . . . . . . 27
1.17. Polarization-controlled neuronal differentiation of individual hNSCs us-
ing CNT patterns . . . . . . . . . . . . . . . . . . . . . . . . . . . . . . . 28
1.18. Human neural stem cells cultured on graphene . . . . . . . . . . . . . . 30
1.19. Nanofibers for differentiation of rat neural stem cells . . . . . . . . . . . 31
1.20. Schematic diagran for functionalization of carbon nanotubes . . . . . . . 33
1.21. Detection of biomolecules using silicon nanowire biosensor . . . . . . . . 35
xv
2.1. siRNA-QDs for delivery and tracking . . . . . . . . . . . . . . . . . . . . 44
2.2. Toxicity of QDs using MTS assay . . . . . . . . . . . . . . . . . . . . . . 46
2.4. Targeted delivery of multifunctional siRNA-QDs . . . . . . . . . . . . . 47
2.3. Knockdown of EGFP in U87 cells using siRNA-QD . . . . . . . . . . . . 48
2.5. Knockdown efficiency of EGFP using multifunctional siRNA-QDs . . . . 50
2.6. EGFP knockdown using siRNA (without QDs) and siRNA-QDs . . . . . 51
2.7. Knockdown of EGFRvIII in U87 EGFRvIII using multifunctional siRNA-
QDs . . . . . . . . . . . . . . . . . . . . . . . . . . . . . . . . . . . . . . 53
2.8. Schematic diagram showing the application of DexAM for stem cells . . 60
2.9. General Scheme for the Synthesis of DexAM . . . . . . . . . . . . . . . . 62
2.10. siRNA complexation efficiency of DexAM . . . . . . . . . . . . . . . . . 63
2.11. Delivery of DexAM-siRNA for GFP Knockdown in neural stem cells . . 64
2.12. DexAM cytotoxicity in neural stem cells . . . . . . . . . . . . . . . . . . 65
2.13. Neural stem cell differentiation using DexAM . . . . . . . . . . . . . . . 68
2.14. First Round of Michael Addition and Amidation for synthesizing DexAM 70
2.15. Second Round of Micheal Addition and Amidation for synthesizing DexAM 72
2.16. Synthesis of mono-tosylated cyclodextrin . . . . . . . . . . . . . . . . . . 73
2.17. Conjugation of β-CD to the Polyamine Backbone . . . . . . . . . . . . . 74
2.18. Inclusion of RA into DexAM . . . . . . . . . . . . . . . . . . . . . . . . 76
2.19. Polyplex formation of DexAM and siRNA . . . . . . . . . . . . . . . . . 76
3.1. Schematic diagram depicting the application of NanoRUs . . . . . . . . 82
3.2. Characterizing cellular uptake of siRNA from NanoRU . . . . . . . . . . 85
3.3. TEM images to confirm uptake of SiNPs . . . . . . . . . . . . . . . . . . 87
3.4. Effect of endocytosis inhibitors on GFP knockdown . . . . . . . . . . . . 88
3.5. NSC differentiation on NanoRU coated with SOX9 siRNA (siSOX9) . . 89
3.6. Colocalization of neuronal markers . . . . . . . . . . . . . . . . . . . . . 90
3.7. Cellular uptake of siRNA and cellular viability in different cell types . . 91
3.8. siRNA uptake within Astrocytes . . . . . . . . . . . . . . . . . . . . . . 91
3.9. NanoRU for miRNA uptake . . . . . . . . . . . . . . . . . . . . . . . . . 92
xvi

3.10. Time-dependent siRNA Uptake . . . . . . . . . . . . . . . . . . . . . . . 93
3.11. A schematic diagram of ECM protein patterns for NSC differentiation . 101
3.12. Immunostaining with anti-laminin IgG . . . . . . . . . . . . . . . . . . . 102
3.13. Growth and differentiation of NSCs on the laminin patterns . . . . . . . 105
3.14. Quantitative analysis of NSC differentiation . . . . . . . . . . . . . . . . 107
3.15. NSC alignment and differentiation on combinatorial ECM patterns . . . 108
3.16. Actin and nestin staining for NSCs on squares and stripes of laminin . . 109
3.17. Colocalization of TuJ1 and synapsin within cells on grid patterns . . . . 110
3.18. Schematic diagram depicting the influence of nanoparticle monolayers
coated graphene oxide . . . . . . . . . . . . . . . . . . . . . . . . . . . . 117
3.19. Aligned growth and extension of axons . . . . . . . . . . . . . . . . . . . 118
3.20. Scanning electron microscopy and MTS assay of hNSCs . . . . . . . . . 120
3.21. Axonal alignment and cell density . . . . . . . . . . . . . . . . . . . . . 121
3.22. Enhanced neuronal differentiation of hNSCs on SiNP-GO . . . . . . . . 123
3.23. Axonal alignment on pristine graphene . . . . . . . . . . . . . . . . . . . 124
3.24. Axonal alignment on pristine graphene . . . . . . . . . . . . . . . . . . . 125
3.25. Axonal Alignment on flexible polymeric substrates . . . . . . . . . . . . 126
3.26. Raman Spectroscopy and SEM imaging . . . . . . . . . . . . . . . . . . 130
4.1. Fabrication process of biomolecular sensor based on graphene-coated NPs 136
4.2. AFM analysis of graphene oxide . . . . . . . . . . . . . . . . . . . . . . 137
4.3. Reduced GO-NP patterns and the electrical property of the rGO-NP device139
4.4. Real-time detection of cancer marker, HER2 . . . . . . . . . . . . . . . . 141
4.5. Real-time detection of cancer marker, EGFR . . . . . . . . . . . . . . . 143
4.6. Schematic of the enzyme biosensor . . . . . . . . . . . . . . . . . . . . . 149
4.7. Characterization data of the biosensor using AFM and SEM . . . . . . . 152
4.8. Measurement of the hysteresis change due to enzyme exposure . . . . . 155
4.9. Enzyme detection using the graphene-nanoparticle hybrid sensor . . . . 157
4.10. Synthetic scheme of polypeptide linkers . . . . . . . . . . . . . . . . . . 162
4.11. Sensitivity of the ZnO-bioTFT immunosensor . . . . . . . . . . . . . . . 165
xvii

4.12. Selectivity of the ZnO-bioTFT immunosensor . . . . . . . . . . . . . . . 167
4.13. Transconductance curve of the ZnO-bioTFT and characteristic curves . 169
4.14. Schematic diagram of ZnO-bioTFT immunosensor . . . . . . . . . . . . 170
xviii

1
Chapter 1
Introduction
It was in 1959, that the Nobel Prize winner Richard Feymann put forth the ground
breaking idea of developing molecular machines. Ever since, the scientific community
has dug deeper and deeper into the role that - what we call today as nanotechnology
- has played in the various facets of society. The underlying principle of any approach
or methodology based on nanotechnology is the ability to control the properties of ma-
terials by assembling them at the nanoscale. We have witnessed tremendous progress
of nanotechnology over the past few decades. The recent emergence of nanotechnology,
however, has set very high expectations in biological and medical sciences. This is not
surprising at all, given that the sizes of functional elements in biology such as proteins
and polynucleic acids are in the nanometer scale range [2]. In addition, nanomateri-
als have novel electronic, optical, magnetic, and structural properties that cannot be
obtained from either individual molecules or bulk materials. These unique features
can be precisely tuned to explore biological phenomena through numerous innovative
techniques. In fact, we believe the current nanotechnology-based approaches can re-
solve key questions concerning biological systems by giving us the ability to investigate,
probe and manipulate these systems at the nanoscale. However, in order to apply
nanotechnology to investigating and solving the key questions in biology and medicine,
several conditions must be considered: i) the nanomaterials used must be designed to
interact with proteins and cells without interfering with their biological activities, ii)
nanomaterials must maintain their physical properties after surface modification, and
iii) nanomaterials must be non-toxic.
One of the important technological aspects of nanotechnology-based applications
lies in the ability to tune materials in a way that their spatial and temporal scales
2
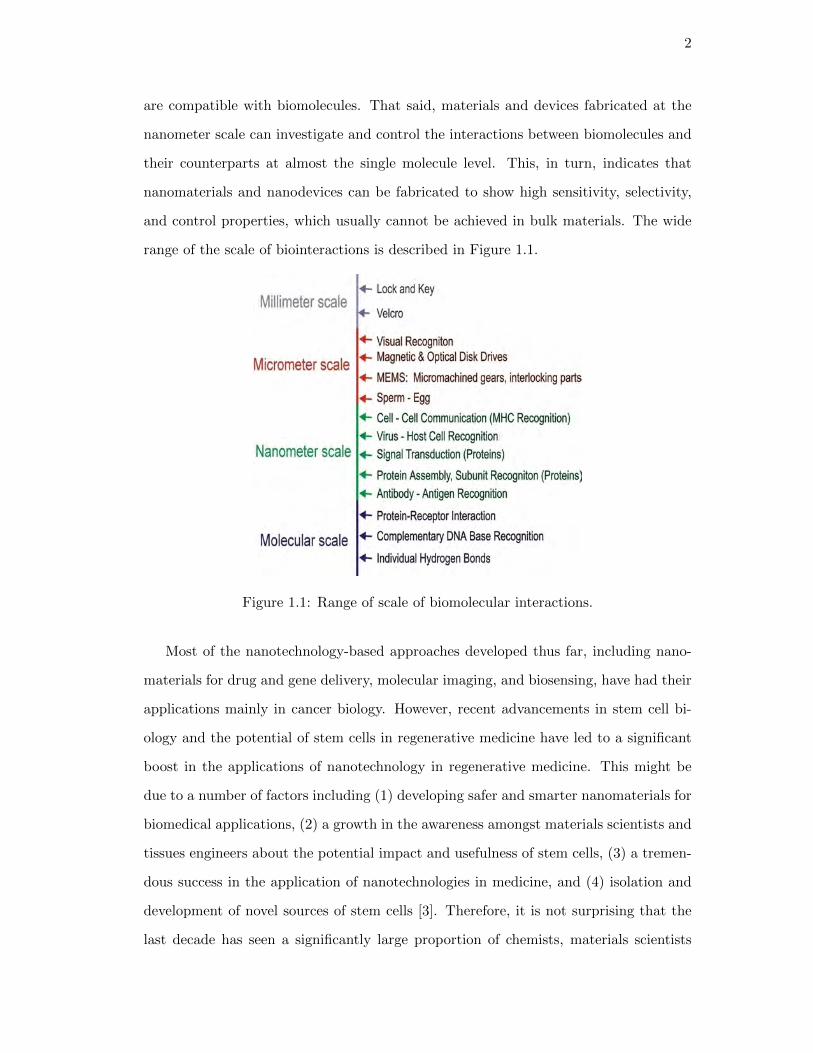
are compatible with biomolecules. That said, materials and devices fabricated at the
nanometer scale can investigate and control the interactions between biomolecules and
their counterparts at almost the single molecule level. This, in turn, indicates that
nanomaterials and nanodevices can be fabricated to show high sensitivity, selectivity,
and control properties, which usually cannot be achieved in bulk materials. The wide
range of the scale of biointeractions is described in Figure 1.1.
Figure 1.1: Range of scale of biomolecular interactions.
Most of the nanotechnology-based approaches developed thus far, including nano-
materials for drug and gene delivery, molecular imaging, and biosensing, have had their
applications mainly in cancer biology. However, recent advancements in stem cell bi-
ology and the potential of stem cells in regenerative medicine have led to a significant
boost in the applications of nanotechnology in regenerative medicine. This might be
due to a number of factors including (1) developing safer and smarter nanomaterials for
biomedical applications, (2) a growth in the awareness amongst materials scientists and
tissues engineers about the potential impact and usefulness of stem cells, (3) a tremen-
dous success in the application of nanotechnologies in medicine, and (4) isolation and
development of novel sources of stem cells [3]. Therefore, it is not surprising that the
last decade has seen a significantly large proportion of chemists, materials scientists

3
and biomedical engineers working hand-in-hand with medical experts to develop novel
approaches for using stem cells to address the current limitations in medical science.
Figure 1.2 [1] summarizes some of the important nanotechnology-based approaches for
stem cell research. This chapter will broadly cover the applications of nanotechnology
in regenerative medicine with a focus on (i) nanostructures for drug delivery and molec-
ular imaging in stem cells (ii) nanotopography for controlling stem cell behaviors (iii)
nanomaterials for developing biodetection.
Figure 1.2: Nanotechnology-based approaches for regulating stem cell fate [1].

4
1.1 Nanoparticles for Drug Delivery and Molecular Imaging in Stem
Cells
Nanoparticles (NPs) are attractive due to several unique properties owing to their size,
which is between that of bulk materials and individual atoms or small molecules. Due
to their small size, they exhibit unique pharmacokinetics, requiring minimal renal fil-
tration. Nanoparticles also have enormous surface-to-volume ratios which afford mod-
ification with various ligands and functional groups that can help target, internalize or
stabilize the NPs. They can be synthesized or generated from a wide variety of mate-
rials, thus exhibiting unique optical, magnetic and electrical properties. While many
of such properties may be described as intermediate between bulk materials and small
molecules, other properties such as superparamagnetism and quantum confinement are
unique to the nanoscale.
Nanoparticles have a number of properties which are quite useful for investigating
and controlling stem cell behaviors. These NPs are typically inorganic, dendritic or
polymeric and their small size allows them to be easily taken up by the cell. Further-
more, the particles can interact with individual biomolecules at the molecular level. Size
is known have a profound effect on the properties of nanoparticles and by controlling
the conditions of nanoparticle synthesis, the size and shape can be controlled within a
very tight distribution [1]. By making use of inorganic, organic, and surface chemistry,
biomolecules such as antibodies [4] or peptides [5] can be added to nanoparticles to
include functionality (for targeting) or to improve cellular uptake. Nanoparticles are
used for delivery of the desired cargo into stem cells and also for tracking the stem
cells once they are transplanted in vivo. Important types of NPs used for probing stem
cell behaviors, with an overall goal of bringing significant improvements to regenerative
medicine, will be discussed.

5
1.1.1 Magnetic Nanoparticles
Transplanting various stem cells for tissue regeneration is an extremely promising ther-
apeutic strategy. One of the key factors in this approach is the availability of tech-
niques which would allow for long term, non-invasive detection of transplanted stem
cells and at the same time allow for monitoring their differentiation, survival and pro-
liferation within the desired organs. Several techniques such as magnetic resonance
imaging (MRI), bioluminescence, positron emission tomography, and multiple photon
microscopy are now available for in vivo cellular imaging. Of these, MRI offers sev-
eral advantages such as high resolution, speed, easy accessibility and three dimensional
capabilities [6, 7]. In addition to providing information about the transplanted stem
cells, a significant advantage of MRI is that it provides information about the sur-
rounding tissues (e.g. edema, lesion, or inflammation), which may have an effect on the
fate of grafted stem cells or may hinder the recovery of damaged tissues [8]. Magnetic
nanoparticles (MNPs), whose sizes can be precisely tuned, offer great potential for MRI
applications. The magnetic nanocrystals tend to behave as a single magnetic domain
in which all nuclear spins couple to create a single large magnetic domain. At certain
temperatures and crystal sizes, these moments wander randomly (superparamagnetic),
or become locked in one direction, making the material ferromagnetic [9]. Magnetic
nanocrystals of differing compositions and sizes can be synthesized to generate ultra-
sensitive molecular images as shown in Figure 1.3 [10].

6
Figure 1.3: Neural stem cells labeled with magnetic nanoparticles. (A) Photomicrogr-pah showing iron oxide nanoparticles (blue) in neural stem cells stained with Prussianblue and counterstanined with neutral red.(B) Transmission electron photomicrographof neural stem cells showing iron oxide nanoparticles in the nuclear and cell mem-branes [10].
Magnetic nanoparticles can either bind to the external cell membrane or be internal-
ized into the cytoplasm. Particles that are bound externally do not affect cell viability
and can be used for remotely actuating the MNPs which causes the activation of sig-
naling pathways within the cells or causes the release of drugs from the MNPs [11].
However, the externally bound MNPs may interfere with cell-surface interactions or
simply detach from the cell membrane [12]. On the other hand, the surfaces of MNPs
can be modified to ensure that they are internalized within cells in a highly efficient
manner, with minimum deleterious effects on the cells [13]. For example, dextran or
other similar polymers have been used to coat the surfaces of superparamagnetic iron
oxide nanoparticles (SPIONs) to enhance the stability and solubility of SPIONs [14] and
also prevents aggregation [15]. The coated SPIONs are useful for tracking and studying
stem cells with magnetic resonance imaging (MRI). In this regard, magnetic iron ox-
ide nanoparticles and their composites are emerging as novel contrast agents for MRI
and are much more sensitive than conventional gadolinium-based contrast agents [7].
The use of SPIONs as in vivo cellular imaging agents is rapidly increasing. Since their
unique properties allow precise control of size and composition, MNPs offer great po-
tential for highly specific MRI to track stem cells. The major transfer mechanism of
nanoparticles through the cell membrane, in order to label stem cells, is endocytosis or
more specifically pinocytosis [16–18].
7
Dextran coated SPIONs are commonly used to label stem cells. However, they may
be unfavorable to endocytosis, thus reducing their labeling efficiency. Therefore, higher
concentrations of nanoparticles and additional transfection agents would be required to
label stem cells. Furthermore, several studies have found that iron oxide nanoparticles,
which tend to dissolve within the cells, may increase the formation of free hydroxyl
radicals and reactive oxygen species. These may have toxic effects, such as an increase in
the rate of apoptosis or cell death and alterations in cellular metabolism [19], potentially
due to the dissolved Fe2+ ions from the dissolved iron oxide nanoparticles. This is highly
undesirable for labeling stem cells as they need to survive for longer periods. In order
to protect stem cells from the toxic effects of SPIONs and to successfully track the
behavior of stem cells in vivo, a very attractive alternative is to coat the SPIONs with
gold. A gold coating provides an inert shell around the nanoparticles and protects
them from rapid dissolution within the cytoplasmic endosomes [20]. In addition, the
gold coated shell significantly enhances MRI contrast. More importantly, gold has
very well defined surface chemistry with thiol (-SH) or amine (-NH2) moieties. This
offers an attractive and convenient route for further functionalization of the SPIONs
with biomolecules via thiol or amine coupling chemistry [21]. For instance, magnetic
iron oxide nanoparticles (MIONs) were coated with gold to form a typical core-shell
structure [20]. These Au-MIONs, of 20 nm hydrodynamic size, were used to label NSCs
obtained from the rat spinal cord. When the labeled NSCs were transplanted within
the spinal cord, the Au-MION system offered a strong and durable signal such that,
as little as 20 cells could be detected with relative ease under optimal conditions using
MRI. In addition, the Au-MION labeling helped distinguish the labeled NSCs from
the haemoglobin breakdown products in vivo. False positives obtained due to Prussian
Blue staining of haemoglobin products in histology could be avoided by using a selective
stain for gold. In another study, Zhu and coworkers [10] labeled human neural stem cells
with SPIONs using a non-liposomal lipid-based transfecting agent. The labeled cells
were then implanted in the region of brain damage in a patient suffering from brain
trauma. The migration of neural stem cells from the site of injection to the border
of the injured tissue of the brain was successfully detected (Figure 1.3) [10]. One of

8
the challenges of using SPIONs is the potential transfer of the contrast agent from the
labeled stem cells to other cell types such as macrophages, which metabolize iron after
engulfing the stem cells. However, through detailed studies and experimentation, Zhu
and coworkers excluded the possibility that magnetic signals could have been generated
by macrophages engulfing the neural stem cells, and thus concluded that the signals
were indeed generated by the migrating stem cells and not by the engulfed stem cells.
Stem cells can be labeled with SPIONs by modifying their surfaces with internalizing
ligands such as the HIV-Tat peptide, dendrimers, and polycationic (PC) transfection
agents. In addition to internalizing ligands, the SPIONs can be multifunctionalized
using fluorescent and isotope labels. These multifunctional nanoparticles can be used
to combine methods such as optical and nuclear imaging with MRI in order to validate
the cellular behavior in vivo. This was aptly demonstrated by Lewin et al [5]. The
magnetic nanoparticles used by the group consisted of small (5 nm) monocrystalline
superparamagnetic iron oxide cores which were stabilized by coating with crosslinked
(CL) aminated dextran. The overall size of the nanoparticles further increased to 45
nm. In order to modify the nanoparticles with a fluorescent label, the internalizing lig-
ands, FITC-derivatized HIV-TAT peptides, were attached to the coat of the aminated
dextran. In addition, the SPIONs were further modified for concomitant nuclear imag-
ing by reacting the dextran coating with a chelator, diethylenetriamine pentaacetic acid
(DTAP), so as to label the nanoparticles (NPs) with 111In isotope. The modified SPI-
ONs, with a triple label (magnetic, fluorescent, and isotope), efficiently internalized into
hematopoietic stem and neural progenitor cells. The group further demonstrated that
the labeled neural progenitor cells retained their capability for differentiation and the
iron incorporation did not have any effect on viability and proliferation of hematopoi-
etic (CD34+) cells. In another study, dextran-coated magnetic iron oxide nanoparticles
with a core diameter of 4.6±1.2 nm and an overall size, after coating with dextran, of
8-20 nm were covalently attached to OX-26, an anti-transferrin receptor monoclonal
antibody [22]. The antibody-functionalized nanoparticles were used to label oligoden-
drocyte progenitor cells by targeting the transferrin receptors (Tfr) on the cells. The

9
progenitor cells were made highly magnetic by incubating them with iron oxide nanopar-
ticles. Since the oligodendrocyte progenitor cells have previously shown to myelinate
significantly large areas in the central nervous system [23] they were transplanted into
the spinal cord of myelin-deficient rats. After neurotransplantation, these cells could
be easily tracked using MRI and the extent of myelination could be determined (Figure
1.4A). The progenitor cells were found to fully retain their capacity for myelination
and migration in vivo [22]. Similarly, MSCs labeled with magnetic nanoparticles, when
transplanted within a rat experimental model of stroke, migrated from the site of injec-
tion into the lesion. The MSCs could be tracked for three weeks after transplantation.
MRI showed a decrease in the concentration of magnetic nanoparticles at the injec-
tion site and an increase within the lesion after the second and third weeks following
injection (Figure 1.4B) [8].
Figure 1.4: Magnetic resonance (MR) images of SPION-labeled stem cells. (A) MRimages of the spinal cord (three consecutive slices) show the cellular migration of theSPION labeled oligodendrocyte progenitor cells, over a distance of 8.4 mm, 10 daysafter transplantation [22] (B) SPION-labeled MSCs intravenously injected into a ratspinal cord. (a) The lesion in the spinal cord appears as a hyperintensive area (brightspot, arrow), (b) SPION-labeled MSCs are visible as a hypointensive spot (dark spot),(c) Prussian Blue staining of a lesion in the spinal cord of a control animal (withoutMSCs), (d) Prussian Blue staining of a lesion in the spinal cord of a rat injected withSPION-labeled MSCs. The lesion is populated with Prussian Blue-positive MSCs [8].
Tracking of stem cell migration is not limited to neural stem cells. It is also possible
to study the migration of stem cells labeled with SPIONs in other systems such as
the cardiovascular system. Regenerative medicine for cardiac diseases will have enor-
mous therapeutic potential in the future for situations involving ischemic cardiac injury,
which involves irreversible cardiac damage. Bulte and coworkers [24] demonstrated the

10
potential of MRI in tracking magnetically labeled mesenchymal stem cells (MSCs) in a
swine model of myocardial infarction. The mesenchymal stem cells were labeled with
dextran-coated SPIONs (Feridex R©) in order to noninvasively track the quantity and
location of the MSCs after myocardial infarction. It was concluded that the MRI track-
ing of the MSCs labeled with Feridex R© was feasible and represented a preferred method
for studying engraftment of MSCs in myocardial infarction.
Magnetic nanoparticles are not only used as imaging agents, but can be used for
delivering genetic materials into stem cells using an external magnetic field. This pro-
cess is referred to as magnetofection. In addition to being a very efficient method for
delivering cargo into stem cells, it has the added advantage of being able to label the
stem cells, and thus track them using MRI when transplanted in vivo. Pickard et al.
used magnetofection to transfect plasmid DNA having the gene expressing green fluo-
rescent proteins (GFP) into NPCs [25]. They demonstrated that using magnetofection
the NPCs could be transfected multiple times (multifection) leading to enhanced trans-
fection efficiency with negligible toxicity. The NPCs that were multifected survived and
differentiated in 3D neural tissue post-transplantation. Furthermore, the multifection
process had no adverse effects on NPC proliferation or differentiation. In another study
by the same group, it was demonstrated that oligodendrocyte precursor cells (OPCs)
can be transfected with reporter and therapeutics genes using magnetofection [26].

11
Figure 1.5: Transplanted oligodendrocyte precursor cells into organotypic slice cultureswhere the transplanted OPCs survive, migrate, proliferate and differentiate followingtransplantation. (A) Fluorescence microscopy image of GFP-labeled OPCs immedi-ately post-trasplantation. (B) Corresponding phase image. (C) GFP-labeled cells wereobserved having bipolar morphologies typical of migrating OPCs at 24 h. (D) Prolif-eration of OPCs at 48 h and multipolar morphologies indicating normal differentiation(D, inset). (E) Confocal microscopy image of NG2-positive (OPC marker) transplantedOPCs (yellow arrow) against a background of red NG2-positive host OPCs (red arrow).Inset shows MBP-positive (olidendrocyte marker) cells at 48 h post-transplantation in-dicating differentiation of OPCs [26].
The transfection efficiency was significantly enhanced by applied static or oscillat-
ing magnetic fields. The researchers showed that the transfection and the subsequent
expression of the genes was highly competitive or better than the widely used current
methods such as nonviral transfection using cationic lipids and electroporation. They
found that when the magnetofected OPCs were transplanted into brain slices (host
tissue), the cells could migrate, divide, give rise to daughter cells, and integrate within
the host tissue (Figure 1.5). Magnetofection is thus a simple and effective alternative
to current methods for gene transfection into stem cells.
1.1.2 Quantum Dots
Quantum dots (QDs) are robust fluorescent semiconducting nanocrystals with broad
absorption spectra and narrow emission spectra (Figure 1.6) [27]. Apart from MNPs,

12
QDs are being extensively used for applications in cell biology such as cell labeling,
cell tracking, and in vivo imaging due to their potential in imaging and detection ap-
plications. Quantum dots overcome limitations of conventional imaging methods such
as fluorescence microscopy and differential interference contrast microscopy. Conven-
tional methods are limited by a lack of quantitative data, high background noise from
labeled biomolecules, and a requirement for long observation times due to photobleach-
ing, which gradually leads to a loss of signals [28]. Quantum dots, on the other hand,
exhibit extreme brightness and resistance to photobleaching, which allows the use of
lasers having low intensities over long periods of time, thus making them extremely
useful for live cell imaging. Additionally, QDs offer many advantages such as high
fluorescent intensity from high quantum yields and high molar extinction coefficients,
resistance to chemical degradation, and long fluorescence lifetimes (>10 ns).
Figure 1.6: Excitation and emission spectra of quantum dots (QDs). (A) Broad exci-tation spectra of QDs. (B) Narrow emission spectra of QDs [27].
Multiple QDs with different emission wavelengths can be used in parallel for mul-
tiplex imaging [29–32]. The interesting optical properties of QDs originate from the
interactions between electrons, holes, and their local environments, which can be pre-
cisely controlled to generate desired emission and absorption spectra. Since absorption
and emission spectra exhibit sensitive changes depending on particle size, a wide range
of emission spectra from ultraviolet (UV) to infrared (IR) can be obtained. Therefore,
unique emission spectra by synthesizing particles with different diameters have been ac-
quired [33–35]. Quantum dots generally have a core composed of heavy metals, such as
Cadmium-Selenide (CdSe), Cadmium-Telluride (CdTe), with a surrounding ZnS shell.

13
The thickness of the shell can be tuned depending on the reaction time. Typically, the
core/shell QDs with sizes ranging from 2-8 nm in diameter are synthesized by changing
reaction conditions such as temperature, duration, and ligands. The unique photophys-
ical properties of QDs stems from their nanometer scale size. By changing sizes and
compositions, their optical properties can be precisely controlled for many applications.
For example, QDs can be used effectively in multiplexing experiments where multiple
biological units can be labeled simultaneously. Moreover, due to the resistance to pho-
tobleaching, QDs have enabled scientists to study live cells and complex mechanisms of
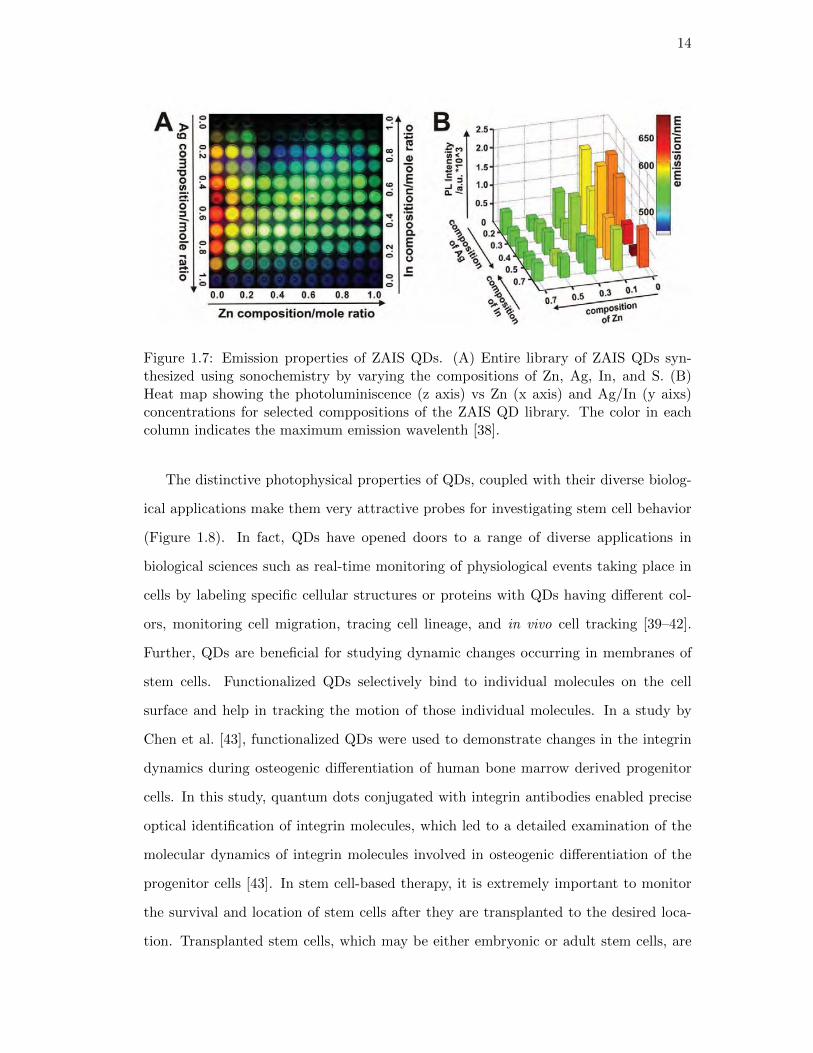
biological processes in a real-time manner [36, 37]. A new generation of QDs have re-
cently become popular as their emission properties depend on the materials from which
are synthesized and not on their sizes. For instance, Subramaniam et al. synthesized
a library of non-toxic QDs from a combination of zinc (Zn), silver (Ag), Indium (In)
and sulfide (S) [38]. These QDs are known as ZAIS QDs and were synthesized using
ultrasonication. A library of ZAIS QDs was synthesized by changing the ratios of each
of the four elements, thus giving unique emission profiles for the same size (Figure
1.7). Considering the toxicity of the heavy metals such as cadmium and selenide, the
non-toxic ZAIS QDs seem to be an attractive choice for cellular delivery and molecular
imaging.
14
Figure 1.7: Emission properties of ZAIS QDs. (A) Entire library of ZAIS QDs syn-thesized using sonochemistry by varying the compositions of Zn, Ag, In, and S. (B)Heat map showing the photoluminiscence (z axis) vs Zn (x axis) and Ag/In (y aixs)concentrations for selected comppositions of the ZAIS QD library. The color in eachcolumn indicates the maximum emission wavelenth [38].
The distinctive photophysical properties of QDs, coupled with their diverse biolog-
ical applications make them very attractive probes for investigating stem cell behavior
(Figure 1.8). In fact, QDs have opened doors to a range of diverse applications in
biological sciences such as real-time monitoring of physiological events taking place in
cells by labeling specific cellular structures or proteins with QDs having different col-
ors, monitoring cell migration, tracing cell lineage, and in vivo cell tracking [39–42].
Further, QDs are beneficial for studying dynamic changes occurring in membranes of
stem cells. Functionalized QDs selectively bind to individual molecules on the cell
surface and help in tracking the motion of those individual molecules. In a study by
Chen et al. [43], functionalized QDs were used to demonstrate changes in the integrin
dynamics during osteogenic differentiation of human bone marrow derived progenitor
cells. In this study, quantum dots conjugated with integrin antibodies enabled precise
optical identification of integrin molecules, which led to a detailed examination of the
molecular dynamics of integrin molecules involved in osteogenic differentiation of the
progenitor cells [43]. In stem cell-based therapy, it is extremely important to monitor
the survival and location of stem cells after they are transplanted to the desired loca-
tion. Transplanted stem cells, which may be either embryonic or adult stem cells, are

15
expected to remodel and differentiate in response to surrounding microenvironments,
resulting in tissue regeneration and repair [10]. Mesenchymal stem cells labeled with
bright, photostable QDs were shown to couple functionally with cardiomyocytes in co-
culture, thus demonstrating the usefulness of QDs as labeling agents in culture (Figure
1.8) [44]. Human mesenchymal stem cells were labeled with QDs bioconjugated with
RGD (arginine-glycine-aspartic acid) peptide during self-replication and multilineage
differentiations into chondrogenic, androgenic, and adipogenic cells in a long term la-
beling study. Human MSCs labeled with QDs remained viable as the unlabeled hMSCs
from the same subpopulation, thus suggesting the use of QDs are useful probes from
long term labeling of stem cells [45].
Figure 1.8: Mesenchymal stem cells (MSCs) labeled with QDs and co-labeled withcalcein (green). The QDs were seen distributed within the perinuclear region withinthe MSCs. The QDs remained bringt and were easy to detect even as the MSCsproliferated [44].
Quantum dots have also been shown to elucidate the mechanisms involved in me-
chanical integration of stem cells to the surrounding tissues and their differentiation
into specific cell lineages in vivo [40]. In addition, multiplex imaging (i.e. tracking dif-
ferent cell populations labeled with QDs which exhibit different emission wavelengths
at the same time) is one of the biggest advantages of using quantum dots for tracking
stem cells in vivo. Wu and coworkers [27] successfully demonstrated in vivo multiplex
imaging of mouse ESCs labeled with QDs. They subcutaneously injected ESCs labeled
with six different QDs, having diverse emission wavelengths 525, 565, 605, 655, 705,
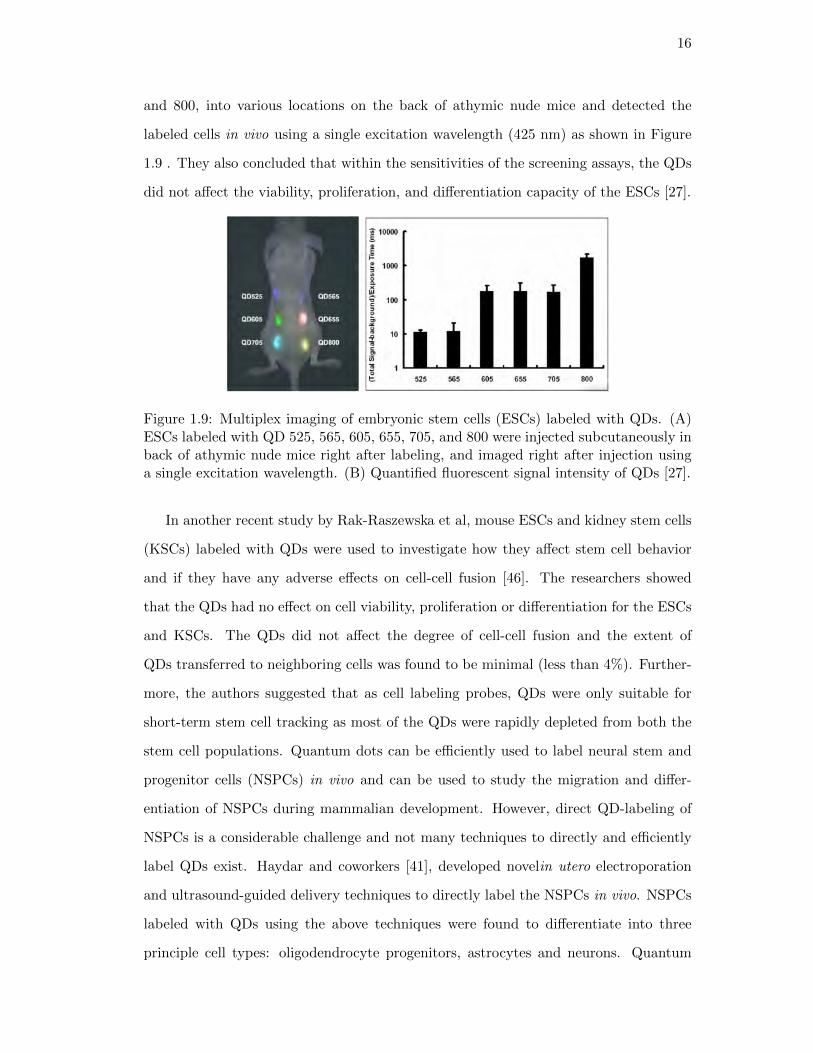
16
and 800, into various locations on the back of athymic nude mice and detected the
labeled cells in vivo using a single excitation wavelength (425 nm) as shown in Figure
1.9 . They also concluded that within the sensitivities of the screening assays, the QDs
did not affect the viability, proliferation, and differentiation capacity of the ESCs [27].
Figure 1.9: Multiplex imaging of embryonic stem cells (ESCs) labeled with QDs. (A)ESCs labeled with QD 525, 565, 605, 655, 705, and 800 were injected subcutaneously inback of athymic nude mice right after labeling, and imaged right after injection usinga single excitation wavelength. (B) Quantified fluorescent signal intensity of QDs [27].
In another recent study by Rak-Raszewska et al, mouse ESCs and kidney stem cells
(KSCs) labeled with QDs were used to investigate how they affect stem cell behavior
and if they have any adverse effects on cell-cell fusion [46]. The researchers showed
that the QDs had no effect on cell viability, proliferation or differentiation for the ESCs
and KSCs. The QDs did not affect the degree of cell-cell fusion and the extent of
QDs transferred to neighboring cells was found to be minimal (less than 4%). Further-
more, the authors suggested that as cell labeling probes, QDs were only suitable for
short-term stem cell tracking as most of the QDs were rapidly depleted from both the
stem cell populations. Quantum dots can be efficiently used to label neural stem and
progenitor cells (NSPCs) in vivo and can be used to study the migration and differ-
entiation of NSPCs during mammalian development. However, direct QD-labeling of
NSPCs is a considerable challenge and not many techniques to directly and efficiently
label QDs exist. Haydar and coworkers [41], developed novelin utero electroporation
and ultrasound-guided delivery techniques to directly label the NSPCs in vivo. NSPCs
labeled with QDs using the above techniques were found to differentiate into three
principle cell types: oligodendrocyte progenitors, astrocytes and neurons. Quantum

17
dots were found in all the three types of cells after differentiation. The cells were also
found to migrate away from the site of injection, suggesting that neither the QDs nor
the in vivo labeling techniques had any effect on migration and differentiation of the
NSPCs (Figure 1.10). Furthermore, their method demonstrated lack of toxicity and
good tolerance of NSPCs for QDs, especially during the early embryonic mammalian
development [41].
Figure 1.10: In utero electroporation for labelling NSPCs and ultsound-guided deliveryof NSPCs labeled with QDs in vivo. (A) NSPCs labeled with QDs in the ventricularzone and subventricular zone of the E16.5 mouse embryo. (B) Highly magnified confocaloptical image showing efficiency of QD (bright) labeling of NSPCs surrounding thelateral ventricle [41].
Despite having unique optical properties and a host of advantages over the con-
ventional tracking agents, toxicity is a primary concern for the application of QDs in
biology. Stem cells tend to be extremely sensitive, and thus toxicity is a primary de-
terminant in deciding whether QDs would be feasible for stem cell tracking, especially
in vivo. Some literature studies do suggest that QDs are nontoxic; nevertheless, recent
data shows that cytotoxicity is dependent upon the physicochemical properties, dose
and exposure concentrations [47]. Although the mechanism of cytotoxicity is not yet
clearly known and is under thorough investigation, concerns about toxicity of QDs have
been raised as they are used for cell tracking studies in live animals. Quantum dots
contain heavy metals such as cadmium and selenium, and the cytotoxicity is observed
due to the presence of Cd2+ and Se2− ions [48, 49]. Toxicity can be considerably re-
duced by coating the core made of CdSe with a shell of a material such as ZnS, which
significantly reduces toxicity by blocking the oxidation of CdSe by air [50]. Although

18
the toxicity may not be critical at the low concentrations optimized for labeling, it
could be detrimental for the embryo development at higher concentrations. Neverthe-
less, the problem could be solved by coating the QDs and making them biologically
inert [50]. Larger molecules such as proteins (e.g. Streptavidin, bovine serum albumin)
further slow down the photooxidation of the core [51]. Bioconjugation of QDs with
biomolecules such as RGD did not show any toxic effect on hMSCs as compared to
unlabeled hMSCs [45]. In a dose-dependent study involving the labeling of MSCs with
QDs, it was observed that if the exposure of QDs to MSCs was optimized and limited
to low concentrations then the QDs were not significantly toxic [44]. Addressing the
cytotoxicity issues concerning the application of QDs synthesized from heavy metals,
Subramaniam at. al used ZAIS QDs to deliver siRNA into MSCs and GFP-labeled
brain tumor cells [38]. The ZAIS QDs were found to be non-toxic towards both the
cells and provided excellent imaging capabilities.
1.1.3 Gold Nanoparticles
Gold nanoparticles (AuNPs) have been attractive candidates for delivery of payloads
into cells. These payloads include small molecules, proteins, DNA or siRNA. They have
been widely used in a variety of cells. They have very unique physical and chemical
properties, which enables precise and accurate delivery of biomolecules across the cells
membranes. The gold core is inert and non-toxic and monodisperse AuNPs can be
synthesized with relative ease in large quantities, with the sizes ranging from 1 nm -150
nm [52]. Furthermore, their surfaces can be readily functionalized, typically through
thiol linkages [53]. They also have extensive applications in biosensing and diagnostics.
Gold nanoparticles were recently used in bone tissue engineering, for stimulating
osteogenic differentiation of mesenchymal stem cells (MSCs). Yi et al investigated the
effect that the AuNPs had on the differentiation of MSCs and the related molecular
mechanisms [54]. The MSCs were treated with different concentrations of AuNPs and
cultured in the presence of osteogenic supplements. The osteogenic differentiation was
measured by measuring the activity of alkaline phosphatase (ALP), a specific marker
for bone formation. As the MSCs can also undergo adipogenic differentiation (fat cells),

19
the adipogenic differentiation was measured using oil red. The researchers found that
the ALP activity was increased when a higher concentration of AuNPs was used. The
ALP activity was measured at 7, 10 and 14 days. They also observed that on day 14,
the ALP activity was significantly higher for all concentrations of AuNPs, as compared
to the activity on day 7 and 10. Their results, therefore confirmed that the osteogenic
differentiation of MSCs could be controlled in a dose- and time-dependent manner using
AuNPs. Their study also showed that while the AuNPs promoted osteogenic differenti-
ation, they inhibited adipogenic differentiation. On further investigating the signaling
pathways affected by AuNPs, they found that the AuNPs interact with proteins within
the cytoplasm, thus interfering with certain signaling pathways. The AuNPs also in-
teract with the extracellular matrix (ECM), leading to the up-regulation of integrins.
Both these events cause stress on MSCs, which leads to the activation of the p38 MAPK
signaling pathway, which in turn causes the up-regulation of osteogenic genes and down-
regulation of adipogenic genes. This study clearly demonstrates the impact of AuNPs
on cellular events which ultimately determines the fate of the MSCs.
1.1.4 Dendrimers
Dendrimers are synthetic polymers that are built from a series of branches around an
inner core. They are tree-like or star-shaped polymers that adopt generally a quasi-
spherical shape [55]. They have unique molecular weights and their dimensions are
extremely small, having diameters (depending on the generation) in the range of 2-10
nm. Dendrimers have been finding increasing use in the field of drug and gene delivery
because they are synthetic, highly branched, mono-disperse polymers in the nanometer
size range which offer the control that modern drug delivery and targeting demands,
namely: control of chemical nature of carrier, control of molecular weight, control of sur-
face and internal structure and character, vital in targeting and control of dimensions.
The genetic material can be attached to the surfaces of dendrimers with relative ease
due to the high concentration of positively charged functional groups. These functional
groups can also be modified to attach targeting moieties like folic acid, transferrin and
antibodies [56]. Amongst these, the earliest synthesized and commercialized dendrimers
20
are polyamidoamine (PAMAM) dendrimers.
Gebhart et al. compared the performance of several dendrimeric systems and found
that the transfection efficiency depends not only on the vector molecule but also the
type of cells to be transfected [57]. Therefore, several investigations on developing more
efficient and less toxic dendrimers are currently ongoing to control the cellular behav-
ior. To this end, Santos et al. showed that PAMAM dendrimers, without any surface
functionalization, were able to transfect the bone morphogenetic protein-2 (BMP-2) to
MSCs, although at a low efficiency. The group also showed in vitro osteogenic differen-
tiation of the MSCs by checking the expression levels of various osteogenic markers [55].
However, MSCs are very promising and clinically relevant due to their properties. Thus,
increasing the transfection efficiency of the PAMAM dendrimers was vital. The same
group then functionalized the PAMAM dendrimers with arginine-glycine-aspartic acid
(Arg-Gly-Asp, RGD) peptide sequence, which provided a major recognition system for
the integrin receptors expressed on the MSCs. RGD tripeptide sequence play a key
role in cell adhesion and has been used in numerous studies as a cell-targeting agents in
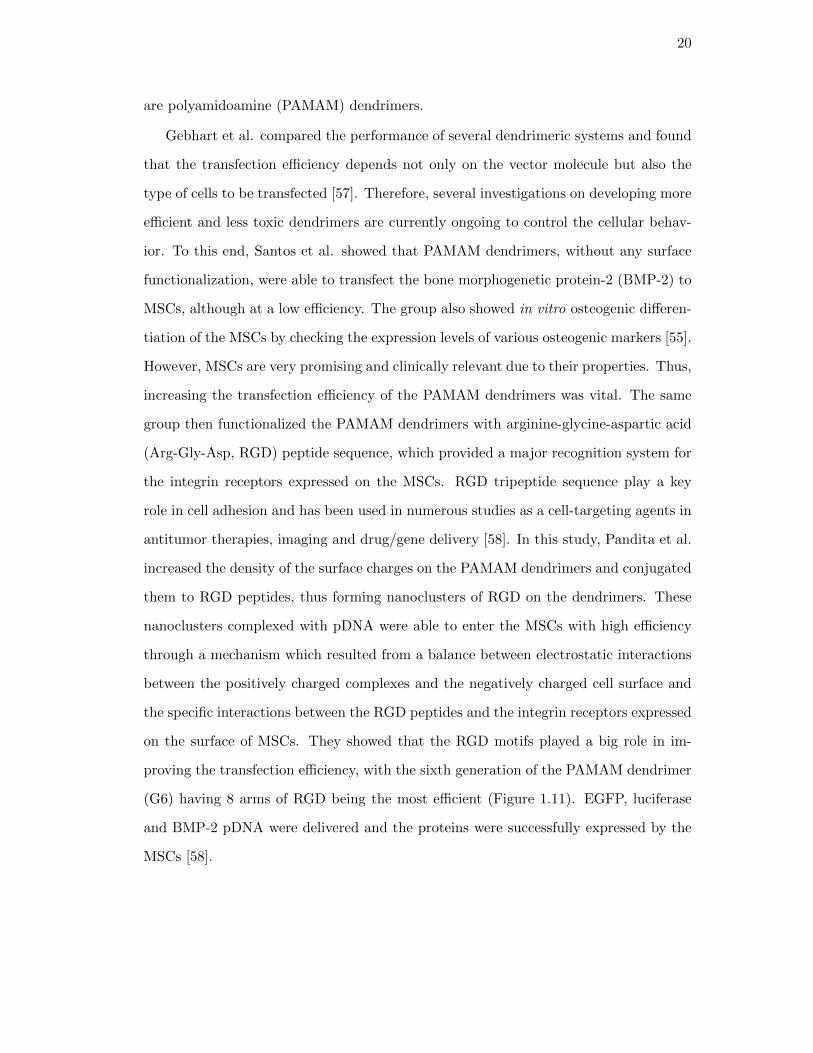
antitumor therapies, imaging and drug/gene delivery [58]. In this study, Pandita et al.
increased the density of the surface charges on the PAMAM dendrimers and conjugated
them to RGD peptides, thus forming nanoclusters of RGD on the dendrimers. These
nanoclusters complexed with pDNA were able to enter the MSCs with high efficiency
through a mechanism which resulted from a balance between electrostatic interactions
between the positively charged complexes and the negatively charged cell surface and
the specific interactions between the RGD peptides and the integrin receptors expressed
on the surface of MSCs. They showed that the RGD motifs played a big role in im-
proving the transfection efficiency, with the sixth generation of the PAMAM dendrimer
(G6) having 8 arms of RGD being the most efficient (Figure 1.11). EGFP, luciferase
and BMP-2 pDNA were delivered and the proteins were successfully expressed by the
MSCs [58].

21
Figure 1.11: Dendrimer-based gene delivery into mesenchymal stem cells. Cellulardistribution of dye-labeled pDNA (red) in MSCs at 2,4, and 24 h post-transfection.(A), (B), (C), and (D) represent confocal fluorescent images showing MSCs transfectedwith PAMAM G5, RGD8-G5, G6, and RGD8-G6 respectively. The cell nuclei werestained with DAPI (blue), and the acidic endosomes and lysosomes were stained withLysoSensor Green DND-189 (green) [58].
Besides naked dendrimers and surface-functionalized dendrimers, dendrimer com-
posites of iron oxide nanoparticles, also known as magnetodendrimers, represent a ver-
satile new class of contrast agents for MRI. They were developed by Bulte at al. and
were shown to efficiently label mammalian cells, including neural stem cells and mes-
enchymal stem cells [6]. They were shown to have an oligocrystalline structure of 7-8
nm. It was observed that labeling NSCs and MSCs with magnetodendrimers did not
affect their growth rate and they exhibited a growth rate which was similar to that of
unlabeled stem cells. The cellular uptake of these composites is through a non-specific
adsorption process, thus offering a great opportunity to label a variety of stem cells
without regard to their origin or animal species (Figure 1.12).
22
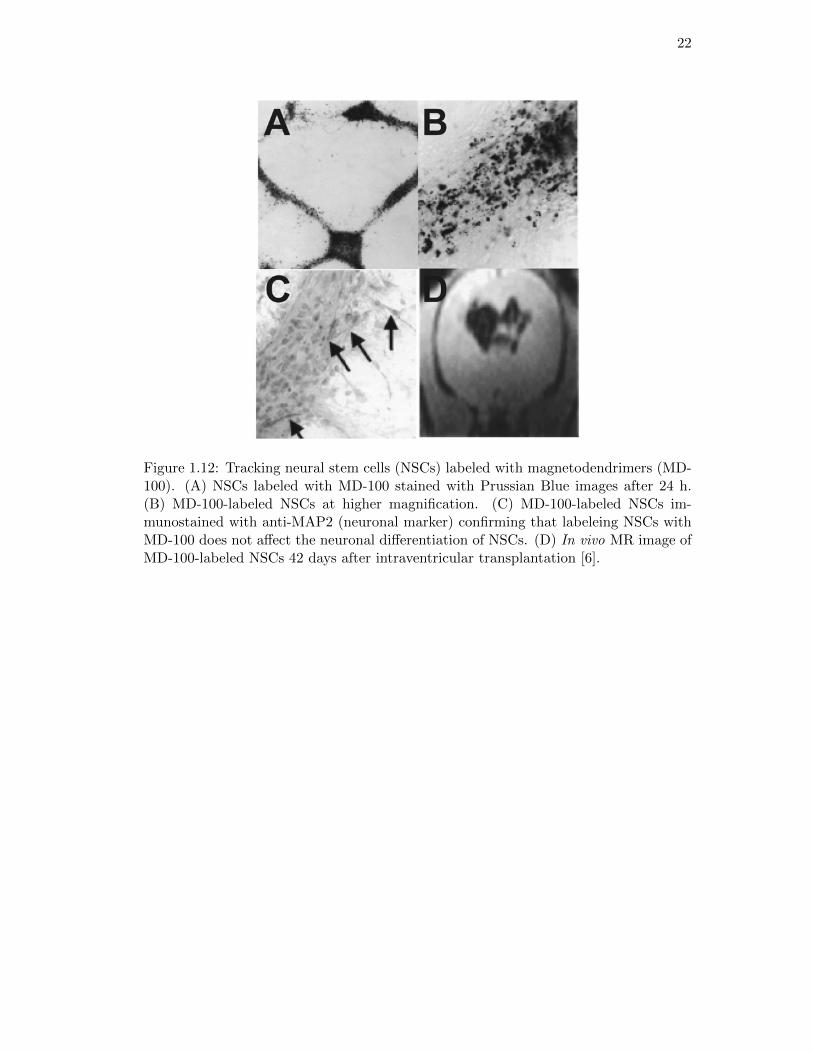
Figure 1.12: Tracking neural stem cells (NSCs) labeled with magnetodendrimers (MD-100). (A) NSCs labeled with MD-100 stained with Prussian Blue images after 24 h.(B) MD-100-labeled NSCs at higher magnification. (C) MD-100-labeled NSCs im-munostained with anti-MAP2 (neuronal marker) confirming that labeleing NSCs withMD-100 does not affect the neuronal differentiation of NSCs. (D) In vivo MR image ofMD-100-labeled NSCs 42 days after intraventricular transplantation [6].

23
1.2 Nanotopography for Controlling Stem Cell Behaviors
In stem cell biology, specific environments called niches are formed consisting of cells and
extracellular matrix (ECM) molecules such as collagen, fibronection, elastin, laminin
etc. These ECM molecules are typically secreted by the cell surrounding the stem cells.
The ECM molecules act as physical cues for the stem cells, providing them with specific
surface chemistry and topographical features at the nanoscale [59]. The ECM molecules
provide for adhesion sites via integrins and transmembrane proteins. The physical cues
provided by the ECM molecules generate an instructive microenvironment which guides
stem cell behavior (Figure 1.13). The receptors on the stem cells bind to the fibers of the
ECM and activate signaling pathways which affect adhesion, migration, proliferation
and differentiation [60]. Having the ability to manipulate surfaces by creating the
complexities of the ECM, which includes nanotopographies has gone a long way in
improving our understanding of how stem cells respond to nanotopographical features.
Figure 1.13: Nanoscale features for controlling stem cell behaviors.

24
1.2.1 Patterning of Topographical Cues
Stem cells are sensitive to physical cues and surface features in the micrometer to
nanometer range. By probing the extracellular microenvironment with fingerlike mem-
brane projections known as filopodia, feedback mechanisms are generated depending on
the specific types of physical cues which then result in the expression of certain genes.
This process of converting the detection of certain physical cues into biochemical re-
sponses is known as mechanotransduction [61]. Although complicated, researchers are
now modifying surface features for investigating and controlling stem cell behaviors.
Micro- and nanopatterned surfaces are generally fabricated using soft lithographic
techniques such as e.g microcontact printing [62, 63] and micronscale plasma-initiated
patterning [64,65], and hard lithography such as photolithography [66]. Various shapes
- the most common ones being circles, squares, triangles, stripes, grids and stars - can
be generated using the two methods. The background, which is the area surrounding
the patterned features, is generally passivated using polyethylene glycol molecules to
prevent nonspecific attachment of proteins and cells. The stem cells are then cultured,
grown and differentiated on these surface features to investigate and control their fate
(Figure 1.14).
Figure 1.14: Cells cultured on different patterned features. (A)-(C) Cells immunos-tained for F-actin (green), vinculin (red) and nuclei (blue). (D) Cell immunostained formyosin IIa. (E) Fluorescent heat maps of cells stained for myosin IIa as a quantitativemeasure of contractilily. (Scale bar: 20 µm) [67].
The patterned surface features have been used to differentiate adult stem cells into
lineage specific terminal cells such as osteoblasts, neurons, cardiac cells etc. For in-
stance, Solanki et al. investigated the differentiation of neural stem cells (NSCs) on

25
micropatterns of laminin, which is an essential ECM protein required for the adhesion
and growth of NSCs [68]. They grew and differentiated the NSCs on square, stripe and
grid patterns of laminin to investigate the role and effect of pattern geometry, shape and
cell-cell interactions on differentiation of NSCs. They found that that the differentia-
tion of NSCs was determined by the pattern shape and geometry which ultimately also
controlled cell-cell interactions. The NSCs differentiated on the grid patterns showed
the highest cell-cell interactions and a higher percentage of NSCs differentiated into
neurons as compared to the NSCs differentiated on the other patterns.
In a similar study, Kilian at al. investigated the role of fibronectin patterns on the
adipogenic and osteogenic differentiation of human MSCs [67]. They determined the
effect of adhesive areas and curvatures of micropatterned regions on the differentiation
of MSCs. For this reason they generated islands of fibronectin in a variety of shapes such
as rectangle, star and flower, having different aspect ratios and curvatures. The aspect
ratio was defined as the ratio of the length to the width. The MSCs were cultured on
these patterns and differentiated in mixed differentiation medium for adipocytes and
osteoblasts (Figure 1.15). They reported that when the MSCs differentiated on small
islands of fibronectin (1000 µm2) they differentiated into chondrocytes and when they
were differentiated on large islands (5000 µm2), they differentiated into osteoblasts.
When the size of the islands was between these two sizes (2500 µm2), they obtained
mixed populations of adipocytes and osteoblasts.
26
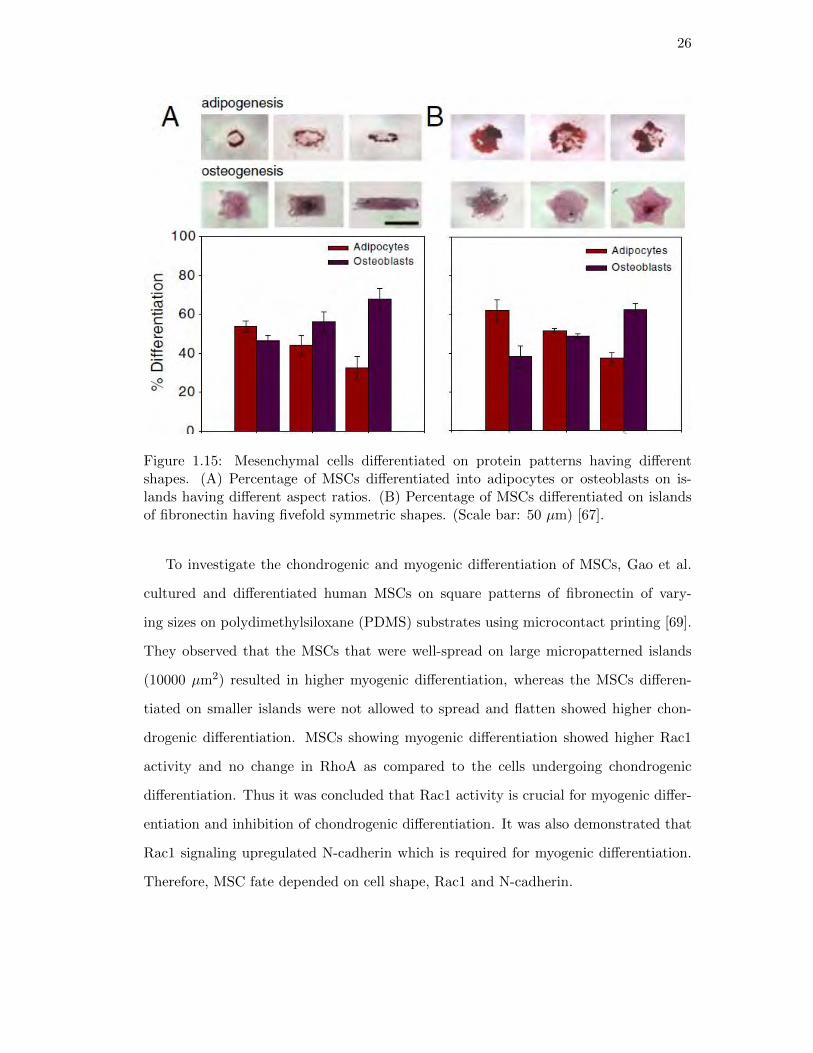
Figure 1.15: Mesenchymal cells differentiated on protein patterns having differentshapes. (A) Percentage of MSCs differentiated into adipocytes or osteoblasts on is-lands having different aspect ratios. (B) Percentage of MSCs differentiated on islandsof fibronectin having fivefold symmetric shapes. (Scale bar: 50 µm) [67].
To investigate the chondrogenic and myogenic differentiation of MSCs, Gao et al.
cultured and differentiated human MSCs on square patterns of fibronectin of vary-
ing sizes on polydimethylsiloxane (PDMS) substrates using microcontact printing [69].
They observed that the MSCs that were well-spread on large micropatterned islands
(10000 µm2) resulted in higher myogenic differentiation, whereas the MSCs differen-
tiated on smaller islands were not allowed to spread and flatten showed higher chon-
drogenic differentiation. MSCs showing myogenic differentiation showed higher Rac1
activity and no change in RhoA as compared to the cells undergoing chondrogenic
differentiation. Thus it was concluded that Rac1 activity is crucial for myogenic differ-
entiation and inhibition of chondrogenic differentiation. It was also demonstrated that
Rac1 signaling upregulated N-cadherin which is required for myogenic differentiation.
Therefore, MSC fate depended on cell shape, Rac1 and N-cadherin.

27
1.2.2 Nanomaterials for Generating Topographical Cues
Nanoscale features can also be created using a variety of nanomaterials such as nanofibers,
nanoparticles, and nanotubes. Nanomaterial-ECM protein composites have been inves-
tigated and are known to control stem cell differentiation [70,71].
Park et al. demonstrated polarization-controlled differentiation of human neural
stem cells (hNSCs) using synergistic cues of ECM protein and carbon nanotube (CNT)
patterns [71]. Laminin was selectively adsorbed on CNT patterns to provide the optimal
nanotopography, which resulted in selective adhesion and growth of hNSCs. Laminin
coated CNTs were extremely biocompatible and provided a good handle for controlling
the nanotopographical features (Figure 1.16).
Figure 1.16: Human neural stem cell growth and polarization on CNT patterns coatedwith laminin. The schematic shows polarization-controlled neuronal differentiation us-ing CNT patterns. CNT monolayer patterns were generated on a glass substrate usingmicrocontact printing and laminin was selectively adsorbed on the CNT patterns. thehNSCs attached to the CNT-laminin patterns which resulted in polarization-controlledneuronal differentiation [71].
Overall, the results clearly showed that CNT patterns played a critical role in con-
trolling the hNSC outgrowths during the growth and differentiation process, due to
cell-cell interactions and cytoskeletal tensions. They observed that the hNSCs differ-
entiated to form neural networks along the inside of the line patterns. Notably, the
structural-polarization-controlled differentiation of individual hNSCs was achieved us-
ing CNT patterns having one square and a single line protruding from the square. After
seeding the cells, the hNSCs selectively adhered to the squares and grew along the line
protruding from the squares (Figure 1.17). The differentiated hNSCs grew their axons

28
along the protruding line. While the hNSCs differentiated with controlled structural
polarity on the CNT patterns, they maintained their capabilities of differentiating into
the main phenotypes found in the nervous system, namely neurons and astrocytes.
Figure 1.17: Polarization-controlled neuronal differentiation of individual hNSCs usingCNT patterns. (a) SEM image showing the CNT patterns have a single protrudingnarrow strips. (b) Phase contrast image showing the attachment of hNSCs on the CNTpatterns. The dotted lines represent the CNT patterned area. (c) Phase contrast imageshowing the growth on hNSCs, where the hNSCs were seen to extend along the narrowstrip during differentiation. (d) Image showing differentiated hNSCs immunostainedfor axonal marker, growth-associated protein 43 (GAP43, green) and Hoechst (blue)for nucleus. (e) Image showing differentiated hNSCs immunostained for neural markersGFAP(astrocyte, green) and TuJ1(neurons, red). (Scale bar: 50 µm) [71].
Similarly, Baik et al. [70] used patterns of carbon nanotubes as cues for osteogenesis
of human MSCs in an effort to enhance osteogenesis. In this study, they demonstrated
that osteogenic differentiation of hMSCs was induced by single walled CNTs (swCNTs)
as ECM cues, without any chemical treatments. Interestingly, it was also observed

29
that the surface treatment of swCNTs using oxygen plasma (O-swCNTs) showed en-
hanced differentiation as well as adhesion of hMSCs. Their results showed enhanced
cell spreading on swCNTs as compared to the glass substrates. The authors believe
that this might have been due to the nanoscale surface roughness of the swCNTs. Fur-
thermore, the O-swCNTs layers showed greater cell spreading than the swCNTs. This
was presumably due to the chemical changes of the O-swCNTs, such as increased hy-
drophilicity and surface oxygen content, which also helped enhancing the proliferation
and adhesion of hMSCs on them. The osteogenic induction capacity of the swCNTs
was checked by immunostaining for the osteogenic marker proteins such as osteocalcin
and alkaline phosphatase. In addition to these markers, the expression of core binding
factor alpha1 (CBFA1) was checked. CBFA1 is the main transcription factor for com-
mitting hMSCs to an osteogenic lineage. They showed that osteogenic differentiation of
hMSCs was promoted on swCNT layers without the use of osteogenic induction media.
In addition, they found that simple oxygen plasma treatment amplified the adhesion,
proliferation and osteogenic differentiation of the hMSCs by adding chemical effects to
the main topographical features.
Graphene, as a nanomaterial, is an excellent biocompatible material which provides
nanotopographical features and does not hinder the proliferation of stem cells. In fact,
it was observed that the presence of graphene leads to accelerated differentiation of
human MSCs into osteoblasts [72]. Park et al. [73] cultured and differentiated human
NSCs on graphene and observed that the NSCs cultured on graphene showed enhanced
adhesion, and after three weeks on differentiation a higher number of NSCs were still
attached on graphene as compared to tissue culture plates (Figure 1.18). They also
observed enhanced neuronal differentiation of NSCs on graphene with a significant
difference in morphology, with the NSCs differentiated on graphene showing higher
number of neurite outgrowths. They thus concluded that graphene created an ideal
microenvironment for the neuronal differentiation of NSCs [73] .

30
Figure 1.18: Human neural stem cells (hNSCs) cultured on graphene. Bright-fieldimages representing the growth and differentiation of hNSCs for three days (left), twoweeks (middle), and three weeks (right). The hNSCs differentiated on graphene remainattached even after three weeks, but those on glass gradually get detached. (Scale bar:200 µm) [73].
Nanofibers have been increasingly used to create nanotopographical features, in an
effort to mimic the microenvironment found in tissues. Shih et al. showed that human
MSCs cultured and grown on 500-1000 nm were well-spread and showed higher viability
and lower mobility as compared to the MSCs grown on tissue culture plates [74]. In
another study, Christopherson et al. differentiated rat NSCs on nanofibers having
different diameters to investigate how the diameters affect the differentiation of NSCs
[75]. They found that NSCs cultured on nanofibers having smaller diameters (283
nm) differentiated preferentially into oligodendrocyte precursors, whereas the NSCs
cultured on nanofibers having larger diameters (749 nm) differentiated preferentially
into neurons. Alignment of nanofibers has also been show to play a significant role in
determining the fate of stem cells (Figure 1.19).
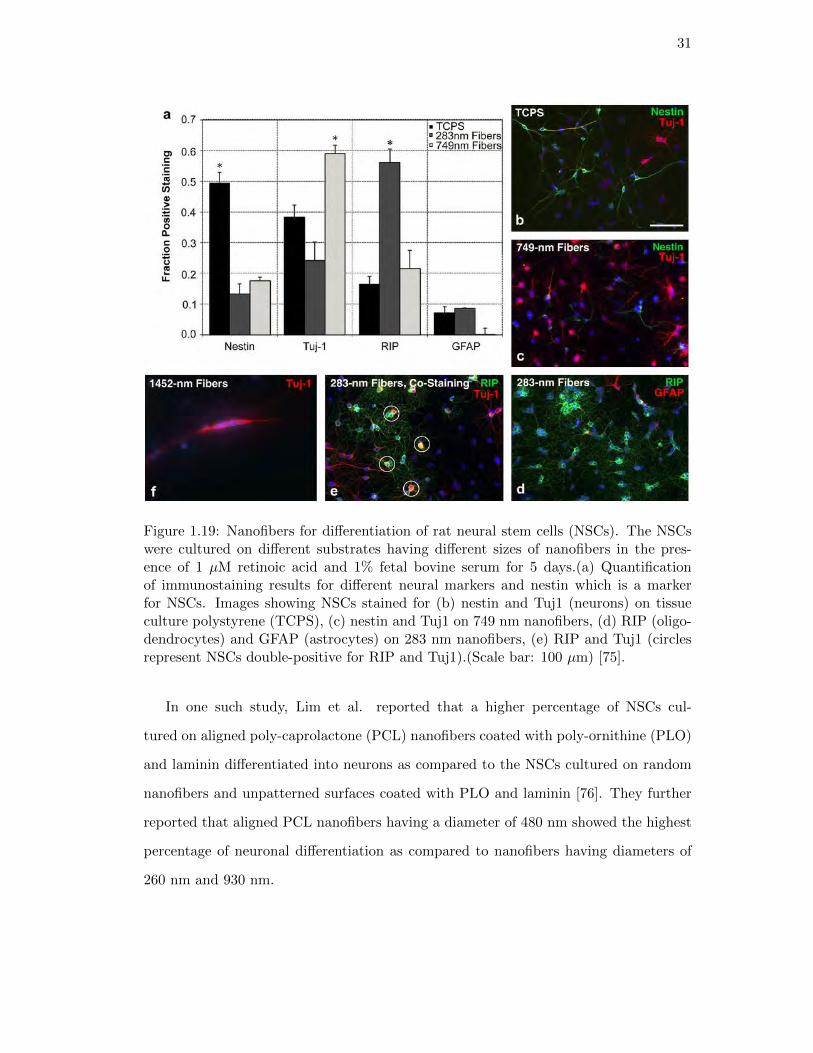
31
Figure 1.19: Nanofibers for differentiation of rat neural stem cells (NSCs). The NSCswere cultured on different substrates having different sizes of nanofibers in the pres-ence of 1 µM retinoic acid and 1% fetal bovine serum for 5 days.(a) Quantificationof immunostaining results for different neural markers and nestin which is a markerfor NSCs. Images showing NSCs stained for (b) nestin and Tuj1 (neurons) on tissueculture polystyrene (TCPS), (c) nestin and Tuj1 on 749 nm nanofibers, (d) RIP (oligo-dendrocytes) and GFAP (astrocytes) on 283 nm nanofibers, (e) RIP and Tuj1 (circlesrepresent NSCs double-positive for RIP and Tuj1).(Scale bar: 100 µm) [75].
In one such study, Lim et al. reported that a higher percentage of NSCs cul-
tured on aligned poly-caprolactone (PCL) nanofibers coated with poly-ornithine (PLO)
and laminin differentiated into neurons as compared to the NSCs cultured on random
nanofibers and unpatterned surfaces coated with PLO and laminin [76]. They further
reported that aligned PCL nanofibers having a diameter of 480 nm showed the highest
percentage of neuronal differentiation as compared to nanofibers having diameters of
260 nm and 930 nm.

32
1.3 Nanomaterials for Developing Biosensors
Significant advances in nanotechnology have paved the way for development of bet-
ter devices for biodetection. The unique physical, chemical and electrical properties of
nanomaterials have resulted in the rapid development of devices having improved sensi-
tivity and selectivity, fabricated either through the bottom-up or top-down approaches.
A variety of nanomaterials having different sizes, shapes and properties have been used
to fabricate devices [77]. In the past decade, nanomaterial-based biosensors have of-
fered significant advantages over conventional methods for detecting biomolecules as the
interactions with these biomolecules and nanomaterials involves electrostatic interac-
tions and charge transfers, which can be detected by the electrical devices with relative
ease. From all the different methods that can be used for biodetection, we will review
some of the advances in the development of nanomaterial-based electrical devices for
biodetection.
For the development of electrical devices as biosensors various nanomaterials, such
as carbon nanotubes (CNTs), graphene, and silicon nanowire (SiNW) have been used
owing to their unique physical, chemical and electrical properties which confers remark-
ably enhanced sensitivity and selectivity for detecting the target biomolecules [78].
1.3.1 Carbon Nanotubes
Carbon nanotubes are allotropes of carbon consisting of graphene sheets wrapped into
hollow cylinders having ends which are capped or open. Single-walled CNTs (swCNTs)
are single graphene sheets rolled into cylinders, whereas multiwalled CNTs (mwCNTs)
consist of concentric cylinders having a space of 0.34 nm in between each cynlinder.
Due to their excellent electrical (mwCNTs) and semiconducting (swCNTs) properties,
CNTs in general are an excellent choice of nanomaterials for incorporating into an
electrical device. Pacios et al. developed a novel CNT-based field effect transistor
(FET), modified with aptamers for specifically detecting thrombin protein in real time
[79]. The CNTs on the device were functionalized with the aptamers by first conjugating
the CNTs with pyrene carboxylic acid (1-2 pyrenebutyric acid) followed by EDC-NHS

33
coupling form an amide bond. The authors reported that the device was highly sensitive
with the detection limit being 20 pM of thrombin. Furthermore, the device was capable
of specifically detecting thrombin in the presence of other protein, thus demonstrating
remarkable selectivity [79].
In another recent study, Lerner at al. used a CNT-FET to detect osteopontin, a new
prostate cancer biomarker. The CNTs were functionalized with genetically engineered
single chain variable fragment (scFv) protein having a high binding affinity for OPN [80].
The scFv was covalently linked to the CNTs using diazonium salts (Figure 1.20).
Figure 1.20: Schematic diagram for functionalization of CNTs with scFv antibodyagainst OPN. The sp3-hybridized sites are created on the CNTs by incubating them ina solution of diazonium salt. The carboxylic acid group is then activated using EDCand NHS. The scFv fragment forms a stable amide bond by displacing NHS (aminegroups from lysine are in red). The OPN binds preferntially to the scFv on the CNTs(OPN shown in yellow) [80].
Based on the electron transport measurements on the binding of OPN to scFv, it
was concluded that the CNT-FET is a good choice for detecting small concentrations
of OPN. A concentration-dependent increase in source-drain current was observed with
a detection limit of 30 fM. In addition to the excellent sensitivity, the device also
demonstrated excellent selectivity by responding only to OPN in a background of con-
centrated bovine serum albumin, without loss of signal. The authors attributed the
detection mechanism to the changes in scattering at the scFv protein-occupied defect

34
sites on the CNT side walls [80]. Although the CNT-FET was used to detect OPN,
the chemical functionalization could be adopted to make a similar device to detect any
specific antigen using the corresponding protein.
1.3.2 Graphene
Graphene is a planar sheet of sp2- bonded carbon atoms arranged in a honeycomb
lattice. This novel nanomaterial has found exciting application across a range of dis-
ciplines. Graphene is two-dimensional in structure having remarkable physicochemical
and structural properties and has been anticipated to provide for newer opportunities
for developing electrical devices, especially for biodetection [81]. In the last decade
many devices using graphene have been developed for detecting biological and chem-
ical molecules [82]. For instance, a pristine graphene-based device was developed by
Ohno et al. to detect bovine serum albumin (BSA) with a lower detection limit of
0.3 nM. However, this sensor lacked specificity of detection. The presence of BSA was
detected by the nonspecific adsorption of protein on graphene, which led to an increase
in conductance of graphene biased at the p-type region [83]. Improving upon this tech-
nology, Mao et al. used reduced graphene oxide (rGO) for making a sensor specific for
immunoglobulin G (IgG) [84]. The authors reported a very low detection limit of 13
pM. In this work, gold nanoparticles (AuNPs) were conjugated to anti-IgG antibodies
and assembled on rGO sheets by electrospraying and using electrostatic force directed
assembly. Additionally, the unfunctionalized regions on the rGO were passivated using
Tween 20 to prevent non-specific binding of proteins.
In an interesting work reported by Myung et al. rGO-based biosensor was developed
for selectively detecting breast cancer biomarkers HER2 and EGFR [85]. In this work,
positively charged silica nanoparticles (SiNPs, 100 nm) were encapsulated by GO sheets
and then reduced to form rGO. The 3D nanostructures significantly increased the sur-
face area available for functionalization of the antibodies against HER2 and EGFR. The
functionalization was carried out using pyrene aldehyde which assembles on the rGO.
This was followed by reductive amination in the presence of sodium cyanoborohydride
to form an amide bond between the antibodies and the pyrene aldehyde. The authors

35
reported that they could selectively detect HER2 having a detection limit of 100 pM
and EGFR with a detection limit of 10 nM. When the positively charged HER2 and
EGFR biomolecules were bound to the antibodies on rGO surfaces it led to a positive
gating effect, which in turn reduced the hole density in the p-type rGO [85].
1.3.3 Silicon Nanowires
The use of silicon nanowires (SiNWs) as components of electrical devices to detect
biomolecules at extremely low concentrations has been one of the hot topics in the field
of biosensing. SiNWs can be prepared as single cystals and can have diameters as small
as 2-3 nm [77]. They happen to be one of the most explored and characterized semi-
conducting nanowires. Extensive investigations about their physicochemical properties,
synthesis and applications have been carried out. The reason SiNWs are popular as
components of FET-based biosensors is because of their sensitivity. This sensitivity
stems from the high carrier mobility and high surface-to-volume ratio which ensures
that the mass carriers can be controlled with relative ease by simple applying a weak
electric field on the gate [86]. Like we saw with the use of CNTs and graphene, the
use of SiNWs has two major advantages: high sensitivity and fast responses without
tedious labeling steps. The unique advantages of these nanomaterials come from their
one-dimensional morphological structures, and many researchers are trying to utilize
them as a highly sensitive and selective signal transduction medium. The scheme (Fig-
ure 1.21) [87] illustrates a basic structure of electrical detection of biomolecules with
silicon nanowire biosensor.
Figure 1.21: Scematic diagram showing the detection of biomolecules using siliconnanowire biosensor. The schematic showing two nanowire devices, 1 and 2, withinan array, where nanowires were modified with different (1, green; 2, red) antibodyreceptors [87].

36
Lieber and coworkers [87] synthesized SiNWs with peptide nucleic acid (PNA) func-
tionalization, and demonstrated how the synthetic material could detect DNA without
labeling. A subsequent study modified SiNWs with biotin to detect picomolar concen-
trations of streptavidin and demonstrated high sensitivity to change in conductivity of
the nanowires upon the biotin-streptavidin binding. Similar studies have also been car-
ried out by Chen et al. [88], where they focused on the application of carbon nanotubes
as a material for the sensitive detection.
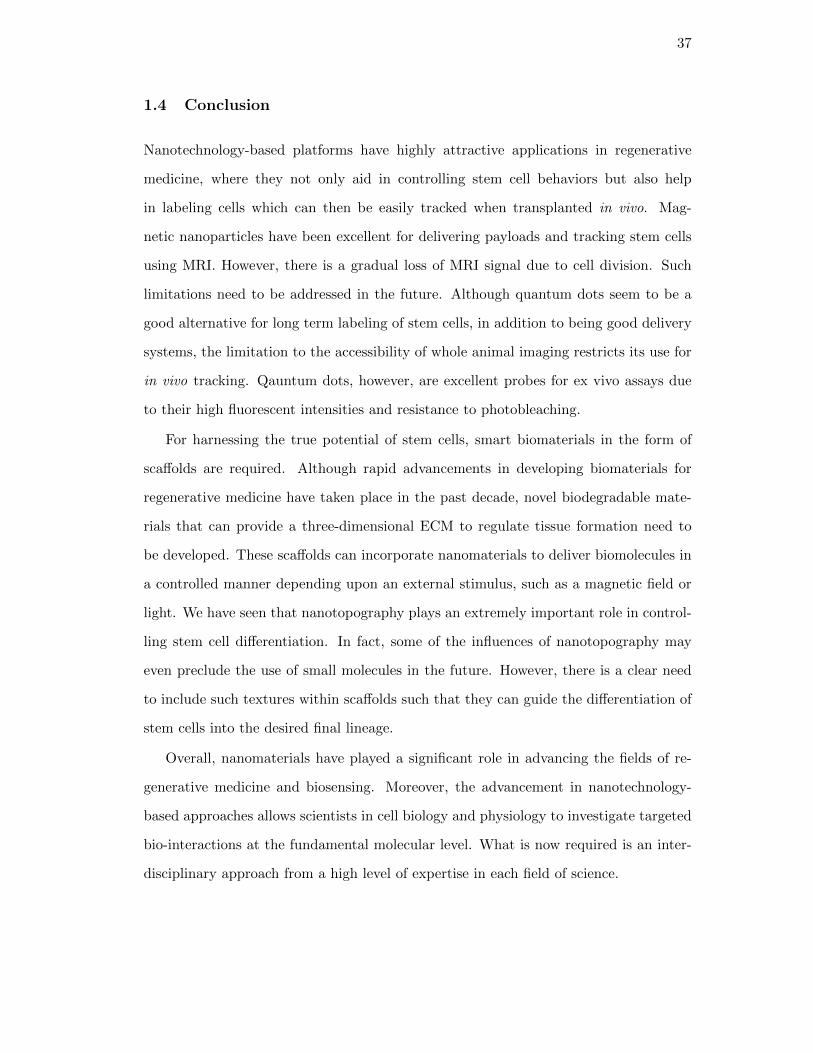
37
1.4 Conclusion
Nanotechnology-based platforms have highly attractive applications in regenerative
medicine, where they not only aid in controlling stem cell behaviors but also help
in labeling cells which can then be easily tracked when transplanted in vivo. Mag-
netic nanoparticles have been excellent for delivering payloads and tracking stem cells
using MRI. However, there is a gradual loss of MRI signal due to cell division. Such
limitations need to be addressed in the future. Although quantum dots seem to be a
good alternative for long term labeling of stem cells, in addition to being good delivery
systems, the limitation to the accessibility of whole animal imaging restricts its use for
in vivo tracking. Qauntum dots, however, are excellent probes for ex vivo assays due
to their high fluorescent intensities and resistance to photobleaching.
For harnessing the true potential of stem cells, smart biomaterials in the form of
scaffolds are required. Although rapid advancements in developing biomaterials for
regenerative medicine have taken place in the past decade, novel biodegradable mate-
rials that can provide a three-dimensional ECM to regulate tissue formation need to
be developed. These scaffolds can incorporate nanomaterials to deliver biomolecules in
a controlled manner depending upon an external stimulus, such as a magnetic field or
light. We have seen that nanotopography plays an extremely important role in control-
ling stem cell differentiation. In fact, some of the influences of nanotopography may
even preclude the use of small molecules in the future. However, there is a clear need
to include such textures within scaffolds such that they can guide the differentiation of
stem cells into the desired final lineage.
Overall, nanomaterials have played a significant role in advancing the fields of re-
generative medicine and biosensing. Moreover, the advancement in nanotechnology-
based approaches allows scientists in cell biology and physiology to investigate targeted
bio-interactions at the fundamental molecular level. What is now required is an inter-
disciplinary approach from a high level of expertise in each field of science.

38
1.5 Overview of Dissertation
All the above nanotechnology-based approaches provide remarkable inspiration for any-
one aspiring to do develop newer approaches to investigate cellular behaviors and de-
velop more efficient biosensing methods. I took great inspiration from such techniques
and started working on developing drug and siRNA delivery systems using novel nano-
materials. My aim was to develop new approaches for regulating stem cell differentia-
tion. The approaches I developed over the course of my doctoral work could be applied
to any adult stem cell line, but I chose to specifically work with neural stem cells (NSCs)
as a resource for obtaining neurons. The regenerative capability of the damaged neurons
in the central nervous system, which includes the brain and the spinal cord, is extremely
slow and scarce. Utilizing NSCs as a resource is an excellent opportunity to further
advance the field of regenerative medicine. However, to make this process of differen-
tiation of NSCs into neurons more efficient, I developed novel nanotechnology-based
approaches.
We started with using quatum dots (QDs) to deliver siRNA into human brain tumor
cells, with the hopes of optimizing a siRNA deliver system into a mammalian brain
tumor cell line. We were quite successful at developing a delivery system which not
only enabled us to deliver the siRNA into the brain tumor cells, but also allowed us
to track the delivery. We were able to inhibit the proliferation of the brain tumor
cells using a specifically designed siRNA against a mutant gene. Overall the project
provided inspiration to further develop such a system for controlling the differentiation
of stem cells. For the next project, we developed a siRNA delivery system called
DexAM, which is a dendritic polyamine conjugated to a cyclodextrin molecule. The
cyclodextrin (CD) molecule was used to encapsulate hydrophobic small molecules which
are typically delivered using toxic solvents such as DMSO and DMF. The polyamine
backbone was used to complex with siRNA. We used DexAM to deliver siRNA against
SOX9, the inhibition of which led to enhanced neuronal differentiation. We further
enhanced the neuronal differentiation by co-delivering retinoic acid encapsulated within
the CD. Retinoic acid is a well-known small molecule used for differentiating NSCs into

39
neurons.
Although DexAM provided good results for enhancing the differentiation of NSCs
into neurons, we wanted to develop a system wherein the delivery vehicle itself does
not enter the stem cells. We then developed NanoRU, which is a Nanotopography-
mediated Reverse Uptake platform for delivering siRNA into NSCs. NanoRU was
developed by making positively charged nanoparticle films on a glass substrate and
coating the films with ECM protein (laminin) and siRNA. The NSCs took up only
the siRNA and not the nanoparticles, which was remarkable. We optimized NanoRU
using siRNA against GFP and then used siRNA against SOX9 to enhance neuronal
differentiation. NanoRU was found to be extremely biocompatible allowing long term
cell growth and differentiation on the platform without having the need to remove the
cells from NanoRU. Furthermore, it was also used to deliver siRNA into normal cell
lines such as astrocytes, and breast and brain cancer cell lines.
In another project, I worked on developing a strategy for regulating NSC differenti-
ation into neurons without using any soluble cues such as small molecules and siRNA.
We wanted to differentiate the NSC using only the physical cues present within the mi-
croenvironment of the stem cells. For this reason, we generated ECM protein patterns
having different geometries and sizes. We then identified a specific geometry which gave
us the highest neuronal differentiation of NSCs into neurons. Grid patterns of laminin
provided the highest differentiation of NSCs into neurons. The NSCs differentiated
in the absence of soluble cues, by purely sensing the physical signals provided by the
protein patterns.
Lastly, we developed a strategy to include a novel nanomaterial into the ECM and
investigate its impact on neuronal differentiation. We used chemically-derived graphene
or graphene oxide (GO) as it offers a number of advantages due to its unique chemical
and physical structure. Its high surface area was extremely useful for adsorbing ECM
proteins for culturing stem cells. We observed that GO-coated glass substrates led to
significant alignment of axons from differentiating human NSCs (hNSCs). However,
when the hNSCs were differentiated on SiNP films, it led to an increase in the length of
the axons. We thus coated the SiNP films with GO (SiNP-GO) and that condition led to

40
increased alignment, increased lengths of axons and increased neuronal differentiation
of the hNSCs. We believe using graphene-based hybrid nanomaterials is significantly
advantageous as the material was also found to be very biocompatible, supporting the
growth and differentiation of hNSCs for over 3 weeks. We believe our work wherein
the differentiating hNSCs align and express higher neuronal markers will be significant
for spinal cord injuries where the main emphasis is on guiding the axonal growth to
connect the distal and proximal ends of damaged neurons.
We also developed new biosensors, using graphene and graphene oxide. These
biosensors were fabricated using traditional photolithography and had very good selec-
tivity and sensitivity for detecting breast cancer biomarkers such as HER2 and EGFR.
We also developed a sensor for detecting the enzyme carboxypeptidaseB, which is a
biomarker for acute pancreatitis. Our biosensors, developed using a combination of
graphene and nanoparticles, have contributed immensely to the new area of graphene-
based biosensing.
This dissertation provides the details of my work on all projects related to regener-
ative medicine and biosensing.

41
Chapter 2
Nanomaterials for siRNA Delivery into Neural Stem Cells
RNA interference (RNAi) technology, wherein the gene of interest is inhibited using
either small interfering RNA (siRNA), microRNA (miRNA) or small hairpin RNA
(shRNA). We have seen the use of siRNA for inhibiting the expression of specific genes
for inducing cell death of cancer cells. While this is very important, the use of siRNA
in stem cells for inhibiting specific genes in order to control their differentiation is also
important. However, the most challenging part is delivering the siRNA into the can-
cer/stem cells. Many nanomaterials have been used, which is evidenced by the abundant
literature available. In an effort to optimize siRNA delivery and track their location
within cells, we used quantum dots (QDs), which are highly fluorescent nanoparticles,
to deliver siRNA into brain tumor cells. In this chapter we will see how the QDs suc-
cessfully delivered the therapeutic siRNA into the brain tumor cells leading to their
apoptosis.
We then synthesized a cyclodextrin-polyamine construct (DexAM) having a highly
positively charged dendritic polyamine and a cylodextrin molecule conjugated to it.
The dendritic structure and its synthesis gave us a very good handle on controlling its
positive charge and the subsequent conjugations. The challenge to balance between
the cytotoxicity and efficiency of such delivery vehicles was achieved by conjugating a
cyclodextrin molecule. In this chapter we will see DexAM was used to simultaneously
deliver small molecules and siRNA into neural stem cells to enhance their neuronal
differentiation.

42
2.1 Selective Inhibition of Human Brain Tumor Cells through Multi-
functional Quantum-Dot-Based siRNA Delivery
2.1.1 Introduction
One of the most promising new chemotherapeutic strategies is the RNA interference
(RNAi)-based approach, wherein small double-stranded RNA molecules can sequence-
specifically inhibit the expression of targeted oncogenes [89, 90]. In principle, this
method has high specificity and broad applicability for chemotherapy. For example,
the small interfering RNA (siRNA) strategy enables manipulation of key oncogenes
that modulate signaling pathways and thereby regulate the behavior of malignant tu-
mor cells. To harness the full potential of this approach, the prime requirements are
to deliver the siRNA molecules with high selectivity and efficiency into tumor cells and
to monitor both siRNA delivery and the resulting knock-down effects at the single cell
level. Although several approaches such as polymer- and nanomaterial-based methods
have been attempted [91–94], limited success has been achieved for delivering siRNA
into the target tumor cells. Moreover, these types of approaches mainly focus on the
enhancement of transfection efficiency, knock-down of non-oncogenes (e.g. green fluo-
rescent protein (GFP)), and the use of different nanomaterials such as quantum dots
(QDs), iron oxide nanoparticles, and gold nanoparticles [95–100]. Therefore, to narrow
the gap between current nanomaterial-based siRNA delivery and chemotherapies, there
is a clear need to develop methods for target-oriented delivery of siRNA [101, 102], for
further monitoring the effects of siRNA-mediated target gene silencing via molecular
imaging probes [96], and for investigating the corresponding up/down regulation of
signaling cascades [103]. Perhaps most importantly, to begin the development of the
necessary treatment modalities, the nanomaterial-based siRNA delivery strategies must
be demonstrated on oncogenes involved in cancer pathogenesis.
Herein, we describe the synthesis and target-specific delivery of multifunctional
siRNA-QD constructs for selectively inhibiting the expression of epidermal growth
factor receptor variant III (EGFRvIII) in target human U87 glioblastoma cells, and

43
subsequently monitoring the resulting down-regulated signaling pathway with high ef-
ficiency [104].
2.1.2 Results and Discussion
Glioblastoma multiforme (GBM) is the most malignant, invasive, and difficult-to-treat
primary brain tumor. Successful treatment of GBM is rare with a mean survival of only
10-12 months [105, 106]. EGFRvIII, the key growth factor receptor triggering cancer
cell proliferation in many cancer diseases such as brain tumors and breast cancer, is
a constitutively active mutant of EGFR which is expressed in only human GBM and
several other malignant cancers, but not in normal healthy cells (Figure 2.1) [107,108].
We targeted EGFRvIII, since it has been known that knock-down of this gene is one of
the most effective ways to down-regulate the PI3K/Akt signaling pathway, a key signal
cascade for cancer cell proliferation and apoptosis [103, 109, 110]. Hence by targeting
EGFRvIII, our multi-functional nanoparticle-based siRNA delivery strategy could po-
tentially minimize the side effects caused by conventional chemotherapies, specifically
immune suppression, while significantly improving the efficacy of chemotherapy against
GBM.

44
Figure 2.1: siRNA-QDs for delivery and tracking. Quantum dots as a multi-functionalnanoplatform to deliver siRNA and to elucidate of EGFRvIII - knockdown effect ofPI3K signaling pathway in U87-EGFRvIII (A) Detailed structural information of mul-tifunctional siRNA-QDs. (C) Two different strategies for the siRNA-QD conjugate.(C1) Linker for attaching siRNA to QDs through a disulfide linkage which was easilyreduced within the cells to release the siRNA. (C2) Linker for covalently conjugatingsiRNA to QDs which enabled tracking of siRNA-QDs within the cells [111].
Multifunctional quantum-dots for delivery and tracking of siRNA
We prepared two types of siRNA-QD conjugates, one for siRNA delivery and the
other for siRNA tracking (Figure 2.1A and Figure 2.1B). Core-shell CdSe/CdS/ZnS
QDs with a 7 nm diameter were synthesized [112, 113]. The QDs were coated with
trioctyl-phosphine oxide (TOPO) or hexadecylamine (HDA). In order to make the QD
constructs water-soluble and suitable for conjugating with siRNA, we displaced these
hydrophobic ligands with a dihydrolipoic acid (DHLA) derivatized with an amine ter-
minated poly [ethylene glycol] (PEG) spacer. The expectation was that the dithiol

45
moiety would provide strong coordination to the QD surface and increase stability in
aqueous media, the PEG spacer would increase water solubility and reduce non-specific
binding, and the amine group would enable conjugation to the siRNA element [114,115].
Two bifunctional linkers were synthesized and evaluated for siRNA conjugation. Linker
C1, PTPPf [3-(2-pyridyl)-dithiopropionic acid pentafluorophenyl ester], was designed
to release siRNA upon cellular entry through cleavage of the disulfide linkage, through
enzymatic reduction or ligand-exchange (e.g. glutathione) [116–118]. Linker C2, MPPF
(3-maleimidopropionic acid pentafluorophenyl ester), was designed to be more robust,
thereby enabling evaluation of cellular uptake and localization of the siRNA construct
within the cellular compartments [119].
The final design component was to functionalize the construct for tumor cell-selective
transfection. For this purpose two functional peptides, thiol-modified RGD peptide and
thiol-modified HIV-Tat derived peptide, were attached to the siRNA-QDs via the con-
jugation methods described above. Brain tumor cells (U87 and U87-EGFRvIII) over-
express the integrin receptor protein αvβ3, which strongly binds to the RGD binding
domain [120]. RGD functionalized siRNA-QDs selectively accumulate in brain tumor
cells in vitro, and can be tracked by fluorescence microscopy [121]. In addition, the
HIV-Tat peptide enables efficient transfection of siRNA-QDs in cells when directly at-
tached to the QD surface [122, 123]. The density of siRNA on the QDs and the ratio
between siRNA strands and peptides were optimized for gene knockdown. It was found
that the density of 10 siRNAs/per nanoparticle and the ratio of 1:10 (siRNA: each pep-
tide) was in close agreement with literature values [8], and was optimal for knocking
down the target genes (EGFP and EGFRvIII) overexpressed in our U87 cell lines.
EGFP knockdown and target-specific intracellular delivery of siRNA-QDs
To optimize gene silencing with our siRNA-QD constructs and to assess the transfection
efficiency and RNA interference (RNAi) activity, we examined the suppression of EGFP
expressed in U87 cell lines that were genetically modified to express EGFP. Cytotoxicity
of the constructs was tested by serial dilution studies. The range of concentration
causing minimal/negligible cytotoxicity was identified and the subsequent experiments

46
employed the concentrations within this range Figure 2.2 [49,124].
Figure 2.2: Toxicity of QDs using MTS assay. Most of U87 cells were found to be viableacross the concentration range of QDs. The QDs tested within the above range werefound to be non-cytotoxic and all knockdown experiments were conducted within the50 nM range. [111]
Importantly, the EGFP cell line has been widely used to investigate siRNA-based
silencing of EGFP, since the suppression of EGFP expression does not compromise
cell viability. The transfection efficiency of three different kinds of constructs were
evaluated; constructs modified with the RGD peptide only, those modified with the
HIV-Tat peptide only, and those with both HIV-Tat and RGD peptide. Although
the siRNA-QDs modified with only RGD showed considerable selective internalization
within U87-EGFP cells, siRNA-QDs modified with a combination of RGD and HIV-Tat
peptides (the ratio of siRNA: RGD: HIV-Tat being 1:10:10 per QD) showed maximum
internalization within U87-EGFP cells, in close agreement with previous studies [8].
This optimal condition was used for subsequent siRNA-QD experiments.
The U87-EGFP cell line was then treated with siRNA-QDs (siRNA:QDs = 0.12
µM:0.11 µM), modified with HIV-Tat [ 1.2 µM] and RGD [ 1.2 µM], and simultaneously

47
imaged using fluorescence microscopy (Figure 2.3). Cationic lipids (X-tremeGENE,
Roche) were used to further enhance cellular uptake and prevent degradation of the
siRNA within the endosomal compartment of the cells. The siRNA-QDs showed signif-
icant internalization into the cells. Knockdown of the EGFP signal was observed after
48-72 hrs (Figure 2.3B). Fluorescence intensity was influenced by other factors such as
exposure time, media condition, and cell shrinkage. To minimize the influence from
these external factors, the control U87-EGFP cells (without siRNA) were trypsinized
and co-cultured with U87-EGFP cells transfected with siRNA-QDs in the same well.
The U87 cells containing siRNA-QDs were easily distinguishable from the control cells
due to the bright fluorescent property of the QDs (Figure 2.3C2). Cells with internal-
ized siRNA-QDs showed considerable knockdown of the EGFP protein when compared
with the surrounding control U87-EGFP cells (Figure 2.3C).
To further demonstrate the target-specific delivery of the siRNA-QDs, we incubated
the siRNA-QDs modified with Tat and RGD against EGFP in co-cultures of the U87-
EGFP cell line with other less-tumorigenic cell lines, such as PC-12 and SK-N-BE(2)C
(Figure 2.4), having a considerably small number of integrin receptors [125–127]
Figure 2.4: Targeted delivery of multifunctional siRNA-QDs. The multifunctionalsiRNA-QDs (red), when incubated in a co-culture of malignant tumor cells (U87-EGFP)and less tumorigenic cells (SK-N-BE(2)C, PC-12), selectively transfected the U87 cells.Very few siRNA-QDs internalized within the less tumorigenic cells [111]. (Scale bar:50 µm)
The presence of RGD tripeptide molecules on the surface of the siRNA-QDs led
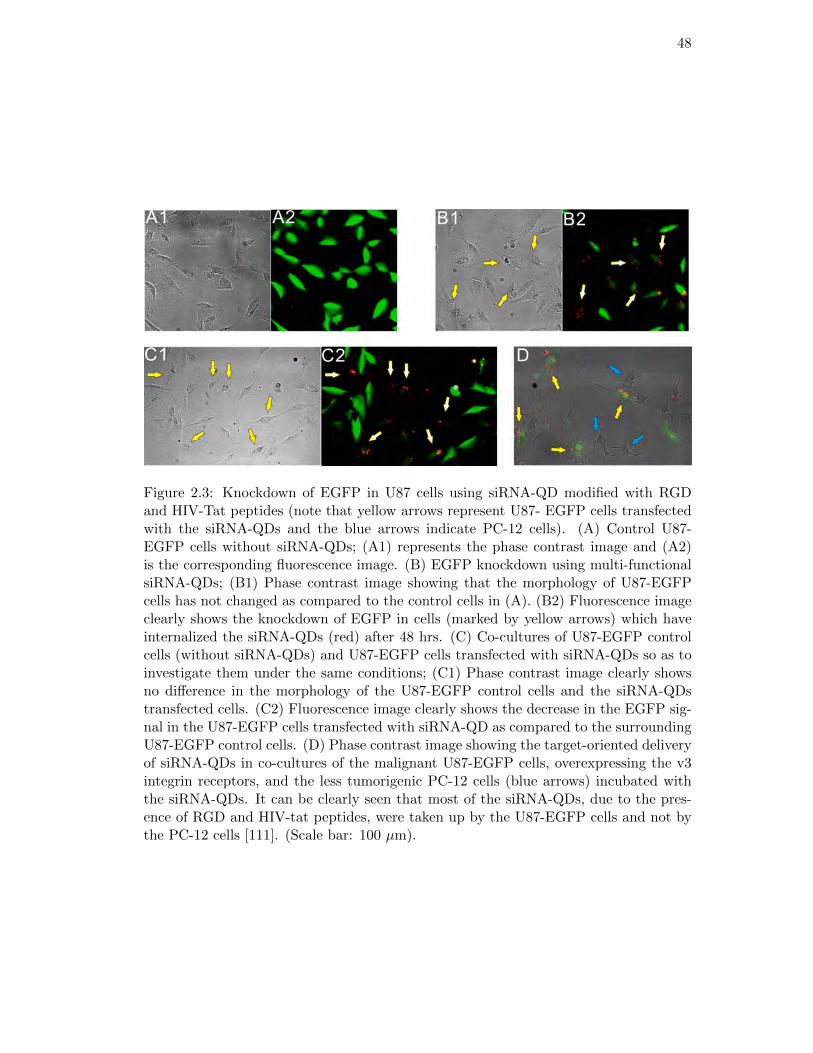
48
Figure 2.3: Knockdown of EGFP in U87 cells using siRNA-QD modified with RGDand HIV-Tat peptides (note that yellow arrows represent U87- EGFP cells transfectedwith the siRNA-QDs and the blue arrows indicate PC-12 cells). (A) Control U87-EGFP cells without siRNA-QDs; (A1) represents the phase contrast image and (A2)is the corresponding fluorescence image. (B) EGFP knockdown using multi-functionalsiRNA-QDs; (B1) Phase contrast image showing that the morphology of U87-EGFPcells has not changed as compared to the control cells in (A). (B2) Fluorescence imageclearly shows the knockdown of EGFP in cells (marked by yellow arrows) which haveinternalized the siRNA-QDs (red) after 48 hrs. (C) Co-cultures of U87-EGFP controlcells (without siRNA-QDs) and U87-EGFP cells transfected with siRNA-QDs so as toinvestigate them under the same conditions; (C1) Phase contrast image clearly showsno difference in the morphology of the U87-EGFP control cells and the siRNA-QDstransfected cells. (C2) Fluorescence image clearly shows the decrease in the EGFP sig-nal in the U87-EGFP cells transfected with siRNA-QD as compared to the surroundingU87-EGFP control cells. (D) Phase contrast image showing the target-oriented deliveryof siRNA-QDs in co-cultures of the malignant U87-EGFP cells, overexpressing the v3integrin receptors, and the less tumorigenic PC-12 cells (blue arrows) incubated withthe siRNA-QDs. It can be clearly seen that most of the siRNA-QDs, due to the pres-ence of RGD and HIV-tat peptides, were taken up by the U87-EGFP cells and not bythe PC-12 cells [111]. (Scale bar: 100 µm).

49
to specific binding with integrin receptors overexpressed in the U87 cells, resulting in
higher cellular uptake by the malignant U87 cells as compared to the less tumorigenic
PC-12 cells as seen by the selective accumulation of the QDs within the U87-EGFP cells
(Figure 2.4D). These results confirmed our hypothesis that the target-specific delivery of
the siRNA-QDs into brain cancer cells can be significantly enhanced by functionalizing
the QDs with targeting moieties like RGD tripeptide.
The intracellular delivery of the siRNA-QDs within the U87-EGFP cells was also
confirmed by transmission electron microscopy (TEM), which clearly shows the presence
of QDs in the cytoplasm of the cells (Figure 2.5A).
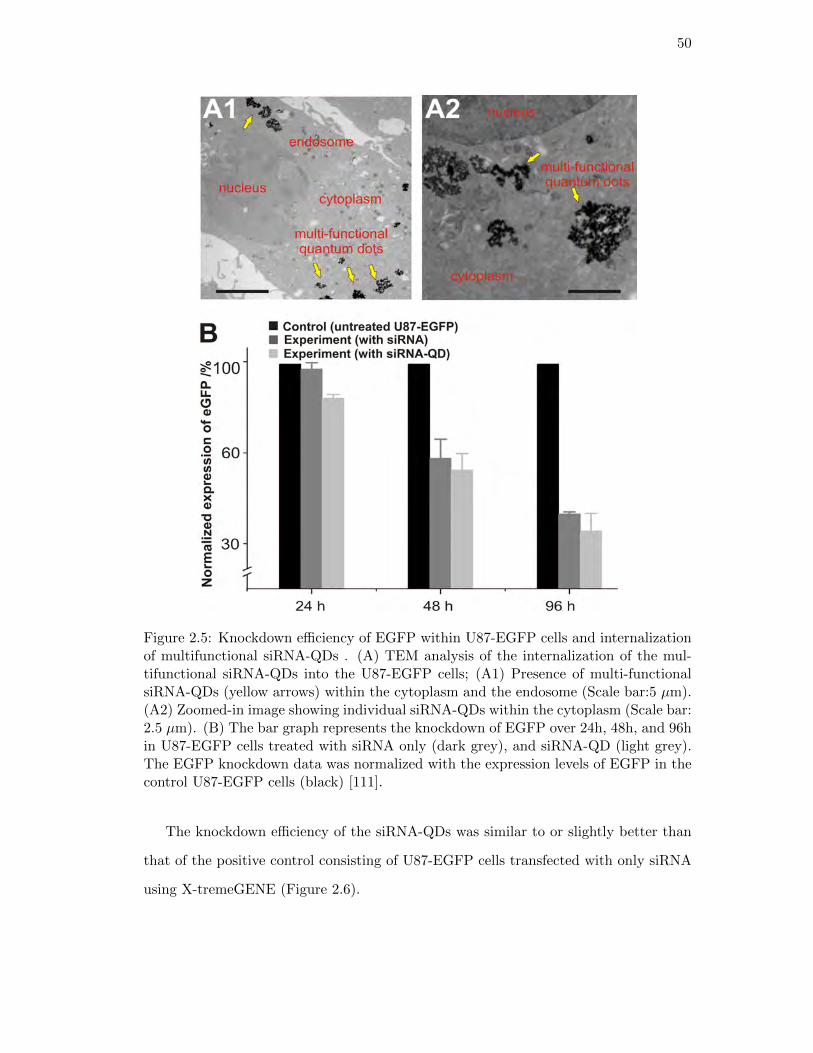
50
Figure 2.5: Knockdown efficiency of EGFP within U87-EGFP cells and internalizationof multifunctional siRNA-QDs . (A) TEM analysis of the internalization of the mul-tifunctional siRNA-QDs into the U87-EGFP cells; (A1) Presence of multi-functionalsiRNA-QDs (yellow arrows) within the cytoplasm and the endosome (Scale bar:5 µm).(A2) Zoomed-in image showing individual siRNA-QDs within the cytoplasm (Scale bar:2.5 µm). (B) The bar graph represents the knockdown of EGFP over 24h, 48h, and 96hin U87-EGFP cells treated with siRNA only (dark grey), and siRNA-QD (light grey).The EGFP knockdown data was normalized with the expression levels of EGFP in thecontrol U87-EGFP cells (black) [111].
The knockdown efficiency of the siRNA-QDs was similar to or slightly better than
that of the positive control consisting of U87-EGFP cells transfected with only siRNA
using X-tremeGENE (Figure 2.6).

51
Figure 2.6: EGFP knockdown using siRNA (without QDs) and siRNA-QDs. Theknockdown efficiency of siRNA-QD (red) against EGFP was slightly better or compa-rable to the knockdown efficiency of naked siRNA [111] (Scale bar = 100 µm).
This high transfection efficiency appears to be due to synergistic effects of the two
transfection peptides. Decrease in fluorescence intensities (EGFP signal, green fluores-
cence) within cells treated with the above mentioned systems were then compared with
the intensity of U87-EGFP without siRNA. As shown in Figure 2.5B, the decrease in
fluorescence intensity of U87-EGFP incubated with siRNA-QDs and siRNA alone was
comparable, but drastically lower than that observed for the control without siRNA.
Cells with internalized siRNA-QDs show decreased green fluorescence (EGFP signal)
when compared with the control. This data strongly suggests that siRNA-QDs can be
simultaneously used as delivery and imaging probes.
Knockdown of EGFRvIII as a chemotherapeutic target by siRNA-QDs
Having demonstrated the selective manipulation of the U87-EGFP cell line, we then fo-
cused on the knockdown of EGFRvIII with our siRNA-QD constructs. U87-EGFRvIII
cells were genetically modified to overexpress EGFRvIII, a mutant-type epidermal
growth factor receptor (EGFR) only expressed within cancer cells [128]. This cell
type was incubated with our siRNA-QDs modified with Tat and RGD peptides and

52
armed with EGFRvIII-targeting siRNA. The cells were simultaneously imaged for the
internalization of siRNA-QDs using fluorescence microscopy.
Significant cell death was observed in the wells loaded with siRNA-QDs against
EGFRvIII after 48h (Figure 2.7A). Quantitative analysis revealed that the number of
viable U87-EGFRvIII cells, as observed via fluorescence microscopy, decreased with
increased incubation time. When compared with the control (U87-EGFRvIII without
siRNA-QDs), there was a significant decrease in the number of viable cells, thus demon-
strating the effectiveness of our nanoparticle-based siRNA delivery to knock-down the
oncogene. The result was confirmed using the MTT assay which showed a decrease in
the number of viable cells in the well incubated with siRNA-QDs against EGFRvIII
(Figure 2.7B). This assay further confirmed that the QDs themselves were noncyto-
toxic when used alone as they did not result in any appreciable cell death (Figure
2.2). The knockdown of EGFRvIII and the inhibition of the downstream proteins in
the PI3K signaling pathway were confirmed using Western Immunoblotting. The re-
sults (Figure 2.7C) confirm a considerable decrease in the expression of EGFRvIII, and
down-regulation of phospho-Akt and phospho-S6 as compared to the control. Thus,
these results demonstrate the specificity of the siRNA against EGFRvIII, the inherent
noncytotoxicity of the QDs, and the facile evaluation and manipulation of cancer cell
proliferation with multifunctional-QD constructs.

53
Figure 2.7: Knockdown of EGFRvIII in U87 EGFRvIII using multifunctional siRNA-QDs (A) Phase contrast images showing the internalization of siRNA-QDs into theU87-EGFRvIII cells. (A1) Morphology of U87-EGFRvIII cells before incubation withsiRNA-QDs on Day 0. (A2) U87-EGFRvIII cells after incubation with siRNA-QDs(red) on Day 0. (A3) Morphology of U87-EGFRvIII 48hrs after incubation with siRNA-QDs. Note that effect of the EGFRvIII knockdown by the siRNA-QDs can be clearlyseen as they have clearly shrunk (yellow arrows) and look collapsed as compared to Day0, marking the onset of apoptosis (Scale bar = 100 µm). (B) Cell viability assay usingMTT assay. (B1) Optical image of cell viability (MTT) assay in a well plate. Darkblue color represents high number of viable cells and pale blue indicates low viable cellpopulation. (B2) MTT assayed wells were quantified with UV absorbance and con-verted to cell viability. Untreated control C1 and C2 represent control cell populationand viable cell population in presence of a cationic lipid based transfection reagent re-spectively. siRNA-QD transfected cells in experiment E1 and siRNA treated cells in E2show low numbers of the viable cells due to knockdown of EGFRvIII gene. (C) WesternImmunoblotting to show silencing effect of EGFRvIII gene. Protein expression levelof EGFRvIII is dramatically decreased, and phosphorylation levels of key proteins inPI3K signaling pathway are reduced significantly. The upstream protein (AKT) andthe downstream protein (S6), which play an important role in cell proliferation areselected to investigate the gene-knockdown effect on the PI3K signaling pathway [111].
54
2.1.3 Conclusions
In summary, this work is a demonstration of the multi-functional siRNA-QD strat-
egy focusing on targeted delivery, high transfection efficiency, and multi-modal imag-
ing/tracking. Our siRNA-QDs could be used for the development of novel chemothera-
pies and diagnostics relevant to brain cancer research. These novel methods and applica-
tions complement recent advances in nanomaterial-based siRNA delivery, nanomaterial-
based molecular imaging, as well as siRNA-based chemotherapeutic strategies reported
recently. While the ability to functionalize as well as control the surface of quantum
dots with specific linkers and multi-functional molecules (siRNA and peptides) is crit-
ical for nanoparticle-based drug delivery, this method could also provide highly useful
information regarding bio-surface chemistry of nanomaterials. In addition, the appli-
cation of multi-functional siRNA-QDs to modulate the key cancer signaling pathways
is important not only for selective chemotherapeutic strategy but also for dissecting
signaling cascades triggered by inhibiting specific proteins. Collectively, our multi-
functional QD-based siRNA delivery strategy has significant potential for simultaneous
prognosis, diagnosis, and therapy.
2.1.4 Materials and Methods
Starting materials, reagents, and solvents were purchased from commercial suppliers
(Aldrich, Acros, Lancaster, and Fisher) and used as received unless otherwise noted.
All reactions were conducted in flame-dried glassware with magnetic stirring under an
atmosphere of dry nitrogen. Reaction progress was monitored by analytical thin layer
chromatography (TLC), using 250 µm silica gel plates (Dynamic Absorbents F-254).
Visualization was accomplished with UV light and potassium permanganate stain, fol-
lowed by heating. Proton nuclear magnetic resonance (1H NMR) spectra were recorded
on either a Varian-300 instrument (300 MHz), Varian-400 instrument (400 MHz), or a
Varian-500 instrument (500 MHz). Chemical shifts of new compounds are reported in
ppm relative to tetramethylsilane (TMS) as the internal standard. Data are reported
as follows: chemical shift, integration, multiplicity (s=singlet, d=doublet, t=triplet,

55
q=quartet, br=broad, m=multiplet), and coupling constants (Hz). Carbon nuclear
magnetic resonance (13C NMR) spectra were recorded on either a Varian-300 instru-
ment (75 MHz), Varian-400 instrument (100 MHz), or a Varian-500 instrument (125
MHz). Chemical shifts of new compounds are reported in ppm relative to tetram-
ethylsilane (TMS) as the internal standard. Mass spectra were recorded on a Finnigan
LCQ-DUO mass spectrometer.
Synthesis of the Core-Shell QDs
CdSe/CdS/ZnS core-shell QDs (7nm) were synthesized using well established protocols
from the literature [112,113]. The QDs were then characterized for size and distribution
using a transmission electron microscope (TEM). The spectroscopic properties of the
QDs were characterized using a fluorometer (FluoroMax-3, HORIBA Scientific).
Synthesis of QD conjugates with siRNA
The siRNA molecules for EGFP and EGFRvIII containing 5-thiol group were purchased
from Dharmacon and Invitrogen respectively. The siRNA for EGFP was designed as
follows; Sense sequence was 5-thiol-GGCUACGUCCAGGAGCGCACC and antisense
sequence was 5-phosphate-UGCGCUCCUGGACGUAGCCUU. For the knockdown of
EGFRvIII, 5-thiol-GAAAGGUAAUUAUGUGGUGdTdT (sense) and 5-phosphate-CA-
CCACAUAAUUACCUUUCdTdT (antisense) were used. QDs in PBS were mixed with
1000 fold excess of the cross linker, MPPf (3-maleimidopropionic acid pentafluorophenyl
ester) and PTPPf [3-(2-pyridyl)-dithiopropionic acid pentafluorophenyl ester], for one
hour. After removing the unreacted linkers by ultracentrifugation, siRNA molecules
were coupled to QDs by mixing together for one hour. After the conjugation, free
siRNA was removed using ultracentrifugation. For the quantification of ratio of QD
and siRNA, the siRNA linked to QDs via PTPPf (disulfide bond) were treated with
DTT for one hour. After centrifugation, the supernatant was analyzed under UV at 260
nm quantifying the siRNA detached from QDs. By determining the concentration of
QDs in the same volume at the first absorption peak, the siRNA molecules per QD were
estimated. For the conjugation of HIV-Tat(CYGRKKRRQRRR) and RGD(RGDC) to

56
siRNA-QDs, the same method as that used to conjugate siRNA to QD was used with
the ratio of 1:10:10 (siRNA:RGD:HIV-Tat).
Cell Culture of U87-EGFP and U87-EGFRVIII
Cells were cultured in the following growth media: DMEM (Dulbeccos modified Ea-
gles medium) with high glucose (Invitrogen), 10 % Fetal Bovine Serum (FBS), 1 %
streptomycin-penicillin, 1% glutamax (Invitrogen), and selection markers, G418 (100
µg/ml) and hygromycin B (30 µg/ml) for U87-EGFP and U87-EGFRvIII respectively.
For the knockdown experiment, passaged cells were prepared to 40-60 % confluency
in 96-well plates. For the knockdown experiment and cell viability assay, media was
exchanged with serum-free basal media (150 µl) and siRNA-QDs solution (30 µl) with
the cationic lipid based transfection reagent, X-tremeGENE (0.4 µl, Roche), was added
after 20-30 minutes. After incubation for 12 hours, media was exchanged with normal
media. Fluorescence measurement and cellular assays were performed after 48-96 hours
from the starting point. Once intensity of EGFP was decreased, it was trypsinized and
co-cultured with control U87-EGFP (1:1 ratio) in 48-well plates for direct comparison of
knockdown level. Cells were washed with DPBS and fixed with 2-4 % paraformaldehyde
solution for long term storage at 4◦C.
Targeted delivery of siRNA-QDs
U87-EGFP cells were co-cultured with control cells (or control neuroblastomas or neu-
roendocrine tumor), which are PC12 and SK-N-BE(2)C. Each control cell was passaged
in 96 well plates, and 6 - 8 hours later U87-EGFP cells were co-cultured. Cell culture
media for PC12 and U87 well plate was a mixture of DMEM, 10% horse serum, 5%FBS,
and 1% streptomycin-penicillin. For U87 cells, DMEM, 10% FBS, and 1% streptomycin-
penicillin was used as a culture media. F12 and MEM mixture (1:1), 10% FBS, and
1% streptomycin-penicillin were used to prepare the media for SK-N-BE(2)C. For the
delivery of HIV-tat and RGD peptide conjugated siRNA-QDs, media was exchanged
with serum free DMEM or Opti-MEM media. After adding the QD solution, the cells
were incubated for 6 - 8 hrs. The media was removed and washed with serum free

57
media. Fluorescence images were taken after replacing the media with regular media.
Transmission electron microscopy and fluorescence microscopy
U87-EGFP transfected with siRNA-QDs samples were prepared using the Spurrs kit
(EMS, Hatfield, PA). The images were obtained using the TEM (JEOL 100CX TEM).
Cells in well plates were washed with DMEM and refilled with normal media. For
the fluorescence, DIC, and phase contrast images were obtained using the Zeiss Axio
observer inverted epifluorescence microscope. Each image was captured with different
channels and focus. Images were processed and overlapped using Image-Pro (Media-
Cybernetics) and ImageJ (NIH).
Cell viability assay
Cell viability assays were performed using MTT and MTS by following the standard
protocols provided by company (Molecular Probes, Invitrogen).
Western blot analysis
Cells were lysed with RIPA buffer (Thermo scientific, Rockford, IL) with protease in-
hibitor cocktail (Sigma-Aldrich) and phosphates inhibitor cocktail I, II (Sigma-Aldrich).
After centrifugation, cell lysates were assayed for protein concentration using the Bio-
Rad protein assay kit (Bio-Rad, Hercules, CA). Proteins (20 µg) were separated in
10% SDS polyacrylamide gels by electrophoresis, then transferred to a nitrocellulose
membrane and subjected to immunoblotting. The following primary antibodies were
used; polyclonal rabbit anti-human EGFRvIII (Spring Bioscience, Pleasanton, CA),
polyclonal mouse anti-human EGFR (Santa Cruz Biotechnology, Santa Cruz, CA),
monoclonal mouse anti-human S6 (Santa Cruz Biotechnology) and monoclonal mouse
anti-human phospho-S6 (Ser235/236) (Santa Cruz Biotechnology). Horse radish per-
oxidase (HRP)-conjugated polyclonal anti-mouse IgG and anti-rabbit IgG were used
as the secondary antibodies. Immunoreactive bands were detected with the enhanced
chemiluminescence (ECL) kit (GE Healthcare, Piscataway, NJ).

58
2.2 Simultaneous Delivery of siRNA and Small Molecule Using Polyamine-
Cyclodextrins to Enhance Neuronal Differentiation of Neural Stem
Cells
2.2.1 Introduction
Stem cells are becoming increasingly attractive as treatment options for regenerative
medicine due their ability to differentiate into specialized cells of interest. However,
achieving a controlled and reproducible means to direct stem cell differentiation is
the single most critical concern scientists have been trying to address ever since the
discovery of stem cells. In this regard, a chemical approach has been widely applied
wherein small molecules are used to modulate specific signaling cascades and in turn
gene expression within the cell. For instance, novel small molecules have been screened
and identified that can control a variety of stem cell fates and functions including
stem cell maintenance, differentiation and reprogramming [9, 129–132]. Examples of
small molecules that have been used to modulate stem cell phenotypes include retinoic
acid, cytidine analogues, histone-deacetylase inhibitors and protein kinase inhibitors
[129]. To this end, the use of small molecules to alter stem cell behavior is particularly
advantageous since they provide a high degree of temporal control over protein function
by either rapid inhibition or activation of single or multiple targets within a protein
family [130]. Nevertheless, a majority of the small molecules used for such studies tend
to be very hydrophobic and lack solubility in physiological solutions, which can greatly
impair its delivery and efficacy [133]. As a result, organic solvents such as dimethyl
sulfoxide (DMSO) are often used to dissolve such compounds [134]. However, these
solvents tend to be cytotoxic and require careful dilution to avoid stem cell death and
undesired side-effects [135].
In contrast to the chemical approach, a more delicate control of gene expression has
been demonstrated using RNA interference (RNAi) [90]. RNAi is a post-transcriptional
process that involves using short double-stranded RNA molecules (small interfering
RNA [siRNA], small hairpin RNA [shRNA] or miRNA) to selectively silence a gene of
interest by destroying the target mRNA [136]. Similar to the use of small molecule

59
drugs in chemotherapies, RNAi has been widely used for treating genetic diseases and
cancers [111, 137]. However, many studies in the last decade have demonstrated this
strategy to be equally important for directing stem cell differentiation [138–140]. For
example, the application of siRNA to promote differentiation was first established by
inducing myogenesis of pluripotent P19 teratocarcinoma cells [141]. Thereafter, another
group went on to demonstrate that the knockdown of p53 in ESCs under retinoic acid in-
duction promoted their differentiation into muscle cells [142]. While RNAi shows great
potential for directing stem cell differentiation, a major challenge for achieving efficient
gene knockdown is the robust and reliable intracellular delivery of siRNA molecules
into stem cells [143–145]. The negatively charged backbone of siRNA molecules makes
it difficult to penetrate the cellular membrane, often requiring a biocompatible exoge-
nous vehicle to facilitate the delivery [146]. Moreover, the stem cells are sensitive to
exogenous treatments and must typically maintain high cellular viability over an ex-
tended time period after transfections to ensure the differentiated cellular sub-types
can be effectively used for further studies (e.g. in vivo transplantation, animal studies,
etc) [147,148].
Both chemical (via small molecules) and genetic (via RNAi) treatments offer unique
advantages in their own regard, with varying mechanisms of action targeting different
proteins and biomolecules within the stem cell. Therefore, we believe that the simul-
taneous delivery of these two molecules (siRNA and small molecules) can provide an
enhanced stem cell differentiation outcome compared to either treatment alone. Yet,
the common challenge in applying both approaches for controlling stem cell differenti-
ation is the efficient, non-toxic and reliable delivery to the target stem cell. Based on
these concerns, there is a need for single delivery platform which provides: i) minimal
cytotoxicity, ii) high transfection efficiency and iii) the ability to simultaneously deliver
nucleic acids and small organic molecules to achieve a synergistic enhancement in stem
cell differentiation. Herein, we demonstrate the synthesis and application of a multi-
functional vehicle for the simultaneous delivery of siRNA molecules and small organic
molecules to direct the differentiation of a multipotent adult stem cell line (Figure 2.8).

60
Figure 2.8: Schematic diagram showing the application of DexAM for stem cells.(A) DexAM molecule is complexed with siRNA via electrostatic interactions withthe polyamine backbone and the small molecule via encapsulation within the β-cyclodextrin. (B) DexAM constructs are delivered to neural stem cells (NSCs) toenhance their differentiation into neurons.
2.2.2 Results and Discussion
In order to achieve the dual delivery of these molecules, the delivery platform (termed
DexAM) consists of a dendritic polyamine linked with β-cyclodextrins (β-CD). In this
way, the positively-charged polyamine backbone was used to complex the negatively-
charged siRNA molecules, while the β-CD increased the solubility of the hydrophobic
small molecule by encapsulation in the inner cavity. As a proof-of-concept, we first
assessed the efficiency of RNAi by examining the suppression of green fluorescent pro-
tein (GFP) in NSCs that were genetically modified to express GFP. Based on the GFP
knockdown studies, we then used the optimized conditions to simultaneously deliver
a specific siRNA and small molecule to enhance the differentiation of NSC to a neu-
ronal cell fate. In particular, the siRNA selected to silence the expression of the neural
switch gene was SOX9, and the small molecule used was the well-known neurogenesis-
promoting vitamin A derivative, retinoic acid (RA). The simultaneous delivery of SOX9
siRNA and RA was found to greatly enhance neuronal differentiation, compared to dif-
ferentiation incurred by either molecule individually. By maintaining minimal cytotox-
icity with high delivery efficiency of multiple molecules of interest, our study provides
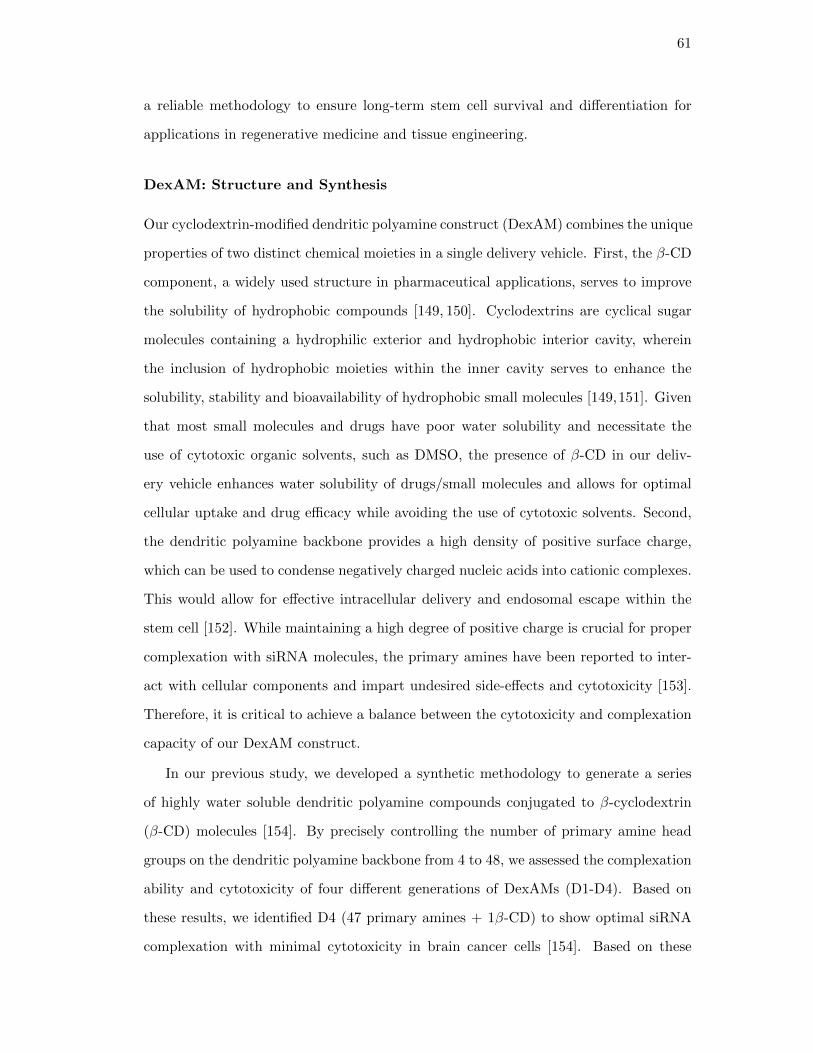
61
a reliable methodology to ensure long-term stem cell survival and differentiation for
applications in regenerative medicine and tissue engineering.
DexAM: Structure and Synthesis
Our cyclodextrin-modified dendritic polyamine construct (DexAM) combines the unique
properties of two distinct chemical moieties in a single delivery vehicle. First, the β-CD
component, a widely used structure in pharmaceutical applications, serves to improve
the solubility of hydrophobic compounds [149, 150]. Cyclodextrins are cyclical sugar
molecules containing a hydrophilic exterior and hydrophobic interior cavity, wherein
the inclusion of hydrophobic moieties within the inner cavity serves to enhance the
solubility, stability and bioavailability of hydrophobic small molecules [149,151]. Given
that most small molecules and drugs have poor water solubility and necessitate the
use of cytotoxic organic solvents, such as DMSO, the presence of β-CD in our deliv-
ery vehicle enhances water solubility of drugs/small molecules and allows for optimal
cellular uptake and drug efficacy while avoiding the use of cytotoxic solvents. Second,
the dendritic polyamine backbone provides a high density of positive surface charge,
which can be used to condense negatively charged nucleic acids into cationic complexes.
This would allow for effective intracellular delivery and endosomal escape within the
stem cell [152]. While maintaining a high degree of positive charge is crucial for proper
complexation with siRNA molecules, the primary amines have been reported to inter-
act with cellular components and impart undesired side-effects and cytotoxicity [153].
Therefore, it is critical to achieve a balance between the cytotoxicity and complexation
capacity of our DexAM construct.
In our previous study, we developed a synthetic methodology to generate a series
of highly water soluble dendritic polyamine compounds conjugated to β-cyclodextrin
(β-CD) molecules [154]. By precisely controlling the number of primary amine head
groups on the dendritic polyamine backbone from 4 to 48, we assessed the complexation
ability and cytotoxicity of four different generations of DexAMs (D1-D4). Based on
these results, we identified D4 (47 primary amines + 1β-CD) to show optimal siRNA
complexation with minimal cytotoxicity in brain cancer cells [154]. Based on these

62
observations, we utilized D4 in the current study (herein referred to as DexAM) to
facilitate the dual delivery of siRNA and small molecules for directing the differentiation
of neural stem cells (NSCs) into neurons.
The DexAM molecule was synthesized by using a multistep solution-phase and
solid-phase synthesis (see Materials and Methods in the above subsection). Briefly,
the dendritic polyamine backbone was synthesized by the Michael addition of tris(2-
aminoethyl)amine and methyl acrylate, followed by amidation of the amino esters gen-
erated after Michael addition (Figure 2.9). Thereafter, this synthetic route (Michael
addition followed by amidation) was repeated to yield a polyamine backbone consist-
ing of 48 primary amines. The conjugation of β-CD to the polyamine backbone was
performed by the tosylation of β-CD, followed by nucleophilic addition to the amine
group. This yielded our final DexAM molecule, which we used for the simultaneous
delivery of siRNA and small molecules to NSCs.
Figure 2.9: General Scheme for the Synthesis of DexAM. The polyamine backbone isinitially synthesized by the iterative Michael addition of tris(2-aminoethyl)amine andmethyl acrylate, followed by amidation. Tosylated β-cyclodextrin is then used to formthe final DexAM molecule.

63
GFP knockdown efficiency of DexAM
The optimization of gene silencing with our DexAM construct and assessment of knock-
down efficiency was first performed by measuring the suppression of green florescent
protein (GFP) in NSCs, which were genetically modified to constitutively express GFP.
Prior to transfection, we assessed the capability of DexAM to spontaneously form com-
plexes with the negatively charged siRNA. Using a well-established dye exclusion assay
(Picogreen Assay), we identified a range of DexAM concentrations which showed about
75% of the siRNA binding to the DexAM molecule (Figure 2.10).
Figure 2.10: siRNA complexation efficiency of DexAM measured by Picogreen dyeexclusion assay (Absorption = 480 nm, Emission = 520 nm).
Thereafter, varying concentrations of the DexAM molecule was mixed with a given
amount of GFP siRNA (100 pmol) to form the DexAM-siRNA complexes. The zeta
potential of the resulting complexes were found to be in the range of 10-12 mV at pH 7.4,
while exhibiting hydrodynamic diameters of 300 to 350 nm [154]. In order to visualize
the efficiency of delivery, the DexAM molecule was conjugated with a fluorescent dye
(AlexaFluor R© 594) prior to complexation with the GFP siRNA. The decrease in green

64
fluorescence intensity was monitored using florescence microscopy over a time period
of 48-96 h (Figure 2.11A). Successful transfection of the DexAM-siRNA constructs was
evident as visualized by the presence of the dye fluorescence expression (conjugated
to DexAM) in the NSCs (Figure 2.11C). We observed a dose-dependent knockdown of
GFP expression, wherein the NSCs treated with 75 µM DexAM (complexed with GFP
siRNA) showed a significant 80% knockdown in GFP intensity after 96 hours of siRNA
treatment compared to the untreated control cells (Figure 2.11B).
Figure 2.11: Delivery of DexAM-siRNA for GFP Knockdown in NSCs. (A) Schemedepicting the delivery of DexAM complexed with siRNA targeting GFP to NSCs. (B)Quantitative comparison of the percentage of GFP knockdown in NSCs with varyingconcentrations of DexAM at 4 d. (C) Fluorescence images of cell with varying concen-trations of DexAM showing GFP expression (green) and dye-labeled DexAM (red) at4 d. Scale bars: 20 µm.

65
DexAM is non-cytotoxic and biocompatible
While we achieved a remarkable knockdown efficiency with the DexAM-siRNA con-
structs, maintaining high cellular viability was equally important. Evaluating the cy-
totoxicity of the DexAM molecules is especially critical for applications in stem cell
biology, which generally require both longer time periods of culture (at least one week)
and differentiated sub-type specific cells that are functionally active for subsequent
in vitro and in vivo studies. We assessed the cytotoxicity of the DexAM molecules
using MTS assay, which confirmed that our delivery vehicle shows negligible toxicity
(Figure 2.12). While cationic polyamine-based polymers have been observed to show
dose-dependent cytotoxicity in mammalian cells, we believe the biocompatibility of our
DexAM constructs is due to the presence of CD, which can potentially reduce the non-
specific binding of the DexAM with cellular proteins and components [153,155–157].
Figure 2.12: DexAM cytotoxicity in NSCs. The percentage of viable cells was estimatedusing MTS assay following incubation of cells with the DexAM for 96 h. The data wasobtained as absorbance of water-soluble formazan at 490 nm, following incubation withonly DexAMs for 96 h. The fluorescence for treated samples was normalized to that ofuntreated controls.

66
Enhanced neuronal differentiation of NSCs using DexAM
The key advantage of our delivery platform is its versatility in delivering both nega-
tively charged nucleic acids (via complexation with the cationic polyamine backbone)
and hydrophobic small molecules (via complexation within the β-CD cavity). Hav-
ing demonstrated the efficient gene silencing capability of DexAM by delivering siRNA
against GFP, we focused on using our delivery vehicle for codelivering siRNA and small
molecules to enhance the neuronal differentiation of NSCs. For the siRNA molecule,
we designed a sequence to knockdown a well-established transcription factor known as
SOX9, which acts as a switch between neuronal and glial differentiation [158]. When
the SOX9 gene is turned on, a higher percentage of NSCs differentiate into astrocytes
(glial cells), and when turned off, a higher percentage of NSCs differentiate into neu-
rons [145,158,159]. For the small molecule, we selected the well-established vitamin A
derivative all-trans retinoic acid (RA), which is known to play a crucial role in central
nervous system development [160]. RA functions by binding to RA receptors (RARs)
in the cellular nucleus to form a ligand-receptor complex, which in turn binds to RA
response elements to activate gene expression [161]. However, this activation first re-
quires the efficient intracellular delivery of RA into the cytoplasm, whereby the binding
of RA to cytoplasmic proteins facilitates the abovementioned downstream effects in the
nucleus. Previous studies have reported that the treatment of RA tends to upregu-
late the expression of a variety of neuronal genes in cultured stem cells [158, 162, 163].
Interestingly, exogenous expression of a SOX9 gene prior to the RA treatment was
found to actually counteract the neuronal-promoting effect caused by RA, by suppress-
ing neuronal gene expression [158]. SOX9 is thus known to actively induce glial traits
while simultaneously repressing neuronal traits [158,164]. The knockdown of SOX9 and
exposure to RA in NSCs has each individually been demonstrated to induce NSC dif-
ferentiation into neurons. However, given the two factors (RA and SOX9) have varying
mechanisms of action and target different signaling pathways in NSCs, we hypothesized
that the simultaneous suppression of SOX9 expression and treatment with RA could
greatly enhance the neuronal differentiation of NSCs.
67
To this end, we utilized our DexAM construct to facilitate the co-delivery of RA
and siRNA against SOX9 (termed siSOX9). RA has been used in previous studies
for inducing neuronal differentiation, but given that it is extremely hydrophobic, it
requires the use of toxic organic solvents like DMSO for delivery. For our studies,
RA was loaded within the β-CD cavity of DexAM under reflux conditions to obtain
highly water soluble complexes, thus evading the use toxic organic solvents. The RA-
loaded DexAM (2 µM) was complexed with the negatively charged siRNA (100 pmol;
as described earlier) to form the DexAM constructs containing the siSOX9 and RA in a
single delivery vehicle (Figure 2.13A). The NSCs were plated into culture plates at 0 d,
followed by transfection with the DexAM-SOX9-RA constructs at 1 d. To confirm our
hypothesis that the simultaneous delivery of siSOX9 and RA would enhance neuronal
differentiation, we also transfected NSCs with: 1) DexAM complexed with only siSOX9
(without RA), 2) DexAM complexed with RA (and Silencer R© negative control siRNA
to maintain the charge ratio), and 3) control (untreated) cells. At 7 d, we quantified
the extent of differentiation by immunostaining for neuronal (TuJ1) and glial (GFAP)
marker (Figure 2.13B-C)

68
Figure 2.13: NSC differentiation using DexAM constructs complexed with SOX9 siRNAand Retinoic Acid. (A) Scheme depicting the complexation to DexAM. (B) Quantitativecomparison of the percentage of cells expressing TuJ1 and GFAP at 6 d. Studentsunpaired t-test was used for evaluating the statistical significance for cells stained forTuJ1, compared to the RA-SOX9 treatment (* = P <0.001). (C) Fluorescence imagesof cells stained for the nucleus (blue), the neuronal marker TuJ1 (red, top row) and theastrocyte marker GFAP (green, bottom row) at 6 d. Scale bars: 20 µm.
The control (untreated) cells showed the majority of the NSCs differentiated into
glial cells (70%) versus neuronal cells (25%), which is an expected differentiation pat-
tern as observed previously [68]. Conditions containing only RA and only siSOX9
resulted in about a two-fold increase in neuronal differentiation compared to the con-
trol, showing about 49% and 53% of the cells expressing the neuronal marker TuJ1,
respectively (Figure 2.13B). Compared to each of the conditions described above, the
simultaneous delivery of RA and siSOX9 to the NSCs using our DexAM molecule re-
sulted in a remarkable increase in neuronal differentiation, wherein in about 71% of the
cells were expressing TuJ1 (Figure 2.13B). The enhanced neuronal differentiation using

69
the combined DexAM-RA-siSOX9 construct was found to be statistically significant,
confirming the synergistic effect of combining RA and siSOX9 for a single treatment to
control NSC behavior.
2.2.3 Conclusions
Overall, introduction of exogenous nucleic acids combined with small molecules into
stem cells represents a powerful approach for manipulating stem cell differentiation.
We have demonstrated a novel delivery platform capable of efficient and simultane-
ous delivery of siRNAs and hydrophobic small molecules into neural stem cells. Our
synthetic methodology allows for facile manipulation of the core chemical structure
to attain remarkable transfection efficiency while maintaining negligible cytotoxicity.
Moreover, our multimodal delivery vehicle enables a methodology by which we can tar-
get multiple signaling pathways and mechanisms to successfully enhance the neuronal
differentiation of neural stem cells. While our study provides a specific application for
directing neural stem cell behavior using retinoic acid and SOX9 siRNA, our deliv-
ery system are amendable to any combination of cell line, small molecules and siRNA
sequences. With the increasing interest in achieving precise control over stem cell dif-
ferentiation, our DexAM delivery system serves as a step towards bridging the gap
between basic science and clinically-relevant treatment strategies.
2.2.4 Materials and Methods
β-cyclodextrin, tosylimidazole, tris(aminoethyl)amine, methyl acrylate, amberlite IRA
900 were obtained from Sigma-Aldrich and used as received unless otherwise noted.
Other chemicals and solvents were of analytical reagent grade. All reactions were
conducted in flame-dried glassware with magnetic stirring under an atmosphere of
dry nitrogen. Reaction progress was monitored by analytical thin layer chromatog-
raphy (TLC) using 250 m silica gel plates (Dynamic Absorbents F-254). Visualization
was accomplished with UV light and potassium permanganate stain, followed by heat-
ing. Proton nuclear magnetic resonance (1H NMR) spectra were recorded on either a
Varian-300 instrument (300 MHz), Varian-400 instrument (400 MHz) or a Varian-500

70
instrument (500 MHz). Chemical shifts of the compounds are reported in ppm relative
to tetramethylsilane (TMS) as the internal standard. Data are reported as follows:
chemical shift, integration, multiplicity (s=singlet, d=doublet, t=triplet, q=quartet,
br=broad, m=multiplet), and coupling constants (Hz).
Detailed synthesis of DexAM
Synthesis of hexamethyl-3,3′,3′′,3′′′,3′′′′,3′′′′′-(2,2′,2′′-nitrilotris(ethane-2,1-diyl)tris(azanetriyl))
hexapropanoate (1) (Figure 2.14)
Figure 2.14: First Round of Michael Addition and Amidation, a) MeOH, 0◦C, 1h/ RT,48h, b) MeOH, 0◦C, 1 h, RT, 7 days.
A solution of tris(aminoethyl)amine (1, 4.3872g, 30 mmol) in methanol (25 mL) was
added dropwise to a stirred solution of methyl acrylate (19.37 g, 225 mmol) in methanol
(25 mL) for 1 h in an ice-water bath. The resulting solution was stirred for 1 h in an
ice-water bath and then allowed to warm to room temperature and stirred for further
48 h. The solvent and excess acrylate were removed under reduced pressure using a
rotary evaporator. The residue was purified by column chromatography to afford the
product (2) as a colorless oil. Yield: 16.88 g, 85%).; NMR (300 MHz, CDCl3): δ 2.44
(t, J=6.9 Hz, 12H), 2.49 (s, J=6 Hz, 12H), 2.74 (t, J=6.9 Hz, 12H), 3.67 (s, 18H). MS
(m/z): calculated, 662.37 for C30H54N4O12; found, 685.76 for [M + Na]+.
3,3′,3′′,3′′′,3′′′′,3′′′′′-(2,2′,2′′-nitrilotris(ethane-2,1-diyl)tris(azanetriyl))hexakis(N-(2-
(bis(2-aminoethyl)amino)ethyl)propanamide) (3)
A solution of 2 (2.17 g, 3.3 mmol) in methanol (20 mL) was added dropwise to
solution of tris(aminoethyl)amine (1, 5.8 g, 39.6 mol) in methanol (20 mL) and stirred
over a period of 1 h in an ice bath. The resulting solution was allowed to warm to room
temperature and stirred for 7 days at room temperature at which time no methyl ester

71
was detectable by NMR spectroscopy. The solvent was removed under reduced pressure
using a rotary evaporator and then the excess tris(aminoethyl)amine was removed using
an azeotropic mixture of toluene and methanol (90:10 v/v). The remaining toluene was
removed by azeotropic distillation using methanol. Finally, the remaining methanol was
removed under vacuum. The residue was purified by dialysis and centrifugal filtration
to afford the desired product. Finally the product was kept under vacuum to obtain the
amino-terminated product (3, 4.4 g, 99%) as colorless oil. NMR (300 MHz, CDCl3): δ
1.25 (s, J=6.0 Hz, 24H), 2.44 (t, J=6.9 Hz, 12H), 2.48 (m, J=8 Hz, 72H), 2.74 (t, J=6.9
Hz, 12H), 3.25 (t, 12H), 8.0 (s, 6H). MS (m/z): calculated, 1347.14 for C60H138N28O6;
found, 1370.0391 for [M + Na]+.
Synthesis of methyl ester of 3 (4)
A solution of 3 (1.48g, 1.1 mmol) in methanol (5 mL) was added dropwise to a
stirred solution of methyl acrylate (2.84 g, 33.0 mmol) in methanol (5 mL) for 1 h in an
ice bath. The resulting solution was stirred for 30 min in an ice bath and then for 60 h
at room temperature. The volatiles were removed under reduced pressure. The residue
was purified by column chromatography using DCM:MeOH (10:1 v/v) to afford the
desired product (4) as a yellow oil. Yield: (3.41 g, 91%); NMR (300 MHz, CDCl3): δ
2.44 (t, J=6.9 Hz, 12H), 2.49 (s, J=6 Hz, 12H), 2.74 (t, J=6.9 Hz, 12H), 3.67 (s, 18H).
MS (m/z): calculated, 3410.03 for C158H284N26O54; found, 3435.08 for [M + Na]+.

72
Synthesis of the polyamine backbone of DexAM (5) (Figure 2.15)
Figure 2.15: Second Round of Micheal Addition and Amidation, a) MeOH, 0◦C, 1 h,RT, 60 h, b) MeOH, 0◦C, 1 h, RT, 7 days.
A solution of ester 4 (3.41g, 1 mmol) in methanol (20 mL) was added dropwise
to a stirred solution of tris(aminoethyl)amine (1, 7.02 g, 48 mmol) in methanol (20
mL) over a period of 1 h in an ice bath. The resulting solution was allowed to warm
to room temperature and stirred for 7 days at room temperature at which time no
methyl ester was detectable by NMR spectroscopy. The solvent was removed under
reduced pressure the excess tris(aminoethyl)amine was removed using an azeotropic
mixture of toluene:MeOH (90:10 v/v). The product was further purified by washing
with anhydrous ether twice, yielding a highly viscous liquid. Finally the product was
kept under vacuum to provide the amino-terminated final product (5) as a light yellow
liquid. Yield (6.1 g, 99%); NMR (300 MHz, CDCl3): δ 1.25 (s, J=6.0 Hz, 24H), 2.44
(t, J=6.9 Hz, 12H), 2.48 (m, J=8 Hz, 72H), 2.74 (t, J=6.9 Hz, 12H), 3.25 (t, 12H), 8.0
(s, 6H). MS (m/z): calculated, 6151.06 for C276H618N124O30; found, 6177.66 for [M +
Na]+.

73
Synthesis of mono-tosylated cyclodextrin (7) (Figure 2.16)
Figure 2.16: Synthesis of mono-tosylated cyclodextrin.
β-cyclodextrin (6, 8.75 g, 7.71 mmol) and tosylimidazole (2.22g, 10.0 mmol) was
dissolved in 88 ml deionized water. The solution was vigorously stirred for 4 h at room
temperature. Aqueous NaOH solution (1% (w/v), 10.0 ml) was gradually added to the
solution and stirred for an additional 10 min. The insoluble solid was filtered off and
the filtrate was collected. The filtrate was neutralized to pH 7 using NH4Cl to induce
precipitation. The precipitate was then collected by filtration, washed with cold water
(25 ml 3) and with acetone (25 ml 4). The solid was dried in a drying oven at 60◦C
under vacuum (10 mm Hg) overnight to yield 7 as a white solid (4.5 g, 51% yield).
1H NMR (300 MHz, DMSO-d6), δ 7.72 (d, J=8.4 Hz, 2H), 7.41 (d, J = 8.4 Hz, 2H),
5.605.89 (m, 14H), 4.754.81 (m, 7H), 4.154.62 (m, 6H), 3.453.72 (m, 28H), 3.153.47 (m,
24H), 2.41 (s, 3H). MS (m/z): calculated, 1,288.4 for C49H76O37S; found, 1,311.5 for
[M + Na]+.

74
Synthesis of water-soluble CD-Polyamine tosylate (8) (Figure 2.17)
Figure 2.17: Conjugation of β-CD to the Polyamine Backbone, a) ddH2O, RT, 4h / 1% NaOH, 10min/NH4Cl, b) DMF, 90◦C, 48h, c) Amberlite IRA900.
Tosylated β-CD (7, 1.29g, 1mmol) and polyamine of DexAM 4 (5, 6.1g, 1 mmol )
were dissolved in DMF (10 mL) in a 25 mL one-necked round-bottomed flask equipped
with Liebigs condenser and a stir bar. The flask was degassed and purged with nitrogen.
The mixture was stirred and refluxed at 90 ◦C for 48 h. The reaction mixture was cooled
down to room temperature and product precipitated out by the addition of acetone
(20 mL). The precipitate was collected by filtration, washed with acetone and dried
overnight at 60◦C in a vacuum oven (10 mm Hg) to yield 8 as a brown solid. Yield:
(6.6g, 89%); 1H NMR (300 MHz, DMSO-d6), δ 1.25 (s, J=6.0 Hz, 24H), 2.41 (s, 3H),
2.44 (t, J=6.9 Hz, 12H), 2.48 (m, J=8 Hz, 72H), 2.74 (t, J=6.9 Hz, 12H), 3.153.47 (m,
24H), 3.25 (t, 12H), 3.453.72 (m, 28H), 4.154.62 (m, 6H), 4.754.81 (m, 7H), 5.605.89
(m, 14H), 7.21 (d, J = 8.4 Hz, 2H), 7.52 (d, J=8.4 Hz, 2H), 8.0 (s, 6H). MH+7444.84
or 8733.01
75
Anion exchange reaction for obtaining DexAM (9)
CD-polyamine tosylate (8, 3.72g, 0.5 mmol) was dissolved in 40 mL deionized water.
A 50 mL solid-phase synthesis vessel was packed with Amberlite IRA-900 ion-exchange
resin to about half the vessel volume. The solution was transferred into the solid phase
vessel. After 1 h, the eluent was collected and the water was distilled off under reduced
pressure using a vacuum pump. The solid residue was dried overnight at 60◦C in a
vacuum oven (10 mm Hg) to yield 9 as a brown solid. Yield: (3.47g, 95%); 1H NMR
(300 MHz, DMSO-d6), δ 1.25 (s, J=6.0 Hz, 24H), 2.41 (s, 3H), 2.44 (t, J=6.9 Hz, 12H),
2.48 (m, J=8 Hz, 72H), 2.74 (t, J=6.9 Hz, 12H), 3.153.47 (m, 24H), 3.25 (t, 12H),
3.453.72 (m, 28H), 4.154.62 (m, 6H), 4.754.81 (m, 7H), 5.605.89 (m, 14H), 8.0 (s, 6H).
MH+7309.10 or 8462.53.
Conjugation of Alexa-Fluor 594 dye to DexAM 4 (10)
Alexa-Fluor R©594 dye (100 nM, Molecular Probes) and DeXAM 4 (9, 100 nM) were
dissolved in PBS buffer solution (0.5 mL). The reaction mixture was allowed to vortex
for 5 minutes. After being vortexed, the mixture was shaken at room temperature for
3 h.
Inclusion of retinoic acid (RA) into DexAM
Retinoic acid (RA) was solubilized in 2 molar equivalents of DexAMs in distilled water.
Briefly, 7.3 mg of RA was added to a solution of 370 mg of DexAM in 3 mL of water,
heated until fully dissolved, stirred for 8 h, and then rapidly cooled on ice to room
temperature. This solution was filtered and freeze-dried. Thereafter, 200 µL PBS was
added to DexAM complex (10 µmol) and allowed to stand at room temperature to
dissolve for a few minutes. Finally, the complex was purified through by centrifugal
filtration using an appropriate MWCO membrane. DexAM-RA solutions of various
concentrations were prepared by maintaining the molar ratio between RA and DexAMs
(Figure 2.18).

76
Figure 2.18: Inclusion of RA into DexAM.
Formation of polyplexes between siRNA and DexAM
siRNA complexation: DexAM/siRNA complexes were prepared by adding equal vol-
umes of DexAM solution (DexAM dissolved in dH2O) and siRNA (dissolved in water) at
varying different concentrations. The resultant solution was then incubated for 30 min
at room temperature before transfection (Figure 2.19). The GFP siRNA sequence was:
Antisense 5-CCAACGACAUCAGCGACUAUU-, Sense 3-UUGGUUGCUGUAGUC-
GCUGAU-5. The SOX9 siRNA sequence was Antisense 5-AACGAGAGCGAGAAGA-
GACCC-3, Sense 3-TTGCUCUCGCUCUUCUCUGGG-5.
Figure 2.19: Polyplex formation of DexAM and siRNA.

77
Neural stem cell culture and differentiation
Rat neural stem cell line (Millipore) were purchased and routinely expanded accord-
ing to the manufactures protocol. The NSCs were maintained in laminin (Sigma, 20
µg/ml) coated culture dishes precoated with poly-L-lysine (10 µg/ml) in Millitrace
media (Millipore) supplemented with the antibiotics, penicillin and streptomycin (Life
Technologies), in the presence of basic fibroblast growth factor (bFGF-2, 20 ng/ml,
Millipore). All of the cells were maintained at 37◦C in a humidified atmosphere of 5%
CO2. For consistency, the experiments were carried out on cells between passages 2
and 5. Neural differentiation was initiated by changing the medium to basal medium
(without bFGF-2). The cells were allowed to differentiate for 6 days with the basal
medium in each being exchanged every other day.
Cell viability assay
The percentage of viable cells was determined by MTS assay following standard proto-
cols described by the manufacturer. All experiments were conducted in triplicate and
averaged. The quantification of cytotoxicity was done using MTS assay after incubating
cells in the presence of the DexAM complexes.
Immunocytochemistry
To investigate the extent of neuronal differentiation, at Day 6, the basal medium was
removed and the cells fixed for 15 minutes in Formalin solution (Sigma) followed by two
PBS washes. Cells were permeabilized with 0.1% Triton X-100 in PBS for 10 minutes
and non- specific binding was blocked with 5% normal goat serum (NGS, Life Tech-
nologies) in PBS for 1 hour at room temperature. To study the extent of neuronal
differentiation the primary mouse antibody against TuJ1 (1:500, Covance) and primary
rabbit antibody against MAP2 (1:100, Cell Signaling) was used and for glial differen-
tiation the primary rabbit antibody against GFAP (1:300, Dako) was used. The fixed
samples were incubated overnight at 4◦C in solutions of primary antibodies in PBS
containing 10% NGS. After washing three times with PBS, the samples were incubated
78
for 1 h at room temperature in solution of anti-mouse secondary antibody labeled with
Alexa-Fluor R©647 and anti-rabbit secondary antibody labeled with Alexa-Fluor R©546
(1:200, Life Technologies), Hoechst 33342 (1:500, Life Technologies) in PBS containing
10% NGS to observe neuronal and glial differentiation. After washing the samples thrice
with PBS, the substrates were mounted on glass slides using ProLong R©Gold antifade
(Life Technologies). The mounted samples were imaged using Nikon TE2000 Fluores-
cence Microscope. ImageJ (NIH) was used for comparative analysis and quantifying
the cells expression TuJ1 and GFAP.

79
Chapter 3
Manipulating Surface Chemistry to Enhance Neuronal
Differentiation of Neural Stem Cells
In previous chapter, we used nanomaterials to deliver siRNA and small molecules (sol-
uble cues) into brain tumor cells and NSCs. Solution-based transfections were used in
both cases. In this chapter we will see the application of nanotechnology and surface
modification for enhancing neuronal differentiation of NSCs using insoluble cues. We
will see that the nanomaterials used form a part of the extracellular matrix (ECM) and
thus impact the behavior of NSCs. We will see the impact of nanotopography on the
delivery of siRNA into NSCs. We will then see how micropatterns of the ECM proteins
affect stem cell differentiation and how they can be utilized to control differentiation.
Finally, we will see the emerging impact of novel nanomaterials in stem cell biology and
how they can affect the behaviors of stem cells.

80
3.1 Nanotopography-mediated Reverse Uptake of siRNA for Enhanc-
ing Neuronal Differentiation of Neural Stem Cells
3.1.1 Introduction
One of the critical barriers to harnessing the full therapeutic potential of stem cells
is the development of an easy, effective, and non-toxic methodology to control dif-
ferentiation into specific cell lineages. Stem cell differentiation can be controlled by
modulating key gene expression levels or signaling pathways within the cell, which has
been achieved by several conventional gene delivery methods [3,165–168]. For example,
RNA interference (RNAi) for controlling gene expression levels using siRNA or miRNA
is emerging as an important tool in stem cell biology [139,140,169]. For the successful
genetic manipulation of stem cells, the cells must typically maintain their viability for
an extended period of time after single or multiple siRNA transfections, without affect-
ing the intrinsic cellular functions. However, many of the conventional methods used to
deliver siRNA into stem cells, including lipid-based transfections, cationic polyplexes,
viral vectors and electroporation techniques, result in significant cytotoxicity and unde-
sirable side-effects [146, 170–172]. This presents a considerable challenge for achieving
robust and reliable siRNA delivery into stem cells to control their differentiation into
the desired cell lineages.
One of the most common methods to deliver siRNA into stem cells is solution-
mediated delivery (or forward transfection), wherein the siRNA is added directly to the
culture media above the seeded cells. In this approach, exogenous chemical materials
are generally used to enhance cellular internalization of the siRNA. The most widely
used exogenous materials include non-viral cationic lipids (such as Lipofectamine2000)
[173,174] and cationic polymers (such as PEI) [146,167,168,175], which tend to condense
the negatively charged siRNA to form complexes that can be readily taken up by the
cell. While this approach has been found to facilitate siRNA delivery into a variety
of cell types including stem cells, these exogenous materials tend to be cytotoxic and
thereby need to be removed after a certain incubation period. Moreover, global gene
expression studies using cDNA microarray technologies have even revealed inadvertent,

81
nonspecific changes in gene expression within the target cells after treatment with
cationic lipid and polymer-based gene delivery systems [176,177]. Such undesired side-
effects can greatly exacerbate, attenuate or even mask the desired genetic change, while
also compromising the ability of stem cells to proliferate, migrate and differentiate
[1, 148, 178, 179]. Therefore, there are several limitations associated with the solution-
mediated delivery methods for manipulating gene expression within stem cells [180].
While most studies have aimed to improve the efficiency of siRNA delivery by try-
ing to improve the delivery vehicle, modulating the cellular microenvironment is an
attractive means to achieve superior transfection efficiency. In turn, increasing atten-
tion has been given to substrate-mediated delivery (or reverse transfection), wherein
the cells directly uptake the gene vector from the underlying substrate [181–184]. This
approach has been found to result in greater internalization and functional expression
of the gene vectors (i.e. DNA plasmids) compared to forward transfection [182]. How-
ever, up to now, these approaches have relied on using cationic lipids or polymers to
complex the gene vector prior to immobilizing on the substrate, in turn suffering from
issues with cytotoxicity and nonspecific changes in gene expression. Substrate-mediated
methods which do not utilize cationic materials have also been successful at deliver-
ing biomolecules into cells [185–188]. However, the cell survival on such substrates
for extended periods, which is especially important for advancing stem cell therapies,
is critically important and less explored. Therefore, there is a necessity to develop a
non-toxic and efficient strategy for delivering siRNA into stem cells to control gene
expression levels, such that we can maintain the biological functions of stem cells for
extended periods of time and efficiently control their differentiation into specific cell
types.
In an effort to address these limitations, herein we demonstrate a nanotopography-
mediated reverse uptake (NanoRU) platform for delivering siRNA into neural stem
cells (NSCs) in a non-toxic and highly effective manner. The importance of nanoto-
pography in modulating cell behavior (including adhesion, morphology, proliferation
and differentiation) has become increasingly evident in recent years [189, 190]. Yet,

82
there are limited studies which report on the influence of nanotopography in facilitat-
ing cellular endocytosis, and in turn non-viral transfection [191,192]. In one such study,
fibroblast and mesenchymal stem cells grown on nanotopographical patterned surfaces
were shown to have enhanced endocytosis of gene plasmids, compared to unpatterned
surfaces [192]. Nevertheless, while the cells were grown on the nanotopography, the
gene vectors were still delivered through solution-mediated approaches (i.e. complex-
ing with cationic polymers/lipids). Given that NSCs are known to be highly sensitive
to nanotopographical and physical cues [111,193,194], we believe nanotopography can
play a critical role in modulating siRNA uptake via substrate-mediated delivery. Our
NanoRU platform was fabricated by assembling monodisperse nanoparticles on a glass
substrate, which served to generate the desired nanotopographical features in the cel-
lular microenvironment (Figure 3.1)
Figure 3.1: Schematic diagram depicting the application of NanoRU. (a) The cellu-lar uptake of siRNA into NSCs from NanoRU coated with ECM protein and siRNAmolecules. (b) The delivery of siRNA against the SOX9 transcription factor usingNanoRU to promote neuronal differentiation of NSCs [145].

83
As a proof-of-concept, we studied the interaction of NSCs with different sizes of
nanoparticles and identified an optimal nanoparticle size that facilitated the highest
uptake of siRNA by the NSCs. To accomplish this, we assessed the efficiency of RNAi
by examining the suppression of green fluorescent protein (GFP) in NSCs that were
genetically modified to express GFP. Based on the GFP knockdown, we then utilized
the optimized NanoRU to specifically knockdown the expression of a neural switch
gene, SOX9, which resulted in significantly enhanced neuronal differentiation of NSCs.
Thus, NanoRU relies upon the nanotopographical features of the extracellular microen-
vironment to deliver siRNA into NSCs, without using exogenous delivery vehicles. In
particular, this novel siRNA delivery approach does not require the use of cationic trans-
fection agents, which are generally cytotoxic to stem cells. In addition to stem cells,
we further demonstrate that NanoRU can be successfully applied to deliver siRNA into
various other cell lines. However, we utilize NSCs as a model cell line in order to estab-
lish NanoRU as a simple, biocompatible and efficient platform for stem cells, which are
known to be much more sensitive and prone to cytotoxicity by the conventional non-
viral systems used for the delivery of genetic material [147]. In turn, we used NanoRU
not only to deliver siRNA into NSCs, but also to ensure the long-term survival and
differentiation of the transfected NSCs.
As a proof-of-concept, we studied the interaction of NSCs with different sizes of
nanoparticles and identified an optimal nanoparticle size that facilitated the highest
uptake of siRNA by the NSCs. To accomplish this, we assessed the efficiency of RNAi
by examining the suppression of green fluorescent protein (GFP) in NSCs that were
genetically modified to express GFP. Based on the GFP knockdown, we then utilized
the optimized NanoRU to specifically knockdown the expression of a neural switch
gene, SOX9, which resulted in significantly enhanced neuronal differentiation of NSCs.
Thus, NanoRU relies upon the nanotopographical features of the extracellular microen-
vironment to deliver siRNA into NSCs, without using exogenous delivery vehicles. In
particular, this novel siRNA delivery approach does not require the use of cationic trans-
fection agents, which are generally cytotoxic to stem cells. In addition to stem cells,
we further demonstrate that NanoRU can be successfully applied to deliver siRNA into

84
various other cell lines. However, we utilize NSCs as a model cell line in order to estab-
lish NanoRU as a simple, biocompatible and efficient platform for stem cells, which are
known to be much more sensitive and prone to cytotoxicity by the conventional non-
viral systems used for the delivery of genetic material.[39] In turn, we used NanoRU
not only to deliver siRNA into NSCs, but also to ensure the long-term survival and
differentiation of the transfected NSCs.
3.1.2 Results and Discussion
Nanotopographical features determine siRNA-based gene knockdown in NSCs
To study the effect of nanotopographical features on the efficiency of siRNA trans-
fection and gene knockdown in the GFP-labeled NSCs, NanoRUs were fabricated by
assembling monolayers of silica nanoparticles (SiNPs) ranging from 100 nm to 700 nm
in diameter on bare glass substrates. The nanoparticles were assembled on the surface
by centrifuging the glass substrates in a solution of positively-charged SiNPs [85]. This
size-dependent study is critical because the nanotopographical features of the extra-
cellular microenvironment have been shown to affect the adhesion and growth of stem
cells, which in turn can influence the substrate-mediated delivery of genetic materials
into stem cells [190, 191, 195, 196]. For our initial studies, siRNA targeting GFP was
selected to assess the efficiency of siRNA delivery and GFP knockdown in the NSCs.
After nanoparticle assembly, the NanoRUs were coated with a solution of laminin (10
µg/mL) and siRNA molecules (1 µM) against GFP. Laminin is a well-established ex-
tracellular matrix (ECM) protein that binds to the integrin receptors on the surface of
the NSCs, and is an essential ECM component for the adhesion, growth, and differenti-
ation of NSCs [197, 198]. Negatively-charged siRNA molecules and laminin condensed
together on the positively-charged SiNPs. After 4 h, the solution was removed and
NSCs were then seeded on these NanoRUs (Figure 3.2a).
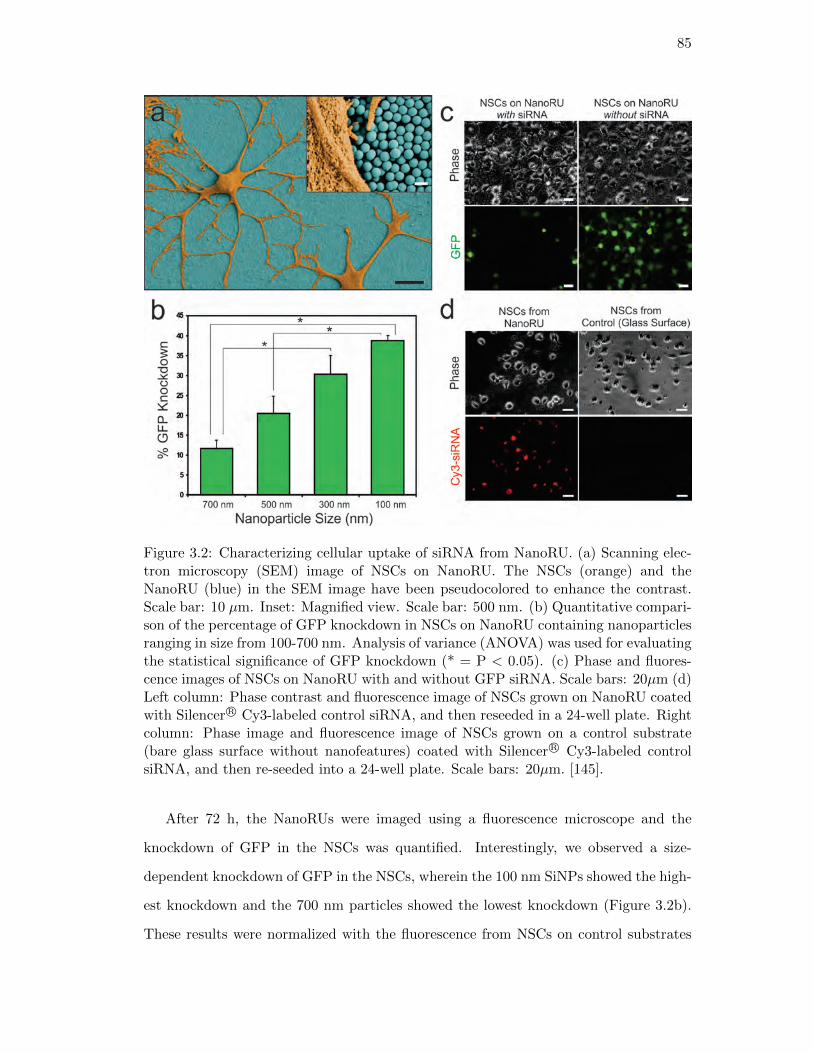
85
Figure 3.2: Characterizing cellular uptake of siRNA from NanoRU. (a) Scanning elec-tron microscopy (SEM) image of NSCs on NanoRU. The NSCs (orange) and theNanoRU (blue) in the SEM image have been pseudocolored to enhance the contrast.Scale bar: 10 µm. Inset: Magnified view. Scale bar: 500 nm. (b) Quantitative compari-son of the percentage of GFP knockdown in NSCs on NanoRU containing nanoparticlesranging in size from 100-700 nm. Analysis of variance (ANOVA) was used for evaluatingthe statistical significance of GFP knockdown (* = P < 0.05). (c) Phase and fluores-cence images of NSCs on NanoRU with and without GFP siRNA. Scale bars: 20µm (d)Left column: Phase contrast and fluorescence image of NSCs grown on NanoRU coatedwith Silencer R© Cy3-labeled control siRNA, and then reseeded in a 24-well plate. Rightcolumn: Phase image and fluorescence image of NSCs grown on a control substrate(bare glass surface without nanofeatures) coated with Silencer R© Cy3-labeled controlsiRNA, and then re-seeded into a 24-well plate. Scale bars: 20µm. [145].
After 72 h, the NanoRUs were imaged using a fluorescence microscope and the
knockdown of GFP in the NSCs was quantified. Interestingly, we observed a size-
dependent knockdown of GFP in the NSCs, wherein the 100 nm SiNPs showed the high-
est knockdown and the 700 nm particles showed the lowest knockdown (Figure 3.2b).
These results were normalized with the fluorescence from NSCs on control substrates

86
having no SiNPs (i.e. absence of nanotopography). The control substrates (without the
SiNP monolayer) had a positively-charged surface, which was prepared by functionaliz-
ing glass substrates with self-assembled monolayers (SAMs) of 3-Aminopropyltrimethoxy
silane (APTES) and subsequently coating them with the same concentrations of siRNA
and laminin. To further substantiate that the siRNA uptake and gene knockdown was
due to the differences in the nanopotographical features and not due to the differences
in the amount of siRNA bound, we performed the Picogreen R© assay to quantify the
amount of siRNA bound to NanoRUs. From the Picogreen R© assay, we confirmed that
the amount of siRNA bound to all the NanoRUs (100-700 nm and control substrates)
was around 30%, thus confirming that the siRNA uptake and gene knockdown was in-
deed due to the nanotopographical features on the NanoRUs. Given that the NanoRU
fabricated using 100 nm SiNPs resulted in maximum GFP knockdown, all of the sub-
sequent experiments were carried out using NanoRU with 100 nm SiNPs.
NanoRU delivers only siRNA into NSCs and not SiNPs
Another important aspect that needed to be investigated was whether the SiNPs were
being taken up along with the siRNA. To this end, we used SiNPs labeled with Alexa-
Fluor R©594 dye to generate nanotopographical features on glass substrates. We then
deposited siRNA against GFP on the dye-labeled NanoRUs. After 36 h of incubation,
the NSCs were detached gently from the NanoRU using the enzyme Accutase, and
regrown in a 24-well plate. We did not observe any fluorescence (from the dye-labeled
SiNPs) within the transfected NSCs. However, we observed a clear GFP knockdown
due to the siRNA delivered into the NSCs (Figure 3.2c). We further used transmission
electron microscopy (TEM) to confirm that the SiNPs are not taken up by the NSCs
(Figure 3.3). We then confirmed the uptake and localization of siRNA from NanoRU
using the Silencer R© Cy3-labeled negative control siRNA (Ambion), which showed re-
markably higher fluorescence compared to the control substrates (Figure 3.2d). This
experimental data clearly indicates that the stem cells take up only siRNAs, and not
SiNPs. We believe that this unique feature, where only the siRNA is taken up by the

87
NSCs, makes NanoRU particularly advantageous over conventional transfection meth-
ods for stem cell research.
Figure 3.3: Transmission Electron Microscopy (TEM) to confirm SiNPs are not takenup by the NSCs. (a) and (b) TEM of NSCs seeded on NanoRU containing 300 nmSiNPs. The blue arrow shows the presence of SiNPs outside of the cell. (c) and (d)TEM of NSCs seeded on NanoRU containing 100 nm SiNPs [145].
We further sought to investigate the mechanism involved in the uptake of siRNA
from NanoRU. ECM proteins such as laminin, fibronectin and collagen pre-adsorbed on
surfaces have been previously implicated in enhancing gene delivery through endocytosis
[195, 199, 200]. Gene delivery in such systems depended primarily upon caveolae- than
clathrin-mediated endocytosis [199]. Caveolae-mediated endocytosis is known to be
more efficient as it is able to circumvent the degradative lysosomal pathway [201]. To
confirm if the dominant endocytic pathway involved in the uptake of siRNA by the
NSCs cultured on NanoRU was indeed caveolae-mediated endocytosis, we treated the
NSCs with 100 µM of indomethacin (10 min), a specific inhibitor of caveolae-mediated

88
endocytosis. We also treated the NSCs with a mixture of 10 mM sodium azide and
5 mM 2-Deoxy-D-glucose (10 min) as this mixture inhibits all endocytotic pathways
within the NSCs. After 72 h, we observed a 13% knockdown of GFP in NSCs treated
with Indomethacin and a 7% knockdown in NSCs treated with the mixture of sodium
azide and 2-Deoxy-D-glucose, which was significantly lower than the 40% knockdown
observed in untreated NSCs (Figure 3.4). Collectively, our results imply that the uptake
of siRNA using NanoRU relies mainly on the caveolae-mediated endocytosis. However,
there may be multiple pathways involved in the uptake of siRNA from NanoRU, which
are currently under investigation in our lab.
Figure 3.4: Effect of endocytosis inhibitors on GFP knockdown. Quantitative compar-ison of the percentage of GFP knockdown in the presence of endocytosis inhibitors,indomethacin and sodium azide plus 2-deoxy-d-glucose [145].
Controlling neuronal differentiation of NSCs using NanoRU
Having demonstrated the efficiency of NanoRU by delivering siRNA against GFP, we
focused on using NanoRU to enhance the neuronal differentiation of NSCs by suppress-
ing the expression of a specific protein or gene. We used NanoRU to deliver siRNA
against SOX9 (siSOX9), a well-established transcription factor which acts as a switch
between neuronal and glial differentiation [158]. When the SOX9 gene is turned on, a
higher percentage of NSCs differentiate into astrocytes (glial cells), and when turned off,
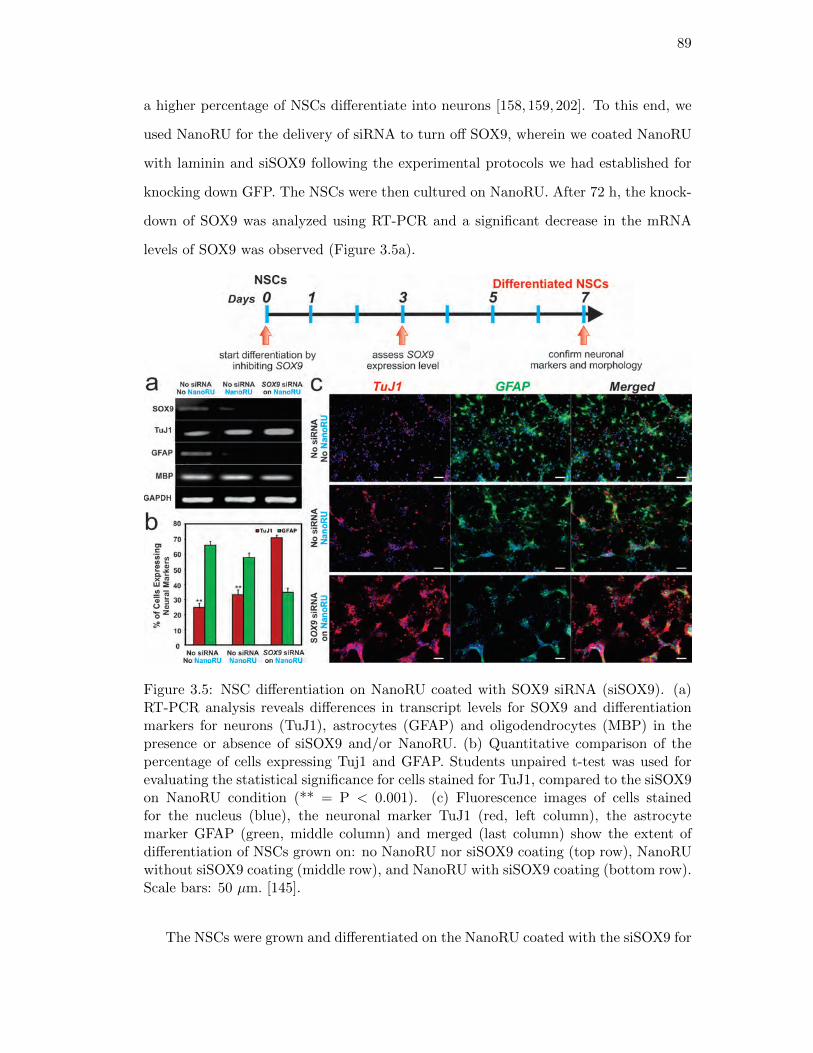
89
a higher percentage of NSCs differentiate into neurons [158, 159, 202]. To this end, we
used NanoRU for the delivery of siRNA to turn off SOX9, wherein we coated NanoRU
with laminin and siSOX9 following the experimental protocols we had established for
knocking down GFP. The NSCs were then cultured on NanoRU. After 72 h, the knock-
down of SOX9 was analyzed using RT-PCR and a significant decrease in the mRNA
levels of SOX9 was observed (Figure 3.5a).
Figure 3.5: NSC differentiation on NanoRU coated with SOX9 siRNA (siSOX9). (a)RT-PCR analysis reveals differences in transcript levels for SOX9 and differentiationmarkers for neurons (TuJ1), astrocytes (GFAP) and oligodendrocytes (MBP) in thepresence or absence of siSOX9 and/or NanoRU. (b) Quantitative comparison of thepercentage of cells expressing Tuj1 and GFAP. Students unpaired t-test was used forevaluating the statistical significance for cells stained for TuJ1, compared to the siSOX9on NanoRU condition (** = P < 0.001). (c) Fluorescence images of cells stainedfor the nucleus (blue), the neuronal marker TuJ1 (red, left column), the astrocytemarker GFAP (green, middle column) and merged (last column) show the extent ofdifferentiation of NSCs grown on: no NanoRU nor siSOX9 coating (top row), NanoRUwithout siSOX9 coating (middle row), and NanoRU with siSOX9 coating (bottom row).Scale bars: 50 µm. [145].
The NSCs were grown and differentiated on the NanoRU coated with the siSOX9 for

90
7 days. We then used RT-PCR to examine the expression levels of key neural markers
(Figure 3.5a). A remarkable decrease in the expression of the glial marker, glial fibrillary
acidic protein (GFAP), and an increase in the expression of the neuronal marker, β-III
tubulin (TuJ1), was observed. No significant change was found in the expression of
the oligodendrocyte marker, myelin-binding protein (MBP). We further confirmed and
quantified our results by immunostaining for neuronal and astrocyte markers (Figure
3.5b and c). Compared to control substrates (substrates having no SiNPs), a remarkably
higher percentage of NSCs differentiated into neurons on NanoRU coated with siSOX9
(Figure 3.5b). As expected, the number of astrocytes considerably decreased when
SOX9 was knocked down. Neuronal differentiation was further confirmed by studying
the co-localization of two different neuronal markers, TuJ1 and microtubule-associated
protein 2 (MAP2) (Figure 3.6).
Figure 3.6: Colocalization of neuronal markers. Fluorescence images of NSCs grown onNanoRU coated with siSOX9, stained for the neuronal markers TuJ1 and MAP2. Themerged image shows the co-localization of the two neuronal markers. Scale bars: 20µm. [145].
NanoRU for delivering siRNA into other mammalian cells and miRNA into
NSCs
After successfully demonstrating the proficiency of NanoRU for delivering siRNA into
stem cells, we sought to explore the potential of using NanoRU as a platform for deliv-
ering siRNA into other mammalian cell lines. To this end, NanoRU was used to deliver
Silencer R© Cy3-labeled negative control siRNA into other mammalian cells such as as-
trocytes, brain cancer cells (U87-VIII), and breast cancer cells (SUM159). The cells
were detached from NanoRU after 36 h, replated in 24 well plates, and then imaged

91
for siRNA uptake (Figure 3.7a and Figure 3.8). All of the cell lines showed the uptake
of the dye-labeled siRNA from NanoRU, indicating that our technique is efficient and
applicable to normal cells, cancer cells, as well as stem cells.
Figure 3.7: Cellular uptake of siRNA and cellular viability in different cell types. (a)Fluorescence (left column) and merged phase images (right column) of the Silencer R©
Cy3-labeled negative control siRNA from NanoRU in three cell lines: SUM159 (breastcancer cells), U87vIII (brain cancer cells) and rat NSCs (neural stem cells). Scale bars:20 µm.(b) MTS cellular viability of SUM159, U87vIII and NSCs grown on NanoRU[145].
Figure 3.8: siRNA uptake within Astrocytes. Fluorescence and phase images depict-ing the cellular uptake of Silencer R© negative control Cy3-labeled siRNA into humanastrocytes. Scale bars: 20 µm. [145].

92
Additionally, NanoRU can be easily extended to deliver miRNA, consisting of a
larger number of nucleotide base pairs. We successfully delivered the Cy3-dye labeled
Pre-miR R© negative control (Ambion) using the same protocol that we used for deliver-
ing siRNA. The NSCs cultured on NanoRU coated with laminin and miRNA took up
the miRNA in a highly efficient manner (Figure 3.9).
Figure 3.9: NanoRU for miRNA uptake. Fluorescence and phase images depicting thecellular uptake of Cy3-labeled miRNA (pseudocolored green) into rat neural stem cells.Scale bars: 20 µm. [145].
NanoRU does not damage cell membranes and is non-toxic
One of the biggest advantages of NanoRU is its biocompatibility and the fact that
the transfection begins as soon as the cells are cultured on NanoRU, with the high-
est transfection observed at 36 h (Figure 3.10). On the other hand, most standard
solution-mediated transfection protocols using cationic lipids and polymers require a
wait period of at least 12-24 h before the cells can be transfected in order to minimize
their toxicity. In addition, the serum proteins in the culture media are known to de-
crease the transfection efficiency due to the non-specific interaction of serum proteins
with the delivery constructs [203].

93
Figure 3.10: Time-dependent siRNA Uptake. Time-dependent uptake of Silencer neg-ative control Cy3-labeled siRNA into rat neural stem cells [145].
We compared the cytotoxicity of NanoRU with a well-established lipid-based cationic
transfection agent, Lipofectamine 2000 R© (Life Technologies) using the negative control
siRNA in three different cell lines: SUM159, U87VIII and NSCs. The cytotoxic results
were analyzed using a standard cell proliferation assay (MTS assay). Interestingly, we
found that Lipofectamine2000 R©, while less toxic towards cancer cells, was extremely
cytotoxic (using manufacturers recommended transfection condition) towards NSCs,
which led to 95% cell death within 48 h of being transfected with the negative con-
trol siRNA (Figure 3.7b). NanoRU, on the other hand, was seen to be biocompatible
with a minimal decrease in cell viability for all the cell lines tested. Moreover, we be-
lieve NanoRU does not cause any physical damage to the cell membranes as the NSCs
showed high cellular viability and enhanced neuronal differentiation on NanoRU after
an extensive period of 7 days. Hence, NanoRU can be especially useful for controlling
NSC differentiation, a process which requires the NSCs to survive for more than seven
days in vitro.
3.1.3 Conclusions
We have developed a novel nanotopography-mediated reverse uptake (NanoRU) plat-
form, for the genetic manipulation of NSCs in a highly effective manner. This platform
94
was employed to control the neuronal differentiation of stem cells by using nanotopo-
graphical features to deliver siRNAs inside cells. We believe NanoRU and its applica-
tion can significantly complement recent advances in research efforts to control stem cell
differentiation based on physical cues such as patterns and bioactive scaffolds of ECM
materials. Even though we have only explored proof-of-concept experiments involving
genetic manipulation and differentiation of NSCs, we expect that NanoRU can be ex-
tended, with straightforward modifications of the aforementioned protocols, to a wide
range of nanomaterials and biomolecules (e.g. miRNA, proteins, and small molecules).
Finally, we believe NanoRU is a valuable platform which will complement conventional
genetic manipulation tools in cell biology. For example, one of the key aspects behind
stem cell-based therapies for many devastating diseases is to transplant stem cells or
differentiated stem cells at the site of injury, after genetically manipulating them. The
exogenous delivery vehicles used for siRNA delivery would be present within the stem
cells and could trigger a strong immune response or tumor formation after stem cell
transplantation. Therefore, our NanoRU-based siRNA delivery can potentially help
overcome one of the critical barriers in stem cell-based tissue engineering.
3.1.4 Materials and Methods
NanoRU preparation
Cover glass (Number 1, 22 mm x 22 mm; VWR) was cut equally into smaller pieces
(18 mm x 6 mm) and sonicated in Nanopure water (18.2 mOhm) for 10 mins and then
cleaned in piranha solution (a 3:1 mixture of sulphuric acid and hydrogen peroxide) for
10 min (Caution: Piranha solution is extremely corrosive). The glass coverslips were
then washed again in Nanopure water (18.2 Mohm) and dried under a stream of pure
nitrogen. To generate films of nanotopographical features, positively-charged (amine-
terminated) silicon oxide nanoparticles (SiNPs, Corpuscular Inc) of different sizes were
utilized. The washed cover slips were centrifuged at 2000 RPM for 2 min in a 2 mL
eppendorf tube containing 25 mg/mL of the SiNP solution. The sizes used were 50
nm, 100 nm, 300 nm, 500 nm and 700 nm. The substrates were then washed with

95
Nanopure water and dried under a stream of pure nitrogen. For functionalization with
(3-aminopropyl)triethoxysilane (APTES), the washed glass cover slips were left in a
beaker containing 1% APTES solution in pure ethanol for 2 h. The cover slips were
then rinsed thoroughly with ethanol and dried under nitrogen. They were then baked
at 100 ◦C in an oven for 10 min.
Coating NanoRU with laminin and siRNA
The NanoRUs were then coated with siRNA and laminin, both of which are negatively
charged at in phosphate buffer saline (PBS, pH 7.4; Life Technologies). In a culture
hood, NanoRUs were coated with a 10 µg/mL solution of laminin containing 100 pmoles
of the desired siRNA (against GFP or SOX9). The GFP siRNA sequence was: Antisense
- 5-CCAACGACAUCAGCGACUAUU-3, Sense - 3-UUGGUUGCUGUAGUCGCUGA-
U-5. The SOX9 siRNA sequence was Antisense - 5-AACGAGAGCGAGAAGAGACCC-
3, Sense - 3-TTGCUCUCGCUCUUCUCUGGG-5. The solution was left on top of the
NanoRUs for 3 h, and then simply removed by dipping the films once in sterile PBS.
The negatively charged laminin and siRNA molecules simply condense on the positively
charged NanoRU. The coated NanoRUs were then put into 12 well plates and 1 mL
suspensions of NSCs were seeded with density of 1.25x10⁵ NSCs /ml of Millitrace me-
dia (Millipore) in the absence of growth factors such as basic fibroblast growth factor
(bFGF). The NSCs were maintained in a humidified atmosphere at 37◦C and 5% CO2.
After 12 h, the films were transferred to new well plates to prevent non-specific attach-
ment of the floating NSCs. The media was then changed every other day until Day
7. On Day 7, the cells were either fixed for immunocytochemistry or lysed for PCR
analysis.
Rat neural stem cell (NSC) culture and differentiation
Rat neural stem cell line (Millipore) were purchased and routinely expanded accord-
ing to the manufactures protocol. The NSCs were maintained in laminin (Sigma, 20
µg/ml) coated culture dishes precoated with poly-L-lysine (10 µg/ml) in Millitrace
media (Millipore) supplemented with the antibiotics, penicillin and streptomycin (Life

96
Technologies), in the presence of basic fibroblast growth factor (bFGF-2, 20 ng/ml,
Millipore). All of the cells were maintained at 37◦C in a humidified atmosphere of 5%
CO2. For consistency, the experiments were carried out on cells between passages 2
and 5. Neural differentiation was initiated by changing the medium to basal medium
(without bFGF-2) on the NanoRUs coated with laminin and siRNA. The cells were al-
lowed to differentiate for 7 days with the basal medium in each being exchanged every
other day.
Culturing U87-EGFRvIII, SUM159, and Astrocytes
For each of the three non-stem cell lines, experiments were carried out on cells between
passages 2 and 10. The NanoRU, coated with Silencer R© Cy3-labeled negative control
siRNA, were put into wells of a 12-well plate and each well containing the substrate was
seeded with 80,000 cells. After 24 h, the substrates were moved into a new 12 well plate.
The media components for U87-EGFRvIII cell line include DMEM (Dulbeccos modi-
fied Eagles medium) with high glucose (Invitrogen), 10% Fetal Bovine Serum (FBS),
1% streptomycin-penicillin, 1% glutamax (Invitrogen), and the selection marker, hy-
gromycin B (30 µg/ml). The media components for SUM159 cell line include Hams
F12 with insulin (5.0 µg/mL), hydrocortisone (1.0 µg/mL), 10 mM HEPES buffer, 5%
Fetal Bovine Serum (FBS), 1% streptomycin-penicillin. The media components for the
Astrocytes cell line DMEM with high glucose (Invitrogen), 10% Fetal Bovine Serum
(FBS), 1% streptomycin-penicillin, 1% glutamax (Invitrogen).
Cell viability assays
Cell viability of the above cell lines on NanoRU was compared with Lipofectamine
2000 R© (Life Technologies) for delivering Silencer R© negative control siRNA (Ambion).
The percentage of viable cells was determined by MTS assay following standard proto-
cols described by the manufacturer. All experiments were conducted in triplicate and
averaged. The quantification of cytotoxicity was done using MTS assay after incubating
cells in the presence of the manufacturers recommended concentration of Lipofectamine
2000 R©. The data is represented as formazan absorbance at 490 nm, considering the

97
control (untreated) cells as 100% viable.
Immunocytochemistry
To investigate the extent of neuronal differentiation, at Day 6, the basal medium was
removed and the cells fixed for 15 minutes in Formalin solution (Sigma) followed by
two PBS washes. Cells were permeabilized with 0.1% Triton X-100 in PBS for 10
minutes and non-specific binding was blocked with 5% normal goat serum (NGS, Life
Technologies) in PBS for 1 hour at room temperature. To study the extent of neuronal
differentiation the primary mouse antibody against TuJ1 (1:500, Covance) and primary
rabbit antibody against MAP2 (1:100, Cell Signaling) was used and for glial differen-
tiation the primary rabbit antibody against GFAP (1:300, Dako) was used. The fixed
samples were incubated overnight at 4◦C in solutions of primary antibodies in PBS
containing 10% NGS. After washing three times with PBS, the samples were incubated
for 1 h at room temperature in solution of anti-mouse secondary antibody labeled with
Alexa-Fluor R©647 and anti-rabbit secondary antibody labeled with Alexa-Fluor R©546
(1:200, Life Technologies), Hoechst 33342(1:500, Life Technologies) in PBS containing
10% NGS to observe neuronal and glial differentiation. After washing the samples thrice
with PBS, the substrates were mounted on glass slides using ProLong R© Gold antifade
(Life Technologies). The mounted samples were imaged using Nikon TE2000 Fluores-
cence Microscope. ImageJ (NIH) was used for comparative analysis and quantifying
the cells expression TuJ1 and GFAP.
PCR analysis
Total RNA was extracted using Trizol Reagent (Life Technologies) and the mRNA ex-
pression level of GFAP, MBP, SOX9 and TuJ1 were analyzed using Reverse Transcrip-
tase PCR (RT-PCR) and quantitative PCR (qPCR). Specifically, cDNA was generated
from 1 g of total RNA using the Superscript III First-Strand Synthesis System (Life
Technologies). Analysis of mRNA was then accomplished using primers specific to each
of the target mRNAs. RT-PCR reactions were performed in a Mastercycler Ep gradient
S (Eppendorf) and images were captured using a Gel Logic 112 (Carestream) imaging

98
system. qPCR reactions were performed using SYBR Green PCR Master Mix (Applied
Biosystems) in a StepOnePlus Real-Time PCR System (Applied Biosystems) and the
resulting Ct values were normalized to GAPDH. Standard cycling conditions were used
for all reactions with a melting temperature of 60◦C. Primers are listed below in Table
3.1.
Table 3.1: Primers for PCR analysis

99
3.2 Controlling Differentiation of Neural Stem Cells Using Extracel-
lular Matrix Protein Patterns
3.2.1 Introduction
The ability of stem cells to differentiate into specialized lineages within a specific mi-
croenvironment is vital for regenerative medicine. For harnessing the full potential of
stem cells for regenerative therapies, it is important to investigate and understand the
function of three types of microenvironmental cues - soluble signals, cell-cell interac-
tions, and insoluble (physical) signals - that dynamically regulate stem cell differentia-
tion [204–206] Neural stem cells (NSCs) are multipotent and differentiate into neurons
and glial cells [207,208], which can provide essential sources of engraftable neural cells
for devastating diseases such as Alzheimers disease [209], Parkinsons disease [210–212]
and spinal cord injury [213–215]. One of the major challenges involved in the dif-
ferentiation of NSCs is to identify and optimize factors which result in an increased
proportion of NSCs differentiating into neurons as opposed to glial cells. To this end,
soluble cues such as brain-derived neurotrophic factor (BDNF) [216–218], sonic hedge-
hog (Shh) [219,220], retinoic acid (RA) [218], and neuropathiazol [221] have been shown
to significantly increase neuronal differentiation of NSCs in vitro. However, the research
toward studying the function of the other two microenvironmental cues (cell-cell interac-
tions and insoluble cues) during the neuro-differentiation of NSCs is limited, mainly due
to the lack of availability of methods for the investigation [193,222–224]. While various
aspects such as cell-cell interactions [66], combinations of extracellular matrix (ECM)
proteins [204,225], and physical properties of substrates have been shown to play a vital
role in determining the fate of other adult stem cells such as mesenchymal stem cells
(MSCs) [226–228], cardiac stem cells [229–231], and hematopoetic stem cells [232–234],
little is known about the influence of such factors on the neuronal differentiation of
NSCs. Therefore, there is a pressing need to develop methods for investigating the role
of cell-cell interactions and insoluble signals in selectively inducing the differentiation
of NSCs into specific neural cell lineages.

100
Herein, we demonstrate how ECM protein patterns can be used to investigate the ef-
fect of physical cues combined with cell-cell interactions on the differentiation of NSCs.
Bio-surface chemistry combined with soft lithography was used to generate combinato-
rial patterns with varying geometries and dimensions of ECM proteins (e.g. laminin,
fibronectin, and collagens) to study the influence of surface features and ECM compo-
sitions on the differentiation of NSCs. We hypothesized that the ECM protein patterns
with variant geometries and dimensions would provide physical cues (e.g. mechanical or
topographical cues), as well as guide cell-cell and cell-ECM interactions in a controlled
manner, both of which would ultimately lead to a pattern geometry-dependent and
pattern dimension-dependent neuronal and glial differentiation (Figure 3.11). Our data
confirmed that the difference in the extent of neuronal and glial differentiation of NSCs
on the ECM protein patterns was entirely due to the pattern geometry and dimension,
as all the experiments were carried out in the absence of exogenous factors that promote
neurogenesis; this suggests that NSCs can undergo differentiation by purely sensing the
difference in ECM pattern geometries and dimensions.

101
Figure 3.11: A schematic diagram of our approaches. (A) The fabrication of ECMprotein patterns and their application for NSC differentiation. (B) The selective at-tachment of NSCs on the protein patterns and differentation into two different kindsof neural cells. (C) The differentiation of NSCs into either neurons (red) or astrocytes(green) on the protein patterns. (D) Increased neuronal differentiation on the gridpatterns, as compared to the stripes and squares [68].
3.2.2 Results and Discussion
Extracellular matrix protein patterns with variant geometries and dimensions were fab-
ricated by initially patterning octadecanethiol (ODT, 5 mM in ethanol), a hydrophobic
alkanethiol, which formed self-assembled monolayers (SAMs) of squares, stripes, and
grids on glass substrates coated with a thin film (12 nm) of gold. In order to minimize
the non-specific attachment of laminin, the background of the substrates was passi-
vated by incubating in a solution (5 mM in ethanol) of tetraethylene glycol terminated
alkanethiol [EG4-(CH2)11-SH, 12 h]. After passivating the background, a solution of

102
ECM protein [e.g. laminin (10 µg/ml) in phosphate buffered saline (PBS) buffer, pH
7.4] was added onto the substrates (3 h) and was preferentially adsorbed onto the hy-
drophobic regions (ODT patterns). The selective adsorption of laminin on hydrophobic
regions was consistent with the results of other groups [235] and was also confirmed
by immunostaining using anti-laminin IgG (Figure 3.12). Only the patterned regions,
coated with ECM proteins, promoted cell adhesion and growth whereas the rest of
the substrate remained inert (Figure 3.11). We similarly patterned several different
ECM proteins including fibronectin and collagen, but found that laminin provided the
optimum microenviromental cues for NSC adhesion and growth. Hence, all our differ-
entiation studies were carried out using laminin patterns.
Figure 3.12: Immunostaining with anti-laminin IgG. The laminin patterns generatedwere confirmed using anti-laminin IgG (Sigma). Consistent results were obtained andreproduced for the three different geometries (A) Stripes, (B) Sqaures, and (C) Gridshaving varying dimensions. Scale bars: 20 µm [68].
Differentiating neural stem cells on ECM protein patterns
To examine the effect of the ECM protein patterns on stem cell differentiation, primary
rat hippocampal neural stem cells (Millipore) were first expanded and maintained in
an undifferentiated state in a homogeneous monolayer on a polyornithine and laminin-
coated Petri dish in a defined serum-free growth medium [DMEM/F12 supplemented
with B27 and basic fibroblast growth factor (bFGF, 20 ng/ml)]. For obtaining re-
producible and consistent results, all experiments were carried out using NSCs from
passages 2-5 at a constant cell density of 150,000 cells per substrate (1.5 cm x 1.5
cm), which was optimum for cell growth without clustering. Arresting the proliferation
of NSCs and initiating their spontaneous differentiation was achieved by withdrawing

103
bFGF from the culture medium (resulting in basal medium), without the additional
treatment with exogenous factors (proteins and small molecules). The basal medium
(2 mL) containing the NSCs (75,000 cells/ml) was put in a single well of a 6-well
plate containing a substrate with laminin patterns. After the NSCs attached onto the
laminin patterns (1 hr), the substrates were rinsed with copious amounts of media in
order to minimize non-specific interactions of NSCs with the passivated areas, and then
incubated in fresh basal medium. The media was exchanged with fresh media every
other day. During our screening approach to investigate the function of physical cues
on neuronal differentiation of NSCs, we monitored the differentiation on ECM protein
patterns by using two orthogonal assays, namely immunocytochemical and morpho-
logical assays. To assess the differentiation of NSCs, the down-regulation of the NSC
marker (Nestin) and the geometry-dependent expression of the neuronal marker (β-III
Tubulin, TuJ1) and glial marker (glial fibrillary acidic protein, GFAP) were monitored.
In addition, the development of branches or spindle-like morphologies, and neurite out-
growths were observed by using an inverted phase contrast microscope (Zeiss Axiovert
200M equipped with AxioCam CCD).
Neuronal differentiation is dependent on the geometry of ECM micropat-
terns
Patterns of ECM proteins with different geometries contributing to adhesion, prolif-
eration, growth and migration of various cells (including stem cells) have been re-
ported [236, 237]. For instance, striped patterns have been routinely used for generat-
ing patterns of neurons on a variety of surfaces. We initially hypothesized (taking into
consideration the morphology and polarity of neurons) that striped laminin patterns
could potentially result in the neuronal differentiation of a high number of NSCs [238].
However, we found that the NSCs on isolated stripes, having no interactions with the
NSCs on adjacent stripes (Figure 3.13A1, differentiated into neurons to a lesser extent
(36.0%, Figure 3.13A2 and Figure 3.14) as compared to the NSCs which crossed the
passivation layer to interact with the NSCs on adjacent stripes. We thus concluded

104
that NSCs involved in a one-way interaction (with NSCs along the same stripe) differ-
entiated into neurons to a lesser extent than the NSCs involved in interactions between
adjacent stripes. These results were consistent with reports from the literature wherein
cell-cell interactions have been shown to play a critical role in the differentiation of
adult stem cells. For instance, it was recently shown that cell-cell interactions played
an important role in the osteogenic (bone) differentiation of MSCs.[23]
To further confirm the influence of such interactions on the differentiation of NSCs,
we used square patterns of laminin to isolate NSCs and restrict their growth within the
square patterns (Figure 3.13B1). We hypothesized that the differentiation behaviour
of NSCs can be considerably influenced by limiting cell-cell interactions. We observed
that NSCs patterned on squares, having the same dimensions and spaces as the stripes,
differentiated into neurons to a considerably lesser extent (28.1%, Figure 3.13B2 and
Figure 3.14) as compared to the NSCs involved in one-way interactions on the striped
laminin patterns.
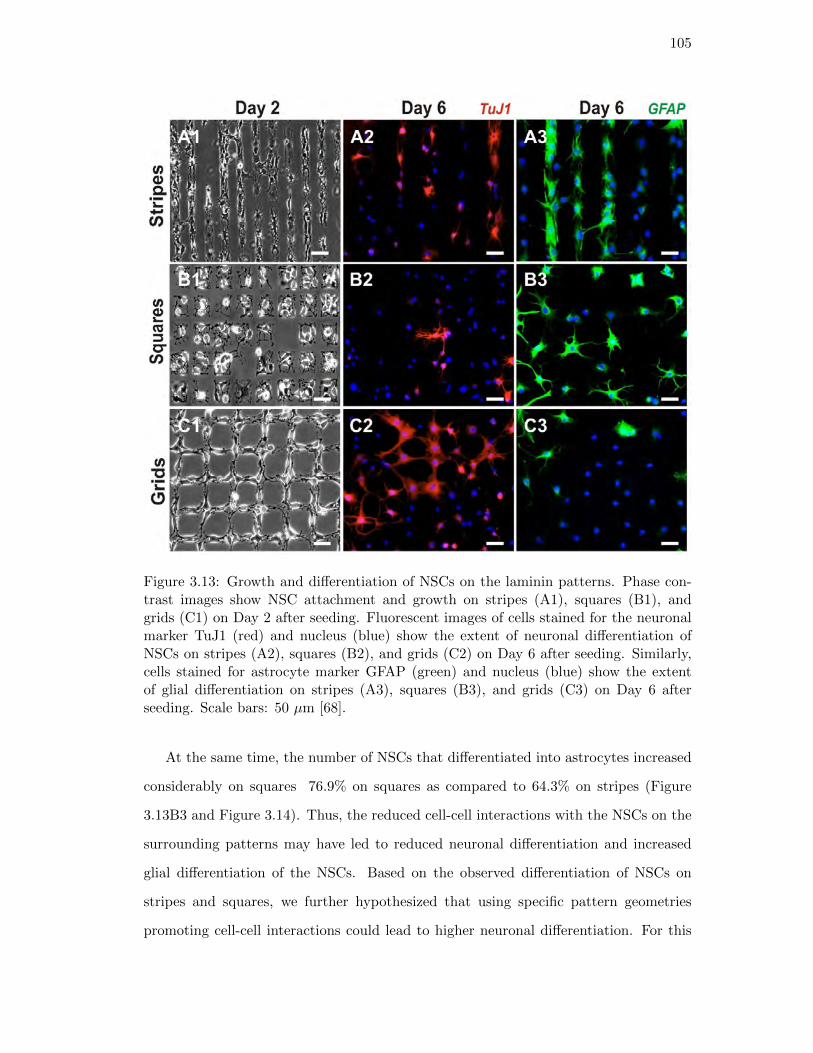
105
Figure 3.13: Growth and differentiation of NSCs on the laminin patterns. Phase con-trast images show NSC attachment and growth on stripes (A1), squares (B1), andgrids (C1) on Day 2 after seeding. Fluorescent images of cells stained for the neuronalmarker TuJ1 (red) and nucleus (blue) show the extent of neuronal differentiation ofNSCs on stripes (A2), squares (B2), and grids (C2) on Day 6 after seeding. Similarly,cells stained for astrocyte marker GFAP (green) and nucleus (blue) show the extentof glial differentiation on stripes (A3), squares (B3), and grids (C3) on Day 6 afterseeding. Scale bars: 50 µm [68].
At the same time, the number of NSCs that differentiated into astrocytes increased
considerably on squares 76.9% on squares as compared to 64.3% on stripes (Figure
3.13B3 and Figure 3.14). Thus, the reduced cell-cell interactions with the NSCs on the
surrounding patterns may have led to reduced neuronal differentiation and increased
glial differentiation of the NSCs. Based on the observed differentiation of NSCs on
stripes and squares, we further hypothesized that using specific pattern geometries
promoting cell-cell interactions could lead to higher neuronal differentiation. For this

106
purpose, we used grid patterns of laminin, having the same dimensions as the stripe and
square patterns, for NSC growth and differentiation. The grid patterns were specifi-
cally designed to increase cell-cell interactions in a controlled manner by promoting
two-way interactions, (Figure 3.13C1). After six days in basal medium, as compared
to the NSCs patterned on stripes and squares of laminin, we observed a remarkable
increase in the number of NSCs that underwent neuronal differentiation (45.6%, Figure
3.13C2 and Figure 3.14) and a decrease in the number of cells that underwent glial
differentiation on grid patterns of laminin (49.6%, Figure 3.13C3 and Figure 3.14).
All the experiments were repeated several times under the same conditions. To main-
tain consistency and minimize the effects from other variables, we fabricated and used
PDMS stamps to generate ECM protein patterns of all the three geometries (having
the same dimensions and spacing) on the same substrate. Using this method, we could
reproduce and confirm our results with relative ease. Neuronal and glial differentiation
of NSCs was also monitored on control substrates which included substrates coated
with laminin (unpatterned) and substrates without laminin. The NSCs on substrates
without laminin did not attach and failed to survive, whereas 32.5% of the NSCs on
the unpatterned substrates coated with laminin differentiated into neurons and 71.2%
of the NSCs differentiated into astrocytes six days after seeding.

107
Figure 3.14: Quantitative comparison of the percentage of cells expressing the neuronalmarker TuJ1 and astrocyte marker GFAP on laminin patterns of squares, stripes andgrids. Six days after seeding, the differentiated cells were counted and plotted as aratio of TuJ1-positive cells or GFAP-positive cells to the total number of cells (n=3).Students unpaired t-test was used for evaluating the statistical significance for cellsstained for TuJ1 on stripes and squares, compared to those on grids.(* = P <0.01, **= P <0.001) [68].
Neuronal differentiation is influenced by the size of ECM micropatterns
In addition to investigating the effect of pattern-geometry, we also studied the effect of
dimensions on NSC differentiation. To this end, we generated ten different dimensions
for each of the geometries, ranging from sizes as small as 10 µm and as large as 250 µm
(Figure 3.15). Interestingly, for the three different geometries above 50 µm, we observed
little difference in the percentage of NSCs undergoing neuronal and glial differentiation.
The result observed for pattern dimensions above 50 µm was similar to that observed
with unpatterned substrates. We believe the cells may not be able to sense the difference
in pattern geometries above 50 µm and thus show similar behaviour to the cells on
unpatterned substrates. Since the NSCs showed remarkable difference in differentiation
on patterns ranging from 10-50 µm, all of our statistical analysis and investigation was
done using pattern features within this range.

108
Figure 3.15: NSC alignment and differentiation on combinatorial ECM patterns. (A)NSCs on grids of laminin express the neural stem cell marker, nestin (purple) on Day2 after seeding, thus confirming that the NSCs are undifferentiated. (B) NSCs stainedfor actin (green) show extensive spreading and cell-cell interactions on grid patterns oflaminin on Day 2 after seeding, confirming that the NSCs, while still in the undiffer-entiated state, extensively interact with each other. (C) SEM image of NSCs on Day2 after seeding, showing the early alignment and extension of processes on grid pat-terns of laminin. (D) NSCs previously shown to extend and grow on the grid patternsof laminin undergo neuronal differentiation and express the neuronal marker synapsin(pseudocolored yellow) on Day 6 after seeding. Scale bars: 20 µm [68].
We observed that the laminin patterns of all three geometries enabled the NSCs
to attach and grow within a day or two day after seeding. By staining for actin us-
ing phalloidin and using field emission scanning electron microscopy (FESEM, Zeiss
Gemini), we further observed that the cytoskeleton of the NSCs aligned well within
the laminin patterns, guiding cellular morphology and interactions (Figure 3.15B and
C). To confirm that the laminin patterns influenced morphological changes before dif-
ferentiation (as opposed to an early differentiation of NSCs which might have caused
a change in alignment and morphology), the NSCs were immunostained for the neural
stem cell marker nestin two days after seeding in basal medium. We observed that
most of the NSCs that aligned along the patterns, stained positive for nestin (Figure
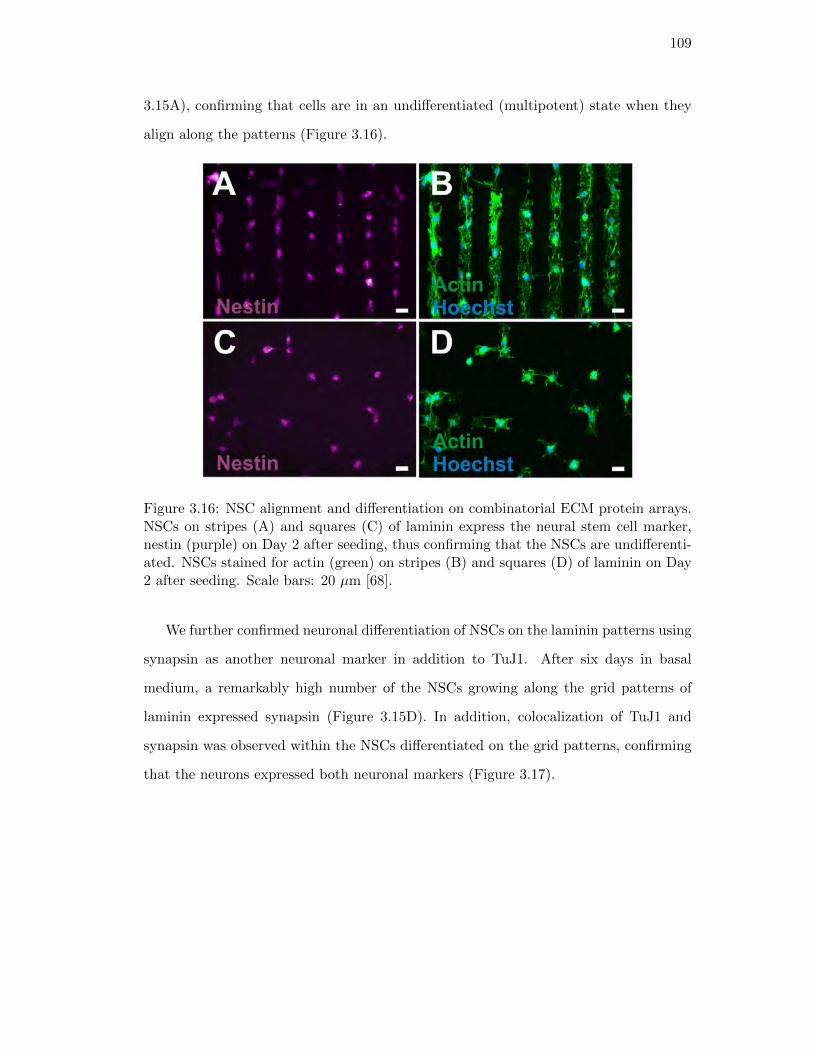
109
3.15A), confirming that cells are in an undifferentiated (multipotent) state when they
align along the patterns (Figure 3.16).
Figure 3.16: NSC alignment and differentiation on combinatorial ECM protein arrays.NSCs on stripes (A) and squares (C) of laminin express the neural stem cell marker,nestin (purple) on Day 2 after seeding, thus confirming that the NSCs are undifferenti-ated. NSCs stained for actin (green) on stripes (B) and squares (D) of laminin on Day2 after seeding. Scale bars: 20 µm [68].
We further confirmed neuronal differentiation of NSCs on the laminin patterns using
synapsin as another neuronal marker in addition to TuJ1. After six days in basal
medium, a remarkably high number of the NSCs growing along the grid patterns of
laminin expressed synapsin (Figure 3.15D). In addition, colocalization of TuJ1 and
synapsin was observed within the NSCs differentiated on the grid patterns, confirming
that the neurons expressed both neuronal markers (Figure 3.17).
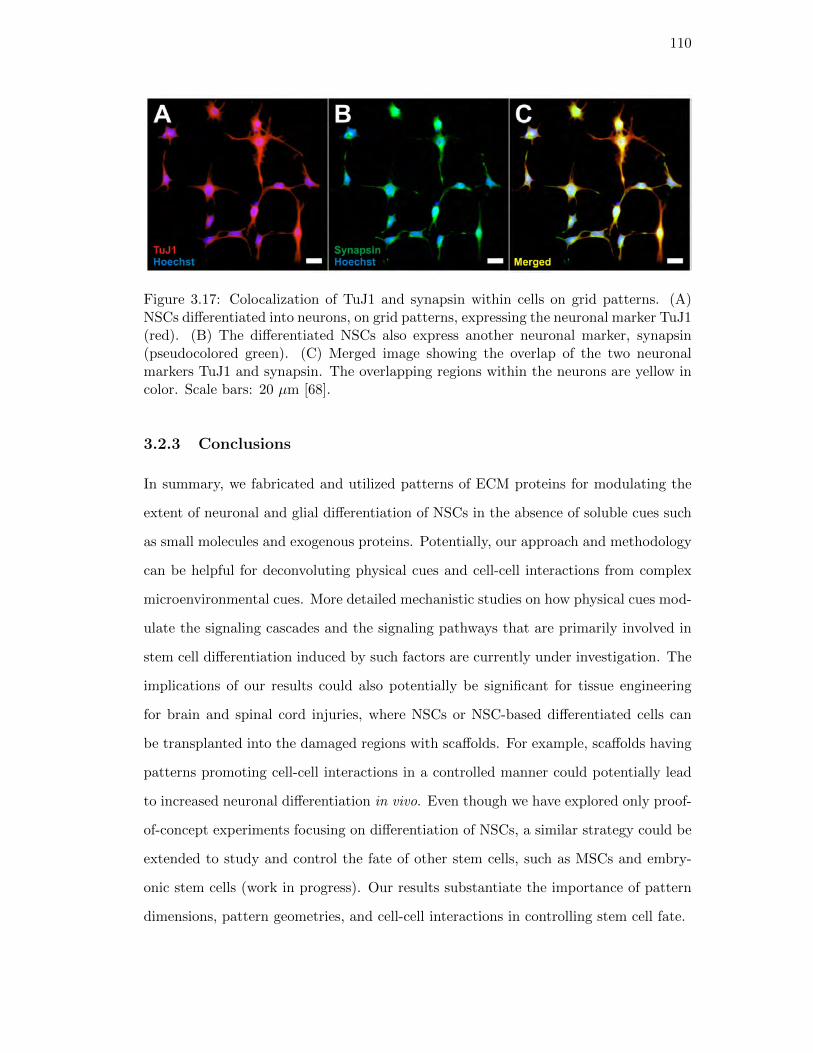
110
Figure 3.17: Colocalization of TuJ1 and synapsin within cells on grid patterns. (A)NSCs differentiated into neurons, on grid patterns, expressing the neuronal marker TuJ1(red). (B) The differentiated NSCs also express another neuronal marker, synapsin(pseudocolored green). (C) Merged image showing the overlap of the two neuronalmarkers TuJ1 and synapsin. The overlapping regions within the neurons are yellow incolor. Scale bars: 20 µm [68].
3.2.3 Conclusions
In summary, we fabricated and utilized patterns of ECM proteins for modulating the
extent of neuronal and glial differentiation of NSCs in the absence of soluble cues such
as small molecules and exogenous proteins. Potentially, our approach and methodology
can be helpful for deconvoluting physical cues and cell-cell interactions from complex
microenvironmental cues. More detailed mechanistic studies on how physical cues mod-
ulate the signaling cascades and the signaling pathways that are primarily involved in
stem cell differentiation induced by such factors are currently under investigation. The
implications of our results could also potentially be significant for tissue engineering
for brain and spinal cord injuries, where NSCs or NSC-based differentiated cells can
be transplanted into the damaged regions with scaffolds. For example, scaffolds having
patterns promoting cell-cell interactions in a controlled manner could potentially lead
to increased neuronal differentiation in vivo. Even though we have explored only proof-
of-concept experiments focusing on differentiation of NSCs, a similar strategy could be
extended to study and control the fate of other stem cells, such as MSCs and embry-
onic stem cells (work in progress). Our results substantiate the importance of pattern
dimensions, pattern geometries, and cell-cell interactions in controlling stem cell fate.

111
3.2.4 Materials and Methods
Synthesis and Characterization of EG4-(CH2)11-SH
Tetraethyleneglycol (29.7 g, 153 mmoles) was dissolved in 75 ml of dry dimethylfor-
mamide under nitrogen. This solution was cooled to 0◦C and NaH (1.22 g of 60% in
mineral oil, 30.6 mmoles) was added in portions. After stirring at room temperature
for one hour, 7.5 g of undecenyl bromide (30.6 mmoles of 95% purity) was added and
the reaction was stirred at room temperature overnight. The reaction was then diluted
with 75 ml of water and extracted with 4 x 50 ml of hexane. The combined extracts
were then washed with 2 x 20 ml of water, 20 ml of saturated brine, dried over MgSO4,
filtered and the solvent evaporated in vacuo. The crude product thus obtained was
chromatographed on silica gel eluting with 2:1, 1:2 hexane/ethyl acetate and then with
100% ethyl acetate. The product was a light-yellow oil weighing 7.1 g (64%). The
proton NMR was consistent with the desired product.
The alkene obtained previously (7.1 g, 20.5 mmoles) and thiolacetic acid (6.24 g,
82.0 mmoles) were dissolved in 75 ml of THF and this solution was deoxygenated with
nitrogen. After the addition of 50 mg of AIBN, it was irradiated with 254 nm UV light
overnight. The solvent was then removed in vacuo and the residue was evaporated with
3 x 50 ml of toluene to remove thiolacetic acid. The crude product so obtained was
chromatographed on silica gel eluting with 2:1, 1:1, 1:2 hexane/ethyl acetate and finally
with 100% ethyl acetate. The intermediate thioacetate product was a colorless liquid
weighing 7.2 g. The proton NMR was consistent with the desired product.
The intermediate obtained above (3.0 g, 7.10 mmoles) was dissolved in a mixture

112
of 1.5 ml of conc. hydrochloric acid and 30 ml of 95% EtOH which had been deoxy-
genated with nitrogen and this solution was refluxed under nitrogen overnight. It was
then cooled to room temperature and the solvent removed in vacuo. The residue was
partitioned between 30 ml of saturated NaHCO3 solution and 30 ml of ethyl acetate.
The phases were separated and the aqueous phase was extracted with 2 x 30 ml of
ethyl acetate. The combined extracts were dried over MgSO4, filtered and the solvent
removed in vacuo. The product was a yellow liquid weighing 2.6 g (96%). The proton
NMR was consistent with the desired product. MS: M+380.9
Generating ECM protein patterns
Polycrystalline Au films were prepared by thermally depositing 5 nm thick Ti layer
followed by 20nm Au deposition (1.5 cm x 1.5 cm) on cover glass substrates (Fisher
No. 1) under a high vacuum condition (base pressure 5 x 10⁻⁶ torr). For micro contact
printing, the molded PDMS stamps was prepared by conventional photolithography and
5mM 1-octadecanethiol (ODT) was used as ink molecule. The various patterns were
designed using AutoCAD so as to incorporate more multiple geometries having varying
dimensions on each stamp. Pattern dimensions and spacings for each of the geometries
(stripes, squares, and grids) ranged from 10 µm to 250µm. After patterning the ODT
SAMs on the thin gold films, the background was passivated using EG4-(CH2)11-SH, a
protein resistant thiol. The ECM proteins (from Sigma) such as laminin (10 µg/ml),
collagen (50 µg/ml), and fibronectin (50 µg/ml) and their combinations were adsorbed
on the ODT SAMs by incubating the protein solution of the SAMs for 3 h at room
temperature. The protein micropatterns were then rinsed with sterile phosphate buffer
saline pH 7.4 (PBS) multiple times and 2 ml suspensions of NSCs were seeded with
density of 7.5 x 10⁴ /ml (in basal medium) in a 6-well plate. The samples were incubated
for 30 min at 37◦C and each culture well containing the samples was washed gently with
the NSC basal medium to remove the NSCs weakly attached on the substrate. It was
observed that laminin provided the most optimum microenvironment for the adhesion
and growth of the NSCs, hence all the experiments were carried out with laminin as
the ECM protein. The laminin micropatterns were confirmed using anti-laminin.

113
Rat neural stem cell (NSC) culture and differentiation
Rat neural stem cell line (Millipore) were purchased and routinely expanded accord-
ing to the manufactures protocol. The NSCs were maintained in laminin (Sigma, 20
µg/ml) coated culture dishes precoated with poly-L-lysine (10 µg/ml) in DMEM/F-
12 media (Invitrogen) supplemented with B-27 (Gibco) and containing L-Glutamine
(2 mM, Sigma), and antibiotics penicillin and streptomycin (Invitrogen) in the pres-
ence of basic fibroblast growth factor (bFGF-2, 20 ng/ml, Millipore). All the cells
were maintained at 37◦C in a humidified atmosphere of 5% CO2. For consistency, the
experiments were carried out on the cells between passages 2 and 5. Neural differen-
tiation was initiated by changing the medium to basal medium (without bFGF-2) on
the laminin micropatterns. The cells were allowed to differentiate for 6 days, with the
basal medium in each being exchanged every other day.
Immunocytochemistry
To investigate the extent of neuronal differentiation, at Day 6, the basal medium was
removed and the cells fixed for 15 minutes in Formalin solution (Sigma) followed by two
PBS washes. Cells were permeabilized with 0.1% Triton X-100 in PBS for 10 minutes
and non-specific binding was blocked with 5% normal goat serum (NGS, Invitrogen)
in PBS for 1 hour at room temperature. To study the extent of neuronal differentia-
tion the primary mouse antibody against TuJ1 (1:500, Covance) and primary mouse
antibody against Synapsin (1:500, Santa Cruz Biotechnology) was used and for glial
differentiation the primary rabbit antibody against GFAP (1:500, Dako) was used. The
fixed samples were incubated overnight at 4◦C in solutions of primary antibodies in PBS
containing 10% NGS. After washing three times with PBS, the samples were incubated
for 1 h at room temperature in solution of anti-mouse secondary antibody labelled with
Cy3 and anti-rabbit secondary antibody labelled with Cy2 (1:400, Jackson ImmunoRe-
search), Hoechst (1:500, Invitrogen) in PBS containing 10% NGS to observe neuronal
and glial differentiation. After washing the samples thrice with PBS the substrates were

114
mounted on glass slides using ProLong Gold antifade (Invitrogen) to minimize quench-
ing by gold. To confirm that the NSCs on the micropatterns were undifferentiated at
Day 2, the cells were similarly fixed and immunostained with primary and secondary
antibodies. The primary rabbit polyclonal antibody against neural stem cell marker,
nestin (1:400, Santa Cruz Biotechnology, Inc) was used. The secondary anti-rabbit an-
tibody used was labelled with Cy5 (1:400, Jackson ImmunoResearch). Phalloidin (1:75,
Invitrogen) labelled with Alexa-546 was added to the secondary antibody solution to
observe the actin cytoskeleton and alignment of the NSCs along the patterns. The
mounted samples were imaged using Ziess. ImageJ (NIH) was used for comparative
analysis of fluorescence signals of TuJ1 on the various pattern geometries of different
dimensions, and on control samples (only laminin, no patterns).

115
3.3 Nanoparticle Arrays Decorated with Graphene Align Axons and
Enhance Neuronal Differentiation of Human Neural Stem Cells
3.3.1 Introduction
The ability to utilize substrate topography to control stem cell fate has great potential
in regenerative medicine. Biomaterials for stem cell transplantation, using scaffolds
and implantable devices, are now being designed in a manner that elicits specific cel-
lular responses such as differentiation, migration and proliferation in response to the
topographical cues. For spinal cord and peripheral nerve injuries, neuronal response to
topography is critical as it is the specific guidance of axons that would lead to thera-
peutic solutions within the injured spinal cord [239]. If the nerve gaps created due to
injuries are large, the distal and proximal sides of the damaged nerves will not be able
to communicate efficiently, thus impeding the natural regeneration process [240]. As a
result, a significant amount of emphasis is being placed upon the directional growth of
axons within the injured spinal cord, thus making axonal alignment an important factor
in designing biomaterials [240,241]. To this end, neural stem cells (NSCs), which differ-
entiate into neurons and glial cells, have been transplanted within injured spinal cords as
they hold great promise for hastening functional recovery [241–243]. We have previously
shown that the growth, differentiation and polarization of NSCs is strongly influenced
by the cell-cell interactions and cell-extracellular matrix (ECM) interactions [68, 71].
Furthermore, ECM proteins patterns and patterned nanotopographical features have
been routinely employed to control the polarity, directional growth and influence the
neuronal differentiation of NSCs [68, 145, 244, 245]. The challenge, however, is to pro-
vide an instructive microenvironment to the NSCs, through the use of novel materials,
that can spontaneously lead to axonal alignment in the hopes of developing better
treatments for spinal cord injuries. We believe the growth, differentiation and survival
of well-aligned adult human neural stem cells (hNSCs) holds tremendous promise for
regeneration of damaged neurons as they would help bridge the gaps between the prox-
imal and distal ends of transected nerves thus aiding in restoring communication at the
site of injury.

116
Graphene, a monolayer of carbon atoms arranged in a 2D honeycomb lattice [246],
has been shown to be a very useful material in biomedical applications [73, 247, 248]
due to its excellent flexibility, thermal properties, electrical conductivity, high strength,
stiffness and biocompatibility [249]. Recently, the properties of graphene and its bio-
compatibility have inspired research groups to use graphene for tissue engineering [250].
For instance, graphene has been shown to support the proliferation and differentiation
of adult and pluripotent stem cells [73,251]. Due to its superior chemical stability that
facilitates integration with neural tissues, we believe culturing and differentiating hN-
SCs on graphene would be an ideal model to clearly demonstrate its advantages [73,252].
Furthermore, it was demonstrated that nanotopographical features using silica beads
led to the acceleration of hippocampal neurons in vitro [253]. We thus hypothesized
that substrates which consisted of nanotopographical features decorated with graphene
would be an ideal platform to investigate the growth and differentation of hNSCs. To-
wards this end, we have created nanotopographical features on a substrate using silica
nanoparticles and decorated them with chemically derived graphene. We show that
these substrates create an ideal microenvironment for the growth, alignment and en-
hanced neuronal differentiation of hNSCs. In particular, chemically derived graphene
or graphene oxide (GO) is a chemically versatile compound that contains oxygen func-
tional groups attached to the graphene basal plane. The oxygen functional groups allow
the GO nanosheets to readily attach to molecules or surfaces - in our case they decorate
the surface of 300 nm silica spheres. The control and test substrates used to grow and
differentiate hNSCs in this study are shown in Figure 3.18a.

117
Figure 3.18: Schematic diagram depicting the influence of nanoparticle (NP) monolayerscoated with graphene oxide (GO) on the alignment of the axons, extending from hNSCs,and the differentiation of hNSCs into neurons. (a) Different conditions for differentiatinghNSCs into neurons. (b) hNSCs cultured and differentiated on Substrate D having amonolayers of NPs coated with GO show enhanced neuronal differentiation and axonalalignment. The differentiated hNSCs (orange) and the NPs-coated with GO (blue) inthe SEM image have been pseudocolored to enhance the contrast. (Inset) Zoom-inimage showing the axons aligned on a monolayer of NPs coated with GO.
3.3.2 Results and Discussion
Human NSCs align on GO and SiNP-GO substrates
Initially all of the substrates were treated with the ECM protein laminin (10 µg/mL for
4 h), which is essential for the adhesion, growth, and differentiation of hNSCs. It should
be noted that the laminin was not patterned on the substrates nor was any patterning
of the protein observed using atomic force, optical, or scanning electron microscopies
after adsorption. Human NSCs were then seeded onto these substrates and prolifer-
ated in culture media containing basic fibroblast growth factor (bFGF, 20 ng/mL) and
epidermal growth factor (EGF, 20 ng/mL). After 24 h, differentiation was initiated by
withdrawing the culture medium and replacing it with basal medium lacking growth
factors. Immunocytochemistry and quantitative polymerase chain reaction (qPCR)
was performed on the differentiated hNSCs after 14 days to investigate the influence of
SiNP, GO and SiNP-GO on neuronal differentiation. On Day 2, after removal of the

118
growth factors, the hNSCs on all substrates were observed to have attached well and
were proliferating. The hNSCs continued to proliferate and extended in random direc-
tions until Day 5, after which they began aligning on the GO and SiNP-GO substrates.
Finally, the differentiated hNSCs on the GO and SiNP-GO substrates on Day 14 were
very well aligned and had well-extended axons (Figure 3.19a). On the other hand, the
control hNSCs, which differentiated on the SiNP and glass substrates, also had extended
axons, but showed no alignment. To quantify this, we calculated the variation in the
angle of orientation of axons extending from hNSCs on substrates containing GO and
compared it with the orientation of the axons from hNSCs differentiated on the control
SiNP and glass substrates. Our calculations confirmed that the variation in the angle
of orientation of axons from hNSCs on the GO and SiNP-GO was ±17.8◦ and ±9.16◦
respectively (Figure 3.19biii-iv), while the axons from the hNSCs on glass and SiNP
extended randomly, having a much wider variation of ±42◦ and ±46.11◦, respectively,
in the angle of their orientation (Figure 3.19bi-ii).
Figure 3.19: Aligned growth and extension of axons from differentiated hNSCs andcompass plots showing the variation in the angle of orientation and the lengths of theaxons. (a) Differentiated hNSCs are immunostained with TuJ1 (red). The axons showno alignment on glass and SiNPs, whereas the axons are significantly aligned on GOand SiNP-GO. (Scale bars: 10 µm)( b) The compass plots show a large variation inthe angle of orientation of axons on glass (±42◦) and SiNPs (±46.11◦) and minimalvariation on GO (±17.8◦) and SiNP-GO (±9.16◦). The compass plot also shows thataxons extending on SiNP and SiNP-GO are longer than those extending on glass andGO.
The images clearly show that the axons extending from differentiated hNSCs aligned

119
exclusively on substrates having GO as a component of the ECM. Recently, self-
assembled silica beads were shown to significantly accelerate the extension of axons
from hippocampal neurons cultured on the beads [253]. We thus investigated the in-
fluence of nanotopographical features on the length of axons extending from hNSCs.
We calculated the lengths of the extending axons from the hNSCs differentiated on
the different substrates on Day 14. The average length of the axons extending from
hNSCs cultured on SiNPs was 20.76% more than the average length of those cultured
on glass, and 11.3% more than those cultured on GO (Figure 3.19b). We therefore hy-
pothesize that the alignment of axons is exclusively due to the presence of GO within
the ECM while the presence of the underlying SiNP monolayer leads to an increase
in the average length of axons from hNSCs differentiated on SiNP-GO. This behavior
of hNSCs was also confirmed using SEM (Figure 3.20a). It is important to note that
we are currently investigating the underlying principles that govern the alignment of
hNSCs in our lab. At this moment we are unable to control the direction of axonal
alignment. However, a better understanding of the underlying mechanisms will enable
us to control the direction of alignment in the future.
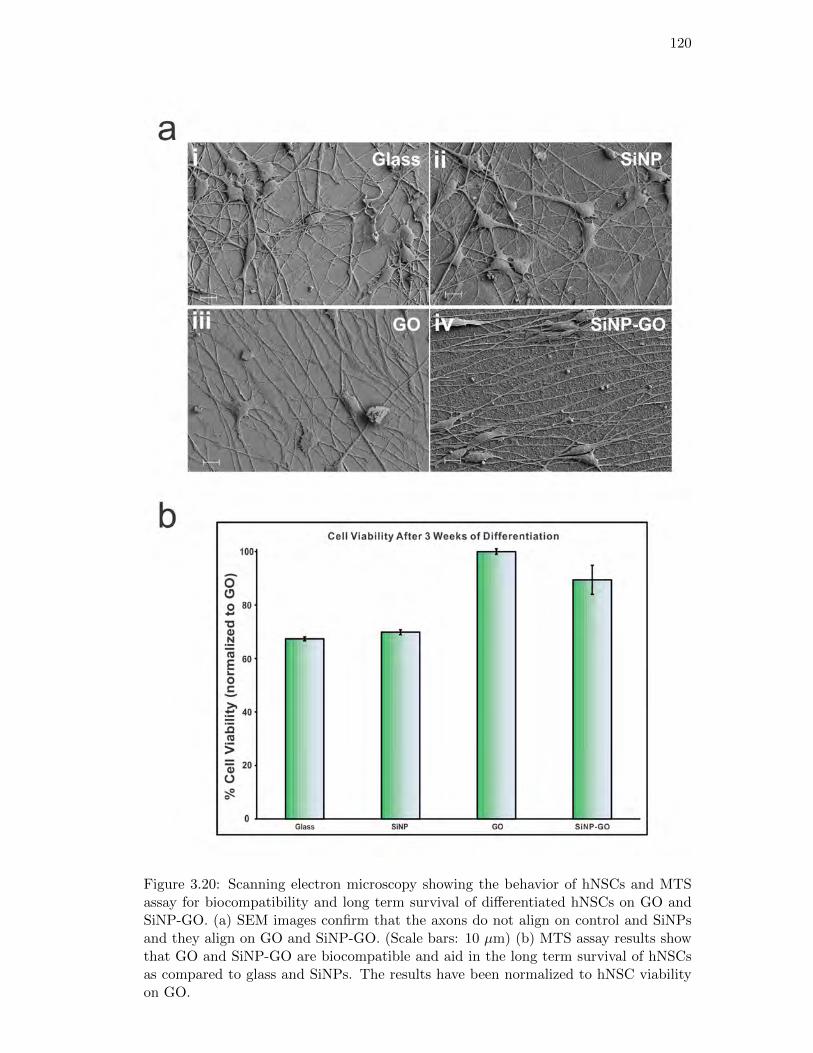
120
Figure 3.20: Scanning electron microscopy showing the behavior of hNSCs and MTSassay for biocompatibility and long term survival of differentiated hNSCs on GO andSiNP-GO. (a) SEM images confirm that the axons do not align on control and SiNPsand they align on GO and SiNP-GO. (Scale bars: 10 µm) (b) MTS assay results showthat GO and SiNP-GO are biocompatible and aid in the long term survival of hNSCsas compared to glass and SiNPs. The results have been normalized to hNSC viabilityon GO.

121
We then went on to investigate whether the alignment of axons on GO and SiNP-GO
was due to crowding of hNSCs and thus depended on the density of the seeded cells.
It has been shown that differences in cell density can yield a noticeable difference in
cell alignment [254]. To this end, we reduced the cell density by 50% and observed the
behavior of the hNSCs over a period of two weeks. We observed that the cells behaved
in the same manner, even at the lower cell density (Figure 3.21). This is a remarkable
behavior, which we believe could be very useful, especially for developing scaffolds for
restoring neuronal functioning within damaged regions of the central nervous system.
Figure 3.21: Axonal alignment and cell density. Phase contrast images showing axonalalignment of differentiated hNSCs cultured on SiNP-GO at different initial seedingdensities. The axonal alignment was observed even when the initial seeding densitywas reduced by 50%.
GO and SiNP-GO substrates enhance cell survival
The prerequisite for materials used to control cell behavior or develop scaffolds is that
they should be biocompatible. In the case of regenerative medicine, the materials
not only have to be biocompatible but must also support stem cell differentiation and
survival for long periods of time. As a potentially advantageous material for tissue
engineering, graphene has also been shown to support the long-term survival and induce
neuronal differentiation of hNSCs [73]. As such, we used a standard cell viability assay
(MTS assay) to confirm that the GO and SiNP-GO substrates significantly enhanced
cells survival after 3 weeks of differentiation as compared to the control SiNP and glass

122
substrates (Figure 3.20b). This is particularly advantageous for stem cell biology and
regenerative medicine as the differentiating stem cells are required to grow, differentiate
and survive to have beneficial and lasting effects.
Neuronal differentiation of hNSCs
We investigated the expression of immature and mature neuronal markers in the dif-
ferentiated hNSCs after two weeks. Our immunostaining data showed that most of the
aligned axons from differentiated hNSCs showed the expression of the neuronal marker
TuJ1, and also the presence of mature neuronal markers such as MAP2 and synapsin
(Figure 3.22a). We also confirmed the expression of axonal marker, GAP43. While the
immunostaining data confirmed the presence of the neuronal markers, we could not use
this data to quantify expression levels of the neuronal markers on the GO and SiNP-GO
as compared to the SiNP and glass substrates. We thus performed qPCR analyses of
the mRNA expression levels of the neuronal markers from the hNSCs differentiated on
GO and SiNP-GO substrates and compared it to hNSCs differentiated on SiNP and
glass substrates. While the expression levels of all neuronal and axonal markers were
up-regulated on all substrates as compared to the control glass substrates, we found that
the hNSCs differentiated on SiNP-GO substrates showed the highest expression levels
of all neuronal markers such as TuJ1, MAP2 and synapsin (Figure 3.22b). Thus, we can
conclude that the combined effect of having SiNP and GO on a single platform shows
increased neuronal differentiation and remarkable alignment of differentiated hNSCs.

123
Figure 3.22: Enhanced neuronal differentiation of hNSCs on SiNP-GO. (a) hNSCsspontaneously differentiated on SiNP-GO show the presence of early stage neuronalmarker TuJ1(red) and late stage neuronal markers MAP2 (pseudocolored yellow) andsynapsin (pseudocolored purple). They also highly express the axonal marker GAP43(green). (Scale bar: 10 µm) (b) Quantitative RT-PCR (qPCR) results for early andlate stage neuronal markers expressed by the hNSCs differentiated on the differentsubstrates. The results are normalized to the expression levels of the neuronal markersin hNSCs differentiated on glass. N=4 and ∗P <0.05, ∗∗P <0.01 compared to hNSCsdifferentiated on glass. The results clearly show that hNSCs differentiated on SiNP-GOshow significantly enhanced expression of early and late stage neuronal markers. Theexpression of axonal marker GAP43 increases due to the presence of SiNP monolayers.
Axonal alignment on pristine graphene
We also used pristine graphene deposited on glass, using chemical vapor deposition
(CVD), to investigate if the differentiating hNSCs align on graphene as opposed to GO.
Although this behavior has not been previously reported, we did observe alignment of

124
cells on pristine graphene, similar to the alignment observed on GO (Figure 3.23).
Figure 3.23: Axonal alignment on pristine graphene. Phase contrast image showingaxonal alignment of differentiated hNSCs on pristine graphene. (Scale bar: 10 µm)
However, the water solubility of GO and the presence of functional groups allows
positively charged SiNP monolayers to be readily coated with GO, by simply dipping
once into the solution of GO. Another factor that has to be considered is the interaction
of the ECM protein, laminin, with graphene. Proteins have been shown to have higher
and faster immobilization on GO, as compared to pristine graphene, due to the abun-
dant surface oxygen-containing groups such as epoxide, hydroxyl and carboxyl groups
present on GO [255]. The presence of these polar functional groups on GO makes the
GO-coated substrates very hydrophilic as compared to the pristine graphene-coated
substrates, which significantly affects the adsorption of proteins [251]. We thus believe
that laminin, which is dissolved in water, readily assembles on GO as it is water soluble
in contrast to pristine graphene, which is hydrophobic. Considering these factors, we
believe GO is more advantageous for decorating SiNPs and align hNSCs as compared
to graphene.
From our experiments, it was clear that the axonal alignment was due to the pres-
ence of graphene as component of the ECM. Therefore, we further investigated if the
axonal alignment was due to the unique structure of graphene, which is composed of
carbon atoms in a hexagonal lattice. For this purpose, we chose another novel material,

125
molybdenum disulfide (MoS2), which is from the family of two dimensional layered tran-
sition metal dichalcogenides and has a physical structure similar to that of graphene.
Nanoflakes of MoS2 were deposited on glass substrates, onto which laminin was assem-
bled. We then grew and differentiated hNSCs on MoS2. We observed that the hNSCs
grew well on MoS2 but showed no alignment, thus confirming that the unique structure
of graphene causes the hNSCs to align (Figure 3.24).
Figure 3.24: Human NSCs differentiated on molybdenum disulfide (MoS2). Phasecontrast image showing hNSCs differentiated on molybdenum disulfiude. (Scale bar:20 µm)
Human NSC alignment on flexible polymeric substrates
For potential therapeutic applications in regenerative medicine, it is crucial to demon-
strate the alignment and enhanced neuronal differentiation using flexible and biocom-
patible polymeric substrates which can be transplanted in vivo. We thus reproduced our
results using flexible and biocompatible polymeric substrates made from polydimethyl-
siloxane (PDMS), a polymer which has been widely used for implantable neural devices
such as flexible microelectrodes and three-dimensional scaffolds for tissue engineer-
ing [256, 257]. We prepared monolayers of SiNPs on thin, flexible PDMS substrates
by stamping the PDMS substrates on monolayers of SiNPs generated on glass cover
slips. The stamping led to clean and complete transfer of the SiNP monolayers on
the PDMS surface (Figure 3.25a-b). We then dipped the PDMS substrates having

126
SiNPs into a solution of GO and dried the substrates using a steam of pure nitro-
gen gas. We achieved high-quality of SiNP monolayers coated with GO using PDMS.
Control substrates were similarly prepared using PDMS polymer instead of glass. We
then coated these substrates with laminin and differentiated the hNSCs as before. We
observed that the differentiating hNSCs showed excellent alignment of axons on the
PDMS substrates containing GO and SiNP-GO. SEM image analysis confirmed that
the presence of SiNP-GO led to the alignment of axons as previously observed (Figure
3.25c). Immunostaining confirmed the presence of neuronal marker TuJ1 and axonal
marker GAP43 (Figure 3.25d). We believe our results using flexible implantable poly-
meric substrates further demonstrates the potential of using SiNP-GO as a new hybrid
material for enhancing neuronal differentiation and aligning axons, thus hastening the
functional recovery of injured spinal cords.
Figure 3.25: Axonal Alignment of differentiated hNSCs on SiNP-GO on flexible andbiocompatible substrates made from polydimethylsiloane (PDMS). (a) SiNP-GO mono-layer on PDMS. (b) Flexible PDMS substrate with SiNP-GO in media for culturinghNSCs. (c) SEM image of SiNP-GO on PDMS substrate showing highly aligned axonsfrom hNSCs on Day 14. (d) Immunocytochemistry results showing the expression ofneuronal marker TuJ1 and axonal marker GAP43 in hNSCs.

127
3.3.3 Conclusions
In summary, we have demonstrated that the extracellular microenvironment consist-
ing of nanotopographical features decorated with GO provides instructive physical
cues that lead to enhanced neuronal differentiation of hNSCs along with significant
axonal alignment. We also demonstrated the alignment of differentiating hNSCs on
implantable, flexible polymeric substrates, which has tremendous potential use in re-
generative medicine. However, we believe a better understanding of the underlying
principles that govern the alignment of axons and the angle of their orientation would
allow us to completely manipulate the direction of alignment of axons. We envision
that the directional growth of axons using SiNP-GO can potentially be applied to de-
veloping GO-based materials for transplanting hNSCs into injured sites of the central
nervous system in order to efficiently repair impaired communication. Overall, we be-
lieve our hybrid nanostructures comprised of a nanoparticle monolayers coated with
GO have tremendous implications for the potential use of GO as a component for ECM
especially in the field of neurobiology.
3.3.4 Materials and Methods
Synthesis of chemically derived graphene, pristine graphene and MoS2 nanoflakes
Chemically derived graphene (CDG) or graphene oxide was obtained by the exfolia-
tion of graphite oxide made through the modified Hummers method. Details of this
method can be found elsewhere [258]. Thin films of graphene oxide can be formed from
this suspension either by dip coating, spin coating, drop-casting or vacuum filtration
methods.
Chemical vapor deposition (CVD) of graphene was done on copper by modifying
the conditions mentioned in [259,260] to obtain large area graphene. Copper foil (Alfa
Aesar, item No.13382) was annealed in Argon atmosphere for 30 mins at 1000◦C and
then methane was allowed into the furnace for two hours in the presence of argon at
1000◦C. Graphene thus formed on copper was transferred onto glass substrates after
spin coating PMMA (poly(methyl methacrylate)) and dissolving copper using 1M iron

128
chloride solution [260].
Bulk MoS2 powder was purchased from Sigma-Aldrich (item number 69860) and
exfoliated using lithium intercalation method to produce an aqueous suspension of
exfoliated MoS2 [261]. Thin films were made on glass substrates using vacuum filtration
method and single layer was confirmed through optical microscopy and AFM images.
Preparation of different substrates
The ECM protein in our experiments is laminin, which is essential for the adhesion,
growth, and differentiation of hNSCs. Furthermore, ECM protein patterns and nan-
otopographical features have been shown to play a significant role in controlling the
polarity of hNSCs and influence their neuronal differentiation [68,71,73]. We thus cre-
ated nanotopographical features within the ECM using monolayers of positively charged
silica nanoparticles (300 nm), as we have previously demonstrated [85,145], and coated
these monolayers with GO. Laminin was then adsorbed on these hybrid films to facil-
itate the attachment of hNSCs. We show that by using SiNP monolayers coated with
GO, hNSCs not only align, but also show a remarkable increase in the expression of
neuronal markers. We thus believe that incorporating GO along with nanotopographi-
cal features into the microenvironment of hNSCs provide significant advantages for the
differentiation of hNSCs into neurons.
To prepare SiNP monolayers cover glass (Number 1, 22 mm x 22 mm; VWR) was
cut equally into smaller pieces (18 mm x 6 mm) and sonicated in Nanopure water (18.2
mOhm) for 10 mins and then cleaned in piranha solution (a 3:1 mixture of sulphuric acid
and hydrogen peroxide) for 10 min (Caution: Piranha solution is extremely corrosive).
The glass coverslips were then washed again in Nanopure water (18.2 Mohm) and dried
under a stream of pure nitrogen. To generate films of nanotopographical features,
300 nm silicon oxide nanoparticles (SiNPs, Corpuscular Inc) were utilized. The washed
cover slips were centrifuged at 2000 RPM for 2 min in a 2 mL eppendorf tube containing
25 mg/mL of the positively charged (amine terminated) SiNP solution. The substrates
were then washed with Nanopure water and dried under a stream of pure nitrogen. The
cover slips were then rinsed thoroughly with ethanol and dried under nitrogen. They

129
were then baked at 100◦C in an oven for 10 min.
Graphene Oxide (GO), which is negatively charged, was assembled on glass cover
slips through electrostatic interactions. Specifically, these glass cover slips were first
functionalized with self-assembled monolayers of positively charged APTES using a
well-established protocol [145]. Each positively charged glass cover slip was then simply
dipped once into a concentrated solution of nanometer sized GO (250 nm, 0.6 mg/mL)
and dried using a stream of nitrogen. Furthermore, we generated substrates having
nanotopographical features within the ECM using monolayers of positively charged sil-
ica nanoparticles (SiNP, 300 nm). The monolayers were fabricated using centrifugation
as previously reported [145]. The substrates having the nanoparticles were then dipped
into a concentrated solution of GO (0.6 mg/mL) as before and dried under a stream of
nitrogen. As controls, we used bare glass and generated substrates having only SiNPs
(without GO) as shown in Figure 3.18. The presence of GO on the substrates was
confirmed using Raman spectroscopy and scanning electron microscopy (SEM) (Figure
3.26).

130
Figure 3.26: Raman Spectroscopy and SEM confirming the presence of graphene oxide.(a) raman Spectroscopy imaging shows the presence of the characteristic D and G bandson graphene oxide. The bare glass substrate and the substrate having on SiNP do notshow the characteristic bands. (b) SEM image of SiNP-GO coated with laminin clearlyshows the presence of GO on the SiNPs. (Scale bar: 200 nm)
Human neural stem cell (hNSC) culture and differentiation
Human neural stem cell line (ReNCell VM, Millipore) was purchased and routinely ex-
panded according to the manufactures protocol. The hNSCs were maintained in laminin
(Sigma, 20 µg/ml) coated culture dishes precoated with poly-L-lysine (10 µg/ml) in
ReNCell VM media (Millipore) supplemented with the antibiotics, geniticin (Life Tech-
nologies), in the presence of basic fibroblast growth factor (bFGF-2, 20 ng/ml, Milli-
pore) and epidermal growth factor (EGF, 20 mg/ml, Peprotech). All of the cells were

131
maintained at 37◦C in a humidified atmosphere of 5% CO2. For consistency, the ex-
periments were carried out on cells between passages 2 and 5. Neural differentiation
was initiated by changing the medium to basal medium (without bFGF-2 and EGF) on
the different substrates (SiNP, GO, SiNP-GO and control glass) coated with laminin.
The cells were allowed to differentiate for 14 days with the basal medium in each being
exchanged every other day.
Image analysis
Image analysis on images taken from scanning electron microscopy was done to deter-
mine the axonal alignment and axonal length. Alignment is recorded by tracing axons
through Adobe Photoshop software and measuring linear angle from connected cell bod-
ies. Axonal length is done using a similar method by tracing axons and calculating the
pixels spanned in Adobe Photoshop. Once the number of pixels has been obtained, it is
converted to µm by referencing the amount of pixels the scale bar spanned. Since there
needs to be a reference angle, SEM images are rotated so that the general directions
of axons are similar among all conditions. The number of cells participated in image
analysis is one hundred per condition. Data analysis was conducted after alignment
angles were recorded for all four conditions. Due to the nature of sample loading of
SEM, angles of axons are not a good statistical indicator of alignment. Instead, the
angle of standard deviation is the better statistical representative of the effects of our
platform.
Cell viability assay
The percentage of viable cells on the different substrates was determined after 3 weeks of
differentiation using the MTS cell viability assay following standard protocols described
by the manufacturer. All experiments were conducted in triplicate and averaged. The
data is represented as formazan absorbance at 490 nm, considering the differentiated
hNSCs on SiNP-GO as 100% viable.

132
Immunocytochemistry
To investigate the extent of neuronal differentiation, at Day 14, the basal medium was
removed and the cells fixed for 15 minutes in Formalin solution (Sigma) followed by two
PBS washes. Cells were permeabilized with 0.1% Triton X-100 in PBS for 10 minutes
and non- specific binding was blocked with 5% normal goat serum (NGS, Life Tech-
nologies) in PBS for 1 hour at room temperature. To study neuronal differentiation,
antibodies against neuronal markers were used. Mouse primary antibodies were used
against TuJ1 (1:500, Covance), NeuN (1:100, Millipore) and rabbit primary antibodies
were used against Synapsin (1:100, Santa Cruz Biotechnology) and MAP2 (1:100, Cell
Signaling). The fixed samples were incubated overnight at 4◦C in solutions of primary
antibodies in PBS containing 10% NGS. After washing three times with PBS, the sam-
ples were incubated for 1 h at room temperature in solution of anti-mouse secondary
antibody labeled with Alexa-Fluor R©647 or Alexa-Fluor R©546 and anti-rabbit secondary
antibody labeled with Alexa-Fluor R©546 or Alexa-Fluor R©488 (1:200, Life Technologies),
Hoechst 33342 (1:500, Life Technologies) in PBS containing 10% NGS to observe neu-
ronal differentiation. After washing the samples thrice with PBS, the substrates were
mounted on glass slides using ProLong R© antifade (Life Technologies) to minimize pho-
tobleaching. The mounted samples were imaged using Nikon TE2000 Fluorescence
Microscope.
PCR analysis
Total RNA was extracted using Trizol Reagent (Life Technologies) and the mRNA
expression level of TuJ1, MAP2, GAP43 and nestin were analyzed using Reverse Tran-
scriptase PCR (RT-PCR) and quantitative PCR (qPCR). Specifically, cDNA was gen-
erated from 1 µg of total RNA using the Superscript III First-Strand Synthesis System
(Life Technologies). Analysis of mRNA was then accomplished using primers specific
to each of the target mRNAs. RT-PCR reactions were performed in a Mastercycler
Ep gradient S (Eppendorf) and images were captured using a Gel Logic 112 (Care-
stream) imaging system. qPCR reactions were performed using SYBR Green PCR

133
Master Mix (Applied Biosystems) in a StepOnePlus Real-Time PCR System (Applied
Biosystems) and the resulting Ct values were normalized to Gapdh. Standard cycling
conditions were used for all reactions with a melting temperature of 60◦C. Primers are
listed below in Table 3.2.
Table 3.2: Primers for PCR analysis

134
Chapter 4
Developing Biosensors for Highly Sensitive and Selective
Detection of Biomarkers
In an effort to develop biosensors capable of quantifying the expression of various stem
cell markers, and the markers for differentiated cells, we began with optimizing the
sensing abilities of our biosensors using already established markers such as cancer
biomarkers. While the application of these biosensors for detecting markers for stem
cell biology is currently under way, in this chapter will we see the fabrication and
applications of biosensors based on hybrid nanostructures for detecting well-established
biomarkers in a highly selective manner having high sensitivity.

135
4.1 Graphene-Encapsulated Nanoparticle-based Biosensor for the Se-
lective Detection of Cancer Biomarkers
4.1.1 Introduction
Nanomaterials such as silicon nanowires (SiNWs) [262,263], carbon nanotubes (CNTs)
[264–267], and graphene [84,268], have gained much attention for use in electrical biosen-
sors due to their nanoscopic and electrical properties. For instance, SiNWs and CNTs
can be integrated into field-effect transistors (FETs) to detect small amounts of tar-
get biomolecules with high sensitivity and selectivity by measuring electrical distur-
bances induced by the binding of these biomolecules to the surface of the nanostruc-
ture [87,269]. The detection of biomarker proteins with high sensitivity and selectivity
is vital for the early diagnosis of many diseases such as cancer and HIV. For this pur-
pose, carbon-based nanomaterials like CNTs and graphene have attracted significant
attention for fabricating highly sensitive FET-based biosensors [83,84,267,269–273]. In
particular, the use of graphene in FET-based biosensors is becoming more and more
appealing not only due to its unique properties such as higher 2-D electrical conduc-
tivity, superb mechanical flexibility, large surface area, and high chemical and thermal
stability, but also due to its ability to overcome the limitations of CNTs such as vari-
ations in electrical properties of CNT-based devices and the limited surface area of
CNTs [81, 246, 260, 274–279]. Nevertheless, there have been only a few reports on de-
veloping graphene FET-based biosensors [83,280], and their potential as biosensors has
not been fully explored. It is therefore be critical develop nanoscopic graphene-based
biosensors that are simple in device structure, small in size, allow label-free detection
and real-time monitoring of biomarkers, all of which are essential criteria for biosensors.
A key challenge in the above requirements is the achievement of both, well-organized
two- or three-dimensional graphene structures, in microscopic-/nanoscopic biosensing
devices and well-defined bioconjugation chemistry on graphene.
Herein, we demonstrate a novel strategy for the fabrication and application of a
reduced graphene oxide (rGO) [258, 281] encapsulated nanoparticle (NP)-based FET
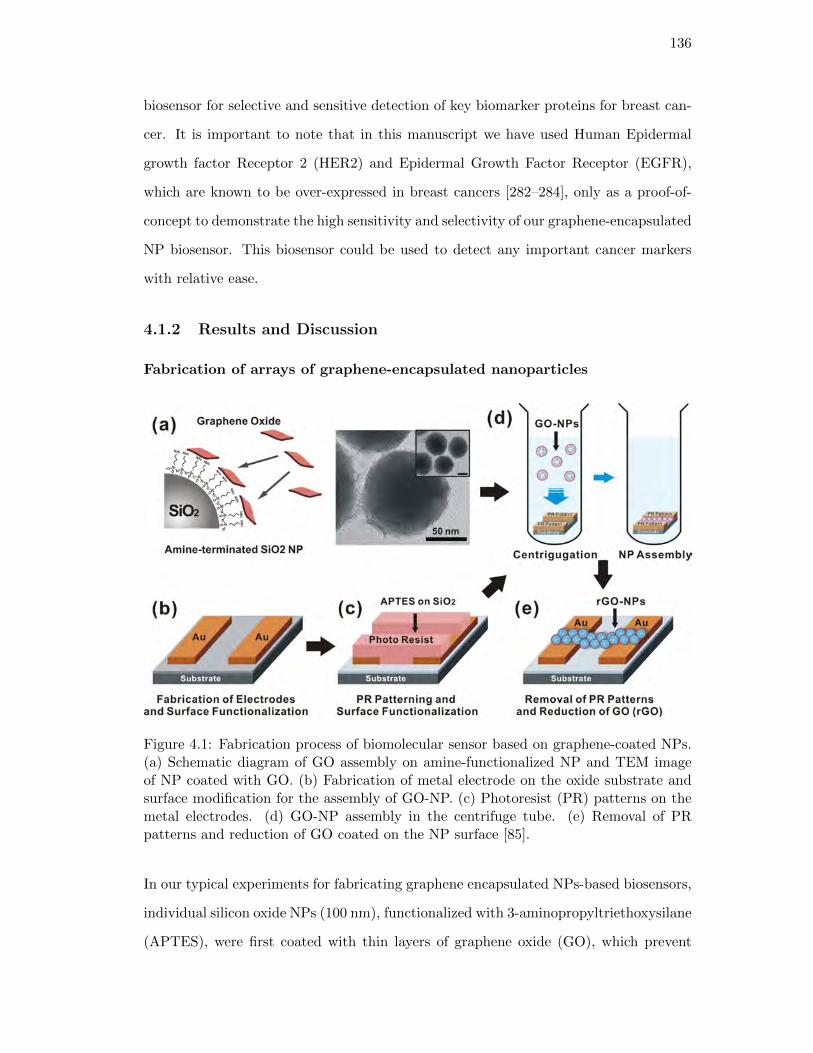
136
biosensor for selective and sensitive detection of key biomarker proteins for breast can-
cer. It is important to note that in this manuscript we have used Human Epidermal
growth factor Receptor 2 (HER2) and Epidermal Growth Factor Receptor (EGFR),
which are known to be over-expressed in breast cancers [282–284], only as a proof-of-
concept to demonstrate the high sensitivity and selectivity of our graphene-encapsulated
NP biosensor. This biosensor could be used to detect any important cancer markers
with relative ease.
4.1.2 Results and Discussion
Fabrication of arrays of graphene-encapsulated nanoparticles
Figure 4.1: Fabrication process of biomolecular sensor based on graphene-coated NPs.(a) Schematic diagram of GO assembly on amine-functionalized NP and TEM imageof NP coated with GO. (b) Fabrication of metal electrode on the oxide substrate andsurface modification for the assembly of GO-NP. (c) Photoresist (PR) patterns on themetal electrodes. (d) GO-NP assembly in the centrifuge tube. (e) Removal of PRpatterns and reduction of GO coated on the NP surface [85].
In our typical experiments for fabricating graphene encapsulated NPs-based biosensors,
individual silicon oxide NPs (100 nm), functionalized with 3-aminopropyltriethoxysilane
(APTES), were first coated with thin layers of graphene oxide (GO), which prevent

137
aggregation and maintain high electrical conductivity (Figure 4.1). This was mainly
achieved via the electrostatic interaction between the negatively charged GO (Figure
4.2) and the positively charged silicon oxide NPs.
Figure 4.2: (a) AFM topography image of GO pieces assembled on SiO2 substrate. (b)The height profile along the red line in the AFM image [85].
The GO solution (0.05mg/ml in deionized water) was simply injected into the NP
solution (5 mg/ml), wherein the negatively charged GO assembled on the positively
charged NP surface until equilibrium coverage was reached [285–287]. The transmission
electron microscopy (TEM) image of the GO-coated NPs clearly shows the uniform
assembly and saturation density of GO on the NP surface (Figure 4.1a). The GO
thickness on the surface of the NPs was 5 nm, as measured from HR-TEM. As seen in
the image, the NPs were connected through a film of GO which was used as an electrical
carrier after its reduction to rGO. For efficient use of NP junctions as electrical channels,
it was imperative to assemble the NPs with high density on the device. The scanning
electron microscopy (SEM) images show well-defined, dense rGO-NP patterns uniformly
covering a large area of the silicon oxide substrate (Figure 4.3a,b).
Furthermore, our modified self-assembly method (utilizing centrifugation) allowed
us to assemble NPs with high density in a short span and by using minimal amount
and concentration of the NP solution. Importantly, the high surface-to-volume ratio
of the GO-encapsulated NPs can generate 3-D electrical surfaces that significantly en-
hance detection limits and enable label-free, highly reproducible detection of clinically
important cancer markers.
One of the most attractive and advantageous aspects of our graphene-encapsulated
NP biosensor is its ease of fabrication and measurement (Figure 4.3). The device was

138
fabricated using photolithography, followed by a lift-off process, both of which have
been well established [287, 288]. We first generated gold electrodes on a silicon ox-
ide substrate using photolithography and lift-off. To generate arrays of GO-NPs, we
patterned the photoresist (AZ 5214) on the substrates with gold electrodes using pho-
tolithography. The exposed silicon oxide surface and gold surface were functionalized
with self assembled monolayers (SAMs) of positively charged APTES and cysteamine,
respectively. The SAM formation promoted the assembly of the negatively charged
GO-NPs (through electrostatic interactions) [288, 289]. We then employed a relatively
simple technique involving centrifugation for the uniform assembly of GO-NPs on the
positively charged SAMs. In this technique, the substrate containing the patterned
photoresist along with the SAMs was centrifuged in a solution of GO-NPs at 2000
RPM for 3 min in a centrifuge tube. Despite a low concentration of GO-NPs, we were
able to achieve uniform films of NPs having a high density in a reproducible manner.
This is in stark contrast to the standard methods used for assembling NPs on surfaces.
Other methods generally rely on using larger volumes of solution containing higher con-
centrations of NPs, where contact of the NPs with the surface is mainly made through
infrequent Brownian motion, which eventually causes the NP assembly. On the other
hand, our centrifugation technique achieved uniform, highly dense layers of graphene-
encapsulated NPs over a large area, in a short time span (Figure 4.3a,b). We then
generated a uniform NP array by removing the patterned photoresist using acetone.
The removal of photoresist did not disturb the assembly of GO-NPs. To render the in-
sulating GO electrically conductive, we reduced the GO through an overnight exposure
to hydrazine vapor. Our method of fabricating the device is very powerful as it can be
integrated with conventional microfabrication processes, which makes our device cost
effective and relatively easy to produce on a large scale.

139
Figure 4.3: Reduced GO-NP patterns and the electrical property of the rGO-NP device.(a) SEM images of rGO-NPs assembled on a large area. (b) The SEM images ofbiosensors consisting of rGO-NP array with gold electrodes. (c) The schematic diagramof measuring process of gate effect utilizing ionic liquid (left diagram) and gate effectof ten rGO-NP junctions with 50mA channel length (right graph) [85].
Gating effect of rGO-NP device
One of the key barriers of using graphene FET-based biosensors is to operate the device
at physiological conditions (e.g. different pH and salt concentrations), in which different
ionic environments affect the conductivity of graphene FET-based biosensors [290].
To study the working conditions of our graphene FET-based biosensors in aqueous
solutions, we measured the gating effect of our rGO-NP-based biosensor using an ionic
liquid gate (Figure 4.3c). A typical source-drain current vs. gate potential plot was
obtained in an ionic liquid, 1-butyl-3-methylimidazolium tetrafluoroborate (BmimPF6).

140
In an ionic liquid, the high concentration of ions renders the thickness of the diffusion
layer negligible, thus making it useful as a gate insulating layer. Silver (Ag) wire
was used as the reference electrode for the measurements in the ionic liquid. The
gating effect observed in our GO-NP devices was similar to that observed in rGO thin-
film transistors that have ambipolar conduction and p-type behavior near zero gate
voltage [287,291]. In our case, the top-gate bias was swept with 0.05V/sec sweep speed
under the source-drain bias of 0.5V span (Figure 4.3c).
Sensitivity and selectivity of rGO-NP biosensor for detecting HER2
The sensitivity of our rGO-NP devices, functionalized with HER2 mAbs, was deter-
mined by measuring the changes in conductance as the solution concentration of HER2
was varied from 10 fM to 1 µM (Figure 4.4d). In all our experiments, only 1 µL of
each solution was added onto the device. Representative time-dependent data shows
that on the addition of a 10 fM solution of HER2, no change in conductance was ob-
served. However on increasing the concentration to 1 pM, a decrease in conductance
of the p-type rGO-NP device was observed due to the binding of HER2 to the mAbs.
As the concentrations of the solutions were subsequently increased, a concentration
dependent decrease in the conductance of the rGO-NP device was observed. Thus,
the detection limit of our biosensor was observed to be 1 pM in a solution containing
only HER2 protein, which is a significant improvement over thin-film-transistor-type
sensors based on the graphene [83,265,273]. The observed change in electrical conduc-
tivity can be attributed to the p-type characteristic of the rGO-NP FET-based sensors
as the amine groups on the protein surface are positively charged. Binding of these
positively charged target-biomolecules such as HER2 or EGFR to the rGO surface will
induce positive potential gating effects that generate reduced hole density and electrical
conductance.

141
Figure 4.4: Real-time detection of cancer marker, HER2. (a) The preparation of rGO-NP device. (b) Surface functionalization of rGO for immobilizing the antibody. (c)Measuring conductance of the devices when the target protein is introduced. (d) Thesensitivity of the biosensor (relative conductance change, %) in response to the con-centration of HER2 with VDS = 1V and Vg = 0V. (e) The selectivity of the biosensorin response to PBS buffer, BSA with 50µg/ml and HER2 (100 pM and 1 µM). (f)Sensor sensitivity (relative conductance change,%) as a function of the HER2 concen-tration withVDS= 1V and Vg = 0V. Please note that all experiments were performedmultiple times (n = 30) to collect statistical data (with error bars) and confirm thereproducibility/robustness of our biosensing system [85].
To test the selectivity of our graphene FET-based biosensors, we further investigated
the selective detection of our device in competitive binding studies with bovine serum
albumin (BSA) (Figure 4.4e). Time-dependent conductance measurements recorded on
our rGO-NP devices, functionalized with HER2 mAbs, showed no change in conduc-
tance on adding PBS, and 50 µg/ml BSA. However, on adding 1 µL of 100 pM solution
of HER2 to the BSA solution on the device, a rapid and sharp change in conductance
was observed, demonstrating the high selectivity of our device. On adding the 1 µM
solution of HER2, the conductance further decreased rapidly and drastically. In spite
of the presence of a solution having a very high concentration of BSA (50 µg/ml), the
detection limit of the target protein, HER2, was 100 pM, which clearly demonstrates

142
the remarkable sensitivity and selectivity of our rGO-NP biosensor.
Figure 4.4f shows the sensitivity (relative conductance change) of our biosensor as
a function of the HER2 concentration. The lowest HER2 concentration level that can
be detected is 1 pM which shows a decrease in conductance (3.9 %). Similar to the
non-linear behavior of CNT FET-based sensors [292–294]. our sensor responses increase
non-linearly with the increase in the HER2 concentration from 1 pM to 1 µM, which
clearly shows that the sensor response is due to the binding of HER2 to the HER2
mAbs.
Sensitivity and selectivity of rGO-NP biosensor for detecting EGFR
In addition to HER2, we similarly investigated the sensitivity and selectivity of our de-
vice for detecting EGFR. We functionalized the device with EGFR mAbs and observed
the change in conductance on the addition of EGFR solution. The trend in conductance
change was similar to that observed with HER2, with the detection limit being 100 pM
for EGFR, and 10 nM in the presence of BSA (50 µg/ml) (Figure 4.5). We believe the
slight decrease in sensitivity for detecting EGFR (relative to HER2) might be due to the
difference in binding affinities of the two mAbs to their respective proteins. However,
the result demonstrates the capacity of our biosensor to detect different biomarkers in
a sensitive and selective manner.

143
Figure 4.5: Real-time detection of cancer marker, EGFR.(a) Biosensor sensitivity (rel-ative conductance change, %) in response to the concentration of EGFR with VDS =1V and Vg = 0V. (b) The biosensor selectivity in response to PBS buffer, BSA with 50µg/ml and 10 nM EGFR [85].
4.1.3 Conclusions
In conclusion, we have demonstrated the application of graphene encapsulated NP-
based biosensor for highly selective and sensitive detection of cancer biomarkers by using
surface chemistry principles combined with nanomaterials and micro-/nanofabrication
techniques. The novel three-dimensional structure of graphene encapsulated NP sig-
nificantly increases the surface-to-volume ratio in FET-type biosensors, thereby im-
proving the detection limits (1 pM of HER2 and 100 pM of EGFR) for our target
cancer biomarkers. In addition, we also demonstrated the highly selective nature of
our biosensor as we detected low concentrations of our target cancer biomarkers even
in the presence of a highly concentrated BSA solution. The ease of fabrication and bio-
compatibility, along with excellent electrochemical and electrical properties of graphene
nanocomposites, makes our graphene encapsulated NP-based biosensor an ideal candi-
date for future biosensing applications within a clinical setting.
144
4.1.4 Materials and Methods
Preparation of reduced graphene oxide and SiO2 NPs
GO was obtained from SP-1 graphite utilizing the modified Hummer method [258].
For the GO assembly on the surface of NPs, GO suspension was injected into the
nanoparticle solution for 10min, and GO-NPs were separated from GO solution using
a centrifuge. SiO2 NP (100 nm) solution was purchased from Corpuscular Inc. For
GO-NP assembly, the photo resist-patterned substrate was placed in the NP solution,
and GO-NPs were assembled on the substrate by applying centrifugal force. After the
deposition of GO-NPs on the substrate, the GO on the NP surface, having the low
conductance, was reduced to graphene by exposure to hydrazine vapor overnight.
Synthesis of 4-(pyren-1-yl)butanal
10 mL of methylene chloride was added to 1.097 g (4 mmol) of 4-(pyren-1-yl) butyl
alcohol and stirred vigorously at room temperature for 10 min hour. The reaction was
followed by addition of 1.292 g (1.5 Equilibrium) of PCC (Pyridinium chlorochromate)
in 10 mL methylene chloride and the reaction mixture was stirred for 2 h. The reaction
mixture was then diluted with 5 volumes of anhydrous ether (100 mL) and washed
with 1:1 brine: water, saturated aq. Na2SO3 solution, and brine, respectively, dried
over anhydrous Na2SO4 and concentrated to give the aldehyde. The crude product was
purified by silica gel flash chromatography (hexanes: ethyl acetate, 9:1, rf: 0.4) to yield
1.06 g (97%). Most of the crude products were very clean and could be used directly
for further applications.
Surface molecular patterning
3-Aminopropyltriethoxysilane (APTES) and cysteamine molecules used in forming SAMs,
and solvents were purchased from Sigma-Aldrich. For the patterning of APTES SAM
on SiO2, the photoresist (AZ5214) was first patterned by photolithography using a short
baking time (<10 min in 95◦C). The patterned substrate was placed in the APTES so-
lution (1:500 (v/v) in anhydrous hexane) for 7 min. For the patterning of APTES on

145
the on SiO2 layer, the substrate with photoresist patterns was placed in an APTES so-
lution (1:500 (v/v) in anhydrous hexane) for 10 min. The photoresist was then removed
with acetone.
Metal deposition and measurement of graphene devices
For the electrode fabrication, the photoresist was first patterned on the substrate.
Ti/Au (10/30nm) was then deposited on the substrate and the remaining photoresist
was then removed with acetone for the lift-off process. A Keithley-4200 semiconductor
parameter analyzer was used for measurement and data collection.
Functionalization the rGO-NPs with monoclonal antibodies
The bioconjugation chemistry is well established and involved three basic steps.[2,10]
First, the reduced GO surface was functionalized with 4-(pyren-1-yl)butanal via π-π
interactions by incubating the device in a methanol solution (1:500) of 4-(pyren-1-
yl)butanal for 30 min. Second, the aldehyde groups were coupled to the amine groups
of the monoclonal HER2 or EGFR antibodies (1:50) through reductive amination in
the presence of 4 mM sodium cyanoborohydride in PBS (pH 7.4) for two hours. Third,
unreacted aldehyde groups were blocked using 100 mM ethanolamine in a similar man-
ner to prevent non-specific interactions of proteins. Finally, we rinsed the device in
a continuous flow of PBS (pH 7.4) for 10 min. We show that the surface chemistry
used in our device plays a crucial role in achieving highly selective and sensitive de-
tection of HER2 or EGFR protein. Furthermore, due to the large surface-to-volume
ratio of the rGO-NPs, our biosensors were highly efficient as compared to the thin-film
transistor-based biosensors.

146
4.2 Label-free Polypeptide-based Enzyme Detection Using a Graphene-
nanoparticle Hybrid Sensor
4.2.1 Introduction
Over the last few decades, the carbon nanomaterial-based electrical detection of chem-
ical and biological molecules has gained much attention with its extensive applica-
tions to genomic, proteomic and environmental analysis as well as for clinical diagno-
sis [81, 246, 260, 275–279, 295–298]. Typical carbon nanomaterial-based electrical de-
tection systems are composed of two components: a biological recognition element
and a signal transduction element. These devices are able to detect minute concen-
trations of target molecules by measuring the change in electrical conductance that
results from the binding of target molecules to the surface of the carbon nanomate-
rial [83–85, 268, 273]. However, the sensitivity as well as selectivity of these devices
depends heavily on the electrical properties of the nanomaterial used in the system
and on the interfacial chemistry that exists between the nanomaterial and the recep-
tor molecules. Carbon nanotube field-effect transistors (CNT-FETs) currently lead the
field and are one of the most extensively developed systems [292–294, 299–301]. This
is due to the excellent electrical properties and the relatively well-developed surface
chemistry of CNTs. However, certain limitations do exist with CNT-based electrical
detection devices. These include inconsistencies in the assembly of CNTs resulting in
device unreliability, limits in its surface area, and a high-cost of fabrication.
An alternative nanomaterial, which has the potential to overcome the aforemen-
tioned limitations of CNTs, is graphene. Graphene consists of a single-atom-thick pla-
nar sheet of carbon atoms that are arranged in a perfect honeycomb lattice and has a
zero-band gap. It forms ideal two-dimensional carbon crystals that show high electrical
conductivity in the absence of any doping even at room temperature. Graphene also
demonstrates superb mechanical flexibility and high chemical/thermal stability. Fur-
thermore, due to its low noise level, graphene is extremely sensitive to perturbations in
electrical conductance that are induced by biological reactions. These biological reac-
tions can include, but are not limited to, the enzyme-mediated degradation of a target

147
substrate and the binding of proteins to other biomolecules. There have been a number
of graphene-based protein sensors with detection limits on the µM scale [83, 268, 273].
However, there have been limited demonstrations utilizing graphene for the detection of
enzymes, with most demonstrations relying on antibody-mediated recognition of their
target proteins [273, 302, 303]. Enzyme detection is an especially clinically relevant is-
sue as it has been reported that the enzyme levels found in vivo are strongly correlated
with the diagnosis, prognosis, and treatment of many diseases such as HIV, cancer,
and diabetes. Therefore, to improve our ability to detect enzyme levels and to enhance
the clinical potential of graphene-based biosensors, it is possible to take advantage of
graphenes sensitivity to changes in electrical conductance in order to detect the enzy-
matic cleavage of target peptides that are assembled on the sensor surface.
Herein, we report a novel approach for the detection of enzymes using a graphene-
nanoparticle (NP) hybrid biosensor. This system can detect the activity of an enzyme
and determine its concentration by measuring the change in electrical hysteresis that
results from the interaction of the target enzyme with its corresponding substrate. In
addition, we demonstrate its ability to achieve the sensitive and selective detection of
the target enzyme. Similar electrical hysteretic behavior in carbon nanomaterial-based
devices with gate have been observed previously and is presumably caused by charge
transfer from neighboring adsorbates such as water molecules or from charge injection
into the trap sites on the dielectric substrate [287]. However, this is the first report of
NP-mediated electrical hysteresis in a graphene sensor. Moreover, the utilization of a
hysteresis change for sensing is advantageous because the immobilization of specific en-
zymes on the graphene surface, which is required for field effect transistor-type sensors,
is unnecessary in our system allowing us to preserve the superb electrical properties
of graphene. The use of hysteresis as a detection method also allows graphene-based
devices to overcome the low on-off ratio caused by the zero band gap of graphene. In
the majority of previous studies [83–85,268,273], a Dirac shift or a conductance change
at the fixed gate voltage that is associated with this Dirac shift when the specific target
material was attached selectively on the graphene channel was utilized. When using
only a Dirac shift for sensing, non-specific binding such as the physical attachment of

148
positively- or negatively-charged materials can also result in a Dirac voltage shift or
conductance change. However, in our process, even though nonspecific binding on the
channel occurred, the amount of electrical hysteresis of our devices did not change.
Only when these devices were exposed to a specific condition, did the hysteresis phe-
nomenon start to decrease. Specifically, our graphene-NP hybrid biosensor is composed
of gold nanoparticles (AuNPs) that are assembled on a graphene surface using a func-
tional polypeptide linker, which concomitantly functions as the substrate for the target
enzyme. Proteolysis of the functional polypeptide linker by the target enzyme leads
to disassembly of the NP layer and a measurable shift in electrical hysteresis that can
be visualized in the gate sweep curve. This can then be used to quantify the enzyme
concentration. AuNPs were chosen because they are able to store charge, resulting in
hysteresis upon their release from the device surface [287]. In our case, as a proof-of-
concept, we detected the activity of Carboxypeptidase B in order to demonstrate the
high achievable sensitivity and selectivity of our graphene-NP hybrid biosensor [304]
This enzyme has been reported as a predictor of severe acute pancreatitis, which is an
acute inflammatory condition of the pancreas. However, it is important to note that the
reported biosensing method can be extended to detect any number of key enzymes, pH
changes, and UV with the appropriate modification to the functional linker substrate.
4.2.2 Results and Discussion
A schematic of our graphene-NP hybrid biosensor is depicted in Figure 4.6a. The device
consists of gold source and drain electrodes that are connected by graphene channels
[Figure 4.6b(i)]. The graphene channels are coated with a functional polypeptide linker
that is specific for our target enzyme, Carboxypeptidase B, followed by a layer of
AuNPs that have a negative charge on their surface, and a peripheral ionic liquid, which
functions as the gate dielectric [Figure 4.6b(ii-iv)]. Introduction of Carboxypeptidase
B would then initiate the hydrolysis of the specific enzyme substrate, which in this case
in the functional polypeptide linkers. The degradation of the polypeptide linkers result
in the release of AuNPs, which causes a hysteresis shift that can be measured using a
silver gate electrode. The range of hysteresis shift has been found to be proportional to

149
the enzyme concentration and can therefore be used to determine the level of enzyme
in the solution.
Figure 4.6: Schematic of the enzyme biosensor. (a) Graphene-nanoparticle hybriddevices for enzyme sensing. Fabrication process of the hybrid biosensor. (a) Fabrica-tion of the graphene channel between the Au electrodes (i). Functionalization of thegraphene surface with hydrophilic molecules (ii). Assembly of the functional peptidelinker molecules and AuNPs on this polypeptide layer (iii). Sensing target biomoleculesby measuring the change in electrical hysteresis (iv). (c) Chemical structure of thefunctional polypeptide linker molecule [305].
To fabricate the graphene-NP hybrid biosensor, the source and drain Au electrodes
were first fabricated on a SiO2 substrate via the lift-off process. Graphene was de-
posited and patterned as previously described[2] in order to form graphene channels
between the Au electrodes [Figure 4.6b(i)]. Before assembling the AuNPs and the
functional polypeptide linker molecules on the graphene surface, the surface was made
hydrophilic through functionalization with 4-(pyren-1-yl)butanal, which occurs via π-
π interactions. Specifically, functionalization was achieved by incubating the device
in a methanol solution (1:500) containing 4-(pyren-1-yl)butanal for 30 minutes [Fig-
ure 4.6b(ii)]. Next, the aldehyde groups of 4-(pyren-1-yl)butanal were coupled to the
amine groups of the functional polypeptide linker through reductive amination for 6
hours. Once the graphene device, functionalized with polypeptide linker, was placed
in the AuNP solution, the negatively charged AuNPs were able to self-assemble on the

150
positively charged functional polypeptide linker molecules via electrostatic interactions
[Figure 4.6b(iii)]. Specifically, this is a result of the remaining positively charged amine
groups on the functional polypeptide linkers. Finally, with the AuNPs assembled on
the graphene surface, we were able to detect the electrical hysteresis and gate effect of
our device utilizing an ionic liquid as the gate dielectric.
The fabrication method developed in our graphene-NP hybrid biosensor has sev-
eral advantages over conventional graphene-based biosensors. First, we were able to
fabricate high performance graphene-NP hybrid devices that have a large surface area
available for biodetection and a high conductivity. This was accomplished at a high
yield and uniformity by combining the properties of graphene with the nanoscopic fea-
tures of the AuNPs [275]. Specifically, these properties allow for the development of
biosensors that have high achievable current levels sufficient for the measurement of
minute conductance changes regardless of the channel length between two electrodes
in the devices (Figure 4.6 and Figure 4.7A1). As a result, our device provides a larger
number of sites that can be conjugated with receptor molecules (e.g. antibody or func-
tional polypeptide linker) in comparison with previous biosensors that used reduced
graphene oxide. In addition, these reduced graphene oxide-based biosensors were lim-
ited by their low conductivity and limited achievable channel length (e.g. only a few
micrometers) [276]. Second, the functionalization of the graphene surface with our func-
tional polypeptide linker followed by assembly of AuNPs was accomplished using π-π
interactions (graphene-pyrene aldehyde) and electrostatic interactions (polypeptides-
AuNPs). This method prevents the need to covalently bond the linker to the graphene
surface, therefore preserving the superb electrical properties of graphene [306]. Finally,
our fabrication method allows for the precise control of the number of graphene lay-
ers and can be used to deposit a large quantity of graphene on different substrates
such as SiO2, metallic surfaces, or glass due to the flexible and stretchable properties
of graphene. The devices can also be fabricated with conventional microfabrication
techniques, and the entire process can be accomplished using only conventional mi-
crofabrication facilities. Therefore, our method allows us to fabricate graphene-based
devices with present Si-based microelectronics, and would be readily accessible to the

151
present semiconductor industry. Collectively, our study presents a novel method that
avoids the use of graphene oxide for the development of biosensors and provides a novel
approach that combines the advantages provided by graphene and inorganic nanopar-
ticles (e.g. metallic and semiconductive NPs) with the area of biosensing.

152
Figure 4.7: Characterization data of the biosensor using AFM and SEM. (A1) A SEMimage of the junction between the Au electrodes, showing graphene channel (darkregion) between two Au electrodes (bright area). AFM topography images of (A2)the graphene surface before the assembly of NPs and (A3) the graphene surface afterthe functionalization with linker molecules. (A4) An AFM image of AuNPs on thegraphene surface. The height profile of the AFM image is shown below the image. (B1)An AFM topography image of the graphene surface before the assembly of NPs. (B2)An AFM image of AuNPs on the graphene surface. The height profile of the AFMimage is shown below the image. (B3) An AFM topography image of graphene afterexposure to a 10 µM enzyme solution for 6 hours. (C1)-(C6) AFM topography imagesof graphene after exposure to a 1 µM enzyme solution for from 30 sec to 50 hours,respectively. (D1)-(D4) AFM images after exposure to an enzyme solution with 10nM,100nM, 1µM and 10µM for 3 hours, respectively [305].
153
Confirmation of graphene deposition followed by AuNP assembly in the junction
between the Au electrodes was obtained using scanning electron microscopy (SEM)
(Figure 4.7A1). The image shows that the two Au electrodes, separated by a 50 µm
gap, are connected by a graphene channel that is 420 µm wide. In addition, after
coating the graphene surface with the functional polypeptide linker, we confirmed that
the negatively charged AuNPs (15 nm in diameter) successfully self-assembled as a
monolayer on the graphene surface at a high density (Figure 4.7A4 and B2). This is
mainly due to the large positive charge and the two-dimensional planar structure of
the functional polypeptide linker. The negatively charged surface of the AuNPs also
ensures that additional NPs are not assembled onto the underlying functional polypep-
tide linker. Therefore, the deposition of a single layer of AuNPs with high density was
achieved on the graphene surface. It was also found that the complete disassembly
of AuNPs was achieved after the device was exposed to a 1 µM Carboxypeptidase B
enzyme solution for 50 hours (Figure 4.7C6) or a 10 µM solution for 3 hours (Figure
4.7D4).
The gating effect of our device was measured by employing an ionic liquid as the
gate dielectric and a silver gate electrode. The use of an ionic liquid, which has a high
ionic concentration, as the gate dielectric allowed the thickness of the diffusion layer
to be considered negligible. It was found that the effect was similar to that observed
in graphene transistors that have ambipolar conduction and no electrical hysteresis
(Figure 4.8a upper graph) [291]. In our case, the top-gate bias was swept with a 0.01
V/sec sweep speed under a source-drain bias of 0.1 V. An ambipolar field effect was
also observed with a Dirac point voltage (VDirac) of 0.25 V, where charge carriers
change polarity. After functionalization of the graphene surface with our functional
polypeptide linker, it was observed that the gate curve shifted to a lower voltage level.
This negative Dirac voltage shift is approximately 0.05 V and we hypothesize that
this is due to the positively charged amine groups of the functional polypeptide linker.
Furthermore, the graphene device with functional polypeptide linker is characterized
by a gate curve that is similar to that seen previously with no observable electrical
hysteresis [287]. However, when negatively charged AuNPs were assembled, a positive

154
Dirac voltage shift occurred resulting in a field effect due to the negative charge of
the AuNPs. Interestingly, a large electrical hysteresis was achieved due to the memory
effect during gate sweep. The difference in the Dirac voltage between the forward and
backward gate voltage sweeps was defined as the hysteresis gap (∆VDirac). In terms of
the underlying mechanism, graphene has both holes and electrons as carriers, and the
density of states in graphene near the Fermi level is low. Thus, it exhibited ambipolar
behaviors of some gating effects depending on the gate bias voltages. Note that, in
the case without AuNPs (pristine graphene FET or graphene FET with only linker
molecules) [Figure 4.8a(i) - a(ii)], the graphene FETs exhibit only a small amount of
hysteresis indicating that our devices do not have many charge trap defects. On the
other hand, in the case of devices with AuNPs [Figure 4.8a(iii)], a large hysteresis is
evident in the gate sweep curve due to the charge stored in the AuNPs.

155
Figure 4.8: Measurement of the hysteresis change of the device after exposure to enzymesolutions. (a) ∆VDirac change and gate effect of an initial graphene transistor (i), afterthe functionalization of graphene surface with functional polypeptide linker molecule(ii), after NP assembly on the graphene surface (iii), and after exposure to 1 µM enzymesolution for 30 sec, 5 min, 1 hr and 50 hrs (iv - vii). (b) Changes in ∆VDirac of graphenedevice (i) and after the exposure to Carboxypeptidase B in PBS solution with theconcentration of 10 nM (ii), 100 nM (iii), 1 µM (iv) and 10 µM (v) for 3 hours [305].
As stated above, Carboxypeptidase B has been proposed as a predictor for severe
acute pancreatitis [304]. This enzyme was used in our proof-of-concept due to the fact
that our functional polypeptide linker contains a high number of lysines. Therefore,
it acts as a substrate for this enzyme, which specifically cleaves basic amino acids
such as lysine. When our graphene-NP hybrid device was exposed to the enzyme
solution, the functional polypeptide linker degraded, resulting in the release of AuNPs
into the surrounding media. To characterize the effect of the release of AuNPs from the
graphene surface on the electrical hysteresis of this device, we measured the ∆VDirac
as a function of time using a 1 µM enzyme solution (Figure 4.9b). We found that

156
increasing the exposure time of the enzyme resulted in an expected decrease in NP
density [Figure 4.7(C1-C6)]. This decrease in NP density resulted in a decrease in the
measured ∆VDirac, which became saturated after 50 hours. Furthermore, due to the
fact that the release of functional polypeptide linker caused the detachment of NPs
from the graphene surface, the ∆VDirac was very similar to the release profiles found
for polypeptide films [307].
The sensitivity of our graphene-NP hybrid sensor with functional polypeptide and
NPs was determined by measuring the ∆VDirac as the concentration of Carboxypep-
tidase B in phosphate buffered saline (PBS) solution was varied from 10 nM to 10
M (Figure 4.8b). Representative sensing data shows that the difference between the
∆VDirac for 10 nM and 100 nM solutions of Carboxypeptidase B after 3 hours of expo-
sure was statistically similar. However, a statistically significant difference in ∆VDirac
was observed when the concentration of Carboxypeptidase B was increased to 1 µM.
Furthermore, as the concentration was subsequently increased, a concentration depen-
dent decrease in the ∆VDirac of our sensors was observed. Figure 4.9a illustrates the
sensitivity (∆VDirac) of our biosensors as a function of the enzyme concentration. For
these experiments, we used ten graphene junctions for each step and repeated sensing
experiments ten times demonstrating the repeatability of our results. From these re-
sults, we can conclude that the lowest concentration that can be detected using the
current functional polypeptide linker is approximately 1 µM and it was found that this
concentration correlates with a decrease in the change ratio of ∆VDirac (59.2 %).

157
Figure 4.9: Enzyme detection using the graphene-nanoparticle hybrid sensor (a) Sensi-tivity (∆VDirac) of graphene sensor as a function of enzyme concentration [n=10]. (b)∆VDirac change under various exposure periods to a 1 µM Carboxypeptidase in PBSsolution (black square), a 1 mM PBS solution (blue triangle) and 1 mM BSA in thePBS solution (red circles) [n=10] [305].
The results also confirm that there is a direct relationship between the ∆VDirac
and the concentration of enzyme. Specifically, similar to the non-linear behavior of
other graphene-based sensors, the responses of our sensor increase non-linearly with an
increase in the enzyme concentration from 10 nM to 10 µM.[13,24-26] Finally, we tested
the selectivity of this biosensor towards the target enzyme by using control samples such
as PBS and different proteins such as bovine serum albumin (BSA). Results showed
that PBS and BSA did not react with the functional polypeptide substrate (Figure
4.9b).
Our findings show that quantifying the change in electrical hysteresis of a graphene-
NP hybrid biosensor is a viable method to measure enzyme activity sensitively and
selectively. However, it is apparent that the critical factor that determines this sensi-
tivity and selectivity is the functional polypeptide linker whose degradation results in
the release of AuNPs and subsequent shift in hysteresis. Therefore, the performance
of our sensor, in terms of its sensitivity and selectivity, can be further improved by
modifying the functional polypeptide linker and changing the properties of the metallic
nanoparticle system. In the current study, our novel graphene-based biosensor with
functional polypeptide linker and NPs can confer a sensitivity of up to 1 µM. How-
ever, to improve sensitivity and selectivity, we are synthesizing and screening a variety
of functional polypeptide linker molecules that will be self-assembled with different

158
metallic NPs of varying compositions and sizes.
4.2.3 Conclusions
In summary, we have successfully developed a novel graphene-NP hybrid biosensor that
uses an electrical hysteresis change to detect the enzymatic activity and concentration
of a target enzyme (e.g. Carboxypeptidase B). Our results indicate that our novel
graphene-NP hybrid biosensor has the ability to sense concentrations of Carboxypepti-
dase B down to the micron-scale, which is comparable to previously reported graphene-
based biosensors [83,268,273]. More importantly, to the knowledge of the authors, this
is the first demonstration of a graphene-based biosensor that utilizes a hysteresis change
resulting from metallic NPs assembled on a graphene surface for enzyme detection. The
current configuration developed in our graphene-NP hybrid biosensor holds a number of
advantages over other graphene-based devices established to detect enzymes and other
biomolecules. First, AuNP-mediated electrical hysteresis is a phenomenon that has not
been studied in graphene-based electrical detection methods, even though it can over-
come the limitations faced by current graphene-based sensing approaches. Second, the
novel method of detection reported here provides an alternative to the low on-off ratio
caused by the zero band gap of graphene. Third, in terms of the components used in
our device, the functional polypeptide linker acts as the key-sensing component and can
be modified to enhance sensitivity and selectivity for any target enzyme or to confer pH
and UV sensitivity. In addition, by combining the properties of graphene with inorganic
NPs, our device provides a larger number of sites that can be conjugated with receptor
molecules and a high achievable current level. Fourth, the methods used to fabricate
the device allow for the homogenous deposition of graphene, resulting in uniform elec-
trical properties. Finally, the use of conventional microfabrication techniques allows for
compatibility with facilities found in device industries and allows mass production of
our device. Therefore, the results and developed methods presented here warrant the
further study of graphene-NP hybrid biosensors for the sensitive and selective detection
of enzymes and other biomolecules.
159
4.2.4 Materials and Methods
Metal deposition and measurement of graphene devices
For the electrode fabrication, the photoresist was first patterned on the substrate.
Ti/Au (10/30nm) was then deposited on the substrate and the remaining photoresist
was then removed with acetone for the lift-off process. A Keithley-4200 semiconductor
parameter analyzer was used for measurement and data collection.
Synthesis of 1-butyl-3-methylimidazolium hexafluorophosphate (BMIM-PF6)
The BMIM-PF6 was prepared according to a modified procedure reported by Consorti
et al. [308] 72.5 mL (64.2 g, 0.69 mol) of 1-chlorobutane and 50 mL of 1-methylimidazole
(51.8 g, 0.63 mol) were added to a dry round-bottom flask fitted with a reflux condenser
and a magnetic stirring bar. The reaction mixture was stirred at 80◦C for 48 h. The
unreacted 1-chlorobutane was evaporated at reduced pressure. 1-methylimidazole was
washed three times by adding small amount of ethyl acetate to the mixture and de-
canted. 1-butyl-3-methylimidazolium chloride (BMIM-Cl) was obtained by evaporating
the remaining ethyl acetate at reduced pressure and drying in a vacuum oven. 69.6 g
(0.38 mol) of KPF6 and 150 mL of H2O were added into a round-bottom flask, followed
by the addition of 50mL (0.32 mol) of as-prepared BMIM-Cl. After vigorous stirring for
24 h at room temperature, undissolved KPF6 disappeared and two phases were formed.
The lower ionic liquid layer was separated and dissolved in 50 mL of dichloromethane.
The dichloromethane solution was washed with water until no chloride (Cl−) anion in
the water layer could be detected by AgNO3 solution. Dichloromethane was evap-
orated and 1-butyl-3-methylimidazolium hexafluorophosphate (BMIM-PF6) was ob-
tained as a colorless or slightly yellow viscous liquid after drying in a vacuum oven.
1-chlorobutane, 1-methylimidazole, ethyl acetate and dichloromethane were purchased
from Sigma Aldrich Inc. The synthesized BMIM-PF6 was analyzed with 1H NMR. Spec-
tra were recorded at 600 MHz. The following chemical shifts reported in ppm downfield
to TMS (δ=0 ppm) were observed: 1H NMR (600 MHz, DMSO-D6): δ 0.91(t, 3H), δ
1.27(m, 2H), δ 1.77(m, 2H), δ 3.85(s, 3H), δ 4.16(t, 2H), δ 7.67(s, 1H), δ 7.74(s, 1H), δ

160
9.08(s, 1H).
Synthesis of 4-(pyren-1-yl)butanal
10 mL of methylene chloride was added to 1.097 g (4 mmol) of 4-(pyren-1-yl) butyl al-
cohol and stirred vigorously at room temperature for 10 min. The reaction was followed
by the addition of 1.292 g (1.5 Equilibrium) of PCC (Pyridinium chlorochromate) in
10 mL methylene chloride and the reaction mixture was stirred for 2 h. The reaction
mixture was then diluted with 5 volumes of anhydrous ether (100 mL) and washed
with 1:1 brine: water, saturated aq. Na2SO3 solution, and brine, respectively, dried
over anhydrous Na2SO4 and concentrated to give the aldehyde. The crude product was
purified by silica gel flash chromatography (hexanes: ethyl acetate, 9:1, rf: 0.4) to yield
1.06 g (97%). Most of the crude products were very clean and could be used directly
for further applications.
Synthesis of the amino acid N-carboxy anhydrides (2, NCAs)
To synthesize the amino acid N-carboxy anhydrides, N-CBZ-l-lysine was converted
to the corresponding N-carboxy anhydrides (NCAs). Specifically, N-CBZ-l-lysine was
suspended in anhydrous THF (10 wt. %), and the reaction temperature was increased
to 55◦C. A calculated amount of triphosgene, dissolved in anhydrous THF, was added
dropwise into the reaction mixture. Due to the addition of triphosgene, the suspended
mixture became a clear solution as NCA was formed after a certain reaction time. To
ensure ring formation, the reaction mixture was vigorously stirred for an additional 1 h.
The reaction mixture was then condensed and poured into a 10-fold excess amount of
anhydrous n-hexane to precipitate the amino acid NCAs. Finally, the amino acid NCAs
were recovered by filtration and dried for 48 hours using a vacuum. Characterization
of the amino acid NCAs was completed using 1H NMR.
Deposition and Patterning of Graphene
In brief, graphene was grown on nickel layers using chemical vapor deposition. To
transfer the graphene, an aqueous FeCl3 solution was used as an oxidizing etchant.

161
This solution slowly etched the nickel layers, separating the graphene film from the
substrate. The resulting graphene film was then transferred to our device by simple
contact with our SiO2 substrate.
Synthesis of 3-armed polypeptides (5)
The lysine-based polymer was synthesized by ring opening polymerization via the amino
acid NCA using amino acids and triphosgene as shown in Figure 4.10. Calculated
amounts of amino acid NCAs were placed in an 100 ml two-neck round bottom flask
and dissolved in anhydrous DMF (10 wt.%) in a nitrogen atmosphere. Freshly distilled
n-trisamine, previously diluted in anhydrous DMF, was added into the solution to
initiate the ring-opening polymerization. The polymerization was continued for 72 h
at room temperature to ensure consumption of all the NCA monomers. The resulting
slightly viscous solution was then precipitated in 20-fold excess water. The precipitate
was filtered and dried in vacuum overnight. Then, the protection groups of the polymer
(CBZ groups in lysine side chains) were removed using HBr. Specifically, the polymer
with protection groups was dissolved in 30% HBr/glacial acetic acid solution (20 ml/g).
As the deprotection reaction progressed, carbon dioxide evolved out and the polymer
rapidly precipitated from the solution. After 30 mins, a 10-fold excess amount of
anhydrous diethyl ether was added to the reaction mixture. The precipitate was filtered
and washed with diethyl ether. After drying, the deprotected polymer was dissolved
again in deionized water, transferred to a pre-swollen dialysis membrane (MWCO=
500) and dialyzed against deionized water for 2 days. Polylysine was obtained by freeze
drying for 3 days. Polylysine was characterized by 1H NMR.

162
Figure 4.10: Synthetic Scheme of polypeptide linkers that is specific for our targetenzyme, Carboxypeptidase B [305].

163
4.3 Zinc Oxide Thin Film Transistor Immunosensor with High Sensi-
tivity and Selectivity
4.3.1 Introduction
The ion-selective field effect transistors (ISFET) have been used popularly as a sensitive
pH sensor and various biochemical sensors [309, 310]. Recently the ISFET structure
has been integrated with Poly-Si thin film transistors (TFTs) and GaN/AlGaN high
electron mobility transistors (HEMTs) for detection of DNA, penicillin, and cellular
potentials [311, 312]. However, the sensing procedure using the ISFET can be invasive
as its entire gate serves as the sensing area which contains both the analyte solution
and the reference electrode. Another class of FET-type biosensors is based on organic
field-effect transistors (OFETs) [313–316]. The general structure of an OFET consists
of a back-gate MOSFET with the conducting channel made of organic semiconductors.
The OFET has the advantage of being easily controlled through biasing due to the
back-gate configuration. However, OFETs require high bias voltages, and suffer from
low channel mobility. Currently, nanowire-based FET sensors are demonstrated with
high sensitivity reaching the order of fM [317,318]. However, these prototypes of sensors
generally involve a complex fabrication process as they are constructed individually by
manipulating and aligning a single strand of semiconducting nanowire such as TiO2 or
Si as the FET channel between the source and drain patterns. It is difficult to achieve
repeatability and manufacturability in fabrication and integration of these devices for
larger sensor arrays.
ZnO is emerging as a wide bandgap semiconductor oxide with multifunctional prop-
erties that makes it an attractive sensor material. ZnO and its nanostructures are
compatible with intracellular material and ZnO-based sensors have been demonstrated
for detection of biochemicals such as enzymes, antibodies, DNA immobilization and hy-
bridization [319–321]. Herein, we report the highly sensitive and selective immunosens-
ing ability of a ZnO based thin film transistor biosensor (ZnO-bioTFT). The EGFR
is used as the example because the sensing of EGFR-antibodies reacting with EGFR
proteins has its implications in cancer related studies and drug screening for cancer,

164
as EGFR is well-known to be over-expressed in solid tumors, especially breast cancers.
The ZnO-TFT devices possess excellent and repeatable characteristics. It can be fabri-
cated using the conventional microelectronic process and can be integrated into a large
scale at low cost, which benefit for the further development of a platform not only for
diagnosing cancers, but also for monitoring a patients response to therapy in real-time.
4.3.2 Results and Discussion
The bio-functionalization enables the exposed ZnO channel direct interaction with the
biochemical species being detected. The mechanism of detection of antibody-antigen
reaction is illustrated in Figure 4.14a-d. In the first step (Figure 4.14b) the unfunction-
alized ZnO-bioTFT is positively biased at the drain and gate electrode. The positive
voltage at the gate causes the majority carriers of the n-type ZnO channel to accumu-
late near the base of the ZnO layer to facilitate a conduction path for the current flow
from drain to source. The positive voltage at the drain causes some of the carriers to
also accumulate near the side of the drain electrode forming a wedge-shaped conduc-
tion path. The bias at the drain also acts as the electron pump to drive the current
to flow. For the second step (Figure 4.14c), the exposed ZnO channel is functionalized
with EGFR monoclonal antibodies (mAbs) having free lysine groups. The immobilized
antibody molecules caused significant decrease in conductivity of the ZnO surface layer,
thus, reducing the drain current. In the third step (Figure 4.14d), the EGFR protein
captured by the EGFR mAbs forms a polarized molecule with a dominant partially-
positive charged tip [322], which led to the accumulation of negative carriers within
the ZnO channel to accumulate near the exposed surface where the antibody-protein
pairs were present. This carrier accumulation was in addition to the conduction path
created near the gate. The combined amount of accumulation layer caused an increase
in the current flow. The top molecule layer (reacted protein) acted as a virtual top gate
and the antibody layer acted as a virtual insulator layer, thus forming a pseudo-double
gated field-effect conduction scheme for the ZnO-bioTFT. The actual measured drain
currents that confirmed each step of the detection process are shown in Figure 4.14a.
The drain voltage is fixed to 10V and the gate voltage is varied from -5V to +15V, and

165
the drain current is measured using an HP4156C semiconductor parameter analyzer
and Cascade Microtech probe station.
Sensitivity of the ZnO-bioTFT immunosensor
To demonstrate the high sensitivity of the ZnO-bioTFT, solutions of pure EGFR (in
PBS) were prepared with four different Molar concentrations using serial dilutions,
namely 10 nM, 100 pM, 1 pM, and finally 10 fM. Each EGFR solution (2 µL) was
introduced to a separate but similar ZnO-bioTFT fabricated on a single chip that were
simultaneously functionalized with EGFR mAbs. The drain current was monitored as
a function of gate voltage with a fixed drain voltage of 10V, for each concentration.
Figure 4.11 shows the measured drain current versus gate voltage of the bioTFT. An
increase in drain current was measured as the EGFR concentration was increased and
the graph also shows that the device was able to detect as low as 10 fM of EGFR
concentration. The trend in the current readings agrees with the hypothesis provided
by the pseudo-double gating effect discussed above.
Figure 4.11: Drain current versus gate bias for various Molar concentrations of pureEGFR proteins detected by the ZnO-bioTFT to demonstrate sensitivity [323].
Selectivity of the ZnO-bioTFT immunosensor
The highly selective sensing of EGFR using the ZnO-bioTFT was also demonstrated. In
this experiment, a 5 mg/ml (in PBS, pH 7.4) goat serum solution was prepared, which

166
contains many different species of proteins. As mentioned above, different EGFR solu-
tions were prepared, namely 100 pM, 1 pM, and 10 fM, using this serum solution as the
solvent and not pure PBS. For all the concentrations, the total amount of serum present
remained approximately the same. Each of the different solutions (2 µL) was introduced
onto a chip containing multiple similar bioTFT devices that were bio-functionalized
with EGFR mAbs. The drain current of each device was measured as a function of
gate voltage, with a fixed drain voltage of 10V. As a control, we first introduced serum
solution without the EGFR proteins to the ZnO-bioTFT. Figure 4.12a shows no change
in the drain current for the pure serum confirming that there were no EGFR molecules
in the solution. The drain current increased as a function of EGFR concentration. The
bio-TFT detected only the EGFR proteins out of the many different proteins present
in the serum solution introduced onto the sensing area of the device. Moreover, the
device was able to discern as low as 10 fM of EGFR protein concentration in the serum
solution. The sensitivity plot of the device for both pure and in-serum detection is
shown in Figure 4.12b which exhibits linearity in the x-y logarithmic scale.

167
Figure 4.12: (a) Drain current versus gate bias for various Molar concentrations ofEGFR-proteins in a serum solution containing many different proteins. (b) Sensitivityplot of the device for pure protein and protein in serum detection [323].
4.3.3 Conclusions
In summary, we have demonstrated a ZnO bioTFT that has the ability to perform im-
munosensing with high sensitivity and selectivity. The channel of the bioTFT is func-
tionalized with amine-terminated EGFR monoclonal antibodies. EGFR proteins with
the lowest concentration of 10 fM were detected by the device in both pure state and
selectively in a concentration serum solution containing various other protein species.
The ZnO-bioTFT enables bias-controlled operation though its bottom gate configura-
tion. The high sensitivity of the device is attributed to its high on-off ratio, and the
output current trend is explained by the pseudo-double gating electric field effect. The
realization of the ZnO-bioTFT functionalized with EGFR mAbs reacting with EGFR
proteins has potential applications in cancer diagnosis and treatment.
168
4.3.4 Materials and Methods
Device fabrication
The device schematic is shown as the inset of Figure 4.13. It follows a back-gate
inverted-staggered configuration. A Si substrate was covered with 1 µm layer of SiO2
through wet oxidation followed by e-beam deposition of a layer of Au (50 nm)/Cr
(100 nm) that serves as the gate electrode. A 70 nm layer of SiO2 serving as the
gate oxide was then deposited through plasma enhanced chemical vapor deposition
(PECVD) with substrate temperature of 250◦C and using SiH4 and N2O as the source
gases. A 50 nm ZnO thin film was grown using metalorganic chemical vapor deposition
(MOCVD) on the top of the SiO2 to serve as the n-type conduction channel, with
substrate temperature at 350◦C and using diethyl zinc (DEZn) as the metal precursor
and ultra-high purity O2 as oxidizer. Au (50 nm)/Ti (100 nm) was deposited through
e-beam evaporation for the source and drain Ohmic contacts. The exposed ZnO channel
acts as the sensing area and has a dimension of 200 µm x 400 µm, giving a W/L ratio
of 2.

169
Figure 4.13: (a) Transconductance curve of the ZnO-bioTFT and its vertical structureschematic (inset); (b) transistor characteristic curves for various gate bias, and the topview of the device (inset) [323].
Shown in the inset of Figure 4.13b is the top view of the TFT device. The electrical
characteristics of the ZnO-bioTFT are shown in Figure 4.13a and b. The transconduc-
tance curve (drain current (ID) vs gate voltage (VGS)) in Figure 4.14a shows that the
bioTFT is a normally-OFF enhancement mode transistor with a threshold voltage of
4.25 V and an ON-OFF ratio of 102.

170
Figure 4.14: (a) Drain current versus gate bias for fixed drain bias of 10V. Step 1: baredevice, Step 2: EGFR-antibody immobilization, and Step 3: EGFR protein detection;(b-d) schematic of the carrier modulation mechanism for steps 1 to 3 respectively [323].
The high ON-OFF ratio of the device provides the high sensitivity of the device
to the charge modulation within the ZnO channel. Figure 4.14b shows the transistor
characteristic curves with drain current versus drain voltage for various gate-biasing of
the device.

171
Bio-functionalization of device with antibodies
To realize the immunosensing ability of the ZnO-bioTFT, the exposed ZnO channel was
functionalized using linkage chemistry, which involves three basic steps. First, the ZnO
channel was functionalized with trimethoxysilane aldehyde (having a reactive aldehyde
end group) by incubating the device in 1% v/v solution of the silane-aldehyde in 95%
ethanol for 30 min. The device was then cured at 120◦C for 15 min. Second, the
aldehyde groups were coupled to the amine groups of the monoclonal EGFR antibodies
(1:50) through reductive amination in the presence of 4 mM sodium cyanoborohydride
in PBS (pH 7.4) for two hours. Third, unreacted aldehyde groups were blocked using 100
mM ethanolamine in a similar manner to prevent non-specific interactions of proteins.
Finally, the device was rinsed in a continuous flow of PBS, pH 7.4 for 10 min.

172
Chapter 5
Conclusions and Perspectives
We are just beginning to see the impact of nanotechnology in the field of regenerative
medicine. The platforms developed in the past decade have set very high expectations
for solving keys questions in medical sciences. With the emergence of induced pluripo-
tent stem cells (iPSCs), the field is now open wider than ever before as all the ethical
concerns regarding embryonic stem cells have been bypassed. However, strict monitor-
ing will be required to use these technologies for controlling the behavior of stem cells.
While a lot of attention has been given to the reprogramming for somatic cells to iPSCs
in the last decade, it is equally important to develop approaches that can control the
differentiation of stem cells into functional cells of interest, in vitro and in vivo. This
thesis provided a few examples of methods, based on nanotechnology, to control and
enhance the neuronal differentiation of NSCs. Most of the methods can also be used
for other adult stem cell lines to control their differentiation.
In chapter 2, the delivery of siRNA into brain tumor cells using quantum dots (QDs)
was demonstrated. The delivery platform not only helped to deliver the therapeutic
siRNA, which inhibited the growth of the brain tumor cells, but also helped to track
the delivery of siRNA due to the highly fluorescent property for the QDs. This part
of research helped in optimization of siRNA delivery methods into cells. The following
section presented the synthesis and application of DexAM, a cyclodextrin-polyamine
construct that was used to deliver hydrophobic small molecules and siRNA into NSCs.
DexAM is particularly advantageous as its cyclodextrin component can encapsulate
hydrophobic small molecules, thus precluding the use of toxic solvents such as DMSO,
which have been shown to affect stem cell behaviors. Additionally, the highly concen-
trated positive charge on the surface of DexAM is useful for forming polyplexes with
173
the negatively charged siRNA molecules. The cyclodextrin component also helped in
reducing the cytotoxicity from the highly positive charge on the surface, thus making
the delivery system biocompatible. DexAM was used to simultaneously deliver siRNA
against SOX9 and the hydrophobic small molecule retinoic acid (RA), a well-known
small molecule for enhancing neuronal differentiation. SOX9, when inhibited, leads
to enhanced neuronal differentiation. Thus their simultaneous delivery using a single
platform led to a significantly enhanced neuronal differentiation of NSCs, as compared
to the differentiation achieved when they were used alone.
Chapter 3 focused on surface chemistry and modifications for controlling the growth
and differentiation of NSCs. In Chapter 2, as discussed above, conventional delivery
systems by way of solution-based (forward) transfection were used, wherein the delivery
vehicle also entered the NSCs along with siRNA. In Chapter 3, however, the approaches
presented, led to enhanced neuronal differentiation of NSCs by way of interacting with
the ECM, which is a vital part of the cellular microenvironment. NanoRU, was pre-
sented as being a platform for the delivery of siRNA (against SOX9) into NSCs by
way of nanotopography-mediated reverse uptake, wherein only the siRNA molecules
were taken up the NSCs. This is a very novel approach and completely depends on the
nanotopographical features presented to the cells. In addition to NSCs, NanoRU was
shown to be applicable for siRNA delivery into cancer cells and normal healthy cells.
Furthermore, miRNA was also shown to be taken up by the NSCs using NanoRU, thus
pointing to the potential of this platform for culturing stem cells. In Chapter 3, the
impact of surface chemistry by way of patterning ECM proteins was also presented. Mi-
cropatterns of an ECM protein (laminin) were generated in a high-throughput fashion
using microcontact printing. NSC differentiation was completely controlled by using
micropatterns of a specific geometry in a given size-range. It was observed that the
highest neuronal differentiation of NSCs (in the absence of exogenous proteins and small
molecules) took place on grid patterns (promoted cell-cell interactions), while the least
was observed on square patterns (cell-cell interactions were highly restricted). Lastly,
in Chapter 3, the impact of novel nanomaterials, such as graphene, on stem cell dif-
ferentiation was demonstrated. It was seen that the mere presence of graphene oxide

174
(GO) as part of the ECM led to the alignment of axons from differentiating human
NSCs. It was also shown that the use of GO-SiNP hybrid structures not only led to the
alignment of axons but also resulted in enhanced neuronal differentiation. However,
the direction of the alignment could not be controlled as the reason for alignment is
yet unknown and is currently under investigation. Once the mechanism leading to the
alignment of hNSCs on GO is elucidated, it would be easier to control the direction of
the aligning axons.
In Chapter 4, the applications of nanotechnology in the emerging field of diagnos-
tics were discussed. The initial idea for developing biosensors stemmed from the notion
that the different biomarkers for differentiating stem cells should be quantified to give
a better idea about the process of stem cell differentiation. However, the initial op-
timization for developing the biosensors, using nanostructures, began with detecting
cancer biomarkers. Graphene-encapsulated nanoparticle arrays were used to develop a
biosensor capable of detecting breast cancer biomarkers such as HER2 and EGFR. In
addition to being a sensitive and selective biosensor, its fabrication process was rela-
tively straightforward, making it highly amenable to industrial manufacturing. Another
graphene-nanoparticle hybrid sensor was developed for sensing the presence of a spe-
cific enzyme. The enzyme lysed a specific linker which attached the gold nanoparticles
(AuNPs) to graphene. Thus, when the linker was lysed the AuNPs got detached from
the surface of graphene, which led to a change in hysteresis, and thus the detection
of the amount of enzyme causing the hysteresis. The enzyme was carboxypeptidaseB,
which is a marker for acute pancreatitis. The last part of Chapter 4 discussed the de-
velopment and application of a zinc oxide (ZnO)-based device for detecting the cancer
biomarker EGFR. This project showed application and usefulness of a new material,
ZnO as a component of a biosensor. The sensor demonstrated exceptional sensitivity
and selectivity towards the targeted biomarker. The use of ZnO-based nanostructures
as part of a new biosensor is currently under way.
The work from this thesis has been remarkably novel, with the ideas being quite
fresh. It is hoped that this work will be used for developing many more approaches
for controlling the behaviors of stem cells, which will eventually transpire to something

175
relevant in the clinic. It is also hoped that the work with biosensors will help in
developing a new generation of biosensors, which are not only sensitive and selective,
but also quick and cheap.

176
References
[1] A. Solanki, J. D. Kim, and K. B. Lee, “Nanotechnology for regenerative medicine:nanomaterials for stem cell imaging,” Nanomedicine, vol. 3, no. 4, pp. 567–578,2008.
[2] K. Bogunia-Kubik and M. Sugisaka, “From molecular biology to nanotechnologyand nanomedicine,” Biosystems, vol. 65, no. 2-3, pp. 123–138, 2002.
[3] L. Ferreira, J. M. Karp, L. Nobre, and R. Langer, “New opportunities: the useof nanotechnologies to manipulate and track stem cells,” Cell Stem Cell, vol. 3,no. 2, pp. 136–46, 2008.
[4] S. Wang, N. Mamedova, N. Kotov, W. Chen, and J. Studer, “Antigen/antibodyimmunocomplex from cdte nanoparticle bioconjugates,” Nano Letters, vol. 2,no. 8, pp. 817–822, 2002.
[5] M. Lewin, N. Carlesso, C. H. Tung, X. W. Tang, D. Cory, D. T. Scadden,and R. Weissleder, “Tat peptide-derivatized magnetic nanoparticles allow in vivotracking and recovery of progenitor cells,” Nature Biotechnology, vol. 18, no. 4,pp. 410–414, 2000.
[6] J. W. M. Bulte, T. Douglas, B. Witwer, S. C. Zhang, E. Strable, B. K. Lewis,H. Zywicke, B. Miller, P. van Gelderen, B. M. Moskowitz, I. D. Duncan, andJ. A. Frank, “Magnetodendrimers allow endosomal magnetic labeling and in vivotracking of stem cells,” Nature Biotechnology, vol. 19, no. 12, pp. 1141–1147, 2001.
[7] E. R. Chemaly, R. Yoneyama, J. V. Frangioni, and R. J. Hajjar, “Tracking stemcells in the cardiovascular system,” Trends in Cardiovascular Medicine, vol. 15,no. 8, pp. 297–302, 2005.
[8] E. Sykova and P. Jendelova, In vivo tracking of stem cells in brain and spinal cordinjury, vol. 161 of Progress in Brain Research, pp. 367–383. 2007.
[9] D. L. J. Thorek, A. Chen, J. Czupryna, and A. Tsourkas, “Superparamagneticiron oxide nanoparticle probes for molecular imaging,” Annals of Biomedical En-gineering, vol. 34, no. 1, pp. 23–38, 2006.
[10] P. Jianhong Zhu, M.D., M. Liangfu Zhou, P. Jianhong Zhu, M.D., andM. Liangfu Zhou, “Tracking neural stem cells in patients with brain trauma,”The new england journal of medicine, vol. 355, no. 22, pp. 2376–2378, 2006.
[11] C. R. Thomas, D. P. Ferris, J. H. Lee, E. Choi, M. H. Cho, E. S. Kim, J. F. Stod-dart, J. S. Shin, J. Cheon, and J. I. Zink, “Noninvasive remote-controlled releaseof drug molecules in vitro using magnetic actuation of mechanized nanoparticles,”J Am Chem Soc, vol. 132, no. 31, pp. 10623–5, 2010.

177
[12] J. W. M. Bulte and D. L. Kraitchman, “Monitoring cell therapy using iron oxidemr contrast agents,” Current Pharmaceutical Biotechnology, vol. 5, no. 6, pp. 567–584, 2004.
[13] . Jeff W. M. Bulte1 and D. L. Kraitchman1, “Iron oxide mr contrast agents formolecular and cellular imaging,” NMR in Biomedicine, vol. 17, pp. 484–499, 2004.
[14] S. Dutz, W. Andra, R. Hergt, R. Muller, C. Oestreich, C. Schmidt, J. Topfer,M. Zeisberger, and M. E. Bellemann, “Influence of dextran coating on the mag-netic behaviour of iron oxide nanoparticles,” Journal of Magnetism and MagneticMaterials, vol. 311, no. 1, pp. 51–54, 2007.
[15] R. Lawaczeck, M. Menzel, and H. Pietsch, “Superparamagnetic iron oxide par-ticles: contrast media for magnetic resonance imaging,” Applied OrganometallicChemistry, vol. 18, no. 10, pp. 506–513, 2004.
[16] A. K. Gupta and A. S. G. Curtis, “Lactoferrin and ceruloplasmin derivatizedsuperparamagnetic iron oxide nanoparticles for targeting cell surface receptors,”Biomaterials, vol. 25, no. 15, pp. 3029–3040, 2004.
[17] W. J. Rogers, C. H. Meyer, and C. M. Kramer, “Technology insight: in vivo celltracking by use of mri,” Nature Clinical Practice Cardiovascular Medicine, vol. 3,no. 10, pp. 554–562, 2006.
[18] C. W. Lu, Y. Hung, J. K. Hsiao, M. Yao, T. H. Chung, Y. S. Lin, S. H. Wu,S. C. Hsu, H. M. Liu, C. Y. Mou, C. S. Yang, D. M. Huang, and Y. C. Chen,“Bifunctional magnetic silica nanoparticles for highly efficient human stem celllabeling,” Nano Letters, vol. 7, no. 1, pp. 149–154, 2007.
[19] J. Emerit, C. Beaumont, and F. Trivin, “Iron metabolism, free radicals, andoxidative injury,” Biomedecine and Pharmacotherapy, vol. 55, no. 6, pp. 333–339,2001.
[20] F. H. Wang, I. H. Lee, N. Holmstrom, T. Yoshitake, D. K. Kim, M. Muhammed,J. Frisen, L. Olson, C. Spenger, and J. Kehr, “Magnetic resonance tracking ofnanoparticle labelled neural stem cells in a rat’s spinal cord,” Nanotechnology,vol. 17, no. 8, pp. 1911–1915, 2006.
[21] C. M. Niemeyer and B. Ceyhan, “Dna-directed functionalization of colloidal goldwith proteins,” Angewandte Chemie-International Edition, vol. 40, pp. 3685–3688, 2001.
[22] J. W. M. Bulte, S.-C. Zhang, P. v. Gelderen, V. Heryneki, E. K. Jordan, I. D. Dun-can, and J. A. Frank, “Neurotransplantation of magnetically labeled oligodendro-cyte progenitors: Magnetic resonance tracking of cell migration and myelination,”Proceedings of the National Academy of Sciences, vol. 96, no. 26, p. 1525615261,1999.
[23] I. D. Duncan and E. A. Milward, “Glial-cell transplants - experimental therapiesof myelin diseases,” Brain Pathology, vol. 5, no. 3, pp. 301–310, 1995.

178
[24] D. L. Kraitchman, A. W. Heldman, E. Atalar, L. C. Amado, B. J. Martin, M. F.Pittenger, J. M. Hare, and J. W. Bulte, “In vivo magnetic resonance imaging ofmesenchymal stem cells in myocardial infarction,” Circulation, vol. 107, pp. 2290–2293, 2003.
[25] M. R. Pickard, P. Barraud, and D. M. Chari, “The transfection of multipotentneural precursor/stem cell transplant populations with magnetic nanoparticles,”Biomaterials, vol. 32, no. 9, pp. 2274–84, 2011.
[26] S. I. Jenkins, M. R. Pickard, N. Granger, and D. M. Chari, “Magneticnanoparticle-mediated gene transfer to oligodendrocyte precursor cell transplantpopulations is enhanced by magnetofection strategies,” ACS Nano, vol. 5, no. 8,pp. 6527–38, 2011.
[27] S. Lin, X. Y. Xie, M. R. Patel, Y. H. Yang, Z. J. Li, F. Cao, O. Gheysens,Y. Zhang, S. S. Gambhir, J. H. Rao, and J. C. Wu, “Quantum dot imaging forembryonic stem cells,” Bmc Biotechnology, vol. 7, 2007.
[28] W. W. Wu and A. D. Li, “Optically switchable nanoparticles for biological imag-ing,” Nanomedicine, vol. 2, no. 4, pp. 523–531, 2007.
[29] X. H. Gao, L. L. Yang, J. A. Petros, F. F. Marshal, J. W. Simons, and S. M. Nie,“In vivo molecular and cellular imaging with quantum dots,” Current Opinion inBiotechnology, vol. 16, no. 1, pp. 63–72, 2005.
[30] X. Michalet, F. F. Pinaud, L. A. Bentolila, J. M. Tsay, S. Doose, J. J. Li, G. Sun-daresan, A. M. Wu, S. S. Gambhir, and S. Weiss, “Quantum dots for live cells,in vivo imaging, and diagnostics,” Science, vol. 307, no. 5709, pp. 538–544, 2005.
[31] M. N. Rhyner, A. M. Smith, X. H. Gao, H. Mao, L. L. Yang, and S. M. Nie,“Quantum dots and multifunctional nanoparticles: new contrast agents for tumorimaging,” Nanomedicine, vol. 1, no. 2, pp. 209–217, 2006.
[32] S. M. Nie, Y. Xing, G. J. Kim, and J. W. Simons, “Nanotechnology applicationsin cancer,” Annual Review of Biomedical Engineering, vol. 9, pp. 257–288, 2007.
[33] X. H. Gao, W. C. W. Chan, and S. M. Nie, “Quantum-dot nanocrystals for ultra-sensitive biological labeling and multicolor optical encoding,” Journal of Biomed-ical Optics, vol. 7, no. 4, pp. 532–537, 2002.
[34] S. M. Nie, “Luminescent quantum dots for multiplexed optical tagging of genes,proteins, and cells,” Cytometry, pp. 25–25, 2002.
[35] X. H. Gao and S. M. Nie, “Molecular profiling of single cells and tissue specimenswith quantum dots,” Trends in Biotechnology, vol. 21, no. 9, pp. 371–373, 2003.
[36] B. X. Cui, C. B. Wu, L. Chen, A. Ramirez, E. L. Bearer, W. P. Li, W. C. Mobley,and S. Chu, “One at a time, live tracking of ngf axonal transport using quantumdots,” Proceedings of the National Academy of Sciences of the United States ofAmerica, vol. 104, no. 34, pp. 13666–13671, 2007.

179
[37] D. Maysinger, M. Behrendt, M. Lalancette-Herbert, and J. Kriz, “Real-time imag-ing of astrocyte response to quantum dots: In vivo screening model system forbiocompatibility of nanoparticles,” Nano Letters, vol. 7, no. 8, pp. 2513–2520,2007.
[38] P. Subramaniam, S. J. Lee, S. Shah, S. Patel, V. Starovoytov, and K. B. Lee,“Generation of a library of non-toxic quantum dots for cellular imaging and sirnadelivery,” Adv Mater, vol. 24, no. 29, pp. 4014–9, 2012.
[39] A. S. Arbab, V. Frenkel, S. D. Pandit, S. A. Anderson, G. T. Yocum, M. Bur,H. M. Khuu, E. J. Read, and J. A. Frank, “Magnetic resonance imaging andconfocal microscopy studies of magnetically labeled endothelial progenitor cellstrafficking to sites of tumor angiogenesis,” Stem Cells, vol. 24, no. 3, pp. 671–678,2006.
[40] A. B. Rosen, D. J. Kelly, A. J. T. Schuldt, J. Lu, I. A. Potapova, S. V. Doronin,K. J. Robichaud, R. B. Robinson, M. R. Rosen, P. R. Brink, G. R. Gaudette, andI. S. Cohen, “Finding fluorescent needles in the cardiac haystack: Tracking humanmesenchymal stem cells labeled with quantum dots for quantitative in vivo three-dimensional fluorescence analysis,” Stem Cells, vol. 25, no. 8, pp. 2128–2138,2007.
[41] J. R. Slotkin, L. Chakrabarti, H. N. Dai, R. S. E. Carney, T. Hirata, B. S.Bregman, G. I. Gallicano, J. G. Corbin, and T. F. Haydar, “In vivo quantumdot labeling of mammalian stem and progenitor cells,” Developmental Dynamics,vol. 236, pp. 3393–3401, 2007.
[42] J. C. Wu, “Comparison of imaging techniques for tracking cardiac stem cell ther-apy,” Journal of Nuclear Medicine, vol. 48, pp. 1916–1919, 2007.
[43] H. Chen, I. Titushkin, M. Stroscio, and M. Cho, “Altered membrane dynamicsof quantum dot-conjugated integrins during osteogenic differentiation of humanbone marrow derived progenitor cells,” Biophysical Journal, vol. 92, no. 1399-1408, p. 1399, 2007.
[44] B. J. Muller-Borer, M. C. Collins, P. R. Gunst, W. E. Cascio, Kypson, and A. P,“Quantum dot labeling of mesenchymal stem cells,” Journal of Nanobiotechnol-ogy, vol. 5, no. 9, 2007.
[45] L. S. Shah, P. A. Clark, E. K. Moioli, M. A. Stroscio, and J. J. Mao, “Labeling ofmesenchymal stem cells by bioconjugated quantum dots,” Nano Letters, vol. 7,pp. 3071–3079, 2007.
[46] A. Rak-Raszewska, M. Marcello, S. Kenny, D. Edgar, V. See, and P. Murray,“Quantum dots do not affect the behaviour of mouse embryonic stem cells andkidney stem cells and are suitable for short-term tracking,” PLoS One, vol. 7,no. 3, p. e32650, 2012.
[47] T. Jamieson, R. Bakhshi, D. Petrova, R. Pocock, M. Imani, and A. M. Seifalian,“Biological applications of quantum dots,” Biomaterials, vol. 28, pp. 4717–4732,2007.

180
[48] B. I. Ipe, M. Lehnig, and C. M. Niemeyer, “On the generation of free radicalspecies from quantum dots,” Small, vol. 1, no. 7, pp. 706–709, 2005.
[49] C. Kirchner, T. Liedl, S. Kudera, T. Pellegrino, A. M. Javier, H. E. Gaub, S. Stol-zle, N. Fertig, and W. J. Parak, “Cytotoxicity of colloidal cdse and cdse/znsnanoparticles,” Nano Letters, vol. 5, no. 2, pp. 331–338, 2005.
[50] I. L. Medintz, H. T. Uyeda, E. R. Goldman, and H. Mattoussi, “Quantum dot bio-conjugates for imaging labelling and sensing,” Nature Materials, vol. 4, pp. 435–446, 2005.
[51] A. P. Alivisatos, W. W. Gu, and C. Larabell, “Quantum dots as cellular probes,”Annual Review of Biomedical Engineering, vol. 7, pp. 55–76, 2005.
[52] P. Ghosh, G. Han, M. De, C. K. Kim, and V. M. Rotello, “Gold nanoparticles indelivery applications,” Adv Drug Deliv Rev, vol. 60, no. 11, pp. 1307–15, 2008.
[53] A. Verma and F. Stellacci, “Effect of surface properties on nanoparticle-cell in-teractions,” Small, vol. 6, no. 1, pp. 12–21, 2010.
[54] C. Yi, D. Liu, C. C. Fong, J. Zhang, and M. Yang, “Gold nanoparticles promoteosteogenic differentiation of mesenchymal stem cells through p38 mapk pathway,”ACS Nano, vol. 4, no. 11, pp. 6439–48, 2010.
[55] J. L. Santos, D. Pandita, J. Rodrigues, A. P. Pego, P. L. Granja, G. Balian, andH. Tomas, “Receptor-mediated gene delivery using pamam dendrimers conjugatedwith peptides recognized by mesenchymal stem cells,” Mol Pharm, vol. 7, no. 3,pp. 763–74, 2010.
[56] M. Goldberg, R. Langer, and X. Jia, “Nanostructured materials for applicationsin drug delivery and tissue engineering,” J Biomater Sci Polym Ed, vol. 18, no. 3,pp. 241–68, 2007.
[57] C. L. Gebhart and A. V. Kabanov, “Evaluation of polyplexes as gene transferagents,” J Control Release, vol. 73, no. 2-3, pp. 401–16, 2001.
[58] D. Pandita, J. L. Santos, J. Rodrigues, A. P. Pego, P. L. Granja, and H. Tomas,“Gene delivery into mesenchymal stem cells: a biomimetic approach usingrgd nanoclusters based on poly(amidoamine) dendrimers,” Biomacromolecules,vol. 12, no. 2, pp. 472–81, 2011.
[59] D. T. Scadden, “The stem-cell niche as an entity of action,” Nature, vol. 441,no. 7097, pp. 1075–9, 2006.
[60] N. J. Sniadecki, R. A. Desai, S. A. Ruiz, and C. S. Chen, “Nanotechnology forcell-substrate interactions,” Ann Biomed Eng, vol. 34, no. 1, pp. 59–74, 2006.
[61] P. G. Gillespie and R. G. Walker, “Molecular basis of mechanosensory transduc-tion,” Nature, vol. 413, no. 6852, pp. 194–202, 2001.
[62] R. J. Jackman, J. L. Wilbur, and G. M. Whitesides, “Fabrication of submicrom-eter features on curved substrates by microcontact printing,” Science, vol. 269,no. 5224, pp. 664–6, 1995.

181
[63] M. Mrksich and G. M. Whitesides, “Using self-assembled monolayers to under-stand the interactions of man-made surfaces with proteins and cells,” Annu RevBiophys Biomol Struct, vol. 25, pp. 55–78, 1996.
[64] B. A. Langowski and K. E. Uhrich, “Microscale plasma-initiated patterning(mupip),” Langmuir, vol. 21, no. 23, pp. 10509–14, 2005.
[65] R. Delgado-Rivera, J. Griffin, C. L. Ricupero, M. Grumet, S. Meiners, andK. E. Uhrich, “Microscale plasma-initiated patterning of electrospun polymerscaffolds,” Colloids Surf B Biointerfaces, vol. 84, no. 2, pp. 591–6, 2011.
[66] J. Tang, R. Peng, and J. Ding, “The regulation of stem cell differentiation by cell-cell contact on micropatterned material surfaces,” Biomaterials, vol. 31, no. 9,pp. 2470–2476, 2010.
[67] K. A. Kilian, B. Bugarija, B. T. Lahn, and M. Mrksich, “Geometric cues fordirecting the differentiation of mesenchymal stem cells,” Proc Natl Acad Sci U SA, vol. 107, no. 11, pp. 4872–7, 2010.
[68] A. Solanki, S. Shah, K. A. Memoli, S. Y. Park, S. Hong, and K. B. Lee, “Con-trolling differentiation of neural stem cells using extracellular matrix protein pat-terns,” Small, vol. 6, no. 22, pp. 2509–13, 2010.
[69] L. Gao, R. McBeath, and C. S. Chen, “Stem cell shape regulates a chondrogenicversus myogenic fate through rac1 and n-cadherin,” Stem Cells, vol. 28, no. 3,pp. 564–72, 2010.
[70] K. Y. Baik, S. Y. Park, K. Heo, K. B. Lee, and S. Hong, “Carbon nanotubemonolayer cues for osteogenesis of mesenchymal stem cells,” Small, vol. 7, no. 6,pp. 741–5, 2011.
[71] S. Y. Park, D. S. Choi, H. J. Jin, J. Park, K. E. Byun, K. B. Lee, and S. Hong,“Polarization-controlled differentiation of human neural stem cells using synergis-tic cues from the patterns of carbon nanotube monolayer coating,” ACS Nano,vol. 5, no. 6, pp. 4704–11, 2011.
[72] T. R. Nayak, H. Andersen, V. S. Makam, C. Khaw, S. Bae, X. Xu, P. L. Ee, J. H.Ahn, B. H. Hong, G. Pastorin, and B. Ozyilmaz, “Graphene for controlled andaccelerated osteogenic differentiation of human mesenchymal stem cells,” ACSNano, vol. 5, no. 6, pp. 4670–8, 2011.
[73] S. Y. Park, J. Park, S. H. Sim, M. G. Sung, K. S. Kim, B. H. Hong, and S. Hong,“Enhanced differentiation of human neural stem cells into neurons on graphene,”Advanced Materials, vol. 23, no. 36, pp. H263–+, 2011. Park, Sung Young Park,Jaesung Sim, Sung Hyun Sung, Moon Gyu Kim, Kwang S. Hong, Byung HeeHong, Seunghun.
[74] Y. R. Shih, C. N. Chen, S. W. Tsai, Y. J. Wang, and O. K. Lee, “Growth ofmesenchymal stem cells on electrospun type i collagen nanofibers,” Stem Cells,vol. 24, no. 11, pp. 2391–7, 2006.
182
[75] G. T. Christopherson, H. Song, and H. Q. Mao, “The influence of fiber diameterof electrospun substrates on neural stem cell differentiation and proliferation,”Biomaterials, vol. 30, no. 4, pp. 556–64, 2009.
[76] S. H. Lim, X. Y. Liu, H. Song, K. J. Yarema, and H. Q. Mao, “The effect ofnanofiber-guided cell alignment on the preferential differentiation of neural stemcells,” Biomaterials, vol. 31, no. 34, pp. 9031–9, 2010.
[77] S. H. Lee, J. H. Sung, and T. H. Park, “Nanomaterial-based biosensor as an emerg-ing tool for biomedical applications,” Ann Biomed Eng, vol. 40, no. 6, pp. 1384–97,2012.
[78] X. Zhang, Q. Guo, and D. Cui, “Recent advances in nanotechnology applied tobiosensors,” Sensors (Basel), vol. 9, no. 2, pp. 1033–53, 2009.
[79] M. Pacios, I. Martin-Fernandez, X. Borrise, M. del Valle, J. Bartroli, E. Lora-Tamayo, P. Godignon, F. Perez-Murano, and M. J. Esplandiu, “Real time proteinrecognition in a liquid-gated carbon nanotube field-effect transistor modified withaptamers,” Nanoscale, vol. 4, no. 19, pp. 5917–23, 2012.
[80] M. B. Lerner, J. D’Souza, T. Pazina, J. Dailey, B. R. Goldsmith, M. K. Robinson,and A. T. Johnson, “Hybrids of a genetically engineered antibody and a carbonnanotube transistor for detection of prostate cancer biomarkers,” ACS Nano,vol. 6, no. 6, pp. 5143–9, 2012.
[81] K. S. Novoselov, A. K. Geim, S. V. Morozov, D. Jiang, Y. Zhang, S. V. Dubonos,I. V. Grigorieva, and A. A. Firsov, “Electric field effect in atomically thin carbonfilms,” Science, vol. 306, no. 5696, pp. 666–669, 2004.
[82] Y. Liu, X. Dong, and P. Chen, “Biological and chemical sensors based on graphenematerials,” Chem Soc Rev, vol. 41, no. 6, pp. 2283–307, 2012.
[83] Y. Ohno, K. Maehashi, Y. Yamashiro, and K. Matsumoto, “Electrolyte-gatedgraphene field-effect transistors for detecting ph protein adsorption,” Nano Let-ters, vol. 9, no. 9, pp. 3318–3322, 2009.
[84] S. Mao, G. Lu, K. Yu, Z. Bo, and J. Chen, “Specific protein detection using ther-mally reduced graphene oxide sheet decorated with gold nanoparticle-antibodyconjugates,” Advanced Materials, vol. 22, no. 32, pp. 3521–+, 2010.
[85] S. Myung, A. Solanki, C. Kim, J. Park, K. S. Kim, and K. B. Lee, “Graphene-encapsulated nanoparticle-based biosensor for the selective detection of cancerbiomarkers,” Adv Mater, vol. 23, no. 19, pp. 2221–5, 2011.
[86] A. Gao, N. Lu, Y. Wang, P. Dai, T. Li, X. Gao, and C. Fan, “Enhanced sensing ofnucleic acids with silicon nanowire field effect transistor biosensors,” Nano Lett,vol. 12, no. 10, pp. 5262–8, 2012.
[87] G. F. Zheng, F. Patolsky, Y. Cui, W. U. Wang, and C. M. Lieber, “Multi-plexed electrical detection of cancer markers with nanowire sensor arrays,” NatureBiotechnology, vol. 23, no. 10, pp. 1294–1301, 2005.

183
[88] R. J. Chen, S. Bangsaruntip, K. A. Drouvalakis, N. W. S. Kam, M. Shim, Y. M.Li, W. Kim, P. J. Utz, and H. J. Dai, “Noncovalent functionalization of carbonnanotubes for highly specific electronic biosensors,” Proceedings of the NationalAcademy of Sciences of the United States of America, vol. 100, no. 9, pp. 4984–4989, 2003.
[89] Z. Medarova, W. Pham, C. Farrar, V. Petkova, and A. Moore, “In vivo imaging ofsirna delivery and silencing in tumors,” Nature Medicine, vol. 13, no. 3, pp. 372–377, 2007.
[90] D. M. Dykxhoorn, D. Palliser, and J. Lieberman, “The silent treatment: sirnasas small molecule drugs,” Gene Therapy, vol. 13, no. 6, pp. 541–552, 2006.
[91] L. Wasungu and D. Hoekstra, “Cationic lipids, lipoplexes and intracellular deliv-ery of genes,” Journal of Controlled Release, vol. 116, no. 2, pp. 255–264, 2006.9th European Symposium on Controlled Drug Delivery Apr 05-07, 2006 Noord-wijk, NETHERLANDS Alza; FIP Int Pharmaceut Federat; Janssen Pharmaceut;Johnson and Johnson Pharmaceuticals ; NV Organon; Traskbritt; Twente Reg;DSM Res; Medtronic; OctoPlus; Elsevier; Innocore; Purac; Inst BioMed Technol.
[92] J. H. Jeong, H. Mok, Y.-K. Oh, and T. G. Park, “sirna conjugate delivery sys-tems,” Bioconjugate Chemistry, vol. 20, no. 1, pp. 5–14, 2009.
[93] M. L. Patil, M. Zhang, S. Betigeri, O. Taratula, H. He, and T. Minko, “Surface-modified and internally cationic polyamidoamine dendrimers for efficient sirnadelivery,” Bioconjugate Chemistry, vol. 19, no. 7, pp. 1396–1403, 2008.
[94] A. Zintchenko, A. Philipp, A. Dehshahri, and E. Wagner, “Simple modifications ofbranched pei lead to highly efficient sirna carriers with low toxicity,” BioconjugateChemistry, vol. 19, no. 7, pp. 1448–1455, 2008.
[95] J.-H. Lee, K. Lee, S. H. Moon, Y. Lee, T. G. Park, and J. Cheon, “All-in-onetarget-cell-specific magnetic nanoparticles for simultaneous molecular imagingand sirna delivery,” Angewandte Chemie-International Edition, vol. 48, no. 23,pp. 4174–4179, 2009.
[96] A. M. Derfus, A. A. Chen, D.-H. Min, E. Ruoslahti, and S. N. Bhatia, “Targetedquantum dot conjugates for sirna delivery,” Bioconjugate Chemistry, vol. 18, no. 5,pp. 1391–1396, 2007.
[97] L. Qi and X. Gao, “Quantum dot-amphipol nanocomplex for intracellular deliveryand real-time imaging of sirna,” Acs Nano, vol. 2, no. 7, pp. 1403–1410, 2008.
[98] J.-S. Lee, J. J. Green, K. T. Love, J. Sunshine, R. Langer, and D. G. Anderson,“Gold, poly(beta-amino ester) nanoparticles for small interfering rna delivery,”Nano Letters, vol. 9, no. 6, pp. 2402–2406, 2009.
[99] M. V. Yezhelyev, L. Qi, R. M. O’Regan, S. Nie, and X. Gao, “Proton-spongecoated quantum dots for sirna delivery and intracellular imaging,” Journal of theAmerican Chemical Society, vol. 130, no. 28, pp. 9006–9012, 2008.

184
[100] D. A. Giljohann, D. S. Seferos, A. E. Prigodich, P. C. Patel, and C. A. Mirkin,“Gene regulation with polyvalent sirna-nanoparticle conjugates,” Journal of theAmerican Chemical Society, vol. 131, no. 6, pp. 2072–+, 2009.
[101] R. Kikkeri, B. Lepenies, A. Adibekian, P. Laurino, and P. H. Seeberger, “In vitroimaging and in vivo liver targeting with carbohydrate capped quantum dots,”Journal of the American Chemical Society, vol. 131, no. 6, pp. 2110–+, 2009.
[102] A. A. Bhirde, V. Patel, J. Gavard, G. Zhang, A. A. Sousa, A. Masedunskas,R. D. Leapman, R. Weigert, J. S. Gutkind, and J. F. Rusling, “Targeted killingof cancer cells in vivo and in vitro with egf-directed carbon nanotube-based drugdelivery,” Acs Nano, vol. 3, no. 2, pp. 307–316, 2009.
[103] Q. W. Fan and W. A. Weiss, “Rna interference against a glioma-derived allele ofegfr induces blockade at g(2)m,” Oncogene, vol. 24, no. 5, pp. 829–837, 2005.
[104] E. Arwert, S. Hingtgen, J.-L. Figueiredo, H. Bergquist, U. Mahmood,R. Weissleder, and K. Shah, “Visualizing the dynamics of egfr activity andantiglioma therapies in vivo,” Cancer Research, vol. 67, no. 15, pp. 7335–7342,2007.
[105] A. Veeravagu, Z. Liu, G. Niu, K. Chen, B. Jia, W. Cai, C. Jin, A. R. Hsu,A. J. Connolly, V. Tse, F. Wang, and X. Chen, “Integrin alpha(v)beta(3)-targeted radioimmunotherapy of glioblastoma multiforme,” Clinical Cancer Re-search, vol. 14, no. 22, pp. 7330–7339, 2008.
[106] M. S. Lesniak and H. Brem, “Targeted therapy for brain tumours,” Nature Re-views Drug Discovery, vol. 3, no. 6, pp. 499–508, 2004.
[107] A. J. Ekstrand, N. Sugawa, C. D. James, and V. P. Collins, “Amplified andrearranged epidermal growth-factor receptor genes in human glioblastomas revealdeletions of sequences encoding portions of the n-terminal and or c-terminal tails,”Proceedings of the National Academy of Sciences of the United States of America,vol. 89, no. 10, pp. 4309–4313, 1992.
[108] P. A. Humphrey, A. J. Wong, B. Vogelstein, M. R. Zalutsky, G. N. Fuller, G. E.Archer, H. S. Friedman, M. M. Kwatra, S. H. Bigner, and D. D. Bigner, “An-tisynthetic peptide antibody reacting at the fusion junction of deletion mutantepidermal growth-factor receptors in human glioblastoma,” Proceedings of theNational Academy of Sciences of the United States of America, vol. 87, no. 11,pp. 4207–4211, 1990.
[109] I. Vivanco and C. L. Sawyers, “The phosphatidylinositol 3-kinase-akt pathway inhuman cancer,” Nature Reviews Cancer, vol. 2, no. 7, pp. 489–501, 2002.
[110] F. Yamoutpour, V. Bodernpudi, S. E. Park, W. Pan, M. J. Mauzy, R. A. Kratzke,A. Dudek, D. A. Potter, R. A. Woo, D. M. O’Rourke, D. J. Tindall, and F. Faras-sati, “Gene silencing for epidermal growth factor receptor variant iii induces cell-specific cytotoxicity,” Molecular Cancer Therapeutics, vol. 7, no. 11, pp. 3586–3597, 2008.

185
[111] J. Jung, A. Solanki, K. A. Memoli, K.-i. Kamei, H. Kim, M. A. Drahl, L. J.Williams, H.-R. Tseng, and K. Lee, “Selective inhibition of human brain tu-mor cells through multifunctional quantum-dot-based sirna delivery,” AngewandteChemie-International Edition, vol. 49, no. 1, pp. 103–107, 2010. Times Cited: 36.
[112] J. J. Li, Y. A. Wang, W. Z. Guo, J. C. Keay, T. D. Mishima, M. B. John-son, and X. G. Peng, “Large-scale synthesis of nearly monodisperse cdse/cdscore/shell nanocrystals using air-stable reagents via successive ion layer adsorp-tion and reaction,” Journal of the American Chemical Society, vol. 125, no. 41,pp. 12567–12575, 2003.
[113] R. G. Xie, U. Kolb, J. X. Li, T. Basche, and A. Mews, “Synthesis and character-ization of highly luminescent cdse-core cds/zn0.5cd0.5s/zns multishell nanocrys-tals,” Journal of the American Chemical Society, vol. 127, no. 20, pp. 7480–7488,2005.
[114] W. Liu, M. Howarth, A. B. Greytak, Y. Zheng, D. G. Nocera, A. Y. Ting, andM. G. Bawendi, “Compact biocompatible quantum dots functionalized for cellularimaging,” Journal of the American Chemical Society, vol. 130, no. 4, pp. 1274–1284, 2008.
[115] K. Susumu, H. T. Uyeda, I. L. Medintz, T. Pons, J. B. Delehanty, and H. Mat-toussi, “Enhancing the stability and biological functionalities of quantum dotsvia compact multifunctional ligands,” Journal of the American Chemical Society,vol. 129, no. 45, pp. 13987–13996, 2007.
[116] S. Kida, M. Maeda, K. Hojo, Y. Eto, S. Nakagawa, and K. Kawasaki, “Stud-ies on heterobifunctional cross-linking reagents, 6-maleimidohexanoic acid activeesters,” Chemical & Pharmaceutical Bulletin, vol. 55, no. 4, pp. 685–687, 2007.
[117] A. S. M. Kamruzzahan, A. Ebner, L. Wildling, F. Kienberger, C. K. Riener,C. D. Hahn, P. D. Pollheimer, P. Winklehner, M. Hoelzl, B. Lackner, D. M.Schoerkl, P. Hinterdorfer, and H. J. Gruber, “Antibody linking to atomic forcemicroscope tips via disulfide bond formation,” Bioconjugate Chemistry, vol. 17,no. 6, pp. 1473–1481, 2006.
[118] S. Bauhuber, C. Hozsa, M. Breunig, and A. Goepferich, “Delivery of nucleicacids via disulfide-based carrier systems,” Advanced Materials, vol. 21, no. 32-33,pp. 3286–3306, 2009.
[119] Y. L. Chiu, A. Ali, C. Y. Chu, H. Cao, and T. M. Rana, “Visualizing a correlationbetween sirna localization, cellular uptake, and rnai in living cells,” Chemistry &Biology, vol. 11, no. 8, pp. 1165–1175, 2004.
[120] J. Xie, K. Chen, H.-Y. Lee, C. Xu, A. R. Hsu, S. Peng, X. Chen, and S. Sun,“Ultrasmall c(rgdyk)-coated fe(3)o(4) nanoparticles and their specific targetingto integrin alpha(v)beta(3)-rich tumor cells,” Journal of the American ChemicalSociety, vol. 130, no. 24, pp. 7542–+, 2008.

186
[121] W. B. Cai, D. W. Shin, K. Chen, O. Gheysens, Q. Z. Cao, S. X. Wang, S. S.Gambhir, and X. Y. Chen, “Peptide-labeled near-infrared quantum dots for imag-ing tumor vasculature in living subjects,” Nano Letters, vol. 6, no. 4, pp. 669–676,2006.
[122] C. C. Berry, “Intracellular delivery of nanopartides via the hiv-1 tat pepticle,”Nanomedicine, vol. 3, no. 3, pp. 357–365, 2008.
[123] G. Ruan, A. Agrawal, A. I. Marcus, and S. Nie, “Imaging and tracking of tatpeptide-conjugated quantum dots in living cells: new insights into nanoparticleuptake, intracellular transport, and vesicle shedding,” Journal of the AmericanChemical Society, vol. 129, no. 47, pp. 14759–14766, 2007.
[124] A. M. Derfus, W. C. W. Chan, and S. N. Bhatia, “Probing the cytotoxicity ofsemiconductor quantum dots,” Nano Letters, vol. 4, no. 1, pp. 11–18, 2004.
[125] A. Meyer, C. M. van Golen, B. Kim, K. L. van Golen, and E. L. Feldman, “Integrinexpression regulates neuroblastoma attachment and migration,” Neoplasia, vol. 6,no. 4, pp. 332–342, 2004.
[126] L. Martiniova, E. W. Lai, A. G. Elkahloun, M. Abu-Asab, A. Wickremasinghe,D. C. Solis, S. M. Perera, T.-T. Huynh, I. A. Lubensky, A. S. Tischler, R. Kvet-nansky, S. Alesci, J. C. Morris, and K. Pacak, “Characterization of an animalmodel of aggressive metastatic pheochromocytoma linked to a specific gene sig-nature,” Clinical & Experimental Metastasis, vol. 26, no. 3, pp. 239–250, 2009.
[127] Z.-b. Li, W. Cai, Q. Cao, K. Chen, Z. Wu, L. He, and X. Chen, “64cu-labeled ”tetrameric and octameric rgd peptides for small-animal pet of tumoralpha(v)beta(3) integrin expression,” Journal of Nuclear Medicine, vol. 48, no. 7,pp. 1162–1171, 2007.
[128] M. Y. Wang, K. V. Lu, S. Zhu, E. Q. Dia, I. Vivanco, G. M. Shackleford,W. K. Cavenee, I. K. Mellinghoff, T. F. Cloughesy, C. L. Sawyers, and P. S.Mischel, “Mammalian target of rapamycin inhibition promotes response to epi-dermal growth factor receptor kinase inhibitors in pten-deficient and pten-intactglioblastoma cells,” Cancer Research, vol. 66, no. 16, pp. 7864–7869, 2006.
[129] R. C. Schugar, P. D. Robbins, and B. M. Deasy, “Small molecules in stem cellself-renewal and differentiation,” Gene Ther, vol. 15, no. 2, pp. 126–35, 2008.
[130] Y. Xu, Y. Shi, and S. Ding, “A chemical approach to stem-cell biology and re-generative medicine,” Nature, vol. 453, no. 7193, pp. 338–344, 2008.
[131] T. Lin, R. Ambasudhan, X. Yuan, W. Li, S. Hilcove, R. Abujarour, X. Lin,H. S. Hahm, E. Hao, A. Hayek, and S. Ding, “A chemical platform for improvedinduction of human ipscs,” Nat Meth, vol. 6, no. 11, pp. 805–808, 2009.
[132] C. A. Lyssiotis, L. L. Lairson, A. E. Boitano, H. Wurdak, S. Zhu, and P. G.Schultz, “Chemical control of stem cell fate and developmental potential,” AngewChem Int Ed Engl, vol. 50, no. 1, pp. 200–42, 2011.
[133] W. L. Jorgensen and E. M. Duffy, “Prediction of drug solubility from structure,”Adv Drug Deliv Rev, vol. 54, no. 3, pp. 355–66, 2002.

187
[134] K. V. Balakin, N. P. Savchuk, and I. V. Tetko, “In silico approaches to predictionof aqueous and dmso solubility of drug-like compounds: trends, problems andsolutions,” Curr Med Chem, vol. 13, no. 2, pp. 223–41, 2006.
[135] R. Pal, M. K. Mamidi, A. K. Das, and R. Bhonde, “Diverse effects of dimethylsulfoxide (dmso) on the differentiation potential of human embryonic stem cells,”Arch Toxicol, vol. 86, no. 4, pp. 651–61, 2012.
[136] D. Bumcrot, M. Manoharan, V. Koteliansky, and D. W. Y. Sah, “Rnai therapeu-tics: a potential new class of pharmaceutical drugs,” Nature Chemical Biology,vol. 2, no. 12, pp. 711–719, 2006.
[137] D. H. Kim and J. J. Rossi, “Strategies for silencing human disease using rnainterference,” Nature Reviews Genetics, vol. 8, no. 3, pp. 173–184, 2007.
[138] H. Zaehres, M. W. Lensch, L. Daheron, S. A. Stewart, J. Itskovitz-Eldor, andG. Q. Daley, “High-efficiency rna interference in human embryonic stem cells,”Stem Cells, vol. 23, no. 3, pp. 299–305, 2005.
[139] L. Ding and F. Buchholz, “Rnai in embryonic stem cells,” Stem Cell Rev., vol. 2,no. 1, pp. 11–18, 2006.
[140] W. W. Y. Yau, P. O. Rujitanaroj, L. Lam, and S. Y. Chew, “Directing stem cellfate by controlled rna interference,” Biomaterials, vol. 33, no. 9, pp. 2608–2628,2012.
[141] M. L. Hribal, J. Nakae, T. Kitamura, J. R. Shutter, and D. Accili, “Regulationof insulin-like growth factor-dependent myoblast differentiation by foxo forkheadtranscription factors,” J Cell Biol, vol. 162, no. 4, pp. 535–41, 2003.
[142] Z. He, J. Li, C. Zhen, L. Feng, and X. Ding, “Knockdown of p53 by rnai in escells facilitates ra-induced differentiation into muscle cells,” Biochem Biophys ResCommun, vol. 335, no. 3, pp. 676–83, 2005.
[143] M. Dominska and D. M. Dykxhoorn, “Breaking down the barriers: sirna deliveryand endosome escape,” J Cell Sci, vol. 123, no. Pt 8, pp. 1183–9, 2010.
[144] J. Wang, Z. Lu, M. G. Wientjes, and J. L. Au, “Delivery of sirna therapeutics:barriers and carriers,” AAPS J, vol. 12, no. 4, pp. 492–503, 2010.
[145] A. Solanki, S. Shah, P. T. Yin, and K. B. Lee, “Nanotopography-mediated reverseuptake for sirna delivery into neural stem cells to enhance neuronal differentia-tion,” Sci Rep, vol. 3, p. 1553, 2013. Solanki, Aniruddh Shah, Shreyas Yin,Perry T Lee, Ki-Bum England Scientific reports Sci Rep. 2013 Mar 27;3:1553.doi: 10.1038/srep01553.
[146] T. Merdan, J. Kopecek, and T. Kissel, “Prospects for cationic polymers in geneand oligonucleotide therapy against cancer,” Advanced Drug Delivery Reviews,vol. 54, no. 5, pp. 715–758, 2002.
[147] S. K. Dhara, A. Majumder, M. C. Dodla, and S. L. Stice, “Nonviral gene deliveryin neural progenitors derived from human pluripotent stem cells,” Methods MolBiol, vol. 767, pp. 343–54, 2011.

188
[148] F. Zhao, Y. Zhao, Y. Liu, X. L. Chang, C. Y. Chen, and Y. L. Zhao, “Cellularuptake, intracellular trafficking, and cytotoxicity of nanomaterials,” Small, vol. 7,no. 10, pp. 1322–1337, 2011.
[149] M. E. Davis and M. E. Brewster, “Cyclodextrin-based pharmaceutics: Past,present and future,” Nature Reviews Drug Discovery, vol. 3, no. 12, pp. 1023–1035, 2004.
[150] M. E. Brewster and T. Loftsson, “Cyclodextrins as pharmaceutical solubilizers,”Advanced Drug Delivery Reviews, vol. 59, no. 7, pp. 645–666, 2007.
[151] K. Uekama, F. Hirayama, and T. Irie, “Cyclodextrin drug carrier systems,” Chem-ical Reviews, vol. 98, no. 5, pp. 2045–2076, 1998.
[152] S. Yang and S. May, “Release of cationic polymer-dna complexes from the en-dosome: A theoretical investigation of the proton sponge hypothesis,” J ChemPhys, vol. 129, no. 18, p. 185105, 2008.
[153] S. H. Pun, N. C. Bellocq, A. J. Liu, G. Jensen, T. Machemer, E. Quijano,T. Schluep, S. F. Wen, H. Engler, J. Heidel, and M. E. Davis, “Cyclodextrin-modified polyethylenimine polymers for gene delivery,” Bioconjugate Chemistry,vol. 15, no. 4, pp. 831–840, 2004.
[154] C. Kim, B. P. Shah, P. Subramaniam, and K.-B. Lee, “Synergistic inductionof apoptosis in brain cancer cells by targeted codelivery of sirna and anticancerdrugs,” Molecular Pharmaceutics, vol. 8, no. 5, pp. 1955–1961, 2011.
[155] M. E. Davis and N. C. Bellocq, “Cyclodextrin-containing polymers for gene de-livery,” Journal of Inclusion Phenomena and Macrocyclic Chemistry, vol. 44,no. 1-4, pp. 17–22, 2002.
[156] J. D. Heidel, S. Hu, X. F. Liu, T. J. Triche, and M. E. Davis, “Lack of interferonresponse in animals to naked sirnas,” Nat Biotechnol, vol. 22, no. 12, pp. 1579–82,2004.
[157] J. D. Heidel, S. W. Hu, X. F. Liu, T. Triche, and M. E. Davis, “Cyclodextrin-containing polycations (cdps) for in vivo delivery of sirna,” Abstracts of Papersof the American Chemical Society, vol. 227, pp. 208–BIOT, 2004.
[158] C. C. Stolt, P. Lommes, E. Sock, M. C. Chaboissier, A. Schedl, and M. Wegner,“The sox9 transcription factor determines glial fate choice in the developing spinalcord,” Gene. Dev., vol. 17, no. 13, pp. 1677–1689, 2003.
[159] L. C. Cheng, E. Pastrana, M. Tavazoie, and F. Doetsch, “mir-124 regulates adultneurogenesis in the subventricular zone stem cell niche,” Nature Neurosci., vol. 12,no. 4, pp. 399–408, 2009.
[160] S. Jacobs, D. C. Lie, K. L. DeCicco, Y. Shi, L. M. DeLuca, F. H. Gage, and R. M.Evans, “Retinoic acid is required early during adult neurogenesis in the dentategyrus,” Proceedings of the National Academy of Sciences of the United States ofAmerica, vol. 103, no. 10, pp. 3902–3907, 2006.

189
[161] J. Marill, N. Idres, C. C. Capron, E. Nguyen, and G. G. Chabot, “Retinoic acidmetabolism and mechanism of action: a review,” Curr Drug Metab, vol. 4, no. 1,pp. 1–10, 2003.
[162] F. Leypoldt, J. Lewerenz, and A. Methner, “Identification of genes up-regulatedby retinoic-acid-induced differentiation of the human neuronal precursor cell linentera-2 cl.d1,” J Neurochem, vol. 76, no. 3, pp. 806–14, 2001.
[163] Y. K. Jang, J. J. Park, M. C. Lee, B. H. Yoon, Y. S. Yang, S. E. Yang, and S. U.Kim, “Retinoic acid-mediated induction of neurons and glial cells from humanumbilical cord-derived hematopoietic stem cells,” J Neurosci Res, vol. 75, no. 4,pp. 573–84, 2004.
[164] C. E. Scott, S. L. Wynn, A. Sesay, C. Cruz, M. Cheung, M. V. Gomez Gaviro,S. Booth, B. Gao, K. S. Cheah, R. Lovell-Badge, and J. Briscoe, “Sox9 inducesand maintains neural stem cells,” Nat Neurosci, vol. 13, no. 10, pp. 1181–9, 2010.
[165] S. Kumar, D. Chanda, and S. Ponnazhagan, “Therapeutic potential of geneticallymodified mesenchymal stem cells,” Gene Ther., vol. 15, no. 10, pp. 711–715, 2008.
[166] J. J. Green, B. Y. Zhou, M. M. Mitalipova, C. Beard, R. Langer, R. Jaenisch,and D. G. Anderson, “Nanoparticles for gene transfer to human embryonic stemcell colonies,” Nano Letters, vol. 8, no. 10, pp. 3126–3130, 2008.
[167] F. Yang, S. W. Cho, S. M. Son, S. R. Bogatyrev, D. Singh, J. J. Green, Y. Mei,S. Park, S. H. Bhang, B. S. Kim, R. Langer, and D. G. Anderson, “Geneticengineering of human stem cells for enhanced angiogenesis using biodegradablepolymeric nanoparticles,” Proc. Natl. Acad. Sci. USA, vol. 107, no. 8, pp. 3317–3322, 2010.
[168] J. Zoldan, A. K. R. Lytton-Jean, E. D. Karagiannis, K. Deiorio-Haggar, L. M.Bellan, R. Langer, and D. G. Anderson, “Directing human embryonic stem celldifferentiation by non-viral delivery of sirna in 3d culture,” Biomaterials, vol. 32,no. 31, pp. 7793–7800, 2011.
[169] A. Heidersbach, A. Gaspar-Maia, M. T. McManus, and M. Ramalho-Santos, “Rnainterference in embryonic stem cells and the prospects for future therapies,” GeneTher., vol. 13, no. 6, pp. 478–486, 2006.
[170] T. Geng, Y. H. Zhan, J. Wang, and C. Lu, “Transfection of cells using flow-through electroporation based on constant voltage,” Nature Protoc., vol. 6, no. 8,pp. 1192–1208, 2011.
[171] J. E. Kim, J. Y. Shin, and M. H. Cho, “Magnetic nanoparticles: an update ofapplication for drug delivery and possible toxic effects,” Arch. Toxicol., vol. 86,no. 5, pp. 685–700, 2012.
[172] E. V. B. van Gaal, R. van Eijk, R. S. Oosting, R. J. Kok, W. E. Hennink, D. J. A.Crommelin, and E. Mastrobattista, “How to screen non-viral gene delivery sys-tems in vitro?,” J. Control. Release, vol. 154, no. 3, pp. 218–232, 2011.

190
[173] M. Rosner, N. Siegel, C. Fuchs, N. Slabina, H. Dolznig, and M. Hengstschlager,“Efficient sirna-mediated prolonged gene silencing in human amniotic fluid stemcells,” Nature Protoc., vol. 5, no. 6, pp. 1081–1095, 2010.
[174] K. M. McMahon, R. K. Mutharasan, S. Tripathy, D. Veliceasa, M. Bobeica, D. K.Shumaker, A. J. Luthi, B. T. Helfand, H. Ardehali, C. A. Mirkin, O. Volpert, andC. S. Thaxton, “Biomimetic high density lipoprotein nanoparticles for nucleicacid delivery,” Nano Lett., vol. 11, no. 3, pp. 1208–1214, 2011.
[175] S. J. Tseng and S. C. Tang, “Development of poly(amino ester glycol ure-thane)/sirna polyplexes for gene silencing,” Bioconjugate Chem., vol. 18, no. 5,pp. 1383–1390, 2007.
[176] Y. Omidi, J. Barar, and S. Akhtar, “Toxicogenomics of cationic lipid-based vectorsfor gene therapy: impact of microarray technology,” Curr Drug Deliv, vol. 2, no. 4,pp. 429–41, 2005.
[177] S. Akhtar and I. Benter, “Toxicogenomics of non-viral drug delivery systems forrnai: potential impact on sirna-mediated gene silencing activity and specificity,”Adv Drug Deliv Rev, vol. 59, no. 2-3, pp. 164–82, 2007.
[178] L. Braydich-Stolle, S. Hussain, J. J. Schlager, and M. C. Hofmann, “In vitrocytotoxicity of nanoparticles in mammalian germline stem cells,” Toxicol. Sci.,vol. 88, no. 2, pp. 412–419, 2005.
[179] S. J. H. Soenen and M. De Cuyper, “Assessing iron oxide nanoparticle toxicity invitro: current status and future prospects,” Nanomedicine, vol. 5, no. 8, pp. 1261–1275, 2010.
[180] J. W. Yoo, D. J. Irvine, D. E. Discher, and S. Mitragotri, “Bio-inspired, bioengi-neered and biomimetic drug delivery carriers,” Nature Rev. Drug Discov., vol. 10,no. 7, pp. 521–535, 2011.
[181] T. Segura, M. J. Volk, and L. D. Shea, “Substrate-mediated dna delivery: roleof the cationic polymer structure and extent of modification,” J Control Release,vol. 93, no. 1, pp. 69–84, 2003.
[182] Z. Bengali, A. K. Pannier, T. Segura, B. C. Anderson, J. H. Jang, T. A. Mus-toe, and L. D. Shea, “Gene delivery through cell culture substrate adsorbed dnacomplexes,” Biotechnol Bioeng, vol. 90, no. 3, pp. 290–302, 2005.
[183] S. Mehrotra, I. Lee, and C. Chan, “Multilayer mediated forward and patternedsirna transfection using linear-pei at extended n/p ratios,” Acta Biomater, vol. 5,no. 5, pp. 1474–88, 2009.
[184] A. Oyane, H. Tsurushima, and A. Ito, “Highly efficient gene transfer system usinga laminin-dna-apatite composite layer,” J Gene Med, vol. 12, no. 2, pp. 194–206,2010.
[185] K. R. Kam, L. A. Walsh, S. M. Bock, M. Koval, K. E. Fischer, R. F. Ross,and T. A. Desai, “Nanostructure-mediated transport of biologics across epithelialtissue: Enhancing permeability via nanotopography,” Nano Lett, vol. 13, no. 1,pp. 164–71, 2013.

191
[186] S. Park, Y. S. Kim, W. B. Kim, and S. Jon, “Carbon nanosyringe array as aplatform for intracellular delivery,” Nano Lett, vol. 9, no. 4, pp. 1325–9, 2009.
[187] A. K. Shalek, J. T. Gaublomme, L. Wang, N. Yosef, N. Chevrier, M. S. An-dersen, J. T. Robinson, N. Pochet, D. Neuberg, R. S. Gertner, I. Amit, J. R.Brown, N. Hacohen, A. Regev, C. J. Wu, and H. Park, “Nanowire-mediateddelivery enables functional interrogation of primary immune cells: Applicationto the analysis of chronic lymphocytic leukemia,” Nano Letters, vol. 12, no. 12,pp. 6498–6504, 2012.
[188] A. K. Shalek, J. T. Robinson, E. S. Karp, J. S. Lee, D. R. Ahn, M. H. Yoon,A. Sutton, M. Jorgolli, R. S. Gertner, T. S. Gujral, G. MacBeath, E. G. Yang,and H. Park, “Vertical silicon nanowires as a universal platform for deliveringbiomolecules into living cells,” Proc Natl Acad Sci U S A, vol. 107, no. 5, pp. 1870–5, 2010.
[189] C. J. Bettinger, R. Langer, and J. T. Borenstein, “Engineering substrate topog-raphy at the micro- and nanoscale to control cell function,” Angew Chem Int EdEngl, vol. 48, no. 30, pp. 5406–15, 2009.
[190] E. K. Yim, E. M. Darling, K. Kulangara, F. Guilak, and K. W. Leong,“Nanotopography-induced changes in focal adhesions, cytoskeletal organization,and mechanical properties of human mesenchymal stem cells,” Biomaterials,vol. 31, no. 6, pp. 1299–306, 2010.
[191] A. F. Adler and K. W. Leong, “Emerging links between surface nanotechnologyand endocytosis: impact on nonviral gene delivery,” Nano Today, vol. 5, no. 6,pp. 553–569, 2010.
[192] B. K. Teo, S. H. Goh, T. S. Kustandi, W. W. Loh, H. Y. Low, and E. K. Yim,“The effect of micro and nanotopography on endocytosis in drug and gene deliverysystems,” Biomaterials, vol. 32, no. 36, pp. 9866–75, 2011.
[193] K. Saha, A. J. Keung, E. F. Irwin, Y. Li, L. Little, D. V. Schaffer, and K. E.Healy, “Substrate modulus directs neural stem cell behavior,” Biophysical Jour-nal, vol. 95, no. 9, pp. 4426–4438, 2008.
[194] A. A. Moe, M. Suryana, G. Marcy, S. K. Lim, S. Ankam, J. Z. Goh, J. Jin, B. K.Teo, J. B. Law, H. Y. Low, E. L. Goh, M. P. Sheetz, and E. K. Yim, “Microarraywith micro- and nano-topographies enables identification of the optimal topogra-phy for directing the differentiation of primary murine neural progenitor cells,”Small, vol. 8, no. 19, pp. 3050–61, 2012.
[195] A. Dhaliwal, J. Lam, M. Maldonado, C. Lin, and T. Segura, “Extracellular matrixmodulates non-viral gene transfer to mouse mesenchymal stem cells,” Soft Matter,vol. 8, no. 5, pp. 1451–1459, 2012.
[196] S. Khormaee, O. A. Ali, J. Chodosh, and D. J. Mooney, “Optimizing sirna efficacythrough alteration in the target cell-adhesion substrate interaction,” J BiomedMater Res A, vol. 100, no. 10, pp. 2637–43, 2012.

192
[197] A. H. Reddi, “Role of morphogenetic proteins in skeletal tissue engineering andregeneration,” Nature Biotech., vol. 16, no. 3, pp. 247–252, 1998.
[198] R. Kalluri, “Basement membranes: Structure, assembly and role in tumour an-giogenesis,” Nature Rev. Cancer, vol. 3, no. 6, pp. 422–433, 2003.
[199] Z. Bengali, J. C. Rea, and L. D. Shea, “Gene expression and internalization fol-lowing vector adsorption to immobilized proteins: dependence on protein identityand density,” J Gene Med, vol. 9, no. 8, pp. 668–78, 2007.
[200] H. J. Kong, S. Hsiong, and D. J. Mooney, “Nanoscale cell adhesion ligand presen-tation regulates nonviral gene delivery and expression,” Nano Lett, vol. 7, no. 1,pp. 161–6, 2007.
[201] L. Pelkmans, T. Burli, M. Zerial, and A. Helenius, “Caveolin-stabilized membranedomains as multifunctional transport and sorting devices in endocytic membranetraffic,” Cell, vol. 118, no. 6, pp. 767–780, 2004.
[202] E. V. Makeyev, J. W. Zhang, M. A. Carrasco, and T. Maniatis, “The micrornamir-124 promotes neuronal differentiation by triggering brain-specific alternativepre-mrna splicing,” Mol. Cell, vol. 27, no. 3, pp. 435–448, 2007.
[203] T. Sato, T. Ishii, and Y. Okahata, “In vitro gene delivery mediated by chitosan.effect of ph, serum, and molecular mass of chitosan on the transfection efficiency,”Biomaterials, vol. 22, no. 15, pp. 2075–2080, 2001.
[204] F. Guilak, D. M. Cohen, B. T. Estes, J. M. Gimble, W. Liedtke, and C. S. Chen,“Control of stem cell fate by physical interactions with the extracellular matrix,”Cell Stem Cell, vol. 5, no. 1, pp. 17–26, 2009.
[205] C. J. Flaim, S. Chien, and S. N. Bhatia, “An extracellular matrix microarray forprobing cellular differentiation,” Nature Methods, vol. 2, no. 2, pp. 119–125, 2005.
[206] C. J. Flaim, D. Teng, S. Chien, and S. N. Bhatia, “Combinatorial signalingmicroenvironments for studying stem cell fate,” Stem Cells and Development,vol. 17, no. 1, pp. 29–39, 2008.
[207] F. H. Gage, J. Ray, and L. J. Fisher, “Isolation, characterization, and use ofstem-cells from the cns,” Annual Review of Neuroscience, vol. 18, pp. 159–192,1995.
[208] F. H. Gage, “Mammalian neural stem cells,” Science, vol. 287, no. 5457, pp. 1433–1438, 2000.
[209] E. D. Roberson and L. Mucke, “100 years and counting: Prospects for defeatingalzheimer’s disease,” Science, vol. 314, no. 5800, pp. 781–784, 2006.
[210] A. Bjorklund and O. Lindvall, “Cell replacement therapies for central nervoussystem disorders,” Nature Neuroscience, vol. 3, no. 6, pp. 537–544, 2000.
[211] J. H. Kim, J. M. Auerbach, J. A. Rodriguez-Gomez, I. Velasco, D. Gavin,N. Lumelsky, S. H. Lee, J. Nguyen, R. Sanchez-Pernaute, K. Bankiewicz, andR. McKay, “Dopamine neurons derived from embryonic stem cells function in ananimal model of parkinson’s disease,” Nature, vol. 418, no. 6893, pp. 50–56, 2002.

193
[212] O. Lindvall and Z. Kokaia, “Stem cells for the treatment of neurological disor-ders,” Nature, vol. 441, no. 7097, pp. 1094–1096, 2006.
[213] C. B. Johansson, S. Momma, D. L. Clarke, M. Risling, U. Lendahl, and J. Frisen,“Identification of a neural stem cell in the adult mammalian central nervoussystem,” Cell, vol. 96, no. 1, pp. 25–34, 1999.
[214] G. Martino and S. Pluchino, “The therapeutic potential of neural stem cells,”Nature Reviews Neuroscience, vol. 7, no. 5, pp. 395–406, 2006.
[215] F. Barnabe-Heider and J. Frisen, “Stem cells for spinal cord repair,” Cell StemCell, vol. 3, no. 1, pp. 16–24, 2008.
[216] K. G. Bath and F. S. Lee, “Neurotrophic factor control of adult svz neurogenesis,”Developmental Neurobiology, vol. 70, no. 5, pp. 339–349, 2010. Si.
[217] N. Matsuda, H. Lu, Y. Fukata, J. Noritake, H. Gao, S. Mukherjee, T. Nemoto,M. Fukata, and M.-m. Poo, “Differential activity-dependent secretion of brain-derived neurotrophic factor from axon and dendrite,” Journal of Neuroscience,vol. 29, no. 45, pp. 14185–14198, 2009.
[218] H. J. Song, C. F. Stevens, and F. H. Gage, “Neural stem cells from adult hip-pocampus develop essential properties of functional cns neurons,” Nature Neuro-science, vol. 5, no. 5, pp. 438–445, 2002.
[219] X.-J. Li, X. Zhang, M. A. Johnson, Z.-B. Wang, T. LaVaute, and S.-C. Zhang,“Coordination of sonic hedgehog and wnt signaling determines ventral and dor-sal telencephalic neuron types from human embryonic stem cells,” Development,vol. 136, no. 23, pp. 4055–4063, 2009.
[220] N.-E. Szabo, T. Zhao, X. Zhou, and G. Alvarez-Bolado, “The role of sonic hedge-hog of neural origin in thalamic differentiation in the mouse,” Journal of Neuro-science, vol. 29, no. 8, pp. 2453–2466, 2009.
[221] M. Warashina, K. H. Min, T. Kuwabara, A. Huynh, F. H. Gage, P. G. Schultz,and S. Ding, “A synthetic small molecule that induces neuronal differentiationof adult hippocampal neural progenitor cells,” Angewandte Chemie-InternationalEdition, vol. 45, no. 4, pp. 591–593, 2006.
[222] A. Banerjee, M. Arha, S. Choudhary, R. S. Ashton, S. R. Bhatia, D. V. Schaffer,and R. S. Kane, “The influence of hydrogel modulus on the proliferation anddifferentiation of encapsulated neural stem cells,” Biomaterials, vol. 30, no. 27,pp. 4695–4699, 2009.
[223] N. D. Leipzig and M. S. Shoichet, “The effect of substrate stiffness on adult neuralstem cell behavior,” Biomaterials, vol. 30, no. 36, pp. 6867–6878, 2009.
[224] A. K. Magnusson, P. Linderholm, C. Vieider, M. Ulfendahl, and A. Erlandsson,“Surface protein patterns govern morphology, proliferation, and expression ofcellular markers but have no effect on physiological properties of cortical precursorcells,” Journal of Neuroscience Research, vol. 86, no. 11, pp. 2363–2375, 2008.

194
[225] M. M. Harper, E.-A. Ye, C. C. Blong, M. L. Jacobson, and D. S. Sakaguchi,“Integrins contribute to initial morphological development and process outgrowthin rat adult hippocampal progenitor cells,” Journal of Molecular Neuroscience,vol. 40, no. 3, pp. 269–283, 2010.
[226] S. Y. Park, S. Y. Park, S. Namgung, B. Kim, J. Im, Y. Kim, K. Sun, K. B. Lee,J.-M. Nam, Y. Park, and S. Hong, “Carbon nanotube monolayer patterns fordirected growth of mesenchymal stem cells,” Advanced Materials, vol. 19, no. 18,pp. 2530–+, 2007.
[227] C. M. Nelson, R. P. Jean, J. L. Tan, W. F. Liu, N. J. Sniadecki, A. A. Spector,and C. S. Chen, “Emergent patterns of growth controlled by multicellular formand mechanics,” Proceedings of the National Academy of Sciences of the UnitedStates of America, vol. 102, no. 33, pp. 11594–11599, 2005.
[228] S. A. Ruiz and C. S. Chen, “Emergence of patterned stem cell differentiationwithin multicellular structures,” Stem Cells, vol. 26, no. 11, pp. 2921–2927, 2008.
[229] G. Forte, F. Carotenuro, F. Pagliari, S. Pagliari, P. Cossa, R. Fiaccavento, A. Ahi-uwalia, G. Vozzi, B. Vinci, A. Serafino, A. Rinaldi, E. Traversa, L. Carosella,M. Minieri, and P. Di Nardo, “Criticality of the biological and physical stim-uli array inducing resident cardiac stem cell determination,” Stem Cells, vol. 26,no. 8, pp. 2093–2103, 2008.
[230] T. P. Kraehenbuehl, P. Zammaretti, A. J. Van der Vlies, R. G. Schoenmakers,M. P. Lutolf, M. E. Jaconi, and J. A. Hubbell, “Three-dimensional extracellularmatrix-directed cardioprogenitor differentiation: Systematic modulation of a syn-thetic cell-responsive peg-hydrogel,” Biomaterials, vol. 29, no. 18, pp. 2757–2766,2008.
[231] T. P. Kraehenbuehl, L. S. Ferreira, P. Zammaretti, J. A. Hubbell, and R. Langer,“Cell-responsive hydrogel for encapsulation of vascular cells,” Biomaterials,vol. 30, no. 26, pp. 4318–4324, 2009.
[232] R. S. Taichman, “Blood and bone: two tissues whose fates are intertwined tocreate the hematopoietic stem-cell niche,” Blood, vol. 105, no. 7, pp. 2631–2639,2005.
[233] M. J. Kiel and S. J. Morrison, “Uncertainty in the niches that maintainhaematopoietic stem cells,” Nature Reviews Immunology, vol. 8, no. 4, pp. 290–301, 2008.
[234] G. B. Adams and D. T. Scadden, “The hematopoietic stem cell in its place,”Nature Immunology, vol. 7, no. 4, pp. 333–337, 2006.
[235] H. Agheli, J. Malmstrom, E. M. Larsson, M. Textor, and D. S. Sutherland, “Largearea protein nanopatterning for biological applications,” Nano Letters, vol. 6,no. 6, pp. 1165–1171, 2006.
[236] M. Nakajima, T. Ishimuro, K. Kato, I.-K. Ko, I. Hirata, Y. Arima, and H. Iwata,“Combinatorial protein display for the cell-based screening of biomaterials thatdirect neural stem cell differentiation,” Biomaterials, vol. 28, no. 6, pp. 1048–1060,2007.

195
[237] A. Ruiz, L. Buzanska, D. Gilliland, H. Rauscher, L. Sirghi, T. Sobanski, M. Zy-chowicz, L. Ceriotti, F. Bretagnol, S. Coecke, P. Colpo, and F. Ross, “Micro-stamped surfaces for the patterned growth of neural stem cells,” Biomaterials,vol. 29, no. 36, pp. 4766–4774, 2008.
[238] B. Knoell, C. Weinl, A. Nordheim, and F. Bonhoeffer, “Stripe assay to examineaxonal guidance and cell migration,” Nature Protocols, vol. 2, no. 5, pp. 1216–1224, 2007.
[239] H. M. Geller and J. W. Fawcett, “Building a bridge: Engineering spinal cordrepair,” Experimental Neurology, vol. 174, no. 2, pp. 125–136, 2002. Times Cited:129.
[240] C. Miller, S. Jeftinija, and S. Mallapragada, “Synergistic effects of physical andchemical guidance cues on neurite alignment and outgrowth on biodegradablepolymer substrates,” Tissue Engineering, vol. 8, no. 3, pp. 367–378, 2002. TimesCited: 58.
[241] Y. D. Teng, E. B. Lavik, X. L. Qu, K. I. Park, J. Ourednik, D. Zurakowski,R. Langer, and E. Y. Snyder, “Functional recovery following traumatic spinalcord injury mediated by a unique polymer scaffold seeded with neural stem cells,”Proceedings of the National Academy of Sciences of the United States of America,vol. 99, no. 5, pp. 3024–3029, 2002. Times Cited: 442.
[242] M. Abematsu, K. Tsujimura, M. Yamano, M. Saito, K. Kohno, J. Kohyama,M. Namihira, S. Komiya, and K. Nakashima, “Neurons derived from transplantedneural stem cells restore disrupted neuronal circuitry in a mouse model of spinalcord injury,” Journal of Clinical Investigation, vol. 120, no. 9, pp. 3255–3266,2010. Times Cited: 35.
[243] B. Sandner, P. Prang, F. J. Rivera, L. Aigner, A. Blesch, and N. Weidner, “Neuralstem cells for spinal cord repair,” Cell and Tissue Research, vol. 349, no. 1,pp. 349–362, 2012. Times Cited: 1.
[244] G. Kumar, C. K. Tison, K. Chatterjee, P. S. Pine, J. H. McDaniel, M. L. Salit,M. F. Young, and J. Simon, Carl G., “The determination of stem cell fate by3d scaffold structures through the control of cell shape,” Biomaterials, vol. 32,no. 35, pp. 9188–9196, 2011. Times Cited: 9.
[245] D.-H. Kim, P. P. Provenzano, C. L. Smith, and A. Levchenko, “Matrix nanoto-pography as a regulator of cell function,” Journal of Cell Biology, vol. 197, no. 3,pp. 351–360, 2012. Times Cited: 6.
[246] A. K. Geim and K. S. Novoselov, “The rise of graphene,” Nature Materials, vol. 6,no. 3, pp. 183–191, 2007. Times Cited: 6772.
[247] K. Yang, S. Zhang, G. Zhang, X. Sun, S.-T. Lee, and Z. Liu, “Graphene inmice: Ultrahigh in vivo tumor uptake and efficient photothermal therapy,” NanoLetters, vol. 10, no. 9, pp. 3318–3323, 2010. Times Cited: 180.
[248] J.-L. Li, H.-C. Bao, X.-L. Hou, L. Sun, X.-G. Wang, and M. Gu, “Grapheneoxide nanoparticles as a nonbleaching optical probe for two-photon luminescence

196
imaging and cell therapy,” Angewandte Chemie-International Edition, vol. 51,no. 8, pp. 1830–1834, 2012. Times Cited: 10.
[249] Y. Zhu, S. Murali, W. Cai, X. Li, J. W. Suk, J. R. Potts, and R. S. Ruoff,“Graphene and graphene oxide: Synthesis, properties, and applications,” Ad-vanced Materials, vol. 22, no. 35, pp. 3906–3924, 2010. Times Cited: 526.
[250] S. Some, S.-M. Ho, P. Dua, E. Hwang, Y. H. Shin, H. Yoo, J.-S. Kang, D.-K. Lee,and H. Lee, “Dual functions of highly potent graphene derivative-poly-l-lysinecomposites to inhibit bacteria and support human cells,” Acs Nano, vol. 6, no. 8,pp. 7151–7161, 2012. Times Cited: 1.
[251] G. Y. Chen, D. W. P. Pang, S. M. Hwang, H. Y. Tuan, and Y. C. Hu, “A graphene-based platform for induced pluripotent stem cells culture and differentiation,”Biomaterials, vol. 33, no. 2, pp. 418–427, 2012. Times Cited: 16.
[252] N. A. Kotov, J. O. Winter, I. P. Clements, E. Jan, B. P. Timko, S. Campidelli,S. Pathak, A. Mazzatenta, C. M. Lieber, M. Prato, R. V. Bellamkonda, G. A.Silva, N. W. S. Kam, F. Patolsky, and L. Ballerini, “Nanomaterials for neuralinterfaces,” Advanced Materials, vol. 21, no. 40, pp. 3970–4004, 2009. TimesCited: 91.
[253] K. Kang, S.-E. Choi, H. S. Jang, W. K. Cho, Y. Nam, I. S. Choi, and J. S. Lee,“In vitro developmental acceleration of hippocampal neurons on nanostructuresof self-assembled silica beads in filopodium-size ranges,” Angewandte Chemie-International Edition, vol. 51, no. 12, pp. 2855–2858, 2012. Times Cited: 0.
[254] M. T. Lam, S. Sim, X. Zhu, and S. Takayama, “The effect of continuous wavymicropatterns on silicone substrates on the alignment of skeletal muscle myoblastsand myotubes,” Biomaterials, vol. 27, no. 24, pp. 4340–4347, 2006. Times Cited:53.
[255] J. Zhang, F. Zhang, H. Yang, X. Huang, H. Liu, J. Zhang, and S. Guo, “Grapheneoxide as a matrix for enzyme immobilization,” Langmuir, vol. 26, no. 9, pp. 6083–6085, 2010. Times Cited: 57.
[256] D. F. Cooke, A. B. Goldring, I. Yamayoshi, P. Tsourkas, G. H. Recanzone,A. Tiriac, T. Pan, S. I. Simon, and L. Krubitzer, “Fabrication of an inexpensive,implantable cooling device for reversible brain deactivation in animals rangingfrom rodents to primates,” Journal of Neurophysiology, vol. 107, no. 12, pp. 3543–3558, 2012. Times Cited: 0.
[257] N. Hallfors, A. Khan, M. D. Dickey, and A. M. Taylor, “Integration of pre-alignedliquid metal electrodes for neural stimulation within a user-friendly microfluidicplatform,” Lab on a Chip, vol. 13, no. 4, pp. 522–526, 2013. Times Cited: 0.
[258] G. Eda, G. Fanchini, and M. Chhowalla, “Large-area ultrathin films of reducedgraphene oxide as a transparent and flexible electronic material,” Nature Nan-otechnology, vol. 3, no. 5, pp. 270–274, 2008. Times Cited: 960.
[259] A. Reina, X. Jia, J. Ho, D. Nezich, H. Son, V. Bulovic, M. S. Dresselhaus, andJ. Kong, “Large area, few-layer graphene films on arbitrary substrates by chemicalvapor deposition,” Nano Letters, vol. 9, no. 1, pp. 30–35, 2009. Times Cited: 1180.
197
[260] X. Li, W. Cai, J. An, S. Kim, J. Nah, D. Yang, R. Piner, A. Velamakanni,I. Jung, E. Tutuc, S. K. Banerjee, L. Colombo, and R. S. Ruoff, “Large-areasynthesis of high-quality and uniform graphene films on copper foils,” Science,vol. 324, no. 5932, pp. 1312–1314, 2009. Times Cited: 1613.
[261] G. Eda, H. Yamaguchi, D. Voiry, T. Fujita, M. Chen, and M. Chhowalla, “Pho-toluminescence from chemically exfoliated mos2,” Nano Letters, vol. 11, no. 12,pp. 5111–5116, 2011. Times Cited: 48.
[262] Y. Cui, Q. Q. Wei, H. K. Park, and C. M. Lieber, “Nanowire nanosensors forhighly sensitive and selective detection of biological and chemical species,” Sci-ence, vol. 293, no. 5533, pp. 1289–1292, 2001.
[263] F. Patolsky, G. Zheng, and C. M. Lieber, “Fabrication of silicon nanowire de-vices for ultrasensitive, label-free, real-time detection of biological and chemicalspecies,” Nature Protocols, vol. 1, no. 4, pp. 1711–1724, 2006.
[264] K. Bradley, M. Briman, A. Star, and G. Gruner, “Charge transfer from adsorbedproteins,” Nano Letters, vol. 4, no. 2, pp. 253–256, 2004.
[265] R. J. Chen, H. C. Choi, S. Bangsaruntip, E. Yenilmez, X. W. Tang, Q. Wang, Y. L.Chang, and H. J. Dai, “An investigation of the mechanisms of electronic sensingof protein adsorption on carbon nanotube devices,” Journal of the AmericanChemical Society, vol. 126, no. 5, pp. 1563–1568, 2004.
[266] A. Star, Y. Lu, K. Bradley, and G. Gruner, “Nanotube optoelectronic memorydevices,” Nano Letters, vol. 4, no. 9, pp. 1587–1591, 2004.
[267] X. Tang, S. Bansaruntip, N. Nakayama, E. Yenilmez, Y.-L. Chang, and Q. Wang,“Carbon nanotube dna sensor and sensing mechanism,” Nano Letters, vol. 6,no. 8, pp. 1632–1636, 2006.
[268] J. Lu, I. Do, L. T. Drzal, R. M. Worden, and I. Lee, “Nanometal-decoratedexfoliated graphite nanoplatelet based glucose biosensors with high sensitivityand fast response,” Acs Nano, vol. 2, no. 9, pp. 1825–1832, 2008.
[269] A. T. Woolley, C. Guillemette, C. L. Cheung, D. E. Housman, and C. M. Lieber,“Direct haplotyping of kilobase-size dna using carbon nanotube probes,” NatureBiotechnology, vol. 18, no. 7, pp. 760–763, 2000.
[270] D. Du, Z. Zou, Y. Shin, J. Wang, H. Wu, M. H. Engelhard, J. Liu, I. A. Aksay,and Y. Lin, “Sensitive immunosensor for cancer biomarker based on dual signalamplification strategy of graphene sheets and multienzyme functionalized carbonnanospheres,” Analytical Chemistry, vol. 82, no. 7, pp. 2989–2995, 2010.
[271] J. H. Jung, D. S. Cheon, F. Liu, K. B. Lee, and T. S. Seo, “A graphene oxide basedimmuno-biosensor for pathogen detection,” Angewandte Chemie-InternationalEdition, vol. 49, no. 33, pp. 5708–5711, 2010.
[272] C.-H. Lu, H.-H. Yang, C.-L. Zhu, X. Chen, and G.-N. Chen, “A graphene platformfor sensing biomolecules,” Angewandte Chemie-International Edition, vol. 48,no. 26, pp. 4785–4787, 2009.

198
[273] C. Shan, H. Yang, J. Song, D. Han, A. Ivaska, and L. Niu, “Direct electrochem-istry of glucose oxidase and biosensing for glucose based on graphene,” AnalyticalChemistry, vol. 81, no. 6, pp. 2378–2382, 2009.
[274] P. Avouris, “Graphene: Electronic and photonic properties and devices,” NanoLetters, vol. 10, no. 11, pp. 4285–4294, 2010.
[275] K. S. Kim, Y. Zhao, H. Jang, S. Y. Lee, J. M. Kim, K. S. Kim, J.-H. Ahn, P. Kim,J.-Y. Choi, and B. H. Hong, “Large-scale pattern growth of graphene films forstretchable transparent electrodes,” Nature, vol. 457, no. 7230, pp. 706–710, 2009.
[276] K. S. Novoselov, A. K. Geim, S. V. Morozov, D. Jiang, M. I. Katsnelson, I. V.Grigorieva, S. V. Dubonos, and A. A. Firsov, “Two-dimensional gas of masslessdirac fermions in graphene,” Nature, vol. 438, no. 7065, pp. 197–200, 2005.
[277] Y. B. Zhang, Y. W. Tan, H. L. Stormer, and P. Kim, “Experimental observationof the quantum hall effect and berry’s phase in graphene,” Nature, vol. 438,no. 7065, pp. 201–204, 2005.
[278] L. Jiao, L. Zhang, X. Wang, G. Diankov, and H. Dai, “Narrow graphene nanorib-bons from carbon nanotubes,” Nature, vol. 458, no. 7240, pp. 877–880, 2009.
[279] X. Du, I. Skachko, A. Barker, and E. Y. Andrei, “Approaching ballistic transportin suspended graphene,” Nature Nanotechnology, vol. 3, no. 8, pp. 491–495, 2008.
[280] X. Dong, Y. Shi, W. Huang, P. Chen, and L.-J. Li, “Electrical detection of dnahybridization with single-base specificity using transistors based on cvd-growngraphene sheets,” Advanced Materials, vol. 22, no. 14, pp. 1649–+, 2010.
[281] D. A. Dikin, S. Stankovich, E. J. Zimney, R. D. Piner, G. H. B. Dommett,G. Evmenenko, S. T. Nguyen, and R. S. Ruoff, “Preparation and characterizationof graphene oxide paper,” Nature, vol. 448, no. 7152, pp. 457–460, 2007.
[282] A. Citri and Y. Yarden, “Egf-erbb signalling: towards the systems level,” NatureReviews Molecular Cell Biology, vol. 7, no. 7, pp. 505–516, 2006.
[283] N. E. Hynes and H. A. Lane, “Erbb receptors and cancer: The complexity oftargeted inhibitors,” Nature Reviews Cancer, vol. 5, no. 5, pp. 341–354, 2005.
[284] Y. Yarden and M. X. Sliwkowski, “Untangling the erbb signalling network,” Na-ture Reviews Molecular Cell Biology, vol. 2, no. 2, pp. 127–137, 2001.
[285] I. Jung, D. A. Dikin, R. D. Piner, and R. S. Ruoff, “Tunable electrical conductivityof individual graphene oxide sheets reduced at ”low” temperatures,” Nano Letters,vol. 8, no. 12, pp. 4283–4287, 2008.
[286] T. Kobayashi, N. Kimura, J. Chi, S. Hirata, and D. Hobara, “Channel-length-dependent field-effect mobility and carrier concentration of reduced graphene ox-ide thin-film transistors,” Small, vol. 6, no. 11, pp. 1210–1215, 2010.
[287] S. Myung, J. Park, H. Lee, K. S. Kim, and S. Hong, “Ambipolar memory devicesbased on reduced graphene oxide and nanoparticles,” Advanced Materials, vol. 22,no. 18, pp. 2045–+, 2010.

199
[288] S. Myung, M. Lee, G. T. Kim, J. S. Ha, and S. Hong, “Large-scale ”surface-programmed assembly” of pristine vanadium oxide nanowire-based devices,” Ad-vanced Materials, vol. 17, no. 19, pp. 2361–+, 2005.
[289] M. Lee, J. Im, B. Y. Lee, S. Myung, J. Kang, L. Huang, Y. K. Kwon, and S. Hong,“Linker-free directed assembly of high-performance integrated devices based onnanotubes and nanowires,” Nature Nanotechnology, vol. 1, no. 1, pp. 66–71, 2006.
[290] W. Yang, K. R. Ratinac, S. P. Ringer, P. Thordarson, J. J. Gooding, and F. Braet,“Carbon nanomaterials in biosensors: Should you use nanotubes or graphene?,”Angewandte Chemie-International Edition, vol. 49, no. 12, pp. 2114–2138, 2010.
[291] F. Chen, Q. Qing, J. Xia, J. Li, and N. Tao, “Electrochemical gate-controlledcharge transport in graphene in ionic liquid and aqueous solution,” Journal of theAmerican Chemical Society, vol. 131, no. 29, pp. 9908–+, 2009.
[292] A. Star, J. C. P. Gabriel, K. Bradley, and G. Gruner, “Electronic detection ofspecific protein binding using nanotube fet devices,” Nano Letters, vol. 3, no. 4,pp. 459–463, 2003.
[293] M. Abe, K. Murata, A. Kojima, Y. Ifuku, M. Shimizu, T. Ataka, and K. Mat-sumoto, “Quantitative detection of protein using a top-gate carbon nanotube fieldeffect transistor,” Journal of Physical Chemistry C, vol. 111, no. 24, pp. 8667–8670, 2007.
[294] B. L. Allen, P. D. Kichambare, and A. Star, “Carbon nanotube field-effect-transistor-based biosensors,” Advanced Materials, vol. 19, no. 11, pp. 1439–1451,2007.
[295] M. Y. Han, B. Oezyilmaz, Y. Zhang, and P. Kim, “Energy band-gap engineeringof graphene nanoribbons,” Physical Review Letters, vol. 98, no. 20, 2007.
[296] J. B. Oostinga, H. B. Heersche, X. Liu, A. F. Morpurgo, and L. M. K. Van-dersypen, “Gate-induced insulating state in bilayer graphene devices,” NatureMaterials, vol. 7, no. 2, pp. 151–157, 2008. Times Cited: 518.
[297] K. I. Bolotin, K. J. Sikes, Z. Jiang, M. Klima, G. Fudenberg, J. Hone, P. Kim,and H. L. Stormer, “Ultrahigh electron mobility in suspended graphene,” SolidState Communications, vol. 146, no. 9-10, pp. 351–355, 2008.
[298] Y.-M. Lin and P. Avouris, “Strong suppression of electrical noise in bilayergraphene nanodevices,” Nano Letters, vol. 8, no. 8, pp. 2119–2125, 2008.
[299] M. Ganzhorn, A. Vijayaraghavan, S. Dehm, F. Hennrich, A. A. Green, M. Ficht-ner, A. Voigt, M. Rapp, H. von Loehneysen, M. C. Hersam, M. M. Kappes,and R. Krupke, “Hydrogen sensing with diameter- and chirality-sorted carbonnanotubes,” Acs Nano, vol. 5, no. 3, pp. 1670–1676, 2011.
[300] M. R. Diehl, D. W. Steuerman, H. R. Tseng, S. A. Vignon, A. Star, P. C. Celestre,J. F. Stoddart, and J. R. Heath, “Single-walled carbon nanotube based molecularswitch tunnel junctions,” Chemphyschem, vol. 4, no. 12, pp. 1335–1339, 2003.
200
[301] B. Li, X. Cao, H. G. Ong, J. W. Cheah, X. Zhou, Z. Yin, H. Li, J. Wang, F. Boey,W. Huang, and H. Zhang, “All-carbon electronic devices fabricated by directlygrown single-walled carbon nanotubes on reduced graphene oxide electrodes,”Advanced Materials, vol. 22, no. 28, pp. 3058–3061, 2010.
[302] X. Kang, J. Wang, H. Wu, I. A. Aksay, J. Liu, and Y. Lin, “Glucose oxidase-graphene-chitosan modified electrode for direct electrochemistry and glucose sens-ing,” Biosensors & Bioelectronics, vol. 25, no. 4, pp. 901–905, 2009.
[303] S. Alwarappan, C. Liu, A. Kumar, and C.-Z. Li, “Enzyme-doped graphenenanosheets for enhanced glucose biosensing,” Journal of Physical Chemistry C,vol. 114, no. 30, pp. 12920–12924, 2010.
[304] C. Hjalmarsson, J. Stenflo, and A. Borgstrom, “Activated protein c-protein cinhibitor complex, activation peptide of carboxypeptidase b and c-reactive proteinas predictors of severe acute pancreatitis,” Pancreatology, vol. 9, no. 5, pp. 700–707, 2009.
[305] S. Myung, P. T. Yin, C. Kim, J. Park, A. Solanki, P. I. Reyes, Y. Lu, K. S. Kim,and K.-B. Lee, “Label-free polypeptide-based enzyme detection using a graphene-nanoparticle hybrid sensor,” Advanced Materials, vol. 24, no. 45, pp. 6081–+,2012. Times Cited: 1.
[306] D. B. Farmer, R. Golizadeh-Mojarad, V. Perebeinos, Y.-M. Lin, G. S. Tulevski,J. C. Tsang, and P. Avouris, “Chemical doping and electron-hole conductionasymmetry in graphene devices,” Nano Letters, vol. 9, no. 1, pp. 388–392, 2009.
[307] L. Bajzar, J. Morser, and M. Nesheim, “Tafi, or plasma procarboxypepti-dase b, couples the coagulation and fibrinolytic cascades through the thrombin-thrombomodulin complex,” Journal of Biological Chemistry, vol. 271, no. 28,pp. 16603–16608, 1996.
[308] C. S. Consorti, A. P. Umpierre, R. F. de Souza, J. Dupont, and P. A. Z. Suarez,“Selective hydrogenation of 1,3-butadiene by transition metal compounds immo-bilized in 1-butyl-3-methyl imidazolium room temperature ionic liquids,” Journalof the Brazilian Chemical Society, vol. 14, no. 3, pp. 401–405, 2003. Times Cited:15.
[309] P. Bergveld, “Thirty years of isfetology - what happened in the past 30 yearsand what may happen in the next 30 years,” Sensors and Actuators B-Chemical,vol. 88, no. 1, pp. 1–20, 2003. 9th IMCS Meeting 2002 Boston, massachusettsImcs.
[310] P. Gimmel, K. D. Schierbaum, W. Gopel, H. H. Vandenvlekkert, and N. F.Derooij, “Microstructured solid-state ion-sensitive membranes by thermal-oxidation of ta,” Sensors and Actuators B-Chemical, vol. 1, no. 1-6, pp. 345–349,1990. 5th international conf on solid-state sensors and actuators and eurosensors3 ( transducers 89 ) Jun 25-30, 1989 Montreux, switzerland.
[311] P. Estrela, A. G. Stewart, F. Yan, and P. Migliorato, “Field effect detection ofbiomolecular interactions,” Electrochimica Acta, vol. 50, no. 25-26, pp. 4995–5000,

201
2005. 55th Annual Meeting of the International-Society-of-Electrochemistry Sep,2004 Thessaloniki, GREECE Int Soc Electrochem.
[312] J. Yu, S. K. Jha, L. Xiao, Q. Liu, P. Wang, C. Surya, and M. Yang, “Algan/ganheterostructures for non-invasive cell electrophysiological measurements,” Biosen-sors & Bioelectronics, vol. 23, no. 4, pp. 513–519, 2007.
[313] J. T. Mabeck and G. G. Malliaras, “Chemical and biological sensors based onorganic thin-film transistors,” Analytical and Bioanalytical Chemistry, vol. 384,no. 2, pp. 343–353, 2006.
[314] L. Torsi, A. Dodabalapur, L. Sabbatini, and P. G. Zambonin, “Multi-parametergas sensors based on organic thin-film-transistors,” Sensors and Actuators B-Chemical, vol. 67, no. 3, pp. 312–316, 2000.
[315] J. Liu, M. Agarwal, and K. Varahramyan, “Glucose sensor based on organicthin film transistor using glucose oxidase and conducting polymer,” Sensors andActuators B-Chemical, vol. 135, no. 1, pp. 195–199, 2008.
[316] Q. Zhang and V. Subramanian, “Dna hybridization detection with organic thinfilm transistors: Toward fast and disposable dna microarray chips,” Biosensors& Bioelectronics, vol. 22, no. 12, pp. 3182–3187, 2007.
[317] K. S. Chang, C. C. Chen, J. T. Sheu, and Y.-K. Li, “Detection of an unchargedsteroid with a silicon nanowire field-effect transistor,” Sensors and Actuators B-Chemical, vol. 138, no. 1, pp. 148–153, 2009.
[318] Y.-M. Chu, C.-C. Lin, H.-C. Chang, C. Li, and C. Guo, “Tio(2) nanowire fetdevice: Encapsulation of biomolecules by electro polymerized pyrrole propylicacid,” Biosensors & Bioelectronics, vol. 26, no. 5, pp. 2334–2340, 2011.
[319] S. M. Al-Hilli, R. T. Al-Mofarji, and M. Willander, “Zinc oxide nanorod forintracellular ph sensing,” Applied Physics Letters, vol. 89, no. 17, 2006.
[320] A. Wei, X. W. Sun, J. X. Wang, Y. Lei, X. P. Cai, C. M. Li, Z. L. Dong, andW. Huang, “Enzymatic glucose biosensor based on zno nanorod array grown byhydrothermal decomposition,” Applied Physics Letters, vol. 89, no. 12, 2006.
[321] P. I. Reyes, Z. Zhang, H. Chen, Z. Duan, J. Zhong, G. Saraf, Y. Lu, O. Taratula,E. Galoppini, and N. N. Boustany, “A zno nanostructure-based quartz crystalmicrobalance device for biochemical sensing,” Ieee Sensors Journal, vol. 9, no. 10,pp. 1302–1307, 2009.
[322] R. Murali, P. J. Brennan, T. KieberEmmons, and M. I. Greene, “Structuralanalysis of p185(c-neu) and epidermal growth factor receptor tyrosine kinases:Oligomerization of kinase domains,” Proceedings of the National Academy of Sci-ences of the United States of America, vol. 93, no. 13, pp. 6252–6257, 1996.
[323] P. I. Reyes, C.-J. Ku, Z. Duan, Y. Lu, A. Solanki, and K.-B. Lee, “Zno thin filmtransistor immunosensor with high sensitivity and selectivity,” Applied PhysicsLetters, vol. 98, no. 17, 2011. Times Cited: 5.


